The IEC 61000-4-30 Class A standard defines the measurement methods, time aggregation, accuracy, and evaluation, for each power quality parameter to obtain reliable, repeatable and comparable results between various brands and models of PQ instruments and systems.
IEC 61000-3-30 Class A Edition 2
IEC 6100-4-30 Class A Edition 2 standardizes the measurements of:
Power frequency
Supply voltage magnitude
Flicker (by reference to IEC 61000-4-15)
Voltage dips/sags and swells
Voltage interruptions
Supply voltage unbalance
Voltage harmonics, and interharmonics (referenced to IEC 61000-4-7)
Mains signaling voltage
Rapid voltage changes
Magnitude of current
Current harmonics and interharmonics (referenced to IEC 61000-4-7)
Current unbalance
IEC 61000-4-30 Edition 3 Introduced new measurements definitions and PQ parameters.
“This third edition cancels and replaces the second edition published in 2008. This edition constitutes a technical revision”.
Rapid voltage changes
Flicker class F1
Magnitude of the current
Current unbalance
Current harmonics (by reference to IEC 61000-4-7)
Current interharmonics (by reference to IEC 61000-4-7)
Additional changes in harmonic parameters from IEEE 519 2014
The number of harmonics to be evaluated. In many application, 50 harmonics are not enough and modern DC to AC inverters used in Wind and Solar generation have significate harmonic component up to the 100th.
Recording resolution – the latest edition of the IEEE 519 requires a daily and weekly harmonic evaluation of both voltage and current at 150/180 cycles (~3sec) resolution per phase. An edition 3 compliant instrument must record this data and prepare a report from the instrument.
Why these revised standards are important to electric utilities?
1. Rapid Voltage Change (RVC) parameter captures voltage changes (sags) that can be disruptive to some loads without exceeding the standard of +/- 5% voltage change limit. An instrument that does not make RVC measurements will miss these events. So a utility may receive customer complaints (most common is light flickers) and not have any data to find the source of the complaint. (most common is large motor starts or other sudden load or distributed generation switching. (tripping)
2. The Edition 3 revision transfers the responsibility for measurement methods continue in this standard, but responsibility for influence quantities, performance, and test procedures are transferred to IEC 62586 -1 and -2.
Part 1, namely IEC 62586-1, was constructed to define a comprehensive PQ device product standard, coined within as PQIs. The standard outlines safety, electromagnetic compatibility (EMC), climatic, and mechanical requirements, and refers to IEC 62586-2 for functional aspects. These requirements serve to ensure the instrument’s robustness will be suitable for its installation within the severe environments of a power station or substation.
Part 2, IEC 62586-24, defines the functional tests cited in the first part of the series. These tests are intended to comprehensively verify the PQ measurement methods outlined in 4-30. This chapter was established to provide traceable and repeatable procedures to verify the compliance of each PQ metric outlined in 4-30. This firstly addresses the main shortcoming of 4-30 and ensures better method adherence between PQ meter manufacturers. Additionally, the standard allows regulatory laboratories adhering to ISO/IEC 170255 to issue conformance reports and certificates according to IEC 62586-1 or IEC 62586-2 (with compliance to IEC 62586-2 meaning compliance to IEC 61000-4-30). The latter provides PQ meter manufacturers a way to provide internationally recognized compliance for the entire scope of PQI requirements.
3. To help ensure accurate PQ metrics in the harsh installation environment of a power station or substation, a number of electromagnetic compatibility (EMC) and influence quantity tests were also added to the scope of the IEC 62586 series.
“IEC 62586-2:2013 specifies functional tests and uncertainty requirements for instruments whose functions include measuring, recording, and possibly monitoring power quality parameters in power supply systems, and whose measuring methods (class A or class S) are defined in IEC 61000-4-30. This standard applies to power quality instruments complying with IEC 62586-1. This standard may also be referred to by other product standards (e.g. digital fault recorders, revenue meters, MV or HV protection relays) specifying devices embedding class A or class S power quality functions according to IEC 61000-4-30. These requirements are applicable in single, dual- (split phase) and 3-phase a.c. power supply systems at 50 Hz or 60 Hz.”
4. Environmental impact on the instrument from a laboratory environment. (25 Degrees C to a substation environment 40 Degrees C + ) is now part of the requirement of this standard. Detailed measurement procedures for Harmonics including to the 100th are included. Reporting of the harmonics to IEEE 519-2014 with harmonic limits specified for 1 and 1 week are included.
5. Detailed measurement procedures for Harmonics including to the 100th are included.
6. Reporting of the harmonics to IEEE 519-2014 with harmonic limits specified for 1 and 1 week are included.
All of these issues can be defined as IEC 61000-4-30 Class A, Edition 3 compliant.
Published by Dranetz Technologies, Inc. Website: Dranetz.com
For controlled environment agriculture (CEA) operations, temperature, humidity, airflow, lighting, and CO₂ must stay within narrow limits 24/7 to foster growing conditions for high-value crops.
When power quality deteriorates, environmental systems can go off-spec, putting these crops at risk. When HVAC and VFDs began failing unexpectedly, New Jersey CEA facility operators took a closer look at what was happening with power operations.
This article highlights key lessons from a recent Application Note that documents how permanent power quality monitoring helped the facility move from uncertainty to confidence. At the end, you can download the full case study to get the whole story.
Why power quality matters in controlled environment agriculture
Power monitoring is important for controlled environment agriculture CEA facilities are high density industrial spaces and not traditional greenhouses. A typical site may include high-wattage LED lighting, year-round HVAC and dehumidification, variable frequency drives, and centralized control systems running nonstop.
.
This level of electrical demand leaves little tolerance for disturbance. Some CEA facilities consume many times the energy per square foot of a typical commercial building. When power fluctuates, a high value crop can be compromised before alarms ever sound.
The challenge at the NJ facility
The featured New Jersey CEA spans 58,000 square feet and operates on a 480 V, 8000 A service split into two feeds. Daily energy use approaches 16,000 kWh.
Over time, unexplained HVAC and VFD failures began disrupting operations. These events were not tied to obvious outages or equipment defects. Environmental conditions declined, forcing growers to discard product.
Without an understanding of actual power conditions, the operations team could not confidently determine whether issues originated from the utility or from within the facility.
Gaining insights with permanent monitoring
The facility installed a Camille Bauer PQ5000 permanent power quality and energy meter at the service entrance, integrated with a Dranetz master monitoring station.
This setup continuously tracks voltage behavior, harmonics, RMS events, and energy patterns. Within weeks, the team established a reliable baseline and confirmed that routine load startups were not causing the failures. More importantly, they gained the ability to spot deviations before they escalated.
From reactive to prepared
Permanent power monitoring enabled facility operators to be proactive. Rather than reacting to failures they were now able to understand system health. The team is now better equipped to explain events, engage with the utility when needed, and plan future expansions with confidence.
Power quality issues may be invisible, but their consequences are not. For CEA operations, reliable power monitoring is part of protecting yield and long-term performance.
Published by Saheed Lekan GBADAMOSI1,2, Nnamdi I. NWULU1, Center for Cyber Physical Food, Energy and Water Systems, University of Johannesburg, Auckland Park 2006, South Africa (1), Department of Electrical and Electronic Engineering, Bowen University Iwo, Osun State, Nigeria (2) ORCID: 0000-0001-7398-813
Abstract. This study examines the use of Ethereum-based smart contracts to facilitate peer-to-peer energy trading in decentralized marketplaces. Energy traders submit bids and offers to smart contracts, which oversee the transaction process. Additionally, another smart contract helps energy merchants source energy from prosumers to meet their supply obligations. This research validates the efficiency of smart contracts in managing transactions within decentralized energy sources using a real-world electricity market scenario.
Streszczenie. W tym badaniu zbadano zastosowanie inteligentnych kontraktów opartych na Ethereum w celu ułatwienia handlu energią typu peerto-peer na zdecentralizowanych rynkach. Handlowcy energią składają oferty i oferty do inteligentnych kontraktów, które nadzorują proces transakcyjny. Dodatkowo kolejna inteligentna umowa pomaga sprzedawcom energii pozyskiwać energię od prosumentów w celu wywiązania się z obowiązków w zakresie dostaw. Badanie to potwierdza skuteczność inteligentnych kontraktów w zarządzaniu transakcjami w ramach zdecentralizowanych źródeł energii z wykorzystaniem rzeczywistego scenariusza rynku energii elektrycznej. (Symulowany handel energią typu peer-to-peer z obsługą blockchain na rynku)
Keywords: Blockchain, decentralized, peer-to-peer energy trading, electricity marketplace Słowa kluczowe: Blockchain, zdecentralizowany handel energią typu peer-to-peer, rynek energii elektrycznej
Introduction
More than 80% of the world’s electricity has traditionally been generated from carbon fuels, which, until recently, served as the primary method of producing energy [1]. Nonetheless, these non-renewable sources have inflicted considerable harm on the environment, compelling the integration of renewable energies into conventional energy systems. The adoption of renewable energy sources is significantly impacting the energy trade within the sector [2]- [8]. Conventional centralized systems are typically employed for power transactions, but this approach comes with drawbacks such as costly transactions, inefficient administration, as well as the risks of hacking, censorship, and privacy concerns [9]-[11][5]. Peer-to-peer (P2P) energy trading, an emerging energy management technology, has evolved to empower prosumers in sharing their surplus electricity. This innovative approach not only enables the exchange of energy among peers but also transforms how consumers harness their energy resources [11][12]. Furthermore, it unlocks fresh opportunities within power system markets. P2P electricity markets hold the potential to grant users the freedom to select their preferred source of electric energy, including investments in locally generated renewable sources [2][13]. By utilizing P2P energy trading techniques, consumers have the flexibility to function as either buyers or sellers independently of the main grid. Furthermore, P2P energy trading offers participants the advantage of procuring electricity from the open market at a lower cost compared to traditional utility charges, thus promoting broader access to clean energy [14]. This is particularly beneficial for participants who may not have the means to generate their own electricity. However, it’s worth noting that some of the existing P2P energy trading systems rely on centralized, conventional technology, which carries the potential risk of compromising data privacy and exhibiting less-than-ideal transactional behavior [15][16]. To address these concerns, the adoption of blockchain technology is being explored as a means to implement open and secure P2P transactions.
There is a widespread belief that blockchain technology has the ability to usher in the next digital revolution, with effects that could rival those of the Internet. It has the capacity to decentralize power within systems, affording every participant an equal opportunity, sometimes without the need for centralized control of information. This fosters transparency by making information accessible to all. In recent years, the adoption of blockchain technology has surged across virtually all industries, with a notable emphasis on its application in the energy sector. By harnessing blockchain technology, the traditionally centralized energy market, often controlled by a handful of major corporations, has the potential to evolve into a more democratic, decentralized landscape driven by microgrids [17][18]. P2P energy trading facilitated by blockchain empowers prosumers to directly sell their surplus electricity to neighbouring customers, eliminating intermediaries and fostering profitable transactions [19][20]. This approach allows customers to access electricity at a reduced perkilowatt-hour (kWh) cost and show their preference for renewable energy, all without necessarily investing in the system themselves. Simultaneously, prosumers can benefit by generating higher earnings compared to conventional feed-in tariffs. In a dynamic market that offers advantages to both prosumers and consumers, auctions for renewable energy can serve an additional purpose of storing untraded electricity through battery storage systems [21]. This more cost-effective infrastructure enhances market efficiency, benefiting network providers and electricity retailers. Blockchain-based systems further enhance security and anonymity for both prosumers and consumers, eliminating the necessity for intermediary amongst the markets [22]. The execution of smart contracts facilitates energy trading, enabling real-time matching of energy supply and demand among agents with complementary energy demand profiles.
With an increasing number of industries embracing blockchain technology and adapting their business models, the potential of blockchain in P2P energy market has garnered significant attention. The blockchain revolution is paving the way for the anticipation of a smart grid, fostering accelerated innovation. However, it’s essential to acknowledge that the system is currently in the proof-ofconcept and assumption stages, making it challenging to fully exploit its potential in P2P energy trading at this juncture [23][24]. Ongoing discussions persist regarding the performance, scalability, and interoperability challenges associated with blockchain technology. Implementing blockchain on a large scale remains complex due to the inability of separate blockchain networks to seamlessly link and communicate with each other, potentially leading to interoperability issues [25]. These challenges have the potential to hinder the scalability of blockchain technology. Therefore, the objective of this study is to establish a model for a peer-to-peer energy trading marketplace, leveraging blockchain technology to ensure trust, anonymity, transparency, and auditability in interactions between energy prosumers and consumers. The main contribution of this paper is as follows:
• develop a system module that empowers prosumers to generate energy offers along with pricing details.
• develop a system module that allows users to transfer tokens to the primary smart contract and initiate energy requests.
• employ the primary smart address to be able to transfer tokens to the various prosumers after the transferred energy has been verified.
• assess the module’s overall performance across various scenarios
The remains of this paper consist of the following: literature review detailing the blockchain and smart contract concepts is introduced in Section 2. Section 3 outlined the proposed trading mechanism adopted for smart contracts. The implementation of the smart contract using different scenarios is illustrated in Section 4. The simulated results obtained are discussed in Section 5 and the paper is formally concluded in Section 6.
Literature Review
Both the academic and business communities are increasingly focusing on peer-to-peer energy trading. We commence by conducting an in-depth examination of prior scholarly research in this domain, alongside ongoing blockchain-based energy marketplace initiatives. Subsequently, we delve into research related to the Hyperledger Fabric and Ethereum blockchains. In reference [26], prosumers within the market are depicted as part of a generalized aggregative game. Additionally, the author proposes a distributed market-clearing mechanism that leverages a generalized Nash equilibrium to guarantee convergence towards a strategically stable and economically advantageous system. Reference [27] offers a comprehensive and in-depth analysis of the design, challenges, and potential of the peer-to-peer market. Reference [28] investigates the potential advantages of integrating game and auction theoretical models within peer-to-peer (P2P) energy trading contexts. Reference [29] introduces a demand-side management strategy aimed at reducing the peak-to-average ratio. This strategy employs blockchain technology to ensure the confidentiality of trading profiles. Reference [30] presents an energy sharing architecture managed by a central energy sharing agent, which does not incorporate bidding capabilities. Based on prosumers’ local photovoltaic (PV) generation capacity, the agent makes decisions to either purchase or sell energy from them. In Reference [31] suggest a Stackelberg game strategy utilizing a consortium blockchain to eliminate the need for trusted intermediaries in credit-based peer-to-peer (P2P) energy trading systems. Reference [32] encompasses a literature review and an exploration of business case studies related to blockchain solutions within the energy sector. This study identified various technological challenges associated with such solutions. Another review study centered on the challenges encountered by peer-to-peer (P2P) microgrids relying on blockchain technology. In [33], a comprehensive description of blockchain technology is provided within the context of various energy trading scenarios. These scenarios encompass business-to-business, non-profit support, and peer-to-peer trading. Reference [34] features a concise analysis of blockchain and distributed ledger technology. This study involved internal workshops and a series of interviews aimed at identifying potential opportunities and challenges in this field. The peer-to-peer (P2P) market detailed in Reference [35], operates under the control of a central agent. This agent possesses access to all local resources and assumes responsibility for determining the supply, demand, and pricing. In [36], the inquiry grid is divided into microgrids to facilitate multi-level trading. At the inter-microgrid trade level, any surplus or deficit in energy resulting from intra-microgrid transactions is then traded.
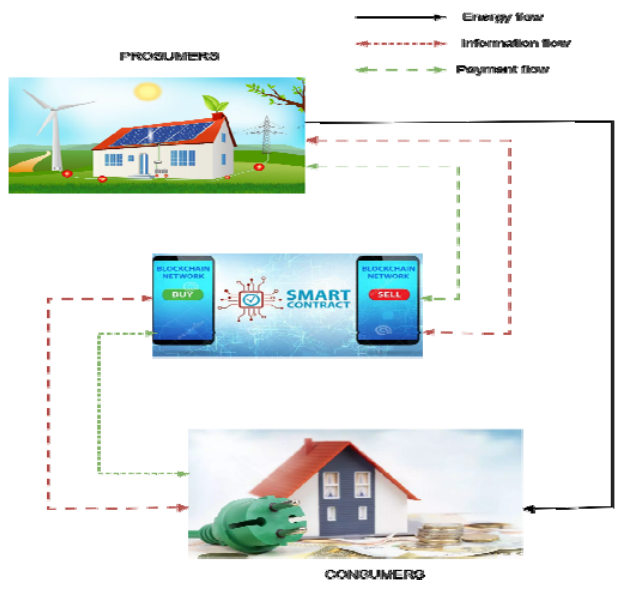
This study presents an innovative smart contractpowered framework in which network participants contribute spinning energy to address energy deficits resulting from providers failing to meet their commitments. Smart contracts are deployed for P2P energy trading system, which utilizes the computerized transaction protocol called blockchain technology, it serves as a mechanism for establishing agreements. The contract terms as an integral part of the transactions are automatically carried by this protocol. This is used as an auction mechanism designed to connect the sellers with buyers. Fig.1 presents smart contract mechanism for energy trading in marketplace. The contract gathers bids and offers from both buyers and sellers and employs an auction system to pair them. Buyers submit bids along with their corresponding funds, while sellers exclusively present proposals to the contract. The smart contract acts as a custodian for the funds and compensates sellers for the energy they deliver, thereby enforcing fairness amongst the participants. The foundational rule for smart contracts was initially introduced in [37] by authors who amalgamated game theory principles with an automated demand response model. In Reference [38] smart contracts are employed to facilitate data sharing between consumers and prosumers, while also enabling each market participant to independently handle their bill payments. In reference [39], a privacy-preserving module is proposed for constructing smart contracts designed for energy trading. This module effectively safeguards against privacy breaches in the context of nearby energy transactions. In Ref. [40], an innovative distributed double auction mechanism is employed for electricity trading within a peer-to-peer market. This process seamlessly integrates peer-to-peer communication, payment transactions, and information exchange through the utilization of smart contracts. Ref. [41] generates smart contract by the grid operator for individual users, enabling them to manage both payments and energy consumption effectively.
Trading mechanisms proposed for smart contracts.
This section outlines the process undertaken to create an energy trading model among different participants using a smart contract deployed on an Ethereum-based Integrated Development Environment (IDE). Additionally, a function-based algorithm is included to guide the step-by-step development of the smart contract. Within the Remix IDE, mock Ethereum wallet accounts are generated for users. One significant advantage of these environments is that the initiator receives simulated tokens, enabling them to conduct blockchain-related development tasks such as testing and deploying smart contracts. The Remix IDE is a robust open-source tool that allows users to write Solidity contracts directly within a web browser. It is written in JavaScript and can be utilized both online and locally on a desktop. This comprehensive IDE encompasses essential features such as smart contract testing, debugging, and deployment capabilities.
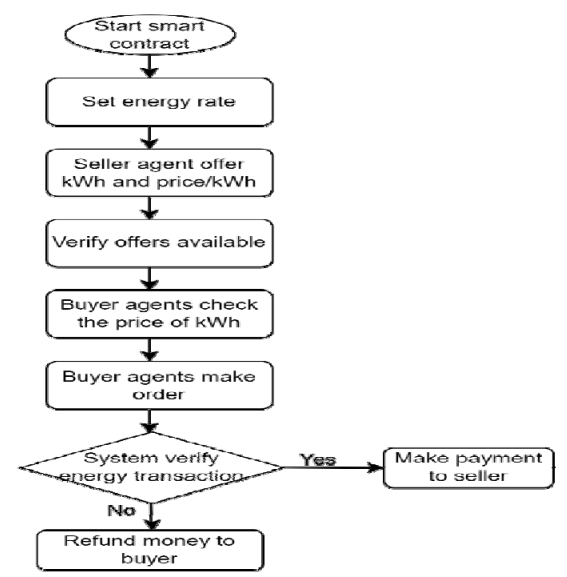
Smart contracts are pivotal in the realm of blockchain, particularly in the context of energy sector. To facilitate electricity trading through blockchain, it is imperative to design integrated transactions and short-term balancing contracts using smart contracts. These contracts serve as the foundation for secure and transparent energy trading. Transaction data is encrypted within these contracts, while cash flows are transacted using the cryptocurrency, Ether. The evolving smart contract comprises functions with varying levels of access for participants. Fig. 2 depicts the flowchart illustrating the algorithm for the smart contract. The functions comprising the smart contract are detailed in Algorithm 1. Key functions were restricted to access only by the administrator’s account address, whereas other functions were freely accessible to others. The summary of the flowchart is given below:
• Function 1 is exclusively invoked during the contract deployment process. Its primary purpose is to assign the contract deployer’s account address to a variable. This stored variable is subsequently employed to regulate access permissions for specific functions on the blockchain.
• Function 2 is executed exclusively by the contract deployer. Its goal is to figure out how much one ether is worth in dollars.
• Function 3 is invoked by the sellers to submit their energy offers in kilowatt-hours (kWh) along with the corresponding price for each unit in US dollars per kWh.
• Function 4 is used to validate the sellers’ offers, and the data is organized and stored in ascending order based on the cost.
• Function 5 is accessed by the buyers to review the cost of the energy they intend to purchase, specified in US dollars per kWh.
• Function 6 is utilized by the buyers to place an order and initiate payment directly to the contract.
• Function 7 is invoked by the administrator to process payments to the buyers once the energy transfer has been confirmed
Fig.1. Smart contract mechanism for energy trading in marketplace
Algorithm
Function 1: constructor // Runs during contract deployment and stores the deployer’s address in a variable called “admin.” Function 2: setRate input: price of Ether in USD require: function deployer = admin rate = Ether value Function 3: offers input: Seller’s energy in kWh; Energy price in USD. Store in ‘Seller’ mapping Function 4: verifiedOffers input: account address of Sellers; Sellers’ energy quantity; Sellers’ Price of Energy require: Seller’s Energy Quantity and Energy Price in match, for all user addresses. occupy a new mapping ‘vSellers’ with the newly ordered user addresses delete data from ‘Seller’ mapping. Function 5: checkMarketPrice require: The price of energy needed by Buyers in ether input: Buyers bid in kWh; Function 6: makeMarketOrder Input: Value of ether of Buyers’ needed energy Function 7: payMarketOrder require: function deployer = admin for each Seller in array pay Seller end for
Fig.2. Flowchart outlining the smart contract algorithm
Smart contract implementation
Inspired by the research conducted by Debin Fang in 2012, this study focuses on energy prosumers willing to share their surplus energy with fellow residents in a smart community. We explore two scenarios:
• Scenario 2: Consumers’ demand exceeds the available supply.
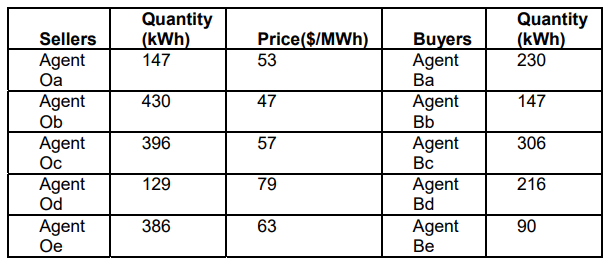
For both Scenario 1 and Scenario 2, we consider five groups of prosumers and five consumers. The offers and bids are generated randomly, with quantities ranging from 50 to 500 kilowatt-hours (kWh) and prices falling within the USD 40 to USD 90 range. Tables 1 and 2 present the information on the offers and bids for sellers (prosumers) and buyers (consumers) with regards to quantity and price. The data provided above serves as a comprehensive dataset for assessing the smart contract’s logic and checking the accuracy of refunds and reimbursements made to the parties concerned.
Table 1. Information on offer/bid for Prosumers and Consumers (Scenario 1)
.
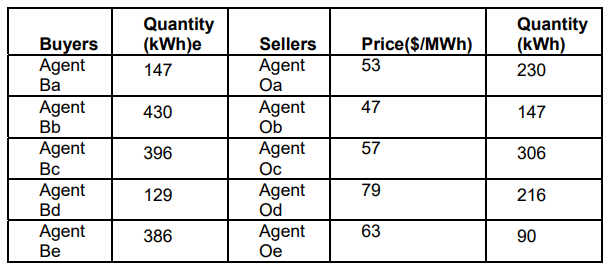
Table 2. Information on offer/bid for Prosumers and Consumers (Scenario 2)
.
Results and discussion
In this section, the results in respect of the implementation of smart contract for P2P electricity trading procedure based on the case studies are presented. A matching procedure between the sellers and the purchasers is established.
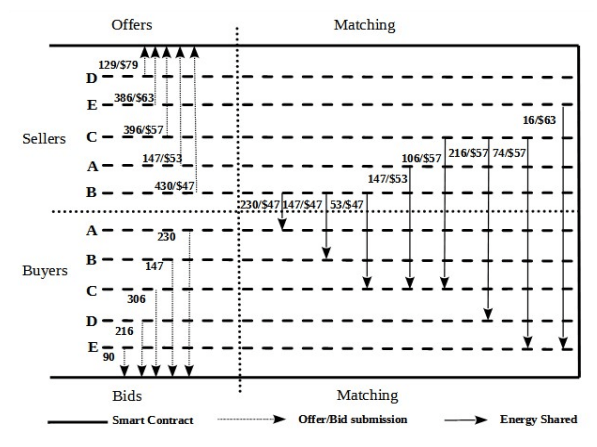
Figure 3 illustrates the submission of bids and offers by Buyer agents and Seller agents. In addition, it visualizes the procedure for matching within the smart contract. Both buyer agents and seller agents submit the information for their bids and offers to the contract. Once authenticated, the bids are organized in ascending order based on their cost.
The resulting ordered lists are as follows: Seller agents – D, E, C, A and B; Buyer agents – A, B, C, D, and E. Subsequently, the matching of Seller agents and Buyer agents commences. This matching process initiates at the top of the sorted lists, with Seller agent B offering 230 units of their energy at their specified price to Buyer agent A. The matching process continues until all the buyers’ bids are fulfilled, concluding when Seller agent E is matched with Buyer agent E. As observed in Figure 3, the offered energies are allocated simultaneously to the bidding buyers, meaning a single Seller can distribute energy to multiple Buyers. For example, Seller agent B shares energy with Buyer agents A, B, and C.
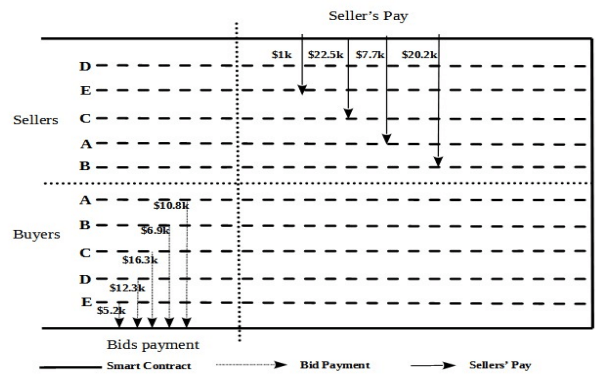
Figure 4 illustrates the flow pattern of funds among the participants in the study. Buyers transfer their funds to the smart contract when placing their bids. The smart contract can securely hold these tokens (funds) until predefined conditions are satisfied. Payments are disbursed from the smart contract to successful sellers, while buyers who are either fully or partially unsuccessful receive corresponding refunds. Notably, in this scenario, Sellers B, A, C, and D have received payments from the contract.
Fig.3. Smart Contract matching Process for Scenario
Fig.4. Smart contract payment process for scenario 1
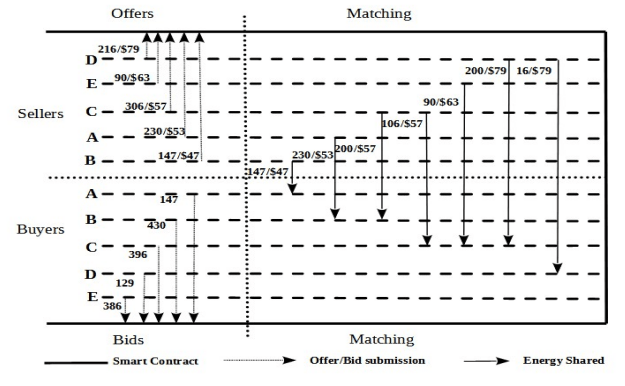
Fig.5. Smart contract matching process for scenario 2
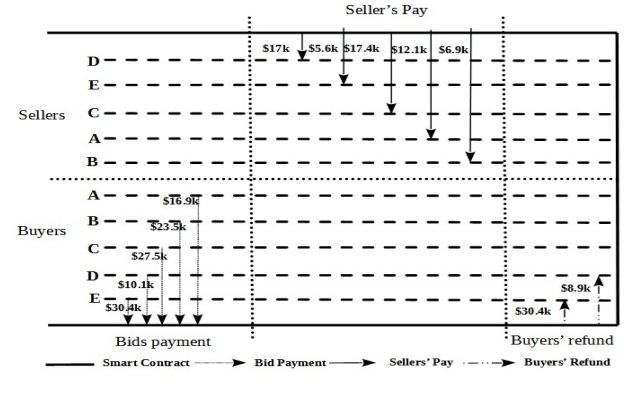
Fig.6. Smart contract payment process for scenario 2
Figure 5 simulates a scenario in which the number of bids surpasses the available offers. Much like in Figure 3, both seller agents and buyer agents submit the information of their offers and bids to the smart contract for necessary action. These offers are then sorted in ascending order based on their cost and subsequently matched with the bids. Notably, Buyer agent D received a quantity of energy less than what they had bid for, and Buyer agent E did not receive any energy at all. The offers were fully allocated during the matching process between Seller agent D and Buyer agent D. Figure 6 illustrates the transactions procedure involve made between smart contract and the participants. Notably, refunds were issued to buyers who were either partially successful or entirely unsuccessful in their bids.
Conclusion
In the realm of future smart grids, one intriguing concept involves peer-to-peer energy trading, enabling direct exchanges between energy consumers and producers within local electrical networks. This project harnesses blockchain technology to conceptualize and simulate a peer-to-peer (P2P) energy trading marketplace tailored for energy prosumers and consumers, characterized by flexible demand and storage capabilities.
This study explores two distinct scenarios involving diverse groups of sellers and buyers. It effectively demonstrates that, owing to the inherent features and integrity of smart contracts, the transactions are securely stored and resistant to counterfeiting or tampering. The model was crafted using the Solidity programming language and rigorously tested through the Ethereum-based Remix IDE. Furthermore, a flowchart-based algorithm was employed to elucidate the model’s functionality. After the implementation, a peer-to-peer (P2P) energy trading marketplace model has been established, facilitating secure and authentic energy transactions among various energy stakeholders.
REFERENCES
[1] S. L. Gbadamosi and N. I. Nwulu, “A multi-period composite generation and transmission expansion planning model incorporating renewable energy sources and demand response,” Sustain. Energy Technol. Assessments, vol. 39, no. October 2019, p. 100726, 2020, doi: 10.1016/j.seta.2020.100726. [2] P. Wongthongtham, D. Marrable, B. Abu-Salih, X. Liu, and G. Morrison, “Blockchain-enabled Peer-to-Peer energy trading,” Comput. Electr. Eng., vol. 94, no. September 2020, p. 107299, 2021, doi: 10.1016/j.compeleceng.2021.107299. [3] M. Moniruzzaman, A. Yassine, and R. Benlamri, “Blockchain and cooperative game theory for peer-to-peer energy trading in smart grids,” Int. J. Electr. Power Energy Syst., vol. 151, no. March, p. 109111, 2023, doi: 10.1016/j.ijepes.2023.109111. [4] S. L. Gbadamosi and N. I. Nwulu, “A comparative analysis of generation and transmission expansion planning models for power loss minimization,” Sustain. Energy, Grids Networks, vol. 26, p. 100456, 2021, doi: 10.1016/j.segan.2021.100456. [5] S.L. Gbadamosi, N.I. Nwulu. Harmonic estimation on a transmission system with large-scale renewable energy sources, Przeglad Elektrotechniczny, ISSN 0033-2097, R. 97 NR 4/2021. [6] N.I. Nwulu, M. Fahrioglu. Investigating a ranking of loads in avoiding potential power system outages, Przeglad Elektrotechniczny, Volume 88, Issue 11 A, 2012. [7] J. Jasper, Albert Aruldoss. Differential evolution with random scale factor for economic dispatch considering prohibited operating zones, PRZEGLĄD ELEKTROTECHNICZNY, ISSN 0033-2097, R. 89 NR 5/2013. [8] Rajan, K. Dhayalini , S. Sathiyamoorthy, Genetic Algorithm for the coordination of wind thermal dispatch, PRZEGLĄD ELEKTROTECHNICZNY, ISSN 0033-2097, R. 90 NR 4/2014. [9] H. Bouzeboudja, M. Maamri , M. Tandjaoui, The Use of Grey Wolf Optimizer (GWO) for Solving the Economic Dispatch Problems based on Renewable Energy in Algeria A case study of “Naama Site”, PRZEGLĄD ELEKTROTECHNICZNY, ISSN 0033-2097, R. 95 NR 6/2019. [10] W. Khamsen, C. Takeang, Hybrid of Lamda and Bee Colony Optimization for Solving Economic Dispatch, PRZEGLĄD ELEKTROTECHNICZNY, ISSN 0033-2097, R. 92 NR 9/2016. [11] A. Esmat, M. de Vos, Y. Ghiassi-Farrokhfal, P. Palensky, and D. Epema, “A novel decentralized platform for peer-to-peer energy trading market with blockchain technology,” Appl. Energy, vol. 282, no. PA, p. 116123, 2021, doi: 10.1016/j.apenergy.2020.116123. [12] M. Afzal et al., “Role of blockchain technology in transactive energy market: A review,” Sustain. Energy Technol. Assessments, vol. 53, no. PC, p. 102646, 2022, doi: 10.1016/j.seta.2022.102646. [13] H. Sahebi, M. Khodoomi, M. Seif, M. S. Pishvaee, and T. Hanne, “The benefits of peer-to-peer renewable energy trading and battery storage backup for local grid,” J. Energy Storage, vol. 63, no. March, p. 106970, 2023, doi: 10.1016/j.est.2023.106970. [14] H. R. Bokkisam and M. P. Selvan, “Effective community energy management through transactive energy marketplace,” Comput. Electr. Eng., vol. 93, no. September 2020, p. 107312, 2021, doi: 10.1016/j.compeleceng.2021.107312. [15] A. Dorri, F. Luo, S. Karumba, S. Kanhere, R. Jurdak, and Z. Y. Dong, “Temporary immutability: A removable blockchain solution for prosumer-side energy trading,” J. Netw. Comput. Appl., vol. 180, no. January, p. 103018, 2021, doi: 10.1016/j.jnca.2021.103018. [16] Y. T. Lei, C. Q. Ma, N. Mirza, Y. S. Ren, S. W. Narayan, and X. Q. Chen, “A renewable energy microgrids trading management platform based on permissioned blockchain,” Energy Econ., vol. 115, no. March, p. 106375, 2022, doi: 10.1016/j.eneco.2022.106375. [17] X. Wang, Y. Liu, R. Ma, Y. Su, and T. Ma, “Blockchain enabled smart community for bilateral energy transaction,” Int. J. Electr. Power Energy Syst., vol. 148, no. July 2022, p. 108997, 2023, doi: 10.1016/j.ijepes.2023.108997. [18] L. Xu and B. Wang, “Peer-to-peer electricity trading considering voltage-constrained adjustment and loss allocation in blockchain-enabled distribution network,” Int. J. Electr. Power Energy Syst., vol. 152, no. March, p. 109204, 2023, doi: 10.1016/j.ijepes.2023.109204. [19] M. Mehdinejad, H. Shayanfar, and B. Mohammadi-Ivatloo, “Decentralized blockchain-based peer-to-peer energy-backed token trading for active prosumers,” Energy, vol. 244, p. 122713, 2022, doi: 10.1016/j.energy.2021.122713. [20] W. Hua, J. Jiang, H. Sun, and J. Wu, “A blockchain based peer-to-peer trading framework integrating energy and carbon markets,” Appl. Energy, vol. 279, no. September, p. 115539, 2020, doi: 10.1016/j.apenergy.2020.115539. [21] L. Wu, W. Lu, Z. Peng, and C. Webster, “A blockchain nonfungible token-enabled ‘passport’ for construction waste material cross-jurisdictional trading,” Autom. Constr., vol. 149, no. February, p. 104783, 2023, doi: 10.1016/j.autcon.2023.104783. [22] V. F. Yu, T. H. A. Le, and J. N. D. Gupta, “Sustainable microgrid design with peer-to-peer energy trading involving government subsidies and uncertainties,” Renew. Energy, vol. 206, no. February, pp. 658–675, 2023, doi: 10.1016/j.renene.2023.02.003. [23] B. R. Park, M. H. Chung, and J. W. Moon, “Becoming a building suitable for participation in peer-to-peer energy trading,” Sustain. Cities Soc., vol. 76, no. July 2021, p. 103436, 2022, doi: 10.1016/j.scs.2021.103436. [24] C. Zhang, T. Yang, and Y. Wang, “Peer-to-Peer energy trading in a microgrid based on iterative double auction and blockchain,” Sustain. Energy, Grids Networks, vol. 27, p. 100524, 2021, doi: 10.1016/j.segan.2021.100524. [25] C. Liu, Z. Wang, M. Yu, H. Gao, and W. Wang, “Optimal peerto-peer energy trading for buildings based on data envelopment analysis,” Energy Reports, vol. 9, pp. 4604–4616, 2023, doi: 10.1016/j.egyr.2023.03.078. [26] Belgioioso G, Ananduta W, Grammatico S, Ocampo-Martinez C. Operationally safe peer-to-peer energy trading in distribution grids: A game-theoretic market-clearing mechanism. IEEE Trans Smart Grid 2022. [27] Cali U, Çakir O. Energy policy instruments for distributed ledger technology empowered peer-to-peer local energy markets. IEEE Access 2019; 7:82888–900. [28] Tushar W, Yuen C, Mohsenian-Rad H, Saha T, Poor HV, Wood KL. Transforming energy networks via peer-to-peer energy trading: The potential of game-theoretic approaches. IEEE Signal Process Mag 2018;35(4):90–111. [29] Noor S, Yang W, Guo M, van Dam KH, Wang X. Energy demand side management within micro-grid networks enhanced by blockchain. Appl Energy 2018; 228:1385–98. [30] Liu N, Yu X, Wang C, Li C, Ma L, Lei J. Energy-sharing model with price-based demand response for microgrids of peer-topeer prosumers. IEEE Trans Power Syst 2017;32(5):3569–83. [31] Li Z, Kang J, Yu R, Ye D, Deng Q, Zhang Y. Consortium blockchain for secure energy trading in industrial internet of things. IEEE Trans Ind Inf 2017; 14(8):3690–700. [32] Andoni M, Robu V, Flynn D, Abram S, Geach D, Jenkins D, et al. Blockchain technology in the energy sector: A systematic review of challenges and opportunities. Renew Sustain Energy Rev 2019; 100:143–74. [33] Chitchyan, R. and J. Murkin, Review of blockchain technology and its expectations: case of the energy sector. arXiv preprint arXiv:1803.03567, 2018. [34] Deshpande A, Stewart K, Lepetit L, Gunashekar S. Distributed ledger technologies/blockchain: challenges, opportunities and the prospects for standards. Overview report The British Standards Institution (BSI); 2017. [35] Morstyn T, McCulloch MD. Multiclass energy management for peer-to-peer energy trading driven by prosumer preferences. IEEE Trans Power Syst 2018;34(5):4005–14. [36] U. Damisa, N. I. Nwulu, and P. Siano, “Towards BlockchainBased Energy Trading: A Smart Contract Implementation of Energy Double Auction and Spinning Reserve Trading,” Energies, vol. 15, no. 11, 2022, doi: 10.3390/en15114084. [37] Yang X, Wang G, He H, Lu J, Zhang Y. Automated demand response framework in ELNs: Decentralized scheduling and smart contract. IEEE Trans Syst Man Cybern: Syst 2019. [38] Cutsem OV, Dac DH, Boudou P, Kayal M. Cooperative energy management of a community of smart buildings: A blockchain approach. Int J Electr Power Energy Syst 2020; 117:105643. http://dx.doi.org/10.1016/j.ijepes.2019.105643. [39] Gai K, Wu Y, Zhu L, Qiu M, Shen M. Privacy-preserving energy trading using consortium blockchain in smart grid. IEEE Trans Ind Inf 2019;15(6):3548–58. http://dx.doi.org/10.1109/TII.2019.2893433. [40] Hayes B, Thakur S, Breslin J. Co-simulation of electricity distribution networks and peer to peer energy trading platforms. Int J Electr Power Energy Syst 2020; 115:105419. http://dx.doi.org/10.1016/j.ijepes.2019.105419. [41] Fan M, Zhang X. Consortium blockchain based data aggregation and regulation mechanism for smart grid. IEEE Access 2019; 7:35929–40.
Authors: Dr. Saheed Lekan Gbadamosi, Dept. of Electrical & Electronics Engineering Science, University of Johannesburg, Johannesburg, Auckland Park Campus, South Africa. E-mail: gbadamosiadeolu@gmail.com; Prof. Nnamdi. I Nwulu, Dept. of Electrical & Electronics Engineering Science, University of Johannesburg, Johannesburg, Auckland Park Campus, South Africa. E-mail: nnwulu@uj.ac.za
Source & Publisher Item Identifier: PRZEGLĄD ELEKTROTECHNICZNY, ISSN 0033-2097, R. 100 NR 5/2024. doi:10.15199/48.2024.05.38
Published by M Hazwan WAHAB1,2, Mohammad Syuhaimi AB RAHMAN2, Ahmad Asrul IBRAHIM2, A H AHMAD ABAS1,2, Norhidayah AHMAD1,2, Quest International University (1), University Kebangsaan Malaysia (2)
Abstract. Fiber Bragg grating (FBG) is a relatively novel method used for network health monitoring that has a number of advantages including high accuracy, multiplexing, electromagnetic interference resistance and good repeatability. FBG sensor installed in the network has been utilized in many applications to monitor the system and environment condition. Any interruption on the system or environment can be identified and monitored through the status of network health.
Streszczenie. Siatka światłowodowa Bragga (FBG) to stosunkowo nowa metoda stosowana do monitorowania stanu sieci, która ma wiele zalet, w tym wysoką dokładność, multipleksowanie, odporność na zakłócenia elektromagnetyczne i dobrą powtarzalność. Czujnik FBG zainstalowany w sieci znalazł zastosowanie w wielu aplikacjach do monitorowania stanu systemu i otoczenia. Wszelkie zakłócenia w systemie lub środowisku można zidentyfikować i monitorować na podstawie stanu sieci. (Monitorowanie stanu wielożyłowych podziemnych linii energetycznych z wykorzystaniem światłowodowej siatki Bragga)
Keywords: Network monitoring; Fiber bragg grating; Passive optical network; P2MP Słowa kluczowe: Monitorowanie sieci; Siatka Bragga z włókna; Pasywna sieć optyczna; P2MP
Introduction
Power supply is one of the most important and demanding factors in big cities and metropolises. The usage of power consumption is increasing over the years which worries the consumers or users of the electricity interruptions. In order to avoid this issue from happening, service provider needs to sort the best way to deliver electricity to the end user that could promise zero losses or interruption. Currently, the methods being used are diametrical but it involves high costing and affecting the environment. Try and error method is also used to find the source of the problem that does not really suite our current ways of living. Since records of the pilot cable routes are not well maintained and updated, most of the cable routes are not able to be detected. In addition, power provider does not have a specific equipment to identify the exact location of the faulty cables along its route. Using the try and error method to trace the exact location of power cable fault is practiced at the site. In fact, location measured by TDR is not accurate and several attempts of digging are required to find the right location before the cable are able to be repaired. This method needs longer time and caused high costing in order to do cable maintenance[1].
Fig.1. Indicative cross section multi-core power transmission line
All of these issues will be solved with the modern cable transmission systems that uses fiber optic and optical sensor. The introduction of the new modern cable transmission introduces lower cost margin for maintenance purposes, allow remote faulty cable monitoring, improve performance, remove electromagnetic interference and avoid environmental disturbance in order to supply power to the end users. Furthermore, for future estimations, electric network will be able to distribute power energy altogether with the data information[2].
Underground power line transmission environment
Normal functioning 11/33kV power cable transfers the energy to the end point with the expectation of high efficiency delivery[3]. In order to supply a reliable power supply, multi-core cables will be utilized as shown in Figure 1, it will be attached to an optical cable on the outside along with the cable for monitoring network health cable.
Fiber bragg grating (FBG)
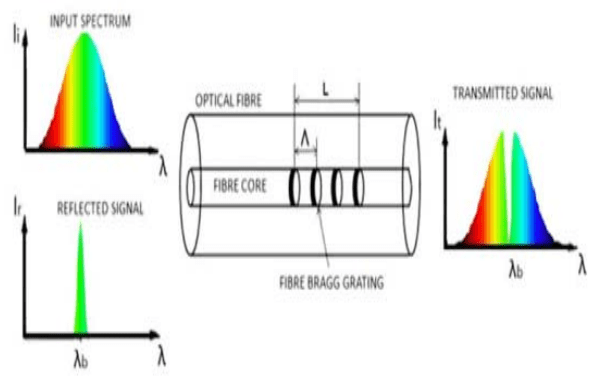
FBG is a low-cost filter in a fiber cable core used to block certain wavelengths or as a reflector of some wavelengths set on FBG. Reflected signal developed will reflect based of any physical changes’ parameter such as strain, pressure, temperatures, grating period, reflective index and etc[4].
Fig.2. Principle of FBG sensors[5]
Figure 2 shows the principle of FBG sensor mechanism. FBGs will be placed around the branch of fiber and as a location indicator for every ONU. The reflected spectrum is created from the FBG located at ONU will be analyse using the Optical Spectrum Analyzer (OSA). FBG is widely used [3]in most application nowadays in filtering, amplifier gain flattening and OCDMA generation codes. The Bragg reflected wavelength is:
.
Whereby neff is the effective refractive index meanwhile Λ spatial period or period of grating[6].
Material and Methods
A. Monitoring power transmission
A multiplexer is used along the fiber to produce a combination of monitoring signal from white light source with downstream signal. The laser signal transmitted will be deciphered by the optical splitter to every branch of the fiber. Each of the branch will be assigned with a uniform number FBGs created from unique spectrum reflections and bandwidth on the preset code. Each of the code will indicate the line along fiber and port number as well as the DP number in order to well recognize the branches. Implementation of FBGs will work as a filter to reflect the white light based on the wavelength, bandwidth and reflection that is set on the FBG[7]. Different code is created to distinguish every port and it can be easily traced using FBG spectrum reflections. Signal transmission will be able to be monitored by doing spectrum analysis using OSA in order to ensure signal delivered properly as shown in Figure 3[8].
Fig.3. Monitoring power transmission line using optical fiber network (dark fiber)
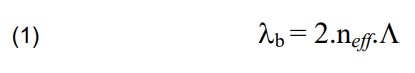
B. Architecture supervisory power network
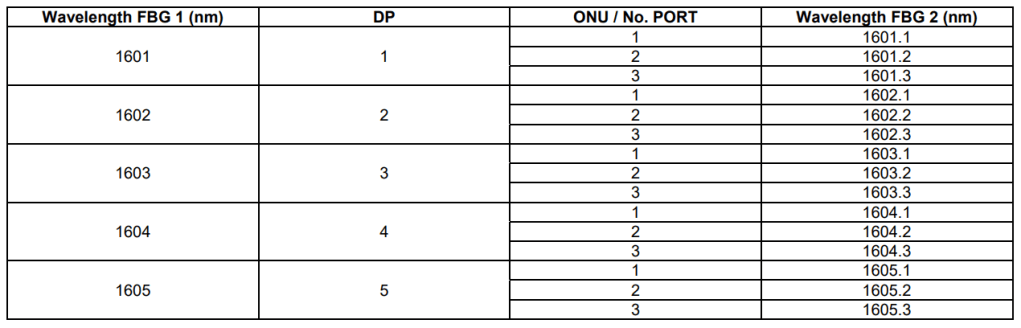
The Bragg wavelength selection starting with 1601nm until 1632nm is used to indicate the distribution point (DP). Number of DP will start from DPX to DPY and the last two digits is representing the DP numbers on the power line network. Bandwidth with 0.1nm and reflection 90% is used at FBG first and act as DP indicator as well. Meanwhile the second FBG represents the port for every DP by using 50% reflection and 0.05nm bandwidth as showing in Figure 4.
Fig.4. FBG design configuration to represent DP number and port number
For the second FBG, the Bragg wavelength is used, it is the same as the first FBG based on the DP number, but the value after the decimal point is equal to the port number for the DP.
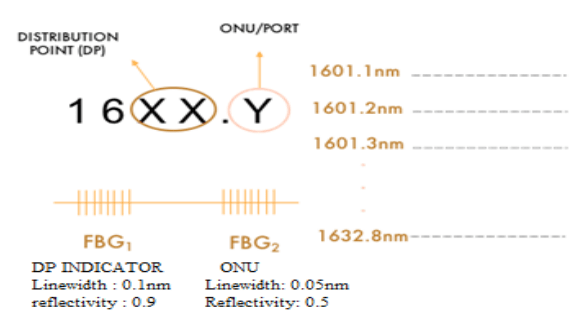
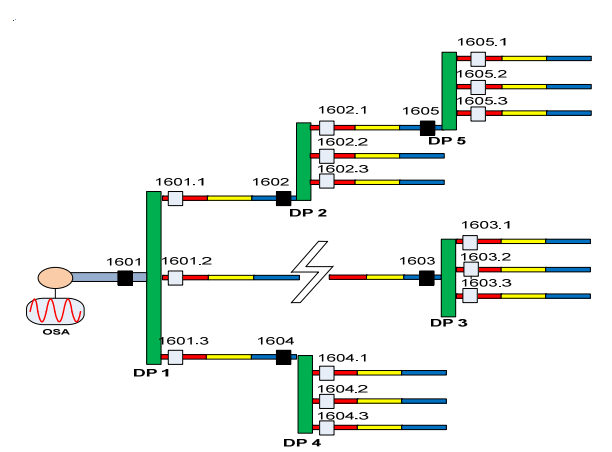
Figure 5 shows the design of multi-core transmission line that can monitor the signal for a total of 256 ports. Along the line, only 2 FBGs are needed to generate the reflected spectrum with the port number and DP number. 256 ports will be monitored by 512 FBGs. This method will be able to monitor more port even bandwidth supplied that is limited[9]–[12]. Therefore, the propose design is shown in Table 1.
Results and Discussions
A. Parameters performances
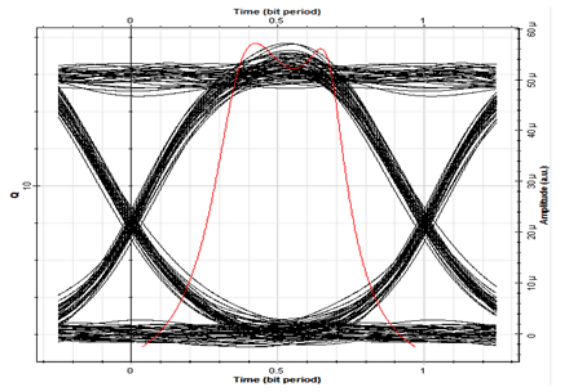
The performances of multi-core cable design simulation are measured by analysing the parameter of BER, Q-factor and eye diagram. BER performance parameter is measured at ONU/PORT number 2 since ONU/PORT 1 is connected to the other port. BER is the rate of occurrence of bit errors during the data transmission process. Simulation is carried out for 15 ONU and the result is analysed using the BER Analyzer. Result shows minimum BER value for 15 ONU that is 3.08638e-70 and it is acceptable due to the additional breakdown network. The Q-factor quality still can be maintained for 15 ONU breakdown which shows 17.678 as result from the simulation.
The Q-factor indicates the power loss related to the amount of power stored in the system. A low power loss rate will increase the value of the Q-factor. In order to ensure the quality, the value for Q-factor must be above of the value 7. Figure 6 shows that the simulation Eye-diagram obtained from Optisystem software for 15 ONU/PORT. Eye diagram is used to analyse the performance of the signals received on the ONU. Based on the Eye diagram on Figure 6 the eye height is 4.24691e-5.
B. Design simulation
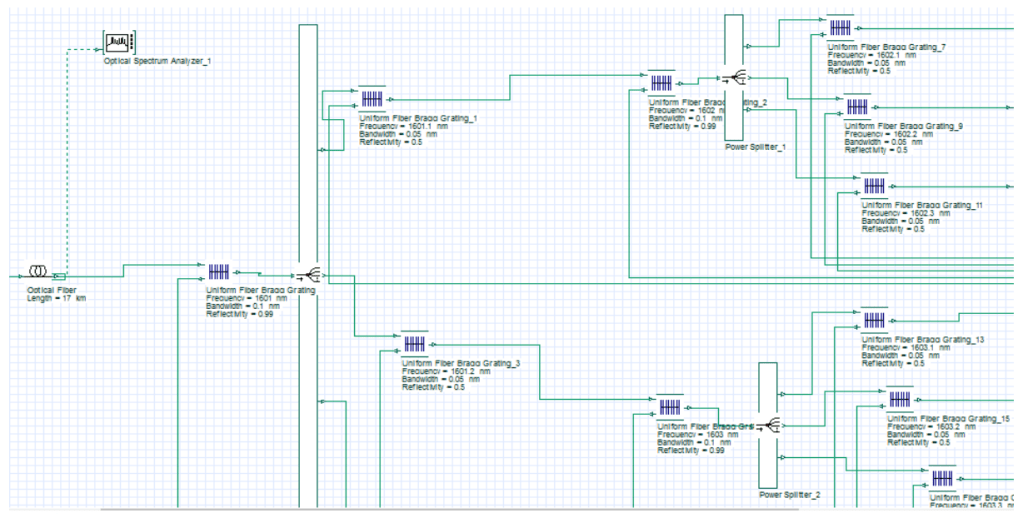
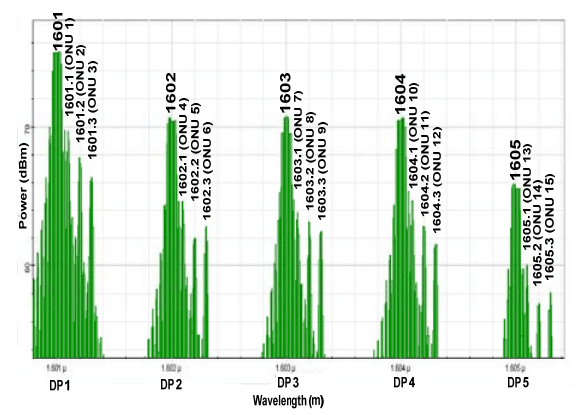
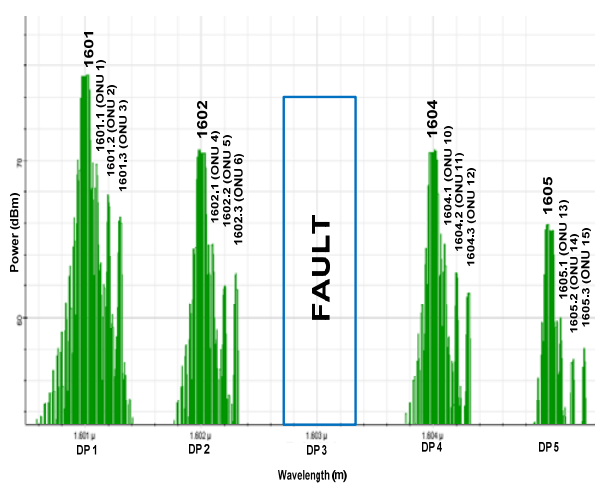
Optisystem software has been used to simulate the design configuration for the power line environment. Focusing on the multi-core environment, the wavelength of FBG is set to represent every port/line. The number of ports that can be produced using this design is 256. The bandwidth range is used from 1601.0 nm to 1632.8 nm. The first FBG will be used as an indicator of DP, 1601nm as the first DP (DP1) to 1632 nm as the 32nd DP (DP32) indicator. The second FBG used as an indicator of the port number, 0.1nm up to 0.8 nm for 8 ports at each DP. The port number can be read and analysed on the reflected spectrum of FBG in Optical Spectrum Analyzer (OSA). However, only 15 ports were simulated using this simulation as shown in Figure 7 and Figure 8 shows the results of FBG spectrum on the film network using OSA to analyse 15 ports.
Fig.5. The architecture of supervisory network power line monitoring for multi-core cable
Fig.6. Eye diagram on single core architecture for 15 ONU/PORT
Table 1. List of bragg wavelength used for each FBG
.
Fig.7. Design simulation using optisystem software
Fig.8. The reflected spectrum of 15 ONU/ports using OSA
C. Health monitoring supervisory
To prove the feasibility of this design, one of the ports has been set as a fault branch at the port 2 DP 1 as shown in Figure 9. The connection failure of this branch can be seen through OSA.
Fig. 9. Port 2 connection failure for multi-core architecture power line
In this case, in Figure 8 Port 2 cannot be seen as the code at DP1 and the entire DP 3 was missing. Thus, fault branch can be seen by analysing the reflection code of the FBG spectrum on OSA device. Figure 10 is showing the analysis result of connection failure on Port 2.
Fig.10. The reflected spectrum of multi-core with fault fiber at DP 1 and port 2 using OSA
Conclusion
It can be concluded that FBG sensor based in-situ is an efficient and effective network health monitoring technique that is essential for monitoring the condition of power line cables. Thus, effective technique to monitor network health was created using FBG configuration design to identify fault branches. Fiber Optic Distributed Coded FBG Sensing uses optical fiber to provide invaluable insight into power cable behaviour. Besides, FBG sensors are encoded by wavelength, making signal of FBGs immune to power fluctuations along the optical path, which was shown to measure line status condition with accuracy compared to many alternative techniques.
REFERENCES
[1] N. F. Naim, A. A. A. Bakar, and M. S. Ab-Rahman, “Realtime monitoring in passive optical access networks using L-band ASE and varied bandwidth and reflectivity of fiber Bragg gratings,” Opt. Laser Technol., vol. 79, pp. 45–51, May 2016, doi: https://doi.org/10.1016/j.optlastec.2015.11.008. [2] -E Vasileiou, D. Agoris, E. Pyrgioti, and D. Lymberopoulos, “A review on the application of fiber optics on high voltage lines,” 2016. Accessed: Jun. 29, 2023. [Online]. Available: https://silo.tips/download/a-review-on-the-application-of-fiber-opticson-high-voltage-lines. [3] Institute of Electrical and Electronics Engineers, IEEE Communications Society, and Vehicular Technology Society. Portugal Chapter, 2014 21st International Conference on Telecommunications (ICT) took place 4-7 May 2014 in Lisbon, Portugal. . [4] M. A. H. A. I. M. Alaa hussein Ali, “The Design and Simulation of FBG Sensors for Medical Application,” Iraqi J. Comput. Commun. Control Syst. Eng., pp. 1–8, Oct. 2020, doi: http://dx.doi.org/10.33103/uot.ijccce.20.4.1. [5] J. S. K. B. G. P. J. W. K. F. R. P. of E. and E. E. Jincy Johny*, “Theoretical investigation of positional influence of FBG sensors for structural health monitoring of offshore structures,” Ocean. 2017 – Aberdeen ., 2017, doi: doi.org/10.1109/OCEANSE.2017.8084976. [6] K. B. Nguyen and S. Il Choi, “Fault Monitoring in Passive Optical Networks Using Burst-Mode FBG Optical Sensor,” in International Conference on Ubiquitous and Future Networks, ICUFN, 2019, vol. 2019-July, pp. 370–372, doi: 10.1109/ICUFN.2019.8806151. [7] Y. Z. H. Z. Z. Z. Z. L. Q. C. and J. Kai Xie, “2018 International Conference on Power System Technology (POWERCON).,” Pract. Opt. fiber Sens. Technol. power Transm. lines towers, pp. 1–7, 2018, doi: https://doi.org/10.1109/POWERCON.2018.8601953. [8] U. Senkans, J. Braunfelds, I. Lyashuk, J. Porins, S. Spolitis, and V. Bobrovs, “Research on FBG-Based Sensor Networks and Their Coexistence with Fiber Optical Transmission Systems,” J. Sensors, vol. 2019, 2019, doi: https://doi.org/10.1155/2019/6459387. [9] B. K. Bhatia and E. M. Singh, “Design and Simulation of GPON networks over different FBG techniques,” IOSR J. Electron. Commun. Eng., vol. 12, no. 03, pp. 47–52, Jun. 2017, doi: https://doi.org/10.9790/2834-1203034752. [10] N. F. Naim, M. S. Ab-Rahman, H. A. Bakarman, and A. A. A. Bakar, “Real-time monitoring in passive optical networks using a superluminescent LED with uniform and phase-shifted fiber Bragg gratings,” J. Opt. Commun. Netw., vol. 5, no. 12, pp. 1425–1430, Dec. 2013, doi: https://doi.org/10.1364/JOCN.5.001425. [11] N. F. Naim, M. S. Ab-Rahman, N. H. Kamaruddin, and A. A. A. Bakar, “Real-time monitoring and fault locating using amplified spontaneous emission noise reflection for tree-structured Ethernet passive optical networks,” Opt. Eng., vol. 52, no. 9, p. 096112, Sep. 2013, doi: http://dx.doi.org/10.1117/1.OE.52.9.096112. [12] N. F. Naim, A. A. A. Bakar, and M. S. Ab-Rahman, “Fault identification and localization for Ethernet Passive Optical Network using L-band ASE source and various types of fiber Bragg grating,” Opt. Fiber Technol., vol. 40, pp. 159–164, Jan. 2018, doi: https://doi.org/10.1016/j.yofte.2017.11.018.
Authors: M Hazwan Wahab, Prof Dr Mohammad Syuhaimi Ab Rahman, Dr Asrul Ahmad, A H Ahmad Abas, Norhidayah Ahmad. Quest International University, No. 227, Jalan Raja Permaisuri Bainun, 30250 Ipoh, Perak. Universiti Kebangsaan Malaysia, Department of Electrical and Electronic Engineering, 43600 Bangi, Selangor Malaysia E-mail: mhazwan34@gmail.com.
Source & Publisher Item Identifier: PRZEGLĄD ELEKTROTECHNICZNY, ISSN 0033-2097, R. 100 NR 6/2024. doi:10.15199/48.2024.06.48
Published by Sri SUWASTI, Yiyin KLISTAFANI, Muhammad Ruswandi DJALAL, State Polytechnic of Ujung Pandang
Abstract. The objective of this research is to develop a water cylinder filling pump integrated with a hybrid solar and grid (PLN) system. The performance of the pump is calculated to enable a comparative analysis with the energy and economic aspects of PLN and solar panels. The methodology involves a literature study to explore relevant topics, followed by the design phase, encompassing the fundamental aspects of tool design, manufacturing, and assembly of tool components. Subsequently, testing and data collection are executed, and the obtained data undergoes analysis. The research findings reveal the success of the water cylinder filling pump design, with average efficiencies for PLN, solar panels, and the hybrid system measuring 7.22%, 2.17%, and 4.70%, respectively. This substantiates the conclusion that the use of solar panels can provide energy savings and reduce PLN electricity costs on a small scale, rendering it suitable for household use.
Streszczenie, . Celem tego przedsięwzięcia jest opracowanie pompy do napełniania zbiorników wodą zintegrowanej z hybrydowym systemem fotowoltaicznym i sieciowym (PLN). Dodatkowo obliczana jest wydajność pompy, aby umożliwić analizę porównawczą z aspektami energetycznymi i ekonomicznymi złotówki i paneli słonecznych. Metodologia obejmuje badanie literatury w celu zbadania odpowiednich tematów, po którym następuje faza projektowania obejmująca podstawowe aspekty projektowania narzędzi, produkcji i montażu elementów narzędzi. Następnie przeprowadzane są badania i zbieranie danych, a uzyskane dane poddawane są analizie. Wyniki badań wykazały sukces konstrukcji pompy do napełniania zbiorników wodą, której średnia sprawność w przeliczeniu na złotówkę, paneli słonecznych i układu hybrydowego wyniosła odpowiednio 7,22%, 2,17% i 4,70%. Uzasadnia to wniosek, że zastosowanie paneli fotowoltaicznych może w małej skali zapewnić oszczędność energii i obniżyć złotówkowe koszty energii elektrycznej, czyniąc ją przydatną do użytku domowego. (Zastosowanie pompy wodnej do napełniania rurą wodną w hybrydowym układzie energii słonecznej i zł)
Keywords: Water Tube Filling Pump, Hybrid System, Solar and PLN Słowa kluczowe: Pompa do napełniania rurką wodną, system hybrydowy, PLN
1. Introduction
The world is currently facing two detrimental challenges, namely the energy crisis and environmental pollution because the main energy resource used is fossil fuels [1, 2]. The increasing use of fossil fuels has a negative impact on the environment in the form of particulate emissions (dust, lead) and gases (CO, CO2, NO2) which can cause health problems for humans and damage to the environment [3, 4]. The main energy sources are classified into two groups, namely Conventional Energy, namely energy taken from sources that are only available in limited quantities on Earth and cannot be regenerated and Renewable Energy, namely energy produced from natural sources such as the sun, wind and water that can be produced again [5, 6].
As time goes by, the increasing population of Indonesia allows energy use to increase as well. Energy needs in society are the spearhead of various sectors of human life such as agriculture, education, health, transportation and the economy [7]. Solar energy is one of the forms of energy currently being actively developed by the Indonesian government. As a tropical country, Indonesia has significant solar energy potential [8, 9]. At present, solar cells are used for daily needs such as water heaters, water pumps, cooling, and sterilization [10].
Solar-powered water heaters represent the latest and highly innovative technology in water heating applications. This type is significantly more effective and efficient in terms of cost, performance, and energy savings [11]. Unlike electric heating, which incurs monthly costs and is highly dependent on non-renewable natural resources, solar water heaters harness abundant sunlight, making them a sustainable and renewable energy solution [12, 13].
A dispenser is a household appliance that utilizes electricity to heat the heating element and operate the cooling machine [14, 15]. Dispensers are categorized into two types based on the placement of the gallon: the upper gallon system (upper gallon) and the bottom gallon system (lower gallon). In the bottom gallon system type dispenser, a pump is incorporated to facilitate the drainage of water from the gallon to the water tube in the dispenser. This pump operates using electrical energy, with the electricity sourced from PLN or conventional energy sources.
In a previous study titled ‘Design and Construction of a Continuous Water Heater with a Hybrid Solar and Gas System’ [16, 17], hybrid solar energy was employed in conjunction with conventional energy in the form of LPG gas. However, this approach had some drawbacks, such as requiring a significant amount of space due to the device’s width, manual water entry into the heating tank, and dependence on conventional gas, the price of which is currently soaring and challenging to replace regularly. A hybrid system is a power plant that incorporates more than one type of generator, combining various renewable and non-renewable energy sources. In light of these considerations, the author aims to develop a design for a solar energy water heater that will be hybridized with PLN, offering a more sustainable and efficient solution.
Building on this background, the author proposes the development of a Water Tube Filling Pump with a Hybrid System of Solar Energy and PLN. The objective of this initiative is to manufacture a solar energy and PLN hybrid system water cylinder filling pump and to assess its performance. Additionally, the research includes an analysis of the energy and economic comparison between solar energy and PLN.
2. Research Methods
2.1. Assembly and Manufacturing
Procedures for crafting and assembling solar panel frames and integrating the PLN (grid) system are outlined as follows:
1) Prepare all necessary tools and materials.
2) Construct a frame to serve as support for the solar panels.
3) Install essential components, including the solar charge controller, battery, Low Voltage Disconnect (LVD), and relay.
4) Establish a terminal at the solar panel output to facilitate the replacement of the voltage source used in the dispenser with direct voltage from the solar panel. This eases the connection of the solar panel to the dispenser pump.
5) Integrate an inverter to convert DC current to AC, ensuring the electric current is compatible with the dispenser.
6) Incorporate an Automatic Transfer Switch (ATS) to enable an automatic switch between the solar cell and PLN as the power source.
2.2. Equipment Testing Procedures
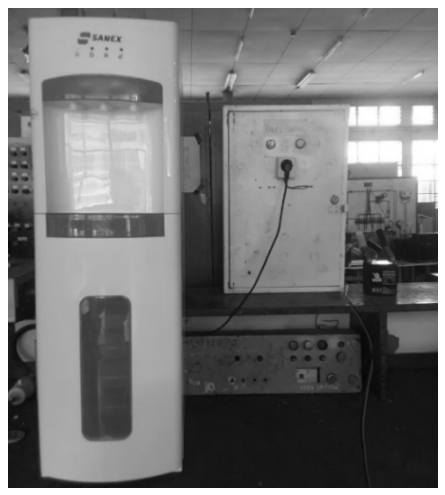
After completing the design and construction process (refer to Figure 1), the subsequent phase involves tool testing and data collection for the Solar and PLN Hybrid System Water Tube Filling Pump. The testing process follows a systematic approach:
1) Prepare tools and materials. 2) Assemble the solar panels and other equipment according to the circuit drawing. 3) For PLN sources (10.50 to 11.40 WITA): • Record PLN voltage and current. • Measure Power Factor or cos phi PLN. • Record voltage and current of the dispenser pump. 4) For solar cells (12.00 to 12.50 WITA): • Record solar radiation intensity. • Record panel output voltage and current. • Record voltage and current of the dispenser pump every 10 minutes. 5) Hybrid system data collection (13.00 to 13.20 WITA for solar cells, 13.30 to 13.50 WITA for PLN): • Repeat steps 4 for solar cells and steps 3 for PLN. 6) Record all measurement results in the observation table. 7) Analyze the measurement results. 8) Draw conclusions based on the hybrid system testing. 9) Declare the testing process complete.
Fig.1. Solar and Gas Hybrid System Water Tube Filling Pump
3. Results and Discussion
Testing is divided into several parts: 1) Testing using PLN 2) Testing using a solar cell 3) Hybrid solar cell and PLN testing
3.1. Solar Cell
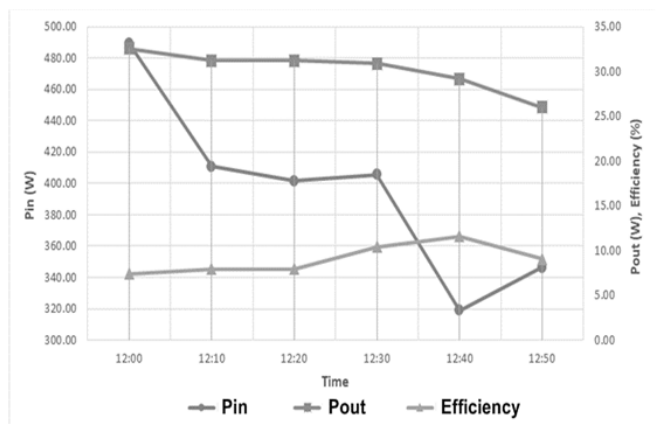
Figure 3 depicts the relationship between the average input power of solar panels over time. The graph trend demonstrates fluctuations, attributed to changes in the intensity of solar radiation or variations in weather conditions. The maximum average input power of solar panels is recorded at 12:00, reaching 489.645 Watts, while the minimum value occurs at 12:40, with an average input power of 318.87 Watts.
3.2. PLN
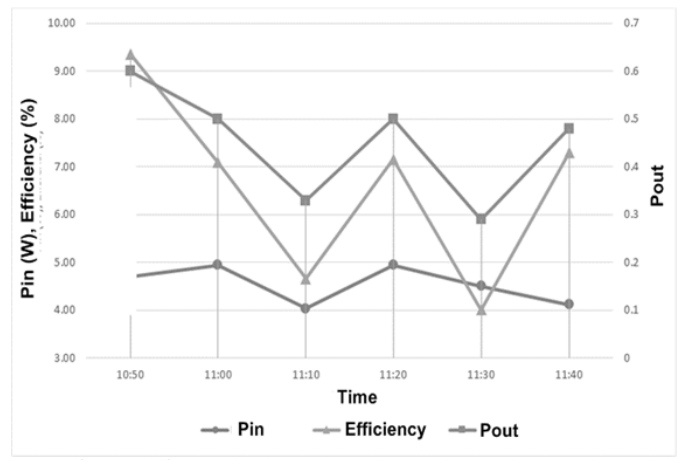
Figure 2 illustrates the fluctuating relationship over time between average input power, output power, and PLN efficiency. Notably, the average maximum input power peaks at 11:20, reaching 4.947 Watts, while the minimum value is recorded at 11:10 with a value of 4.039 Watts. Similarly, the average maximum output power is observed at 10:50, with a value of 0.6 Watts, and the minimum occurs at 11:30, registering at 0.29 Watts. Regarding PLN efficiency, the highest average efficiency is noted at 10:50, reaching 9.35%, while the lowest value is recorded at 11:30, measuring 4.01%.
Fig.2. Graph of the relationship between average input power, output power and PLN efficiency against time
Fig.3. Graph of the relationship between average solar panel input power and time
Fig.4. Average Efficiency
Additionally, the figure illustrates the relationship between the average panel output power over time, showcasing a decreasing trend in the output power of solar panels over time. The maximum average pump input power is observed at 12:00, with a value of 32.58 Watts, while the minimum value occurs at 12:50, registering an average output power of 26.04 Watts.
Furthermore, the figure presents the relationship between the average efficiency of solar panels and time. The efficiency tends to increase initially and then decreases in the latest data. The highest average solar panel efficiency is noted at 12:30, reaching 11.58%, while the minimum value occurs at 12:00, with an average efficiency of 7.42%.
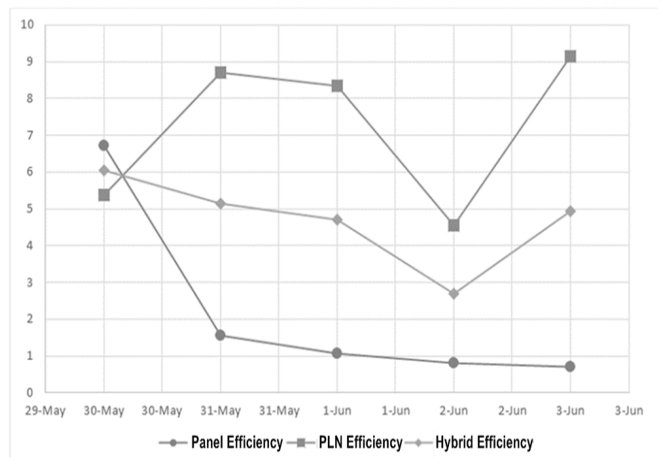
3.3. Hybrid
Figure 4 illustrates the fluctuating relationship over time for average efficiency, showcasing variations in both increasing and decreasing trends. Notably, the average maximum solar panel efficiency was observed on May 30, reaching 6.72%, while the minimum value occurred on June 3, registering at 0.71%.
Similarly, the average maximum PLN efficiency was recorded on June 3, with a value of 9.13%, while the minimum value occurred on June 2, measuring 4.56%. Additionally, the figure presents the average hybrid efficiency of solar energy and PLN, with the maximum occurring on May 30 at 6.05% and the minimum on June 2 at 2.68%.
4. Conclusion
Through the foundational stages of design, assembly, manufacturing, and testing, results were obtained for a water cylinder filling pump integrated with a hybrid system of solar energy and PLN. The efficiency of solar panels proved to be influenced by the intensity of the sun and weather conditions, while the efficiency of PLN was affected by current, voltage, and power factor (cos phi).
The highest recorded hybrid efficiency reached 6.05%, with the solar panel efficiency at 6.72% and PLN efficiency at 5.38%. Conversely, the lowest hybrid efficiency was 2.68%, corresponding to a solar panel efficiency of 0.80% and PLN efficiency of 4.56%.
The testing of the water cylinder filling pump with this hybrid system demonstrated success in saving PLN energy, with a reduction of 0.00083 kWh, leading to PLN electricity cost savings of Rp.1,20.
Acknowledgments: Thank you to the Center for Research and Community Service at the State Polytechnic of Ujung Pandang and all parties who have assisted in carrying out this research activity.
REFERENCES
[1] V. S. Arutyunov and G. V. Lisichkin, “Energy resources of the 21st century: Problems and forecasts. Can renewable energy sources replace fossil fuels,” Russian Chemical Reviews, vol. 86, no. 8, p. 777, 2017. [2] A. Kalair, N. Abas, M. S. Saleem, A. R. Kalair, and N. Khan, “Role of energy storage systems in energy transition from fossil fuels to renewables,” Energy Storage, vol. 3, no. 1, p. e135, 2021. [3] F. Martins, C. Felgueiras, M. Smitkova, and N. Caetano, “Analysis of fossil fuel energy consumption and environmental impacts in European countries,” Energies, vol. 12, no. 6, p. 964, 2019. [4] A. Hassan, S. Z. Ilyas, A. Jalil, and Z. Ullah, “Monetization of the environmental damage caused by fossil fuels,” Environmental Science and Pollution Research, vol. 28, pp.21204-21211, 2021. [5] R. V. Petrescu, R. Aversa, A. Apicella, S. Kozaitis, T. AbuLebdeh, and F. I. Petrescu, “Management of Renewable Energies and Environmental Protection,” American Journal of Engineering and Applied Sciences, vol. 10, no. 4, pp. 919-948, 2017. [6] A. Olabi et al., “Large-vscale hydrogen production and storage technologies: Current status and future directions,” International Journal of Hydrogen Energy, vol. 46, no. 45, pp. 23498-23528, 2021. [7] S.-Y. Pan, M. Gao, H. Kim, K. J. Shah, S.-L. Pei, and P.-C. Chiang, “Advances and challenges in sustainable tourism toward a green economy,” Science of the total environment, vol. 635, pp. 452-469, 2018. [8] F. Firman, N. H. Said, and M. R. Djalal, “Characteristic Analysis of Solar Panels on Clay and Ceramic Roof Tiles,” International Review of Mechanical Engineering (IREME), vol. 16, no. 3, 2022, doi: 10.15866/ireme.v16i3.20004. [9] M. Saini, M. R. Djalal, M. Azhar, and G. E. Patrix, “Modeling and implementing a load management system for a solar home system based on Fuzzy Logic,” 2023, Fuzzy Logic; Load; Management; Modeling; Solar Home System; vol. 27, no. 2, p. 10, 2023-04-27 2023, doi: 10.22441/sinergi.2023.2.014. [10] A. Pandey et al., “Solar Energy Utilization Techniques, Policies, Potentials, Progresses, Challenges and Recommendations in ASEAN Countries,” Sustainability, vol. 14, no. 18, p. 11193, 2022. [11] S. F. Ahmed et al., “Recent progress in solar water heaters and solar collectors: A comprehensive review,” Thermal Science and Engineering Progress, vol. 25, p. 100981, 2021. [12] M. J. B. Kabeyi and O. A. Olanrewaju, “Sustainable energy transition for renewable and low carbon grid electricity generation and supply,” Frontiers in Energy research, vol. 9, p. 1032, 2022. [13] R. Rostami, S. M. Khoshnava, H. Lamit, D. Streimikiene, and A. Mardani, “An overview of Afghanistan’s trends toward renewable and sustainable energies,” Renewable and Sustainable Energy Reviews, vol. 76, pp. 1440-1464, 2017. [14] A. Ramprasad and S. Banerjee, “Design and Analysis of Air Conditioning Cum Water Dispenser System,” International Journal of Mechanical Engineering and Technology, vol. 6, no. 10, pp. 202-216, 2015. [15] T. Gadelkareem, A. EldeinHussin, G. Hennes, and A. ElEhwany, “Stirling cycle for hot and cold drinking water dispenser,” International Journal of Refrigeration, vol. 99, pp. 126-137, 2019. [16] R. Pakku Atto and L. l. Jefryanto, “Design and Construction of a Continuous Water Heater Hybrid System with Solar and Gas Energy,” Diploma 3, Conversion Energi Engineering, State Polytechnic of Ujung Pandang, Makassar, 2022. [17] S. Suwasti and M. R. Djalal, “Design of Continuous Water nHeater Hybrid Solar And Gas System,” Przeglad Elektrotechniczny, vol. 99, no. 7, 2023.
Authors: Sri Suwasti, Yiyin Klistafani, Muhammad Ruswandi Djalal, Departement of Mechanical Engineering, State Poytechnic of Ujung Pandang, Emails: sri_suwasti@poliupg.ac.id, yiyin_klistafani@poliupg.ac.id, wandi@poliupg.ac.id.
Source & Publisher Item Identifier: PRZEGLĄD ELEKTROTECHNICZNY, ISSN 0033-2097, R. 100 NR 7/2024. doi:10.15199/48.2024.07.11
Published by 1. Ilham RAHIMLI1, 2. Aliashraf BAKHTIYAROV2, 3. Gulshan ABDULLAYEVA3, 4. Sona RZAYEVA4, Azerbaijan State Oil and Industry University (1, 2, 3, 4) ORCID: 1. 0009-0006-1976-4475; 3. 0000-0003-0168-9623; 4.0009.0006.6439.5699
Abstract. Due to the fact that high-voltage equipment solutions involve large capital investments, they are very important areas based on the scientific, technical and applied sectors. The most correct and accurate solution of these questions is always taken into account as an urgent problem. In many cases, along with scientific and technical problems in this direction, other problems also become relevant. The purpose of this work: as an example, the question was raised about the alteration of the neutral modes of 10-35 kV networks in order to increase power and maintain accuracy in the development of distribution systems. Research method: Such questions lead to a situation related to the replacement of the network, the operation system of machines and equipment, the introduction and manufacture of thousands of 10-35 kV transformers during reconstruction. And these issues become technical and economic problems of national importance, which are necessary for production and are considered important for solution. Results: The choice of one or another neutral grounding mode is extremely effective when it is necessary to operate the network for a long time with a single-phase ground fault. The need for long-term network maintenance in the event of such a failure arises only if backup is not available. At this time, the effective use of an arcing reactor is possible only in symmetrical networks that change without changing the configuration.
Streszczenie. Ze względu na to, że rozwiązania w zakresie urządzeń wysokiego napięcia wiążą się z dużymi inwestycjami kapitałowymi, są to bardzo ważne obszary oparte na sektorach naukowym, technicznym i stosowanym. Najbardziej poprawne i dokładne rozwiązanie tych pytań jest zawsze brane pod uwagę jako pilny problem. W wielu przypadkach wraz z problemami naukowymi i technicznymi w tym kierunku istotne stają się także inne problemy. Cel pracy: jako przykład postawiono pytanie o przebudowę trybów neutralnych sieci 10-35 kV w celu zwiększenia mocy i zachowania dokładności w rozwoju systemów dystrybucyjnych. Metoda badawcza: Takie pytania prowadzą do sytuacji związanej z wymianą sieci, systemu pracy maszyn i urządzeń, wprowadzeniem i produkcją tysięcy transformatorów 10-35 kV podczas przebudowy. Kwestie te stają się problemami technicznymi i ekonomicznymi o znaczeniu krajowym, niezbędnymi do produkcji i uważanymi za ważne do rozwiązania. Wyniki: Wybór jednego lub drugiego trybu uziemienia neutralnego jest niezwykle skuteczny, gdy konieczna jest długotrwała eksploatacja sieci z jednofazowym zwarciem doziemnym. Konieczność długoterminowej konserwacji sieci w przypadku takiej awarii pojawia się tylko w przypadku braku możliwości wykonania kopii zapasowej. W tej chwili efektywne wykorzystanie reaktora łukowego jest możliwe tylko w sieciach symetrycznych, które zmieniają się bez zmiany konfiguracji. (Procesy łączeniowe zachodzące w sieciach elektrycznych 10-35 kV)
In connection with the town-planning works, which have recently changed, such problems as the replacement of overhead power lines (OHPL) with cable lines are also on the agenda. On the other hand, it may take some time, the replacement of 10-35 kV oil circuit breakers with newer vacuum and contact circuit breakers is a problem in independent countries, because Solving these problems requires a large budget.
The above structures and modes related to the neutral, in networks up to 35 kV phase-to-phase voltage, and in networks up to 110 kV and more, require attention and design due to the degree of insulation, which takes up more space. The number of such scientific and technical issues and the exact scope of the problems under consideration are quite wide. In each period of solving such problems, there was a special form of approximation and corresponding regulations based on these directions.
Formulation of the problem
Insulating materials used in electrical networks must be designed for appropriate degrees of insulation against excessive switching voltages based on the rated voltages. The main purpose of electro-physical procedures and electro-chemical differences in insulation is to increase the electric field strength (EFI), heat and moisture.
Degrees of isolation and how they work in real devices depend on many factors. Insulation management consists in comparing it with the voltages acting on it and the characteristics of the protective equipment. For this reason, they use voltages at which the switching overvoltage has reached the limit level and, like atmospheric overvoltage pulses, they use control voltages. It should also be noted that the degree and coordination of insulation in networks up to 330 kV are mainly used for atmospheric and switching overvoltages.
The number of requirements for the reliable functioning of insulation in real situations reaches 50. This range includes phenomena caused by the state of the open atmosphere, chemical aggressive conditions, solar and atomic radiation, the accumulation of hidden defects present in the insulation in the closed state, mechanical and thermal effects.
All this is based on the analysis of the neutral operation mode in 10-35 kV networks, the study of the issues of neutral grounding, relay protection in case of short circuits, arc winding (reactor), etc.
The solution of the problem
Neutral isolated systems or in the form of resistorgrounding, in high voltage networks up to 35 kV, circuits are used in which reactors equipped with inductive arc extinguishing windings are connected to the neutral. For this reason, and also because of the spontaneous tripping of the earth fault, it is possible to reduce capacitance currents in designated situations, so arc breaker windings are used. The capacitive currents that arise when the inductive reactances Ls of the considered windings are connected to the resistor are generally reduced to zero.
In lines with direct grounding of neutrals of 110 kV and higher, as a result of a single-phase short circuit, the voltages of healthy phases do not exceed l.3Uf. This mode passes in a short time and does not cause any fear. However, opening the circuit breakers at the line ends with a delay of 1 second results in one-way supply and overvoltages in the phases. The main reason for the higher voltage is the accumulation of its voltage in an unbalanced system during a single-phase short circuit in healthy phases.
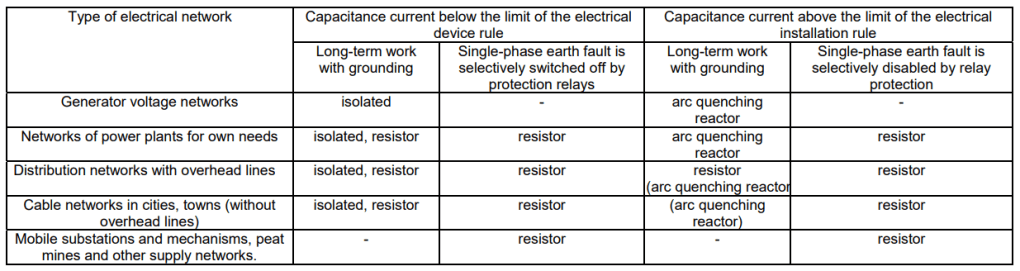
Thus, the 10-35 kV neutral grounding mode affects a number of technical reasons implemented in the network. In networks with medium voltage (rated voltage 69 kV according to foreign classification), four neutral grounding modes are used.
Looking at the worldwide operation of medium voltage networks, it can be seen that in most countries of the world the method of earthing through the winding of the resistor and the arc circuit breaker prevails.
In medium voltage networks 3-69 kV in Europe, North and South America, as well as Australia, the isolated neutral mode is used very rarely. Medium voltage networks 3-69kV operate mainly according to the grounding method through the arc breaker winding or resistor.
When a single-phase short circuit occurs, the arc breaker winding creates an inductive electric current at the fault location. In this case, the final electric current in the damaged place becomes equal to zero, and there is no need to turn off the initial short circuit that occurred in the network.
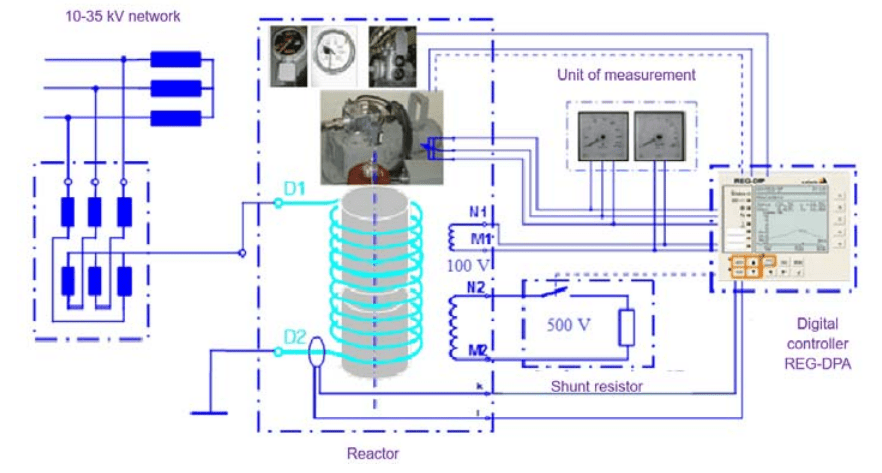
A low voltage (500V) shunt resistor is connected to the secondary 500V arc winding power circuit using a special contactor. This technical solution has a number of advantages:
– eliminating the need to extinguish a single-phase short circuit and simultaneously deprive the consumer of electrical energy;
– weak electric current at the damage site (no more than 1-2 A);
– elimination of single-phase short circuits themselves (mainly in overhead power lines); – possibility of using automatic relay protection that prevents short circuits;
– eliminating cases of damage to instrument transformers due to ferroresonance phenomena.
Figure 1 shows a block diagram of a technical solution for the neutral grounding mode through an arc suppression coil together with a shunt low-voltage resistor in 10-35 kV networks.
Fig.1 Neutral grounding mode in 10-35 kV electrical networks through an arc-extinguishing winding
In existing electrical networks with a voltage of 10-35 kV, which have a neutral grounding mode through an arc extinguisher, but do not have a shunt resistor, there are a number of problems when creating protection against short circuits. In such networks, both simple current protection devices (ANSI code 51G) and directional current protection devices (ANSI code 67N) can be used.
Simple current protective devices (ANSI code 51G) cannot be used because the arc suppression coil reduces the fault current (3I0) caused by a single-phase fault to zero. Directional protective devices (ANSI code 67N) cannot be used because the direction of current in faulted and unfaulted feeders is the same. In damaged feeders, inductive electrical energy flows from the busbars, equal to the electrical energy of the feeder due to its volume, and electrical energy flows towards the busbars from undamaged feeders.
In 10-35 kV networks, the neutral grounding mode through a shunted low-voltage resistor and an arc circuit breaker winding connected to a 500 V secondary power winding creates special opportunities for organizing selective short-circuit protection both due to simple current limiters (ANSI code 51G) and due to directional current limiting devices (ANSI code 67N).
Neutral grounding through a high-frequency resistor: in this mode of neutral grounding, the power of the final electric current (active current + capacitive current) of the short circuit does not exceed 10A. As a rule, tripping of a single-phase neutral short circuit in this earthing mode is not required at all.
Neutral grounding through a low-frequency resistor: in this neutral grounding mode, the power of the final electric current (active current + capacitive current) of the short circuit exceeds 10 A. As a rule, in this mode, the single-phase final current exceeds 10A, that is, reaches tens or hundreds of A, which , in turn, requires the disconnection of a single-phase short circuit.
If the short circuit is permanent and the reactor has a certain time loop determined by the REG-DPA regulator, then a shunt resistor is connected (the time is from one to three seconds). The reactor’s REG-DPA digital controller drives a 500V shunt resistor contactor, and the contactor is connected to the second 500V power wave of the reactor.
Cases of damage to voltage transformers after grounding the neutral through NER-3000-182-40.5 resistors at 35kV substations have decreased. Tests carried out by Karelenergo specialists in a 35-kV network showed that after the elimination of a single-phase short circuit in a network with a grounded neutral through a resistor, the ferroresonance process is no longer observed [1].
A non-stationary arc process in the voltage range of 10-35 kV is a fairly common accident in power lines. The single-phase arcing process is followed by a flashing arc. Since these networks are often implemented at much shorter distances, these circuits are considered as circuits with collected parameters. Since the short circuit system is calculated using integral differential equations, attention should be paid to the boundary and initial conditions necessary to solve these problems.
Before expressing my own opinion on the areas of application of various neutral earthing systems in medium voltage networks, I would like to dwell on the following generally accepted and fairly well-known provisions.
The isolated neutral mode has the following advantage the low current generated by single-phase short circuits to earth. And this contributes to the following reasons:
• Increasing standby currents (single-phase short circuits of short circuits account for 90% of the total number of short circuits);
• reducing the requirements for grounding installations, determined by the conditions of electrical safety in case of single-phase short circuits to ground. But this mode also has some drawbacks (compared to effectively grounded neutral mode). This should include the following:
• ferroresonance phenomena as a result of a short-term SPE;
• Arc overvoltages associated with the formation of an alternating arc during an SFL and leading to a transition from a single-phase to a two- and three-phase short circuit;
• the complexity of building selective protection against SGF with isolated power supply and insufficient performance, which is absent in networks of various modes and configurations.
The advantages of isolated networks in many cases include its ability to continue to work with a single-phase short circuit, which literally increases the power supply to consumers. Practice shows that in most cases single-phase short circuits due to faults in the network quickly (and in most cases instantly) switch to two- and three-phase short circuits (see, for example, [4]), and the damaged line is still turned off [2].
At present, uninterrupted power supply is ensured mainly by a device with two-way supply and ASR (automatic start of the reserve).
Grounding through an arcing reactor allows, in certain cases, to reduce the short-circuit current to the ground before it is turned off, that is, to eliminate arc overvoltages. This, in turn, reduces the number of transitions from a single-phase earth fault to a two- and three-phase fault. Reducing the current of a single-phase earth fault improves the electrical safety conditions at the place of the fault, although it does not completely eliminate the possibility of electric shock in overhead line networks.
Disadvantages of grounding through arc quenching reactors (AQR):
• the need to symmetrize the network to a phase voltage of 0.75% (in networks with overhead lines, the degree of asymmetry is always at least 1-2%, and in twocircuit overhead lines it can normally reach 5-7%; according to the Rules for Technical Operation, in some cases, the neutral bias voltage can reach 30% of the phase voltage);
• complexity and high cost of automatic installation systems for automatic control systems (reactors with a mechanical installation are practically not operated); the inability to install a wide range, which is required for branched city networks with a frequently changing configuration compared to a supply substation;
• Almost complete absence of selective protection against single-phase short circuit n for the network with neutral grounding through automatic control system. With regard to the last drawback, it can be argued that the disconnection of a damaged connection with good capacitive current compensation is not absolute. Accepting this objection, one can only argue that the use of an arcing reactor is a way to maintain the emergency mode of a single-phase short circuit. However, it should be noted that this method is not cheap [2]. Neutral grounding through a resistor has a number of advantages, confirmed by world practice and experience:
• complete elimination of ferroresonance phenomena.
• reducing the degree of arc voltages and eliminating the transition of a single-phase earth fault to a two- and three-phase fault.
• the possibility of building a simple selective protection against single-phase earth faults. The following disadvantages can be attributed to resistive neutral grounding:
• increase in earth fault current (maximum 40%);
• heating of equipment at the substation (30-400 kW resistor). These shortcomings are of relatively minor importance for the following reasons:
• Short-circuit currents in networks with neutral grounding are thousands and tens of thousands of amperes; in networks of 10-35 kV, double short circuits to the ground lead to currents of hundreds and thousands of amperes. Networks in such conditions are successfully operated, and against this background, an increase in the current of a single-phase earth fault from 10 A to 14 A or even from 200A to 280A does not change the situation.
• The disadvantage caused by the heating of the resistor during a single-phase earth fault is more significant. But for other equipment, the allowable temperatures, determined by the rules for electrical installations and reaching 200- 300℃ in emergency modes, allow you to design a resistor that heats up only to temperatures that are below the specified limits [4]. Installing such a resistor on the battery virtually eliminates the issue of fire hazard.
Generator voltage networks are basically DC bus bridges. It is impossible to selectively turn off any field during a ground fault; it is necessary to turn off the generator itself as a result of generating an accurate voltage in zero sequence. Short-term operation of the generator before shutdown in low current conditions is possible with an isolated neutral. With a capacitance current of more than 5A, the insulation can be seriously damaged. For this reason, it is advisable to use an arcing reactor [5].
Auxiliary networks of power plants have a branched configuration, in contrast to generator voltage networks. This allows a single-phase earth fault to selectively trip the fault. Since these networks are carried out by cable lines, their degree of symmetry is sufficient for the use of an arcing reactor.
It is possible to use an isolated current in low-capacity currents, but in this case, a computational check of the network will be required in case of occurrence of ferro resonant phenomena. If such events are threatened, it is recommended to ground the neutral through a resistor. Long-term operation of the network during the EEO is less feasible, since such networks have a sufficient amount of backup facilities.
Selective disconnection of a faulty connection with relay protection is possible by grounding the neutral through a resistor.
If the decision is made to continue the operation of the network in time, single-phase earth fault at high-capacity currents, the best option (with accurate installation) is to use an arcing reactor. High current selective single-phase earth fault tripping with relay protection is well accepted when earthing the neutral through a resistor [3].
Based on the above ideas, we will try to determine the areas of effective application of various neutral grounding modes in medium voltage networks. These fields are reflected in the table depending on the type of network and the required parameters. In the first column – the classification of networks according to their configuration and features of operation, related to the methods of grounding the neutral. Table 1 shows the recommended neutral conditions for medium voltage networks [6, 7].
Table 1. Recommended neutral modes of medium voltage networks
.
Distribution networks with overhead lines are usually not symmetrical. At low currents, as in the previous case, it is possible to use an isolated neutral in the absence of prerequisites for the occurrence of ferroresonance phenomena. Changing the configuration and size of the network from an operational point of view can lead to the creation of such preconditions. At this time, it is also possible to increase the limits of the capacitance current. For this reason, the best and most versatile solution for such networks is to ground the neutral through a resistor. The introduction of an arc quenching reactor is problematic due to the existing asymmetry and a large range of changes in the capacitance current. As practice shows, arc-quenching reactors installed in such networks practically do not work anywhere.
There is a problem of short-term shutdowns of overhead lines in distribution overhead networks feeding oil and gas fields. This problem is due to the self-ignition technology of pump motors not working well enough. Therefore, such networks without fail work with the preservation of grounding. The use of an arc-suppression reactor in such cases is advisable only from the point of view of improving electrical safety conditions in case of a single-phase ground fault. And this requires accurate compensation of the capacitive current. During short circuits in overhead lines, arc processes, as a rule, do not occur.
Cable networks in cities and towns (without highvoltage lines) are symmetrical enough for the use of arcsuppression reactors, but, unlike power plant auxiliary networks, they have a constantly and significantly changing configuration, which requires a large installation range. The situation is aggravated by the fact that the supply substations and distribution networks of the city, where the arc extinguishing reactor is installed, in many cases have different, including operational and dispatching subordination. This requires the obligatory installation of a broadband arc quenching reactor. For this reason, a universal method for such networks is to ground the neutral through a resistor, which is also confirmed by extensive world experience.
Mobile substations and mechanisms, peat mines, mines and other supply networks clearly require the shutdown of a thermoelectric generator with relay protection. The neutral grounding mode through a resistor is the only reasonable mode, especially in the case of an extensive network.
In conclusion, it should be noted that the main point in determining the grounding mode of the network neutral is the decision to selectively disable or maintain the single-phase ground fault mode for a long time. While maintaining a single-phase earth fault, a choice can be made between all the neutral modes specified in the rules for electrical installations, taking into account the ideas presented in the current article [4]. If a single-phase earth fault is to be selectively switched off by relay protection, then the neutral earthing solution through a resistor is preferable.
Conclusions
The choice of one or another neutral grounding mode is extremely effective when it is necessary to operate the network for a long time with a single-phase ground fault. The need for long-term network maintenance in the event of such a failure arises only if backup is not available. At this time, the effective use of an arcing reactor is possible only in symmetrical networks that change without changing the configuration. In other cases, an isolated neutral predominates, and in some cases grounded through a resistor.
When disconnecting a connection with a single-phase closure by relay protection, in all cases it is preferable to ground the neutral through a resistor. Such an integrated solution eliminates all the disadvantages inherent in networks with insulation and compensated neutral, and brings medium voltage networks to a high level of electrical safety inherent in networks of 110 kV and above.
REFERENCES
[1] S.V.Rzayeva, N.S.Mammadov, N.A.Ganiyeva (2023) ”Overvoltages during Single-Phase Earth Fault in NeutralIzolated Networks (1035)kV”. Journal of Energy Research and Reviews. Volume 13, Issue 1, pp 7-13, 2023/ DOI: 10.9734/JENRR/2023/v13i1253 [2] S.V. Rzayeva, N.S. Mammadov, N.A. Ganiyeva (2022) “Neutral grounding mode in the 6-35 kv network through an arcing reactor and organization of relay protection against single-phase ground faults”. Deutsche internationale Zeitschrift für zeitgenössische Wissenschaft / German International Journal of Modern Science №42(22) pp.31-34 [3] Obabkov V.K. (2000) Multicriteria of the performance indicator of 6–35 kV networks and the problem of optimizing neutral grounding modes // Neutral grounding modes of 3–6–10–35 kV networks: Reports of the scientific and technical conference. – Novosibirsk, 2000. – pp. 33–41. [4] https://archi-monarch.com/guidelines-for-electricalinstallation/ [5] Chernenko N.A. (2000) Accident rate and earth faults in electrical networks with a voltage of 35 and 110 kV// Modes of grounding the neutral of networks 3–6–10–35 kV: Reports of a scientific and technical conference. – Novosibirsk, 2000. – pp. 83–88. [6] Piriyeva N.M., Rzayeva S.V., Mustafazadeh E.M. Evaluation of the application of various methods and equipment for protection from emergency voltage in 6-10 kv electric networks of oil production facilities // Интернаука: электрон.научн. журн. 2022. № 39(262). URL: https://internauka.org/journal/science/internauka/262 (дата обращения: 17.01.2024). DOI:10.32743/26870142.2022.39.262.346104 [7] Ahmedov E.; Rzayeva S.; Ganiyeva Nigar; Safiyev E.Improving the lightning resistance of high-voltage overhead power line Przeglad Elektrotechniczny . 2023, Vol. 2023 Issue 11, p121-126. 6p.
Source & Publisher Item Identifier: PRZEGLĄD ELEKTROTECHNICZNY, ISSN 0033-2097, R. 100 NR 8/2024. doi:10.15199/48.2024.08.32
Published by 1. Idris KUSUMA1, 2. R. RULIYANTA2, 3. Diah WIDIASTUTI, 4. Mohammad FATHONI Universitas Nasional (1, 2, 3), Institut Teknologi Budi Utomo (4) ORCID: 1.0009-0006-1808-2229; 2.0000-0002-2439-330X; 4.0009.0006.6439.5699
Abstract. Even though the government of the Republic of Indonesia has banned the use of R22, it is still widely found in industry. The problem is that the industry is reluctant to replace the current R22 because it will result in high initial investment costs. This research investigates the use of catalytic refrigerants to overcome high costs. This research investigates the electrical efficiency of several types of refrigerants. Utilizing catalysts in refrigerants can reduce electrical energy consumption. The result is that the R22 refrigerant can reduce electrical energy by up to 32.02%; the R32 reaches an efficiency of 26.94%, while the R410A reaches 21.43%. The novelty given in this research is the significant investment required compared to the electrical efficiency value provided.
Streszczenie. Mimo że rząd Republiki Indonezji zakazał stosowania R22, jest on nadal szeroko stosowany w przemyśle. Problem polega na tym, że branża niechętnie wymienia obecny R22, ponieważ będzie to wiązać się z wysokimi początkowymi kosztami inwestycji. W badaniu tym zbadano zastosowanie katalitycznych czynników chłodniczych w celu przezwyciężenia wysokich kosztów. W badaniu tym badana jest wydajność elektryczna kilku rodzajów czynników chłodniczych. Stosowanie katalizatorów w czynnikach chłodniczych może zmniejszyć zużycie energii elektrycznej. W rezultacie czynnik chłodniczy R22 może zmniejszyć zużycie energii elektrycznej nawet o 32,02%; R32 osiąga wydajność 26,94%, natomiast R410A osiąga 21,43%. Nowością wynikającą z tych badań jest wymagana znaczna inwestycja w porównaniu z podaną wartością sprawności elektrycznej. (Optymalizacja oszczędności energii elektrycznej poprzez wykorzystanie katalizatorów chłodniczych w sprężarkach)
Keywords: Power Efficiency, Refrigerant, Catalyst, Air Conditioning. Słowa kluczowe: Efektywność energetyczna, czynnik chłodniczy, katalizator, klimatyzacja.
Introduction
Indonesia is the largest country in the world, and the equator crosses it, so it has a tropical climate. Meanwhile, Indonesia’s AC (Air Conditioning) manufacturers are produced by sub-tropical countries such as Japan, Korea, and China. The rapid growth in using AC (air conditioning) equipment to overcome rising global temperatures has resulted in significant electrical energy consumption. As the main component in the refrigeration cycle, the AC compressor has a central role in determining the system’s overall efficiency [1], [2]. Developing energy-saving technology is crucial in responding to sustainability and energy efficiency [3]–[6]. The latest air conditioning technology uses inverters to save electricity [7], [8].
R22 is wholly prohibited from being used in 2030. On the other hand, the initial investment costs, or Capital Expenditure (CAPEX) for replacing the R22 refrigerant with another more environmentally friendly refrigerant type, are costly. This investment is considered an additional cost by the industry. Meanwhile, a cheaper Operating Expenditure (OPEC) is needed to run the company’s operations.
In recent years, using catalyst materials as supporting components in AC systems has become a promising research focus [9]–[12]. Catalyst materials can modify chemical reactions in the compressor, increasing the efficiency of the cooling process and, in turn, reducing electrical energy consumption [9]. Therefore, it is necessary to carry out in-depth research to evaluate and understand the impact of applying catalyst materials to AC compressors on saving electrical energy.
The problem behind this research is that in Indonesia, which has a tropical climate, almost 80% of energy consumption in a building is used for air conditioning systems. AC is the highest contributor to energy consumption for housing, offices, hospitals, shopping centres, and others [13], [14].
In this context, this research aims to investigate the potential of using catalyst materials in AC compressors as an innovative strategy to increase energy efficiency and reduce environmental impact. By better understanding the role of catalyst materials in optimizing the cooling cycle, this research can contribute to developing sustainable energysaving solutions in air conditioning technology.
Metode
Rising global temperatures resulting from climate change have increased demand for air conditioning (AC) equipment worldwide. While air conditioners provide thermal comfort to their users, their increased use has significantly impacted electrical energy consumption. The compressor is one of the main components in an AC system that is vital in determining energy efficiency. In recent decades, energy and environment research has focused on developing solutions to reduce energy consumption and environmental impacts. In this context, using catalyst materials in AC compressors has emerged as an attractive alternative to increase energy efficiency in the cooling cycle.
Refrigerant Catalysis is a process in which a substance called a catalyst accelerates the rate of a chemical reaction without undergoing permanent changes in its structure. In the context of AC compressors, catalysts change the chemical reaction mechanisms involved in the refrigeration cycle to increase the process’s efficiency. Catalysts reduce the activation energy required to reach a transition state in a chemical reaction. In AC compressors, catalysts can modify the molecules involved in air compression and cooling, increasing the reaction speed and reducing the energy required. Catalysts interact with molecules in chemical reactions through their active sites. In the context of AC compressors, catalyst materials can interact with air or refrigerant molecules, facilitating bond formation or structural changes that benefit energy efficiency.
Refrigerant Catalyst material’s ability to modify chemical reactions is expected to improve the performance of AC compressors. This catalyst material is relevant because it can optimize the cooling process, thereby reducing the need for electrical energy without sacrificing the quality of the resulting cooling [9]–[11]. Refrigerant vapour compression systems can use several liquids such as carbon dioxide, ammonia, hydrocarbons, and fluorinated molecules such as CFCs (chlorofluorocarbons), HFCs (hydrofluorocarbons), and HFOs (hydrofluoroolefins), [9].
Refrigerant fluids used today refer to environmentally friendly materials [15]. The type of refrigerant also varies greatly according to the type of compressor used [15]. Common environmentally friendly refrigerants include isobutane R600a, propane R290, propylene R1270, ethylene R1150, ethane R170, isopentane R601a, npentane R600, R23, R507, R134a, and others.
This research carried out measurements in an office building with three typical rooms. The measurement room area is 12 m2 with almost the same load. The indoor load is conditioned to be close to the same by using three different types of air conditioning. A Refrigerant Catalyst, or, for short, RC, is added to the refrigerant liquid for each room AC. Catalyst Refrigerant is an additive liquid that is mixed into the refrigerant. This liquid results from nanotechnology engineering [16]–[18]. Functions to make the cold point rise and be reached more quickly. The Catalyst Refrigerant added to the compressor is 10% of the refrigerant volume. The refrigerants used are R22, R32 and R410.
RC works by increasing the cold point of the refrigerant gas so that it can be reached more quickly and that electricity requirements (compressor cut-off time) can be reduced. RC can clean the evaporator pipes from the inside so that cold can flow easily. This condition can reduce the heat in the refrigerant gas so that the equipment lasts longer [9], [11]. Table 1 provides the specifications of the three types of measurements.
Table 1. Initial Measurement Conditions
.
Fig.1. Research Process Flowchart
The stages in this research are given in Figure 1. Several conditions need to be considered before injecting the catalyst into the compressor. The first condition is the performance of the compressor itself. The compressor must be in good working condition and not damaged. Next, ensure that the pipe installation is in good condition. A leaking pipe will be very detrimental because the liquid gas in the compressor will run out. Next, initial measurements are carried out to measure the energy consumption of the AC unit. This research used a kWh meter to monitor initial energy consumption. After the initial measurement process, the catalyst liquid is added to the compressor. 10% of the refrigerant is removed, and the catalyst is injected [19], [20].
The electricity consumption of each type of AC was measured in the initial measurements. We made observations for seven days. The AC is operated daily for 10 hours between 09.00 to 17.00 WIB. Table 2 presents data from the observations made.
Table 2. Observation results in 8 hours per day before using the catalyst
.
Results and Discussion
The electricity consumption of each type of AC was measured in the initial measurements. We carried out observations for seven days simultaneously. The AC is operated daily for 10 hours between 09.00 to 17.00 WIB. Table 2 presents data from the observations made.
Table 3. Measurement of electricity consumption after adding the refrigerant catalyst for 10 hours
.
The different load conditions of each room influence the amount of electrical energy consumption in Table 2. We use the existing load in the room and do not carry out detailed room load measurements. This research purely measures refrigerant performance on electricity consumption only.
Based on Table 2, using R32 produces the best electricity consumption efficiency compared to other refrigerants. The R32 consumes an average of 0.63 kWh of electrical energy per hour, and the R410A consumes 0.69 kWh of electricity. Meanwhile, R22 refrigerant is 0.89 kWh per hour. Next, we plot the data in a graph in Figure 2. The X-axis is the number of research days, and the Y-axis is the energy consumption for 10 hours of operation.
Fig.2. Graph of electricity consumption before and after adding the catalyst
Based on Table 1 and Table 2, a ratio of electricity consumption can be calculated before and after using the refrigerant catalyst, as shown in Figure 3.
Fig.3. Graph of electricity consumption efficiency for various types of refrigerants
This research only looks at refrigerant catalyst’s electrical energy consumption. At the same time, the basics of catalysts and the effects and chemical reactions of refrigerant catalysts still need to be investigated. From Figure 3, using a refrigerant catalyst efficiently reduces electricity consumption, especially for the R22 type. The use of R22 is prohibited. After all, it threatens environmental sustainability because it can damage the ozone layer. Applying catalysts to cooling systems using R22 refrigerant can provide several benefits, including the potential to increase energy efficiency and reduce environmental impact. However, it should be noted that using R22 itself has been linked to environmental issues, mainly because R22 belongs to chlorofluorocarbon hydrocarbons (HCFCs), which can damage the ozone layer.
Refrigerant Catalyst use in R32 reached 26.94%. Meanwhile, the R410 needs better efficiency, around 21.43%. It is necessary to consider the application of a catalyst to this type of refrigerant because both have different and higher-pressure characteristics than R22. Safety factors need to be considered.
Catalysts can be sensitive to changes in operational conditions, such as temperature or pressure. This variability may require special maintenance and settings to ensure optimal performance. From a CAPEC (Capital Expenditure) perspective, catalyst technology development, production, and implementation can involve significant costs. Highquality catalysts or highly specialised catalyst technologies can increase the initial investment costs.
Meanwhile, from the OPEC (Operational Expenditure) side, catalysts can be sensitive to changes in operational conditions, such as temperature or pressure. This variability may require special maintenance and settings to ensure optimal performance. Some catalysts may experience deactivation or structural changes over time, which can affect the stability and service life of the catalyst. Regular maintenance or catalyst replacement may be required to maintain system performance. The addition of a catalyst can increase the overall system complexity. This action may require design changes or additional technology integration, which can complicate system management and maintenance.
Based on Figure 3, the CAPEX for using this catalytic refrigerant at R22 will be achieved in 3.12 months. The investment costs for the R32 refrigerant type will be completed in 3.5 months. Meanwhile, R410A will get a return on investment in 4.6 months. The results of this calculation are only based on electricity consumption efficiency calculations. Meanwhile, other factors, such as investment in installing AC pipes, should be considered. Investment in AC pipes is only made if the condition of the pipes is not suitable.
According to environmental considerations, catalysts may produce by-products or be exposed to certain pollutants that may reduce their performance over time. The catalyst may necessitate additional measures to combat pollution or catalyst regeneration. Some types of catalysts can contain ingredients that have environmental impacts. Therefore, developing environmentally friendly catalysts is essential to reduce potential negative consequences.
Conclusion
This research only focuses on investigating electricity consumption. Utilizing catalysts in refrigerants can reduce electrical energy consumption. The R22 refrigerant can reduce electrical energy by up to 32.02%; the R32 reaches an efficiency of 26.94%, while the R410A reaches 21.43%. The investment costs for the R32 refrigerant type will be achieved in 3.5 months. Meanwhile, R410A will get a return on investment in 4.6 months. The use of catalysts in R22 is expected to overcome environmental conservation issues. The use of a refrigerant catalyst depends on the piping conditions. When choosing a catalyst, it can be adjusted to a more environmentally friendly material that is not harmful when operated.
REFERENCES
[1] Y. Pan, “Review of energy saving technologies research in HVAC systems,” E3S Web Conf., vol. 438, p. 01006, 2023, doi: 10.1051/e3sconf/202343801006. [2] J. Dadzie, I. Pratt, and J. Frimpong-Asante, “A review of sustainable technologies for energy efficient upgrade of existing buildings and systems,” IOP Conf. Ser. Earth Environ. Sci., vol. 1101, no. 2, 2022, doi: 10.1088/1755- 1315/1101/2/022028. [3] DJEBKTE-KESDM, “Pedoman Investasi Efisiensi Energi,” p. xxviii, 2021. [4] U. M. Sugeng and A. P. Agung, “Sistem Tata Udara Di Gedung Mina Bahari Iii Kantor Pusat Kementerian Kelautan Dan,” Presisi, vol. 23, no. 2, pp. 51–59, 2021. [5] A. Zakiyah, A. Lomi, and F. Handoko, “Manajemen Energi Penggunaan Pendingin Udara Pada Gedung Perkantoran Universitas Islam Malang,” J. Teknol. Dan Manaj. Ind., vol. 4, no. 2, pp. 24–28, 2018, doi: 10.36040/jtmi.v4i2.241. [6] A. Aziz, “Perangkat Pengkondisian Udara ( Air Conditioning ),” pp. 7–8, 2006. [7] R. Ruliyanta et al., “A Comparative Case Study of Smart and Green Buildings and Their Impact on Power Quality,” no. September, pp. 1–5, 2023, doi: https://doi.org/10.1109/EECSI59885.2023.10295810. [8] R. Ruliyanta, R. A. Suwodjo Kusumoputro, R. Nugroho, and E. R. Nugroho, “A Novel Green Building Energy Consumption Intensity: Study in Inalum Green Building,” 2022 IEEE Reg. 10 Symp., pp. 1–6, 2022, doi: 10.1109/tensymp54529.2022.9864532. [9] R. M. Bellabarba, “Catalysts for modern fluorinated refrigerants,” J. Fluor. Chem., vol. 244, no. January, p. 109741, 2021, doi: 10.1016/j.jfluchem.2021.109741. [10] B. C. Purnomo and M. Setiyo, “Karakteristik Sistem Refrigerasi Kompresi Uap Dengan Refrigerant Campuran Musicool 134 – Co2,” J. Teknol., vol. 9, no. 2, p. 57, 2017, doi: 10.24853/jurtek.9.2.57-64. [11] I. G. Trukshin et al., “Synthesis of ozone-safe freons and methods for improving the Russian industrial catalyst for their production,” Catal. Ind., vol. 2, no. 4, pp. 307–314, 2010, doi: 10.1134/S2070050410040033. [12] P. O. Sutrisna and G. P. Suryawan, “Potensi Penghematan Energi Kompresor melalui Replacement Kompresor Menuju Type AF OPC 55-10,” Bakti Sar., vol. 11, no. 02, pp. 81–87, 2022. [13] R. Ruliyanta; Wismanto Setyadi, “PENDAMPINGAN PENGUKURAN PROFILE BEBAN LISTRIK,” J. Masy. Mandiri, vol. 7, no. 4, pp. 3880–3889, 2023, doi: https://doi.org/10.31764/jmm.v7i4.16480. [14] Balai Besar Teknologi Konversi Energi B2TKE-BPPT, “Benchmarking Specific Energy Consumption Di Bangunan Komersial,” 2020, [Online]. Available: http://www.b2tke.bppt.go.id. [15] Danfoss, “Refrigerant options now and in the future [White paper],” no. December, 2012, [Online]. Available: https://www.danfoss.com/media/7174/low-gwp-whitepaper.pdf. [16] K. Mallikarjuna, K. HemachnadraReddy, and M. NagaRaju, “Experimental investigation on nano refrigeration using TiO2 CuO and Al2O3 as refrigerants,” Mater. Today Proc., no. xxxx, 2023, doi: 10.1016/j.matpr.2023.07.044. [17] A. S. Majgaonkar, “Use of Nanoparticles In Refrigeration Systems : A Literature Review Paper * Corresponding Author,” Int. Compress. Eng. Refrig. Air Cond. High Perform. Build. Conf., pp. 1–10, 2016. [18] Z. Said et al., “Nano-refrigerants and nano-lubricants in refrigeration: Synthesis, mechanisms, applications, and challenges,” Appl. Therm. Eng., vol. 233, no. July, p. 121211, 2023, doi: 10.1016/j.applthermaleng.2023.121211. [19] S. M. Abegunde, K. S. Idowu, O. M. Adejuwon, and T. Adeyemi-Adejolu, “A review on the influence of chemical modification on the performance of adsorbents,” Resour. Environ. Sustain., vol. 1, no. July, p. 100001, 2020, doi:10.1016/j.resenv.2020.100001. [20] M. Kassas, “Modeling and simulation of residential HVAC systems energy consumption,” Procedia Comput. Sci., vol. 52, no. 1, pp. 754–763, 2015, doi: 10.1016/j.procs.2015.05.123.
Authors: R. Ruliyanta, Department of Electrical Engineering, Universitas Nasional, Jl. Sawo Manila No. 61, Jakarta, 12520, Indonesia. Email: ruliyanto@civitas.unas.ac.id.
Source & Publisher Item Identifier: PRZEGLĄD ELEKTROTECHNICZNY, ISSN 0033-2097, R. 100 NR 10/2024. doi:10.15199/48.2024.10.63
Published by Aleksander CHUDY, Department of Electrical Engineering and Electrotechnology, Faculty of Electrical Engineering and Computer Science Lublin University of Technology, ORCID: 0000-0002-3183-8450
Abstract. The case of study were 7 on-board EV chargers. The majority of current harmonics emission measurements during light-duty EVs charging took place in private garages of single-family houses in the Lublin Voivodeship between February and May 2022 and the remaining tests were carried out in Lublin University of Technology building and at the PGE Dystrybucja S.A. building in Lublin. The results show that 5 of the 7 EVs tested met the requirements of PN-EN 61000-3-2 and PN-EN 61000-3-12.
Streszczenie. Obiektem badań było 7 pokładowych ładowarek pojazdów elektrycznych. Większość pomiarów emisji harmonicznych prądu podczas ładowania samochodów elektrycznych przeprowadzono w prywatnych garażach domów jednorodzinnych w województwie lubelskim w okresie od lutego do maja 2022 r., a pozostałe testy przeprowadzono w budynku Politechniki Lubelskiej oraz przy budynku PGE Dystrybucja S.A. w Lublinie. Wyniki pokazują, że 5 z 7 badanych egzemplarzy pojazdów elektrycznych spełniło wymagania norm PN-EN 61000-3-2 i PN-EN 61000-3-12. (Emisja harmonicznych prądu ładowarek pokładowych pojazdów elektrycznych)
Keywords: electromobility, harmoniczne prądu, electric vehicle charging, power quality Słowa kluczowe: elektromobilność, current harmonics, ładowanie pojazdów elektrycznych, jakość energii elektrycznej
Introduction
On-board electric vehicle (EV) chargers play a crucial role in providing EV owners with the ability to recharge their vehicles conveniently at home or in other locations. However, as the number of EVs on the road continues to rise, concerns regarding the impact of these chargers on the electrical grid have emerged. Electric vehicle integration into the power grid can have a significant impact on the power quality (PQ) parameters. According to many modelling and simulation research the increasing share of EVs in the road transport sector will result in increased peak demand, the presence of higher levels of voltage and current harmonics and other problems related to PQ parameters, which need to be identified and then eliminated or mitigated.
One of the most important aspects of on-board EV chargers that has drawn attention is their aforementioned current harmonic emission as these devices are non-linear loads. When an EV charger is connected to the power grid, it draws electric current to charge the vehicle’s battery. However, the interaction between the charger and the grid can result in the generation of harmonics, which are undesirable deviations from the standard sinusoidal waveform of the grid’s voltage and current.
To address these issues, PN-EN 61000-3-2 and PN-EN 61000-3-12 standards have been established to limit the current harmonic emissions of electrical and electronic equipment having a rated input current ≤ 16 A per phase and equipment connected to public low-voltage systems with input current > 16 A and ≤ 75 A per phase respectively. These regulations aim to assure charger-grid compatibility, decrease the detrimental impact of harmonics, and maintain the appropriate level of PQ parameters. Compliance with these criteria is critical for manufacturers to guarantee the safe and efficient operation of on-board EV chargers while reducing their effect on the electrical grid.
The aim of the research was to measure current harmonics emission of 7 on-board EV chargers and check their compatibility with PN-EN 61000-3-2 and PN-EN 61000-3-12 standards.
Methodology
The case of study were 7 on-board EV chargers. The majority of current harmonics emission measurements during light-duty EVs charging took place in private garages of single-family houses in the Lublin Voivodeship between February and May 2022 and the remaining tests were carried out in Lublin University of Technology building and at the PGE Dystrybucja S.A. building in Lublin (Fig 1). Depending on the availability of a given PQ analyser and the possibility of measuring with given current clamps, 2 PQ analysers were used for the tests: Sonel PQM-711 (IEC 61000-4-30 Class A; Sonel C-5A or Sonel F-2 current clamps) and Chauvin Arnoux 8336 (IEC 61000-4-30 Class B; Chauvin Arnoux MA193 or PAC93 current clamps). Due to the nature of the load, which are the EV chargers, the averaging time has been configured as short as possible to identify the start, momentary interruption or end of EV charging (10 cycles – 200 ms; nominal frequency of 50 Hz for Sonel PQM-711 and 1 s for Chauvin Arnoux 8336).
The average harmonic current for each EV was assessed against the PN EN 61000-3-2 and PN-EN 61000-3-12 limits even though EVs charged at 11 kW were not required to comply with the PN-EN 61000-3-2 standard. In the analysis the charging process was divided into two stages: constant current (CC) mode and constant voltage (CV) mode.
Table 1 presents technical specifications: EV model, charging mode, active energy consumed, Electric Vehicle Supply Equipment, PQ analysers and measuring clamps used.
Fig.1. Setup during measurements of power quality parameters during Nissan Leaf charging at PGE Dystrybucja building in Lublin (Sonel PQM-711 PQ analyser and Sonel F-2 current clamps)
Table 1. Technical specifications: EV model, charging mode, active energy consumed, Electric Vehicle Supply Equipment, PQ analysers and measuring clamps used
.
Results and discussion
The owners of the four EVs refused to carry out a full charge, arguing with the advice given by the vehicle dealers that full charging in CV mode should take place occasionally, for example once a month, or when a long journey is planned. When the EVs were connected, the charging current values increased very quickly to the expected value (within 1-2 seconds). In the analysis of the current harmonic content, the values recorded approximately 10 seconds after the start of charging were taken into account. Table 2 presents the assessment of the compliance of the permissible harmonic current levels of on-board EV chargers with the PN-EN 61000-3-2 and PN-EN 61000-3-12 standards.
Table 2. Assessment of current harmonics emission of individual vehicles against PN-EN 61000-3-2 and PN-EN 61000-3-12
.
Fig.2. Current harmonics emission during Mercedes e-Vito charging (CC mode)
Mercedes e-Vito on-board charger (6.6 kW; < 16 A per phase) did not meet the requirements of PN EN 61000 3- 2:2014 due to excessive values of the 15th (0.19 A) and 21st (0.14 A) harmonics of the L1 phase voltage . The requirements of PN-EN 61000-3-2:2014 and PN-EN 61000-3-12:2012 were also not met for the Tesla Model 3 in both charging modes. In CC mode (Fig. 3.), the 11th (4.53% – L1, 3.74% – L2, 3.94% – L3) and 13th (2.21% – L1, 2.49% – L2, 2.46% – L3) harmonics were exceeded, while in the case of CV mode (Fig. 4.), the exceedances were for the 7th (10.75% – L1, 10.96% – L2, 9.67% – L3), 9th (4.35% – L1), 11th (9.12% – L1, 8.02% – L2, 8.69% – L3) and 13th (4.10% – L1, 4.45% – L2, 3.95% – L3) harmonics.
The THDI and PWHD values in each case analysed were in accordance with PN-EN 61000-3-12:2012 and ranged from 3.37 % (Kia e Niro, CC mode) to 17.71 % (Tesla Model 3, CV mode) and from 2.63 % (Nissan Leaf, CC mode) to 22.26 % (Tesla Model 3, CV mode), respectively. The values of these coefficients were significantly lower in CC mode, indicating a higher percentage of current harmonics in CV mode, for example, for the Tesla Model 3 the THDI value in CC mode was 8.20% and the PWHD value was 12.77 %.
At each location, during EVs charging, the 95th percentile values of the voltage harmonics were well below the values allowed by PN-EN 50160:2010, however it should be noted that the rms values of the phase voltages and the values of the odd voltage harmonics (mostly up to the nineteenth order) measured before, during and after charging at the destinations did not comply with the requirements of PN-EN 61000-3-2:2014 and PN-EN 61000-3-12:2012 in each case analysed. The 95th percentile values of the dominant voltage harmonics were the highest at locations where Mercedes e Vito, Tesla Model 3 and Hyundai Kona Electric were being charged. Figure 5 presents the 95th percentile values of voltage harmonics averaged from all test locations.
Fig.3. Current harmonics emission during Tesla Model 3 charging (CC mode)
Fig.4. Current harmonics emission during Tesla Model 3 charging (CV mode)
Fig.5. Averaged voltage harmonic spectrum (95th percentile) from all charging locations
Conclusions
An analysis of the harmonic content of current during the charging processes of light-duty EVs in CC mode showed that this stage lasts longer and occurs more frequently than charging in CV mode, so that multiple EVs are more likely to be charged simultaneously in this mode. The results of the measurements of the current harmonic from the charging systems of the seven EVs show that the tested Mercedes e-Vito does not meet the requirements of the PN-EN 61000-3-2:2014 standard in CC mode, while the Tesla Model 3 does not comply with the requirements of PN-EN 61000-3-2:2014 and PN-EN 61000-3-12:2012 standards in CC and CV modes. Charging in CV mode is characterised by a higher percentage of harmonic current, but the rms values of the harmonics are lower than when charging in CC mode.
The exceedances of voltage harmonics are interesting and raise two questions:
• Would non-compliance be observed if the rms values of the supply voltages and voltage harmonics were within the relevant limits?
• Could this mean that the requirements for the rms value of supply voltages and voltage harmonics are inadequate or the current harmonic limits need to be increased to reflect the increased emissions under higher background voltage harmonics present in real networks?
Based on the obtained results possible directions for further research are long-term studies of power quality parameters at a frequently used charging point to assess the content of current harmonics from different EVs and assessment of the impact of charging light-duty EVs on power quality parameters at the connection points of several charging stations operating simultaneously.
This work was supported by Lublin University of Technology grant no. FD-20/EE-2/403.
REFERENCES
[1] Khan W., Ahmad A., Ahmad F., Saad Alam M., A Comprehensive Review of Fast Charging Infrastructure for Electric Vehicles, Smart Science, 120 (2018), No 11, 1-15 [2] Chudy A., Mazurek P., Electromobility – the Importance of Power Quality and Environmental Sustainability, J. Ecol. Eng., 20 (2019), No 10, 15-23 [3] Nour M., Chaves-Ávila J. P., Magdy G., Sánchez-Miralles Á., Review of Positive and Negative Impacts of Electric Vehicles Charging on Electric Power Systems, Energies, 13 (2020), No 18 [4] Das H. S., Rahman M. M., Li S., Tan C. W., Electric vehicles standards, charging infrastructure, and impact on grid integration: A technological review, Renewable and Sustainable Energy Reviews, 120 (2020) [5] Chudy A., Mazurek P., Ultra–fast charging of electric bus fleet and its impact on power quality parameters, Przegląd Elektrotechniczny, 1 (2023), No 1, 296-299 [6] Mazurek P., Chudy A., An Analysis of Electromagnetic Disturbances from an Electric Vehicle Charging Station, Energies, 15 (2022), No 1 [7] Chudy A., Hołyszko P., Mazurek P., Fast Charging of an Electric Bus Fleet and Its Impact on the Power Quality Based on On-Site Measurements, Energies, 15 (2022), No 15 [8] Kutt L., Saarijarvi E., Lehtonen M., Molder H., Niitsoo J., Electric vehicle charger load current harmonics variations due to supply voltage level differences – Case examples. In: 2014 International Symposium on Power Electronics, Electrical Drives, Automation and Motion (SPEEDAM); IEEE, (2014), 917-922 [9] Collin A. J., Xu X., Djokic S. Z., Moller F., Meyer J., Kutt L., Lehtonen M., Survey of harmonic emission of electrical vehicle chargers in the European market. In: 2016 International Symposium on Power Electronics, Electrical Drives, Automation and Motion (SPEEDAM); IEEE, (2016), 1208-1213 [10]Möller F., Meyer J., Klatt M., Lakenbrink C., Vasile P., Holder R., Impact Of High Penetration Of Battery Electric Vehicles On Power Quality In Central And Distributed Charging Infrastructure. In: CIRED 2021 – The 26th International Conference and Exhibition on Electricity Distribution; Institution of Engineering and Technology, (2021), 955-959 [11]Mariscotti A., Harmonic and Supraharmonic Emissions of Plug-In Electric Vehicle Chargers, Smart Cities, 5 (2022), No 2, 496-521
Author: mgr inż. Aleksander Chudy, Department of Electrical Engineering and Electrotechnologies, Lublin University of Technology, Nadbystrzycka Street 38A, 20-618 Lublin, e-mail: a.chudy@pollub.pl
Source & Publisher Item Identifier: PRZEGLĄD ELEKTROTECHNICZNY, ISSN 0033-2097, R. 101 NR 1/2025. doi:10.15199/48.2025.01.25
Published by Dranetz Technologies, Inc. Tech Tip: What Makes a Power Quality Problem Worth Solving?, Website: Dranetz.com
Most power quality events won’t shut you down. But when they do, they cost more than just a headache.
The challenge isn’t detecting power quality problems. That’s the easy part. The real question is: Do those issues actually matter to your operation? A dip, a transient, a bit of harmonic distortion—none of these are problems on their own. They’re only problems if your systems are vulnerable to them.
Let’s walk through how to determine that, and why proactive monitoring saves more than it costs.
What’s a Power Quality Problem—Really?
Power quality issues come in many shapes:
• Voltage sags or dips • Transients • Swells • Harmonics • Flicker • Interruptions
But none of these are problems unless they affect your systems. If your equipment can handle the wave shape irregularities without missing a beat, no action needed.
The problem comes when susceptibility meets exposure. If your equipment can’t tolerate a dip—or if enough of them add up over time—it’s not just a nuisance. It’s a liability.
For example, during a commissioning test at a data center, step-load tests were used to validate backup generator performance. Monitoring showed voltage stayed within spec during most of the test, but during a 100% impulse load, frequency dipped below 55 Hz. That momentary dip didn’t trip any alarms—but it did reveal the system was skating close to the edge of its tolerance. If the team hadn’t been monitoring, they wouldn’t have known the frequency drift was that severe—or that it could jeopardize compliance with generator specs and UPS tolerances under full load.
Think Beyond the Event: Consider the Cost
Even if your systems are sensitive, that still doesn’t make every event worth fixing. The second piece of the equation is economic exposure.
• What’s the cost of downtime? • How long does recovery take? • What does mitigation cost, and how long until it pays off?
If a $10,000 UPS avoids a $50,000 shutdown every six months, it’s a no-brainer. If that same UPS is protecting a non-critical load that goes offline once a year with minimal impact, that money’s better spent elsewhere.
Smart PQ strategy lives in this gray area—balancing cost, risk, and resilience.
Monitoring Is Your Early Warning System
You can’t make informed decisions if you don’t have the data. That’s where power quality monitoring comes in.
It helps you:
• Spot problems before they escalate (like signs of capacitor switching issues before they damage gear) • Analyze fault cause and location (so you can stop guessing whether it was utility-side or internal) • Protect mission-critical systems with targeted mitigation • Avoid finger pointing—back your ops team with facts
We sometimes call monitoring the DVR for your facility. When someone says, “Something went wrong at 10:42 a.m.,” you can pull the data and say exactly what happened—and just as important, what didn’t.
Where Do These Problems Start?
According to industry data, around 70% of power quality problems originate inside the facility. Not from the utility.
That means most PQ issues are your responsibility. And the good news is that’s also where you have the most control.
Internal culprits include:
• Adjustable speed drives • Poor grounding or wiring • Load switching • Microprocessor-based devices with high sensitivity
Knowing what your system is doing—not just what the utility’s sending you—makes all the difference.
A Tier III data center, for instance, kept experiencing unexplained voltage sags that caused certain racks to reboot intermittently. At first, the center’s technical team suspected issues upstream with the utility feed. But Class A monitoring showed the culprit was internal: a large HVAC unit cycling on under load.
Every time it kicked in, the inrush current created a brief but deep enough sag on the same panel feeding sensitive IT equipment. The monitoring data clearly tied event timestamps to HVAC cycles.
The fix? They added a soft start controller to the HVAC system and moved key server racks to a separate, isolated circuit. No finger pointing. Just facts—and a stable facility..
Standards That Keep You Honest
If you’re investing in monitoring, data consistency matters. That’s why IEC 61000-4-30 Class A compliance is a non-negotiable for serious applications.
It ensures:
• Repeatable, trusted measurements • Side-by-side comparability between meters • Confidence when using data for reporting or compliance
You’ll find this in our HDPQ line—and we were the first to offer it.
“If two meters give you two different answers, you can’t trust either. Class A compliance fixes that.” — Ross Ignall, Dranetz Director of Product Management, Marketing & Technical Support
Even if your utility doesn’t require it, compliance with these standards protects you. They give you confidence when you’re justifying upgrades or troubleshooting downtime.
Wrap-Up: PQ Is About What You Can Control
You can’t stop lightning. You can’t change your neighbor’s harmonic emissions. But you can understand how your systems respond to power quality events—and make smart decisions based on that.
Start with the basics:
• Know your susceptibility • Understand your exposure • Monitor proactively • Use data you can trust
Key takeaway: Monitoring doesn’t just catch problems—it helps you avoid them in the first place.
Stop guessing. Start knowing.
The Dranetz HDPQ line gives you trusted, Class A power quality data—so you can spot problems early, prove what’s happening, and protect what matters.
Published by Dranetz Technologies, Inc. Tech Tip: Power Quality Standards: What You Need to Know, Website: Dranetz.com
If you’ve ever connected two different power quality meters to the same circuit and gotten different results, you’re not alone. It’s an age-old issue in power quality monitoring. And when it happens, the obvious question is: which reading should you trust?
That’s where power quality standards come in. But knowing which ones apply, especially in the U.S., isn’t always straightforward. This article will walk you through the key differences, why measurement consistency matters, and how to choose the right meters to get accurate, defensible data.
Why Standards Matter
When your system throws a red flag and you need answers fast, the last thing you want is to question your readings. Whether you’re presenting findings to management or troubleshooting a system issue, reliable and repeatable PQ measurements are non-negotiable.
Standards help take doubt off the table. They outline the acceptable limits for power quality parameters and how those parameters should be measured. That second part—how—is often overlooked but critical.
Compliance Standards vs. Monitoring Standards
There’s a meaningful difference between compliance standards and monitoring standards, even though they’re closely related.
• Compliance standards define acceptable performance. They set the pass or fail thresholds for things like voltage harmonics, flicker, or power factor. For example, IEEE 519 provides limits for harmonic distortion in power systems.
• Monitoring standards define how those parameters must be measured. This includes everything from sampling to signal processing methods to accuracy tolerances. If you’re not measuring things the right way, it doesn’t matter how strict your compliance thresholds are. Your conclusions could still be off.
In short, compliance standards tell you what to measure and whether the result is acceptable. Monitoring standards tell you how to measure it accurately and consistently. Without both, the data can’t be trusted.
IEEE and IEC: How They Fit Together
In the U.S., we engineers rely on IEEE recommended practices. These are well-regarded and form the foundation for many of our technical decisions. But they haven’t always kept pace with the advances in PQ measurement standards that other regions have adopted.
That’s where the IEC 61000-4-30 standard comes into play. Developed by the International Electrotechnical Commission, it offers a complete framework for how power quality parameters should be measured. It has become the global reference standard, including for many U.S. applications.
IEEE standards like 519 (harmonics) and 1459 (flicker) have started incorporating IEC measurement methods. This is a step in the right direction. Still, for PQ events like sags, swells, and interruptions, IEC 61000-4-30 remains the more comprehensive guide.
Why This Matters in the U.S.
Unlike Europe, where IEC 61000-4-30 Class A meters are often required, the U.S. market is less standardized. There is a mix of older instruments, varied interpretations of IEEE guidelines, and inconsistent data reporting from one facility to the next.
That inconsistency can make it hard to prove a point when you need to. It becomes especially challenging if:
• You’re trying to pinpoint the root cause of downtime • You need to show whether the problem is internal or with the utility • You’re justifying infrastructure upgrades • You’re presenting data to leadership and need full confidence in the numbers
Using a power quality meter that is fully compliant with IEC 61000-4-30 Class A Edition 3 helps resolve these issues. It ensures your measurements are accurate and consistent, regardless of brand or location.
First to Conform to IEC 61000-4-30
Dranetz was the first manufacturer to meet IEC 61000-4-30 Class A requirements. You can be assured our HDPQ family of meters are fully compliant and offer reliable and repeatable measurements.
What to Look For
If you’re in facilities, utilities, or any operation where uptime and compliance are priorities, choose a meter that meets IEC 61000-4-30 Class A Edition 3 requirements. These instruments:
• Provide accurate, standardized measurements of sags, swells, harmonics, flicker, frequency, and more
• Are validated through certified testing defined by IEC 62586
• Support your efforts to meet U.S. standards like IEEE 519-2014 and beyond
Dranetz was the first to bring a fully IEC 61000-4-30 Class A compliant meter to market. Our HDPQ Plus family meets both IEC and IEEE standards, giving you dependable data when it matters most. What’s more, we are certified to IEC 62586 and have the certificate to prove it. Others in the industry claim compliance, but never prove it.
Published by Andi Abdul Halik LATEKO1, Yusri Syam AKIL2, Universitas Muhammadiyah Makassar (1), Hasanuddin University (2) ORCID: 1. https://orcid.org/0000-0002-9002-131X
Abstract. This paper employs a Vector Error Correction Model (VECM) analysis to investigate the influence of economic growth (GDP) and investment (FDI) on electricity consumption (EPC) in Indonesia. By examining annual data from 1971-2019, the study explores the short-term dynamics and long-run equilibrium relationships among the variables. A negative relationship is observed between EPC and GDP in the long run, while a negative relationship exists between EPC, GDP, and FDI in the short term. The short-run analysis reveals that GDP significantly influences EPC at the three-year horizon, and FDI has a significant negative effect on EPC at the one- and two-year horizons. Another result concerning the causality test indicate a unidirectional relationship between EPC and GDP, while EPC and FDI exhibit bi-directional causality. The findings underscore the influential role of GDP and FDI in driving changes in EPC. Understanding these relationships is crucial for policymakers and energy planners in effectively managing electricity demand, infrastructure investments, and sustainable economic growth. This research contributes to the existing literature by providing insights specific to Indonesia, guiding decision-making processes regarding energy infrastructure development, energy efficiency measures, and sustainable economic development.
Streszczenie. W artykule wykorzystano analizę Vector Error Correction Model (VECM) w celu zbadania wpływu wzrostu gospodarczego (PKB) i inwestycji (BIZ) na zużycie energii elektrycznej (EPC) w Indonezji. Analizując dane roczne z lat 1971-2019, badanie bada krótkoterminową dynamikę i długookresowe relacje równowagi między zmiennymi. W długim okresie obserwuje się ujemną zależność między EPC a PKB, podczas gdy w krótkim okresie istnieje ujemna zależność między EPC, PKB i BIZ. Analiza krótkookresowa ujawnia, że PKB istotnie wpływa na EPC w horyzoncie trzyletnim, a BIZ mają znaczący negatywny wpływ na EPC w horyzoncie rocznym i dwuletnim. Kolejny wynik dotyczący testu przyczynowości wskazuje na jednokierunkową zależność między EPC a PKB, podczas gdy EPC i BIZ wykazują dwukierunkową przyczynowość. Odkrycia podkreślają wpływową rolę PKB i BIZ w napędzaniu zmian w EPC. Zrozumienie tych zależności ma kluczowe znaczenie dla decydentów i planistów energetycznych w skutecznym zarządzaniu zapotrzebowaniem na energię elektryczną, inwestycjami w infrastrukturę i zrównoważonym wzrostem gospodarczym. Badania te wnoszą wkład do istniejącej literatury, dostarczając spostrzeżeń specyficznych dla Indonezji, kierując procesami decyzyjnymi dotyczącymi rozwoju infrastruktury energetycznej, środków efektywności energetycznej i zrównoważonego rozwoju gospodarczego. (Analiza VECM dotycząca wpływu wzrostu gospodarczego i inwestycji na zużycie energii elektrycznej w Indonezji)
Keywords: Vector Error Correction Model, economic growth, investment, electricity consumption, Indonesia. Słowa kluczowe: Vector Error Correction Model, wzrost gospodarczy, inwestycje, zużycie energii elektrycznej, Indonezja.
Introduction
The relationship between economic growth, investment (particularly foreign direct investment – FDI), and electricity consumption has received significant attention in the literature. Understanding this relationship is crucial for policymakers and energy planners in formulating effective strategies for sustainable energy development. In the context of Indonesia, a rapidly growing economy in Southeast Asia, it becomes imperative to examine the impact of economic growth and FDI on electricity consumption.
A number of studies have investigated the relationship between economic growth and electricity consumption. For instance, in [1] conducted a study for the middle east and south Africa and found evidence of a positive relationship between economic growth and energy consumption. Similarly, in [2] examined OECD countries and observed a bidirectional relationship between GDP and non-renewable electricity consumption. Next a study for Tunisia found longrun bi-directional causality between GDP and energy consumption [3]. For the impact of FDI on energy consumption, it has also been explored as can be found in the literatures [4-6]. In [4] investigated Pakistan countries and identified a positive relationship between FDI and energy consumption. In [5] focused on Bangladesh and found a bi-directional causality between FDI and energy consumption. Meanwhile in [6] analysed European countries and established a positive and strong relationship between FDI and energy consumption.
Regarding methods for analysis, the VECM approach has been widely used in many studies. For example, in [7] employed a VECM framework to examine the relationship between CO2 emissions, energy consumption, and economic growth in Pakistan and found evidence of a positive and significant relationship between them. In [8] investigated the causal effects between CO2 emissions, use of energy, GDP, and population in India using ARDL and VECM methods and revealed a positive relationship between GDP and energy use.
Moreover, country-specific studies have been conducted to explore the relationship between economic growth, FDI, and electricity consumption. For example, in [9] investigated the impact of renewable energy consumption, GDP, and FDI in Kazakhstan and Uzbekistan. Their study highlighted a two-way relationship between FDI and renewable energy consumption in these two countries. In [10] analysed China and found a positive relationship between renewable energy, FDI, and economic growth. Besides that, several studies have examined the relationship between the two variables and energy consumption using advanced econometric techniques [11-14]. The authors in [11] conducted a causality analysis between energy consumption, FDI, and GDP for several countries (Mexico, Indonesia, Nigeria, and Turkey), and established a long-run equilibrium relationship between these variables. In [12] examined Benin countries and found a significant long-run relationship of electricity consumption, FDI, and GDP. In [13] focused on 13 MENA countries and observed a positive relationship between energy consumption, ICT, FDI, and economic growth. Another study in [14] employed a decomposition scale approach to investigate the impact of financial development and FDI on renewable energy consumption for 39 countries.
The existing literatures provide valuable insights into the relationship between economic growth, FDI, and electricity consumption for some different countries. However, limited research has been conducted specifically for Indonesian context. This study proposes a VECM approach to analyse the impact of economic growth and FDI on electricity consumption in Indonesia. The analysis focus on the short-term dynamics and long-run equilibrium relationships between the observed variables. Besides can fill the research gap, resulted information can provide more insights for decision-making processes regarding energy infrastructure development, energy efficiency measures, and sustainable economic development in Indonesia. Some related studies for the context of Indonesia can be found in [11, 15-16].
The remainder of the paper organized as follows. The second section describes data and methodology. In Section 3, the obtained results and analyses for each stage are highlighted. In the final section, the conclusion and future works of the study are presented.
Methodology
The analysis in this study focuses on examining the relationship between Electric Power Consumption (EPC), Gross Domestic Product (GDP), and Foreign Direct Investment (FDI) in Indonesia over a period of 48 years, from 1971 to 2019. The data for each variable is obtained from the World Bank [17]. Figure 1 provides a visual representation for the trend of each variable over the years. It is evident from the figure that EPC, GDP, and investment have shown a consistent increase. For instance, the per capita primary energy consumption has risen from 14.2969 kWh in 1971 to approximately 1084 kWh in 2019. Similarly, the GDP has grown from 9.333 billion USD in 1971 to 1119.099 billion USD in 2019, while investment has increased from 0.299 billion USD in 1971 to 24.993 billion USD in 2019. The increasing trends in these variables make it intriguing to investigate their interrelationships further. To do so, this study employs co-integration and causality analyses, including unit root tests to assess data stationarity, lag selection processes for determining optimal lag length, Johansen co-integration tests to identify long-run relationships, and Vector Error Correction Model (VECM) analysis to examine both short-term dynamics and long-run equilibrium relationships among the variables [18].
Fig.1. Electric power consumption, economic growth, and investment from Year 1971 – 2019 in Indonesia.
Results and Analysis
A. Unit Root Test
The stationary properties of the observed variables are examined using Augmented Dickey-Fuller (ADF) and Phillips-Perron (PP) tests, and the results are summarized in Table 1. The tests reveal that the variables are not stationary in their levels, as indicated by the p-values exceeding 0.05. However, when tested in first differences, all variables (EPC, GDP, and FDI) exhibit p-values below 0.05, indicating stationarity after differencing (non-stationary data are rejected at a 5% significance level). Therefore, the variables are considered stationary at first differences.
Table 1. Results for unit root test
.
B. Optimal Lag Length for VECM Model
The next step involves determining the optimal lag length for the VECM model. Lag order selection is crucial for obtaining a better model fit. In this study, several common lag selection criteria are utilized, including the Sequential Modified LR Test Statistic (LR), Final Prediction Error (FPE), Akaike Information Criterion (AIC), and Schwarz Criterion (SC). The values obtained for each lag selection criterion are presented in Table 2. Based on the results, the optimal lag length for the VECM model is identified as the fourth lag, and because the data was differencing, the lag used in the next step is 3. This determination is supported by the values of the applied selection criteria, where the lowest values are consistently obtained at the fourth lag, as observed in the LR, FPE, and AIC criteria. Subsequently, the stability of VECM model is assessed. Figure 2 displays the inverted values of the characteristic roots, revealing that the majority of these
Table 2. Results for lag length selection
.
Fig.2. Unit root distribution chart.
Inverse roots of AR characteristic polynomial values fall within the unit circle. This observation suggests that the constructed VECM model is stable and suitable for the subsequent step of the co-integration test analysis.
C. Co-integration Analysis
In this step, the focus is on observing the long-term relationship among the EPC, GDP, and FDI variables. To examine the relationship, a co-integration test using the optimal lag length from the previous step is conducted, employing the Johansen co-integration test. The results of the co-integration test are presented in Table 3. The values of the Trace statistics and Maximum Eigen statistics indicate whether the null hypothesis can be rejected at a 5% significance level or if a co-integration relationship (R = 0) does not exist. Additionally, the null hypotheses concerning the existence of at most 1 and 2 co-integration relations (R ≤ 1 and R ≤ 2) are also rejected at the same significance level. These findings suggest the presence of more than 3 co-integration equations, indicating that the analysed variables exhibit a shared tendency over a long period. Co-integration signifies a systematic co-movement among the variables considered in the model [19]. Consequently, it can be concluded that EPC, GDP, and FDI in Indonesia have a long-run relationship.
Table 3. Results for co-integration test
.
D. VECM Granger Causality Analysis
In the final stage of this study, the VECM Granger causality test is applied to the model using the differenced data obtained in the previous step. This test is utilized to examine the short-run and long-run causal relationships between the variables included in the model. Table 4 presented VECM results. The presence of significant coefficients with a negative sign suggests a long-term relationship between the variables, while coefficients with a non-significant negative sign indicate a short-term dynamic relationship [20]. The error correction mechanism reveals a short-term relationship among all the variables. In the long term, there exists a negative relationship between EPC and GDP. However, in the short term, there are indications of a negative relationship between EPC, GDP, and FDI.
Table 4. Long-term and short-term relationships of the Vector Error Correction
.
Equation (1) shows the co-integration formula of the model:
In the long-term, there exists a negative relationship between EPC and GDP, while a positive relationship is observed between EPC and FDI. This implies that an increase in EPC in Indonesia encourages the FDI to rise, while concurrently leading to a decrease in GDP.
The analysis of the causality relationship among the variables using the VECM model reveals important findings. Specifically, the results indicate that GDP has a negative and significant impact on EPC at the three-year horizon, while FDI demonstrates a negative and significant effect on EPC at the one- and two-year horizons. These results, which show the causality relationship among the variables, are presented in Table 5.
Fig.3. Impulse responses of the variables.
In order to assess the causal relationship between the variables, the Granger causality test is employed. The results of this test, which shows the causal relationship between the variables, are presented in Table 6. At a significance level of 5%, it is observed that there exists a unidirectional causal relationship between the variables EPC and GDP. Specifically, the GDP variable significantly influences EPC as indicated by a F-statistic probability below 0.05, namely 0.0208 (leading to the rejection of the null hypothesis). Additionally, a bidirectional causality is found between EPC and FDI. However, there is no causal relationship observed between GDP and FDI. These findings confirm that GDP and FDI play crucial roles in driving the increase in EPC. Therefore, it is essential for stakeholders to facilitate greater access and reduce constraints in utilizing electric power consumption to achieve high levels of economic growth and investment.
Table 6. VEC Granger Causality
.
In order to assess the impact of disturbances on the variables under consideration, the impulse response function is employed. This function provides insights into the timing and magnitude of the variables’ responses to disturbances originating from other variables [21]. Figure 3 illustrates the general impulse responses of EPC, GDP, and FDI to innovations (other variables), respectively. The results demonstrate a significant and gradual increase in the response of GDP and FDI to EPC over a 10-year period.
Conclusions
This paper focuses on conducting co-integration and VECM causality analysis within the Indonesian context, considering three key variables: electric power consumption (EPC), GDP, and FDI. The analysis reveals that all the variables exhibit a long-run relationship, which is confirmed through co-integration analysis utilizing the Johansen cointegration test. In the long run, a negative relationship is observed between EPC and GDP. However, in the short term, there are indications of a negative relationship between EPC, GDP, and FDI. Specifically, the results reveal that in the short-run causality analysis, GDP has a significant negative impact on EPC at the three-year horizon. Additionally, FDI shows a significant negative effect on EPC at the one- and two-year horizons. The causality test results indicate a unidirectional causal relationship between EPC and GDP, with GDP significantly influencing EPC. Furthermore, a bi-directional causality is observed between EPC and FDI, while no causal relationship is found between GDP and FDI. It is evident that the volume of GDP and FDI serves as driving factors for the increase in EPC. Consequently, stakeholders, including the government, play a crucial role in reducing constraints and facilitating access to electric power consumption in relevant sectors, potentially through policy interventions. These efforts are essential for stimulating rapid economic growth and attracting foreign investment. It should be recognized that the level of economic growth directly impacts foreign direct investment, thereby increasing the likelihood of foreign investors to invest in various sectors in Indonesia. The findings of this study hold significant value for public policymakers involved in designing energy policies, particularly for the electricity sector, to effectively support economic growth and foreign investment in Indonesia. For future research, we will consider more variables for application, such as the long-term prediction of electricity consumption.
REFERENCES
[1] Muhammad, Bashir. “Energy Consumption, CO2 Emissions and Economic Growth in Developed, Emerging and Middle East and North Africa Countries.” Energy, 179 (2019), 232–245. [2] Aydin, Mucahit. “Renewable and Non-Renewable Electricity Consumption–Economic Growth Nexus: Evidence from OECD Countries.” Renewable Energy, 136 (2019), 599–606. [3] Belloumi, Mounir. “Energy Consumption and GDP in Tunisia: Cointegration and Causality Analysis.” Energy Policy, 37 (2009), No. 7, 2745–2753. [4] Latief, Rashid, and Lin Lefen. “Foreign Direct Investment in the Power and Energy Sector, Energy Consumption, and Economic Growth: Empirical Evidence from Pakistan.” Sustainability, 11(2019), No.192, 1-21. [5] Hasan, Md Arif, Kh Md Nahiduzzaman, Adel S. Aldosary, Kasun Hewage, and Rehan Sadiq. “Nexus of Economic Growth, Energy Consumption, FDI and Emissions: A Tale of Bangladesh.” Environment, Development and Sustainability, 24 (2021), No. 5, 6327–6348. [6] Zeng, Shaolong, Yiqun Liu, Junjie Ding, and Danlu Xu. “An Empirical Analysis of Energy Consumption, FDI and High Quality Development Based on Time Series Data of Zhejiang Province.” International Journal of Environmental Research and Public Health, 17 (2020), No. 3321, 1-17. [7] Aftab, Samina, Aftab Ahmed, Abbas Ali Chandio, Bright Asiamah Korankye, Aamir Ali, and Wang Fang. “Modeling the Nexus between Carbon Emissions, Energy Consumption, and Economic Progress in Pakistan: Evidence from Cointegration and Causality Analysis.” Energy Reports, 7 (2021), 4642–4658. [8] Pachiyappan, Duraisamy, Yasmeen Ansari, Md Shabbir Alam, Prabha Thoudam, Kuppusamy Alagirisamy, and Palanisamy Manigandan. “Short and Long-Run Causal Effects of CO2 Emissions, Energy Use, GDP and Population Growth: Evidence from India Using the ARDL and VECM Approaches.” Energies, 14 (2021), No. 8333, 1-17. [9] Grabara, Janusz, Arsen Tleppayev, Malika Dabylova, Leonardus W. Mihardjo, and Zdzisława Dacko-Pikiewicz. “Empirical Research on the Relationship amongst Renewable Energy Consumption, Economic Growth and Foreign Direct Investment in Kazakhstan and Uzbekistan.” Energies, 14 (2021), No. 332, 1-18. [10] Fan, Weiyang, and Yu Hao. “An Empirical Research on the Relationship amongst Renewable Energy Consumption, Economic Growth and Foreign Direct Investment in China.” Renewable Energy, 146 (2020), 598–609. [11] Lin, Boqiang, and I. Nelson Benjamin. “Causal Relationships between Energy Consumption, Foreign Direct Investment and Economic Growth for Mint: Evidence from Panel Dynamic Ordinary Least Square Models.” Journal of Cleaner Production, 197 (2018), 708–720. [12] Atchike, Desire Wade, Zhen-Yu Zhao, and Geriletu Bao. “The Relationship between Electricity Consumption, Foreign Direct Investment and Economic Growth: Case of Benin.” International Journal of Energy Economics and Policy, 10 (2020), No. 4, 507–515. [13] Saidi, Kais, Mounir Ben Mbarek, and Mounira Amamri. “Causal Dynamics between Energy Consumption, ICT, FDI, and Economic Growth: Case Study of 13 MENA Countries.” Journal of the Knowledge Economy, 9 (2015), No. 1, 228–238. [14] Shahbaz, Muhammad, Avik Sinha, Chandrashekar Raghutla, and Xuan Vinh Vo. “Decomposing Scale and Technique Effects of Financial Development and Foreign Direct= Investment on Renewable Energy Consumption.” Energy, 238 (2022), No. 121758, 1-13. [15] Sijabat, Rosdiana. “The Association of Economic Growth, Foreign Aid, Foreign Direct Investment and Gross Capital Formation in Indonesia: Evidence from the Toda–Yamamoto Approach.” Economies, 10 (2022), No. 93, 1-22. [16] Shahbaz, Muhammad, Qazi Muhammad Hye, Aviral Kumar Tiwari, and Nuno Carlos Leitão. “Economic Growth, Energy Consumption, Financial Development, International Trade and CO2 Emissions in Indonesia.” Renewable and Sustainable Energy Reviews, 25 (2013), 109–121. [17] Indonesia | Data – World Bank Data. Accessed May 12, 2023. https://data.worldbank.org/country/indonesia?view=chart. [18] Tan, Lan, Yifan Xu, and Alemayehu Gashaw. “Influence of Exchange Rate on Foreign Direct Investment Inflows: An Empirical Analysis Based on Co-Integration and Granger Causality Test.” Mathematical Problems in Engineering 2021, (2021), 1–12. [19] Ivascu, Larisa, Muddassar Sarfraz, Muhammad Mohsin, Sobia Naseem, and Ilknur Ozturk. “The Causes of Occupational Accidents and Injuries in Romanian Firms: An Application of the Johansen Cointegration and Granger Causality Test.” International Journal of Environmental Research and Public Health, 18 (2021), No. 7634, 1-17. [20] Apostu, Simona Andreea, Mirela Panait, Daniel BalsalobreLorente, Diogo Ferraz, and Irina Gabriela Rădulescu. “Energy Transition in Non-Euro Countries from Central and Eastern Europe: Evidence from Panel Vector Error Correction Model.” Energies, 15 (2022), No. 9118, 1-21. [21] Si, Ruishi, Noshaba Aziz, and Ali Raza. “Short and Long-Run Causal Effects of Agriculture, Forestry, and Other Land Use on Greenhouse Gas Emissions: Evidence from China Using VECM Approach.” Environmental Science and Pollution Research, 28 (2021), No. 45, 64419–64430.
Authors: Andi Abdul Halik Lateko, Ph.D., Department of Electrical Engineering, Universitas Muhammadiyah Makassar, Indonesia, E-mail: halik@unismuh.ac.id (corresponding author); Yusri Syam Akil, Ph.D., Department of Electrical Engineering, Hasanuddin University, Indonesia, E-mail: yusakil@unhas.ac.id.
Source & Publisher Item Identifier: PRZEGLĄD ELEKTROTECHNICZNY, ISSN 0033-2097, R. 100 NR 2/2024. doi:10.15199/48.2024.02.28