Published by 1. Róbert Štefko1, 2. Michal Kolcun1, 3. Marek Bobček1, 4. Damian Mazur2 , 5. Bogdan Kwiatkowski2, Technical University of Košice (1), Rzeszow University of Technology (2) ORCID: 1. 0000-0002-2477-4559, 2. 0000-0002-8041-9076, 3. 0009-0004-1912-211X; 4. 0000-0002-3247-5903, 5. 0000-0001-5287-2191
Abstract. The continuous rise in electricity consumption and the integration of renewable energy sources into distribution grids are gradually posing challenges to conventional protection systems. This trend significantly impacts traditional centralized methods of electricity generation, shifting towards local production and consumption and moving closer to emerging microgrids. This aspect was specifically considered during the development of the current power system we utilize. To ensure the successful emergence of microgrids, it’s imperative to begin addressing the issue of protecting these renewable energy sources, especially considering that our current devices lack communication or remote-control capabilities. The size of the topology and the number of devices managed at each point in a microgrid will play a crucial role. Therefore, addressing the overall management of individual devices and resources within the microgrid is essential.
Streszczenie. Ciągły wzrost zużycia energii elektrycznej i integracja odnawialnych źródeł energii z sieciami dystrybucyjnymi stopniowo stawiają wyzwania konwencjonalnym systemom ochrony. Ten trend znacząco wpływa na tradycyjne scentralizowane metody wytwarzania energii elektrycznej, przesuwając się w kierunku lokalnej produkcji i zużycia oraz zbliżając się do powstających mikrosieci. Ten aspekt został szczególnie rozważony podczas opracowywania obecnego systemu energetycznego, z którego korzystamy. Aby zapewnić pomyślne powstanie mikrosieci, konieczne jest rozpoczęcie zajmowania się kwestią ochrony tych odnawialnych źródeł energii, zwłaszcza biorąc pod uwagę, że nasze obecne urządzenia nie mają możliwości komunikacji lub zdalnego sterowania. Rozmiar topologii i liczba urządzeń zarządzanych w każdym punkcie mikrosieci będą odgrywać kluczową rolę. Dlatego też zajęcie się ogólnym zarządzaniem poszczególnymi urządzeniami i zasobami w mikrosieci jest niezbędne. (Projekt systemu zabezpieczeń rozproszonych źródeł energii w sieci dystrybucyjnej)
Keywords: protection system, protection relay, distribution grids, distribution energy sources.
Słowa kluczowe: system zabezpieczeń, przekaźnik zabezpieczający, sieci dystrybucyjne, dystrybucyjne źródła energii.
Introduction
The integration of renewable energy sources (RES) into existing energy grids heralds a transformative shift, marked by reduced transmission losses and heightened operational reliability. However, this transition brings forth a host of new challenges, particularly in the realms of protection, control, and fault localization systems. Addressing these challenges necessitates ongoing research and innovation in distribution grid technology, with microgrids emerging as a beacon of promise for the future.
One of the defining characteristics of microgrids is their remarkable adaptability, seamlessly transitioning between islanded operation and grid-connected mode. This flexibility is empowered by their inherent self-control capabilities, allowing them to autonomously manage energy generation and consumption. In the event of system faults or disruptions, microgrids can swiftly switch to islanded mode, drawing upon local and renewable energy sources to maintain power supply reliability.
Despite the technical complexities inherent in microgrid design, the benefits they offer outweigh the associated concerns. An essential aspect of microgrid planning is the careful selection and integration of energy sources, balancing local generation with renewable inputs to optimize grid performance. This strategic energy mix is pivotal in mitigating control and protection system challenges within distribution grids, ensuring robust and reliable operation.
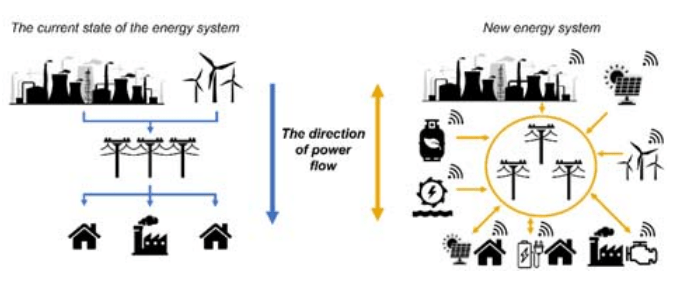
Renewable energy units embedded within microgrids fundamentally alter the traditional energy distribution paradigm. By situating energy production closer to consumption points, microgrids enable bidirectional energy flow, effectively decentralizing power generation. This paradigm shift prompts critical questions regarding energy mix optimization, sustainability, and grid flexibility, particularly in response to diverse weather conditions and demand fluctuations.
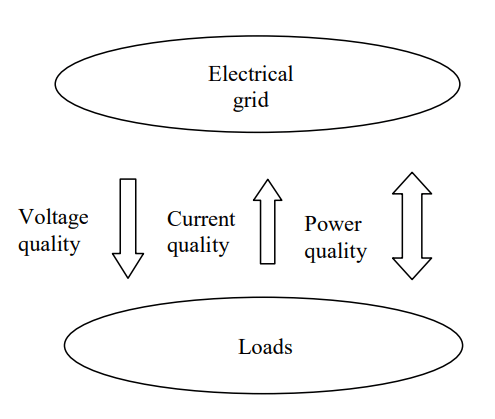
Navigating these challenges requires a reevaluation of conventional grid infrastructure. A comparative analysis, as depicted in Fig. 1, underscores the significant departure from the radial energy flow model observed in traditional power systems. In contrast, microgrids facilitate bidirectional energy flow by shortening distribution lines and integrating distributed energy sources, paving the way for a more resilient and adaptable energy landscape.
Definition of Microgrid
Microgrids can be defined as small local distribution grids that supply electrical energy to consumers, generating electricity through distributed energy sources. These grids must achieve self-sufficiency in electricity production, necessitating an appropriate energy mix based on geographic location to meet load demands.
According to a European Union research project, a microgrid encompasses low-voltage distribution systems with distributed energy resources, storage devices, energy storage systems, and flexible loads. These systems can operate connected or disconnected from the main grid. In essence, a microgrid is a modern autonomous energy distribution system primarily powered by local renewable energy sources [2].
Similarly, the U.S. Department of Energy defines a microgrid as a group of interconnected loads and distributed energy resources within clearly defined boundaries, acting as a single controllable unit concerning the grid. Microgrids can connect and disconnect from the grid, allowing operation in both connected and islanded modes [2].
Protection of distributed sources of electrical energy connected to the distribution grid is essential for several reasons. Inverters include a built-in protection system and perform self-checks in case of faults. Additional protection systems, such as circuit breakers, circuit protection devices, fuses, and surge protectors, are employed to safeguard the inputs. However, protective relays utilized in low-voltage grids often have limited functionality, primarily monitoring frequency and voltage, and detecting ground faults or disconnections during grid outages.
Current State of Research
Current research suggests various perspectives on the further development of smart grids and microgrids. While one of the current research trends indicates the use of Phasor Measurement Units and centralized processing of measured data, only after the development of new protective relays with enhanced mutual communication. A similar direction is also taken by article [3], in which the research team focused on introducing a new method for developing protective relays based on simulation and applying it to the development of localized devices for protecting distribution lines. Applying this method to the development of localized devices for protecting distribution lines and verifying its effectiveness and accuracy through comparing the simulated model with physical testing on relays.
The article [4], similarly to the previous one, suggests the utilization of simulation. It explores the necessity of hard-in-the-loop simulation (HILS) for cooperative protection research in meshed distribution grids. It highlights the issues with protection in these grids and proposes HILS as a solution. The authors analyse traditional testing methods and present a case study demonstrating the effectiveness of HILS. Overall, it represents an important contribution to addressing issues in the field of electrical power distribution.
The article [5] proposes an adaptive protection strategy for power distribution systems with distributed generation (DG), specifically addressing relay malfunctions in radial distribution systems integrated with photovoltaic (PV) sources. It combines Fuzzy Logic (FL) and Genetic Algorithm (GA) to dynamically adjust relay settings based on changes in PV capacity and load demand, aiming to enhance system reliability without infrastructure redesign. By analysing scenarios and comparing with traditional methods, the study demonstrates the effectiveness of FLGA in optimizing relay operation, offering a valuable solution for improving power distribution systems amidst increasing DG integration.
The article [6] examines the influence of integrating distributed photovoltaic (PV) systems on distribution grid protection, particularly regarding low voltage ride-through (LVRT) events. It points out that conventional protection methods may not adequately address the altered fault characteristics resulting from PV integration. The paper proposes a distributed PV LVRT control strategy to mitigate these impacts while providing support during faults. Through analysis and simulations, the strategy’s effectiveness is demonstrated, paving the way for improved fault management in active distribution grids.
The article [7] outlines a collaborative effort with ENEL Distribution São Paulo to enhance intelligence, automation, and protection in the low voltage (LV) overhead distribution grid. It introduces self-healing methodology for LV grids, previously utilized in medium voltage (MV) grids. The development and improvements to LV Control equipment for real-time monitoring and transformer protection are discussed, along with simulations validating the strategy’s effectiveness. The article highlights the need for advanced monitoring and protection equipment in LV grids and introduces an innovative solution to address this gap.
The article [8] addresses challenges in implementing relay protection systems in distribution grids due to the integration of distributed energy resources, proposing an automated system to adjust protection settings. It outlines an adaptive dynamic protection scheme and optimization methods, along with the development of microservices for automatic calculation and adjustment of parameters. Experimental results demonstrate the system’s effectiveness in accurately adjusting protection settings for various scenarios, highlighting its potential to enhance grid reliability. Overall, the article presents a promising solution to evolving distribution grid challenges through automated protection adjustment systems.
Protection Relays for Distribution Grids: Ensuring Electrical System Security
Programmable protective relays are electronic devices used in transmission and distribution electrical grids to detect and respond to various faults and anomalies in the system. These relays can perform various protective functions and are programmable according to specific requirements and needs of the distribution grid. Each manufacturer of these relays has its own way of setting the parameters. Their main task is to monitor electrical parameters such as voltage, current, and frequency, and in case of detecting abnormalities or faults, to trigger protective actions such as disconnecting a section using a contactor. Programmable protective relays are an important component of distribution grid protection systems and help ensure safe and reliable operation of electrical grids.
In the territory of the Slovak Republic, there are three electricity suppliers: the Western Slovak Distribution Company (ZSD), the Central Slovak Distribution Company (SSD), and the Eastern Slovak Distribution Company (VSD). These distribution companies in Slovakia manage high-voltage lines and ensure the supply of electricity to consumers. Each of the recommended protective relays according to Table 1. has been tested by VSD and meets strict requirements for response time and measurement accuracy. Currently programmable protective relays are applied in the territory of the Slovak Republic according to the requirements of the local Eastern Slovak distribution energy company (VSD) for sources exceeding 10 kW.
Table 1. Approved types of external grid protection by VSD [9]

When connecting a larger source exceeding 10 kW, it is necessary to apply approved programmable relays as specified by the distribution company managing the area where the source will be installed. For the low-voltage level (LV), the standard wiring diagram for direct measurement by an electricity meter and a smart meter is depicted in Fig.2. Additionally, other components such as surge protectors are part of the assembly, which are additionally protected by 100A fuses, although they are not shown in the diagram in Fig. 2. For the DC part of the system, which connects to the inverter, similar protection of individual interconnected panels into so-called strings and the installation of surge protection on each such string is also necessary.
According to the current requirements of VSD, when connecting a local source to the distribution grid with a capacity up to 10 kW, it is not necessary to install external grid protection for such a source (integrated grid protection cannot be set according to VSD requirements). However, when using more than one inverter with a total installed power exceeding 10 kW, it is necessary to install external grid protection for such a source, which will control the main disconnecting point. The approved types and manufacturers of external grid protection devices according to the VSD company are shown in Table 2. along with their purchase prices [9].
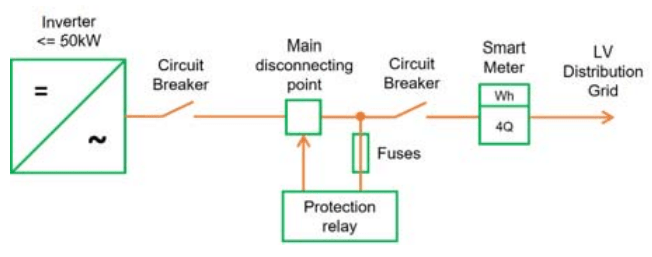
Table 2. The required settings of the external gird protection according to the VSD for LV grid [9]
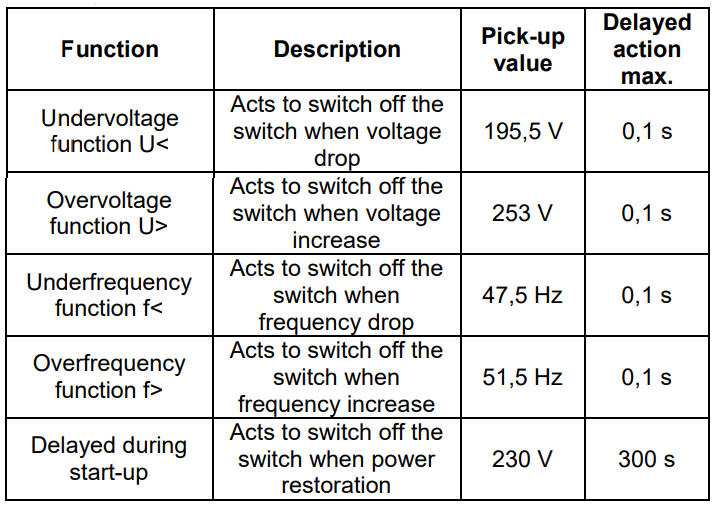
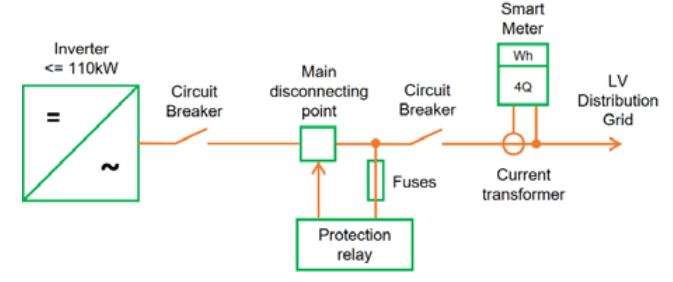
For such external grid protections, there is a relatively simple setup using only basic functions to monitor the qualitative parameters of the generated electrical energy. The settings and description are displayed in Table 2.. This external grid protection will primarily function as a monitoring relay. Upon exceeding specified limits, it will trigger a signal to change the state of the output contacts, whose condition can be set for controlling the main disconnecting point. In the context of the protective system, it’s crucial to note that the protective relay solely focuses on the main disconnecting point, neglecting to monitor the operational states of other components within the protection system. Consequently, the electricity distributor is only privy to information regarding the consumer’s electrical energy transactions with the grid – whether it be consumption from or supply to the grid. When considering the integration of distributed energy sources with a capacity of up to 110 kW, the fundamental principle aligns with the protection strategy discussed earlier.
However, a notable deviation lies in the requirement for a current instrument transformer to facilitate accurate measurement of the consumer’s production or consumption by the smart meter. This additional component, depicted in Fig. 3, plays a pivotal role in enhancing the monitoring and management capabilities of the system, ensuring efficient and reliable operation.
The installation of larger energy sources is typically addressed for industrial enterprises that possess relatively large rooftops capable of accommodating such capacity. While conventional photovoltaic stations are also situated in open fields, the prevailing trend indicates a notable increase, especially within the industrial sector. Upon connection to the medium-voltage (MV) level, consideration must also be given to the installation of a transformer and an additional protection system.
In such instances, the billing measurement responsibility shifts from the distributor to the higher voltage side, as industrial areas often incorporate their own substations on the consumer’s premises. Consequently, the addition of a voltage instrument transformer becomes necessary to enable the smart meter to measure consumption accurately.
When considering inverters larger than 110 kW, as shown in Fig. 4, the complexity of the protection system increases significantly. The distribution company now mandates monitoring the status of each protective device, necessitating the connection of all individuals signalling states of circuit breakers and fuses to the protective relay. Additionally, there is a requirement for remote monitoring capabilities through dispatching. Consequently, the use of the same protective relays as in previous cases is not feasible, as the protective relay must comply with secure protection protocols in addition to the required protective functions.
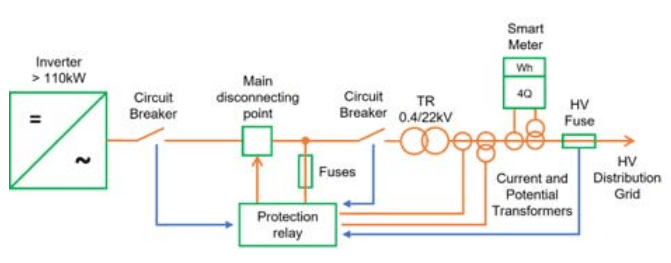
One of the most widely deployed relays in Europe in recent years is the SEL-751 digital relay, typically installed alongside the RTAC-3505 device for dispatching needs. For microgrid applications, a similar combination will be required to protect the LV level. An issue arises with the overcurrent function when the microgrid transitions from grid-connected operation to islanded operation. If the microgrid relies solely on sources with inverters, utilizing the overcurrent function becomes considerably challenging. This is since the contribution of inverters amounts to a maximum of approximately 120% of the inverter’s nominal current, sustained for a maximum of only 5 seconds [10], [11].
To address this challenge, digital protection must detect the state of control elements to adjust the settings to a more sensitive level, ensuring grid safety. However, implementing this concept in practice for fault location poses difficulties. Increasing the sensitivity of the protection may result in minimal differentiation between fault current (the starting current of the protection) and normal current or the starting current of motors in industrial areas [12].
Currently, VSD does not consider the use of local small sources during a black start due to the necessity to monitor the grid frequency for inverters during synchronization with the grid. Consequently, small renewable energy sources (RES) are automatically connected only after 300 seconds from the restoration of power by the grid [13].
Table 3. The required settings of the external gird protection according to the VSD for a power range: 100kW≤ PN≤5MW for LV grid [9]
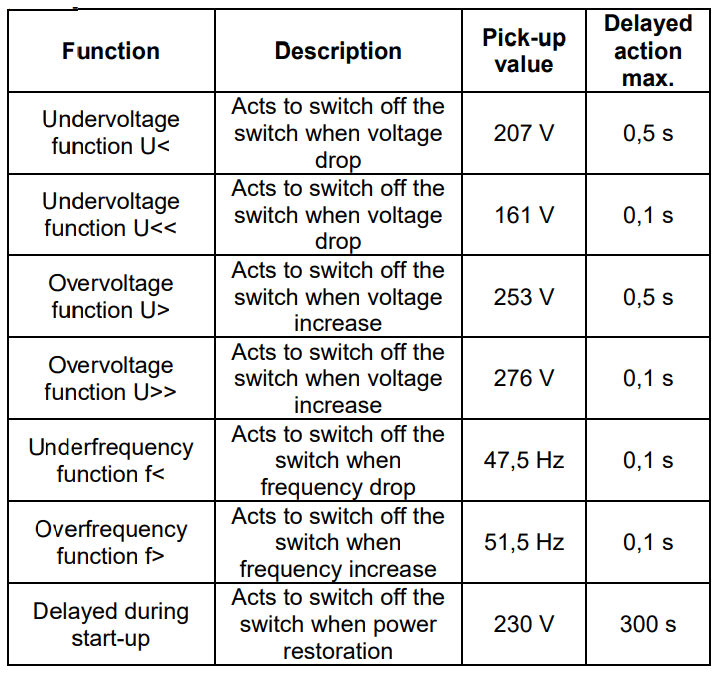
Table 4. The required settings of the external gird protection according to the VSD for a power range: 100kW≤ PN≤5MW for MV grid [9]
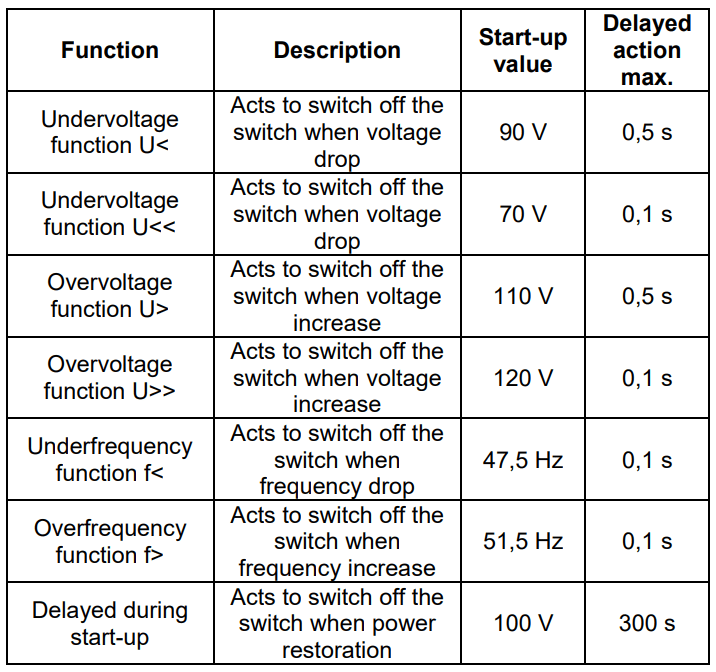
The comparison between Table 3. and Table 4. sheds light on the nuanced considerations required in configuring external grid protection systems. In Table 3., we find the standard settings designated for power sources ranging from 100 kW to 5 MW when integrated into the LV grid. Conversely, Table 4. offers a glimpse into settings tailored for the same power range but intended for connection to the MV grid. While exploring this comparison, it becomes evident that deviations emerge, particularly concerning the trip time setting for voltage drop or rise at the first level, as evident when comparing Table 2. and Table 3.. However, despite these discrepancies, it’s noteworthy that the remaining settings largely align between the two tables.
Moreover, the method of connection to the grid and the specific voltage level play pivotal roles in determining the appropriate settings. This becomes particularly evident when analysing the settings for indirect measurement from Table 4., where we observe identical configurations, albeit specifically designed for the secondary side measurement. Consequently, these voltage values demonstrate a notable reduction, as visually depicted in Fig. 4.
This comprehensive comparison underscores the critical importance of considering grid connection specifics and voltage levels when configuring external grid protection systems [14]. The observed discrepancies not only highlight the need for meticulous attention to detail but also underscore the necessity for tailored approaches based on the unique characteristics of the grid. By implementing customized settings that account for these nuances, it becomes possible to ensure optimal grid safety and functionality, thereby mitigating risks and enhancing overall system reliability.
Design of a Protection Relay
Currently, there is a lack of universal relays on the market that would be able to meet strict criteria for various options of connecting renewable energy sources (RES) to the distribution grid. With the future deployment of microgrids and smart grids in mind, having such universal devices becomes a crucial necessity.
These systems will need to accommodate various grid topologies, diverse characteristics of RES, and their potential impact on the operation of distribution grids. As microgrids and smart grids increasingly rely on RES, it is essential to have reliable and flexible relays capable of effectively managing and protecting these new energy systems. From the needs described in the previous chapter, it is evident that the device must provide only a few inputs and outputs.
At the same time, it is important for it to have integrated cybernetic security function in the form of Anti-Malware technology, ensuring an elevated level of security. Such a device should include a comprehensive set of security features for user access, configuration management, and monitoring. This will ensure that the system is protected against potential cyber threats and capable of maintaining the integrity and reliability of its operating environment. Each output channel is equipped with both normally open and normally closed contacts, providing both switching and break functions for enhanced versatility. This design feature ensures compatibility with a wide range of devices and systems, allowing users to adapt the device to different scenarios and operational needs easily.
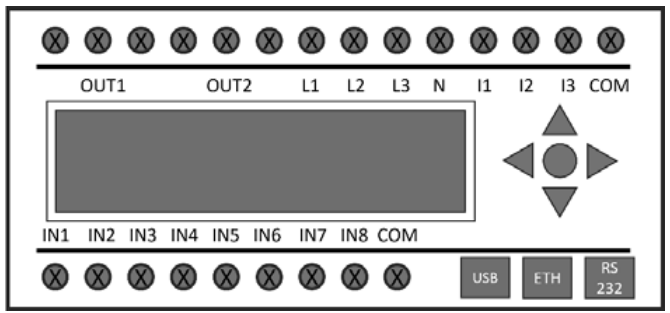
The proposed device, as depicted in Fig. 5, is indeed equipped with a diverse array of communication inputs, offering enhanced flexibility and choices for the user. The USB input facilitates local configuration, permitting users to conveniently adjust settings directly on the device. Moreover, this USB input can also be linked to the internet via an RJ-45 connector, enabling remote access and configuration of the device. Additionally, there exists a communication port tailored for connecting an intelligent meter using standardized RS-232 serial communication, ensuring compatibility with both present and forthcoming systems.
Another notable benefit is the inclusion of HMI (HumanMachine Interface) access, which facilitates local control, settings adjustment, and device monitoring. This feature significantly improves user experience and management efficiency. Overall, this solution furnishes a comprehensive and adaptable platform for the management and safeguarding of renewable energy sources.
Further, the device is equipped with two output options, namely OUT1 and OUT2. These output channels provide versatility in connecting and controlling external devices or systems based on specific operational requirements. The availability of multiple output channels enhances the device’s utility and compatibility with various applications, offering users greater flexibility in configuring and managing their renewable energy systems. Each output channel is equipped with both normally open and normally closed contacts, providing both switching and break functions for enhanced versatility. This design feature ensures compatibility with a wide range of devices and systems, allowing users to adapt the device to different scenarios and operational needs easily.
The device evaluates input and output contacts and monitors them based on the measured input data for voltage input contacts L1, L2, L3, and N. Current inputs can be connected to I1, I2, I3, and COM. This configuration allows for comprehensive monitoring and control of the electrical parameters, ensuring efficient operation and protection of the connected renewable energy system. Of course, for a more robust system, input contacts for monitoring the status of individual protective devices will be necessary, which the device will provide in this case. There are up to eight input contacts available, labelled as IN1 to IN8, through which the status of various elements requiring attention from distribution companies when connecting larger power capacities can be detected. These input contacts enable comprehensive monitoring and control, enhancing the safety and efficiency of power distribution operations.
Conclusion
The design of a protection system for distributed energy sources in distribution grids is crucial for ensuring the reliability and safety of electricity supply, especially with the increasing integration of renewable energy sources (RES) and the emergence of microgrids and smart grids.
Addressing the challenges associated with protecting RES requires innovative solutions that cater to various grid topologies, RES characteristics, and operational needs. The proposed device offers a versatile platform equipped with advanced communication inputs, local and remote configuration capabilities, and comprehensive monitoring features.
With the inclusion of HMI access and multiple output options, the device enhances user experience and management efficiency while providing flexibility in connecting and controlling external devices. Additionally, the integration of cybernetic security features ensures the integrity and reliability of the system in the face of potential cyber threats.
Furthermore, the device’s ability to evaluate input and output contacts based on measured data enables efficient operation and protection of connected renewable energy systems. The provision of input contacts for monitoring the status of protective devices enhances safety and efficiency in power distribution operations. In conclusion, the design of a protection system for distributed energy sources in distribution grids marks a pivotal advancement in the realm of electrical grid infrastructure. As the energy landscape undergoes rapid transformation with the integration of renewable energy sources and the proliferation of microgrids and smart grids, the need for robust and adaptable protection systems becomes increasingly pronounced.
The proposed device embodies a holistic approach to addressing the multifaceted challenges posed by these developments. Its versatile architecture, encompassing a diverse array of communication inputs, local and remote configuration capabilities, and comprehensive monitoring features, positions it as a cornerstone in the transition towards a more sustainable and resilient energy ecosystem.
Moreover, the integration of cybernetic security functions underscores a proactive stance towards safeguarding critical infrastructure against emerging cyber threats, ensuring the integrity and reliability of energy distribution networks. This emphasis on security aligns with contemporary imperatives for fortifying infrastructure resilience in the face of evolving digital risks.
Furthermore, the device’s capability to evaluate input and output contacts based on measured data empowers operators with actionable insights for optimizing system performance and mitigating potential risks. By providing a seamless interface for monitoring and controlling renewable energy systems, it enhances operational efficiency and facilitates proactive maintenance strategies.
The inclusion of input contacts for monitoring the status of protective devices further enhances the device’s utility in ensuring grid reliability and resilience. This comprehensive approach to protection system design reflects a commitment to addressing the evolving needs of distribution grids while embracing the principles of sustainability, efficiency, and reliability.
In essence, the design of this protection system represents not only a technological milestone but also a testament to the collective efforts towards building a more sustainable and secure energy future. As we navigate the complexities of modern energy systems, innovations such as this serve as catalysts for progress, ushering in an era of energy resilience and sustainability for generations to come.
Acknowledgments: This work was supported by the Slovak Research and Development Agency under the contract No. APVV-21- 0312 and the Ministry of Education, Science, Research and Sport of the Slovak Republic and the Slovak Academy of Sciences under the contract no. VEGA 1/0627/24.
REFERENCES
[1] ŠTEFKO R., ŠÁRPATAKY M., ŠÁRPATAKY L., et al., Construction and development of microgrids around the world, Elektroenergetika: International Scientific and Professional Journal on Electrical Engineering: Medzinárodný vedecký a odborný časopis pre elektroenergetiku, 15 (2022), no. 1,pp. 16-19, ISSN: 1337-6756.
[2] NAREJO G.B., ACHARYA B., SINGH R.S.S. and NEWAGY F., Microgrids Design, Challenges, and Prospects, 1. Edition, 2022, USA: CRC Press. pp. 1–314. ISBN: 978-1-0004-5746-9.
[3] LIU H., WANG H., ZHU S., et al., A Simulation-Based Method for Distribution Line Localized Protection Device Development, 2023 IEEE International Conference on Advanced Power System Automation and Protection (APAP), 2023, Xuchang, China, pp. 232–236, ISBN: 979-8-3503-0666-8.
[4] NOH J., CHAE W., KIM W., et al., A Study on Meshed Distribution System and Protection Coordination Using HILS System, 2022 13th International Conference on Information and Communication Technology Convergence (ICTC), 2022, Island, Republic of Korea, pp. 344–346, ISSN: 2162-1241.
[5] CHANDRAN R.L., ANJU PARVATHY V.S., ILANGO K., MANJULA G.N., Adaptive Over Current Relay Protection in a PV Penetrated Radial Distribution System With Fuzzy GA Optimisation, 2022 IEEE 19th India Council International Conference (INDICON), 2022, Kochi, India, pp. 1–7, ISBN: 978-1-6654-7350-7.
[6] LIANG W., ZHAO Y., LIU B., WANG Y., Research on Distributed Photovoltaic Low Voltage Ride Through Control Strategy Considering Distribution Network Protection, 2023 3rd International Conference on Electrical Engineering and Mechatronics Technology (ICEEMT), 2023, Nanjing, China, pp. 550–555, ISBN: 979-8-3503-0369-8.
[7] CHAVES T.R., IZUMIDA MARTINS M.A., VINICIUS João D., et al., Study for the Application of Self Healing in the Overhead Low Voltage Distribution Grid, 2022 IEEE International Conference on Power Systems Technology (POWERCON), 2022, Kuala Lumpur, Malaysia, pp. 1–5, ISBN: 978-1-6654-1775-4.
[8] SAZANOV V.S., KOVALENKO A.I., VOLOSHIN A.A., et al., The Development of System for Automatic Adaptive Change of Relay Protection Settings in Distribution Networks, 2022 5th International Youth Scientific and Technical Conference on Relay Protection and Automation (RPA), 2022, Moscow, Russian Federation, pp. 1–15, ISBN: 979-8-3503-9991-2.
[9] VSD Available online: , accessed April 2022.
[10] STEFKO R., CONKA Z., KOLCUN M., Case Study of Power Plants in the Slovak Republic and Construction of Microgrid and Smart Grid. Appl. Sci. vol. 11, no. 11, 2021, pp. 1–22.
[11] DIAHOVCHENKO I., YEVTUSHENKO I., KOLCUN M., et. al., Demand-Supply Balancing in Energy Systems with High Photovoltaic Penetration, using Flexibility of Nuclear Power Plants, 20 (2023), No. 11, Acta Polytechnica Hungarica, pp. 115–135, ISSN: 1785-8860.
[12] KOLTSAKLIS N., KNÁPEK J., The Role of Flexibility Resources in the Energy Transition, 20 (2023), No. 11, Acta Polytechnica Hungarica, pp. 137–158, ISSN: 1785-8860.
[13] MÁSLO K., KOUDELKA J., BÁTORA B., VYČÍTAL V., Asymmetrical, Three-phase Power System Model: Design and Application, 20 (2023), No. 11, Acta Polytechnica Hungarica, pp. 9–27, ISSN: 1785-8860.
[14] Vojtek M., MASTNÝ P., MORAVEK J., et. al., Recent Challenges Regarding the Verification of Photovoltaic Inverters Properties and their Compliance with Technical Requirements, 20 (2023), No. 11, Acta Polytechnica Hungarica, pp. 63–82, ISSN 1785-8860.
Authors: Ing. Róbert Štefko, PhD., Technical University of Košice, Department of Electric Power Engineering, st. Mäsiarska 74, 040 01 Košice, E-mail: robert.stefko@tuke.sk; Dr. h.c. prof. Ing. Michal Kolcun, PhD., Technical University of Košice, Department of Electric Power Engineering, st. Mäsiarska 74, 040 01 Košice, E-mail: michal.kolcun@tuke.sk; Ing. Marek Bobček, Technical University of Košice, Department of Electric Power Engineering, st. Mäsiarska 74, 040 01 Košice, Email: marek.bobcek@tuke.sk; prof. Ing. Damian Mazur, PhD., Rzeszow University of Technology, Department of Electrical Engineering and Fundamentals of Computer Science, st. Powstańców Warszawy 12 35-959, Rzeszów, E-mail: mazur@prz.edu.pl. Ing. Bogdan Kwiatkowski, PhD., Rzeszow University of Technology, Department of Electrical Engineering and Fundamentals of Computer Science, st. Powstańców Warszawy 12 35-959, Rzeszów, E-mail: b.kwiatkowsk@prz.edu.pl.
Source & Publisher Item Identifier: PRZEGLĄD ELEKTROTECHNICZNY, ISSN 0033-2097, R. 100 NR 9/2024. doi:10.15199/48.2024.09.53