Published by 1. Anatolii SEMENOV1, 2. Stanislav POPOV1, 3. Serhii YAKHIN1, 4. Bauyrzhan YELEUSSINOV2, 5.Tamara SAKHNO1, Poltava State Agrarian University (1), Branch of JSC «NCPD Orleu» Institute of professional development in Kyzylorga region (2) ORCID: 1. 0000-0003-3184-6925; 2. 0000-0003-2381-152X; 3. 0000-0002-0042-0844; 4. 0009-0005-0552-6794; 5. 0000-0001-7049-4657
Abstract. To determine the photobiological safety of UV lamps, the following measurements were carried out: spectral irradiance, total actinic irradiance in the wavelength range of 200-400 nm, and irradiance in the UVA range (320-400 nm). These parameters were measured using the optical radiation system OST-300. The photobiological safety of LUF 40-1, LE 15 lamps and their radiation risk group are established in accordance with EN 62471. The levels of UV radiation generated by LE 15 low pressure discharge lamps at a distance of 0.25 m belong to the high risk group (GR3), and LUF 40-1 – in the group of insignificant risk (GR1). Calculations and recommendations on safe radiation doses when using lamps in electrotechnical systems of photobiological influence are given
Streszczenie. W celu określenia bezpieczeństwa fotobiologicznego lamp UV wykonano pomiary: natężenia promieniowania spektralnego, całkowitego natężenia promieniowania aktynicznego w zakresie długości fal 200-400 nm oraz natężenia promieniowania w zakresie UVA (320-400 nm). Parametry te mierzono za pomocą optycznego systemu promieniowania OST-300. Bezpieczeństwo fotobiologiczne lamp LUF 40-1, LE 15 oraz ich grupa ryzyka radiacyjnego są określone zgodnie z normą EN 62471. Poziomy promieniowania UV generowane przez niskoprężne lampy wyładowcze LE 15 w odległości 0,25 m należą do grupy wysokiego ryzyka (GR3), a LUF 40-1 – w grupie ryzyka znikomego (GR1). Podano obliczenia i zalecenia dotyczące bezpiecznych dawek promieniowania przy stosowaniu lamp w elektrotechnicznych układach oddziaływania fotobiologicznego. (Ocena niebezpieczeństwa stosowania lamp ultrafioletowych w instalacjach elektrycznych)
Keywords: photobiological safety, UV irradiance, carcinogenic safety of radiation, spectral intensity.
Słowa kluczowe: bezpieczeństwo fotobiologiczne, promieniowanie UV, rakotwórcze bezpieczeństwo promieniowania, intensywność spektralna.
Introduction
Ultraviolet radiation is one of the important environmental factors that significantly affect the human body [1]. Humans are increasingly being exposed to ultraviolet rays due to the thinning of the ozone layer and its widespread use in sterilization processes, especially against the SARS-CoV-2 virus [2].
The state and environmental parameters of ultraviolet radiation are essential for its life in the inactivation of bacteria [3], irradiation of surfaces [4] and stimulation of processes [5]. In the process of evolution, under the influence of solar ultraviolet radiation in the human body, a whole complex of photobiological reactions has developed, both positively and negatively affecting its vital activity [6]. UV irradiation at doses of 10-15 J/m2 can stop the division of 90% of cells. Ultraviolet rays of different spectral ranges cause changes in cells that affect vital functions: growth, division, heredity. Therefore, radiation in the range from 320 to 400 nm causes slight erythema in humans, and radiation in the wavelength range from 290 to 320 nm and less causes burns [1]. The danger of ultraviolet radiation is also because a person does not have a sensory organ that could directly react to ultraviolet radiation.
Despite the study of the effects of UV radiation as a powerful hygienic and therapeutic factor, systematic studies of the beneficial effects of monochromatic radiation of various wavelengths have not yet been carried out. At present, there are only attempts to link the variety of beneficial effects of UV radiation with one, rather well studied function and to attribute to it the cause of integral beneficial effects [1]. The established factors of influence [7, 8] of UV radiation on cells of living organisms require detailed research and analysis to determine the photobiological safety of UV radiation on humans, depending on the spectrum and dose of radiation in various systems of ultraviolet action [9, 10]. Until recently, it was believed that UV radiation in the spectral range of 290-400 nm is useful says [1] and was considered as one that activates the defense mechanisms of the human body [11, 12].
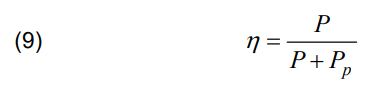
Approximately 95% of all solar UV radiation reaching the Earth’s surface is UV-A light (320-400 nm), which causes oxidative stress and the formation of DNA photoproducts in skin cells [13]. UVA radiation does not play a significant role in the negative impact on living objects, since it is poorly absorbed by DNA cells [14]. Risk-benefit analysis of exposure to solar ultraviolet radiation is widely used in the literature [15, 16]. A review by author [17] presents a mechanistic consideration of the wavelength dependence for UVR-specific mutations and substantiates the suggestion of UVA signature mutation in addition to UV signature mutation.
Recent studies by many authors have shown that UVA radiation creates a number of negative consequences for the human body, which can lead to serious structural and functional damage to the skin, and create mutagenic effects [18]. It is also necessary to take into account the effect of UV radiation on the retina and other components of the organs of vision [19]. UV radiation (even mild – UV-A) can lead to serious damage to the visual apparatus, since the receptors of vision do not feel its influence.
One of the health problems around the world associated with ultraviolet light is cataracts [20]. It especially often occurs in rural residents who spend a lot of time in unshaded areas [21]. More than a hundred scientific papers on the impact of artificial light sources and natural UV radiation of the sun on human health have been analyzed in the studies of the international organization WHO [7].
Multiple experimental confirmations have negative effects and the evidence continues to grow. UVA radiation penetrates deeper into the skin than UVB and causes photoaging. The influence and mechanism of action of ultraviolet B (UVB) on melanin synthesis and premature aging in cells. Herewith, the melanin content first increased, and then decreased with increasing UVB exposure [22].
The harmful effects of UV-B radiation on photosynthesis and photosynthetic productivity of plants are given in [23]. UV-B radiation has been shown to damage the photosynthetic apparatus of green plants in many place [24].
The misconception that high-intensity UV-A exposure from tanning devices is safe and not associated with melanoma is being challenged. More recent data from experimental studies induced in the review [18] provide strong evidence for a strong association between UV-A and the risk of melanoma. UVA is a complete carcinogen that may play a key role in both the onset and progression of melanoma.
In research [25], was carried out that using ultraviolet lamps on devices intended for UV curing of artificial nail coatings, which are widely used in manicure salons all over the world. The photobiological safety of these devices has been reviewed in the dermatological literature [26], where two cases of non-melanoma skin cancer on the dorsum of the hand were observed in women with previous exposure to UV nail lamps. Doctors say that UV lamps for manicure can be compared to tanning devices – tanning beds, and suggest that they may also pose a risk factor for developing skin cancer [27].
The most favorable direction in the study of the photobiological safety of lamps and lamp systems is the analysis of UV systems used to obtain artificial irradiation in tanning salons, since there is regulatory documentation in EN 60335–2–27 [28] and IEC 61228 [29] and the necessary equipment allows a number of studies in this direction. In addition, a number of studies have shown that in most tanning salons, the irradiance level is above the safety limits and the ratio of UVB/UVA fluxes is significantly different from natural sunlight.
Requirements for the radiation of lamps used in photobiological systems are established in EN 60335–2–27 [28] and IEC 61228 [29], which presents the specifications of the recommended photobiological safety practice for lamps – classification and labelling of risk groups. These specifications include a risk analysis of exposure thresholds for exposure to ultraviolet radiation and subsequently adopted as international standards by the International Electrotechnical Commission (IEC). The total effective surface radiation flux density, which is estimated in accordance with the spectrum of erythema action, should be no more than 0.7 W/m2 . In addition, according to EN 60335-2-27, the radiant flux density in the spectral range of 280-400 nm should be no more than 0.3 W/m2 . Appliances for domestic use must have a total effective surface radiation flux density that does not exceed 0.15 W/m2 . The UVB/UVA ratio shows how much of the UVB region radiation, assessed by the weight function of the carcinogenic hazard, falls on the UVA region radiation. It is known that high doses of UVB radiation cause burns, so it should be limited. Erythema-weighted irradiance and the ratio ЕUVB/ЕUVA, assessed by the weight function of the carcinogenic hazard of radiation, are the main parameters of lamps, and they are communicated to consumers by labelling with a UV code. In various systems of photobiological action, depending on the design and purpose, UV lamps with a radiation spectrum are used, which significantly differs from the UV spectrum of the Sun.
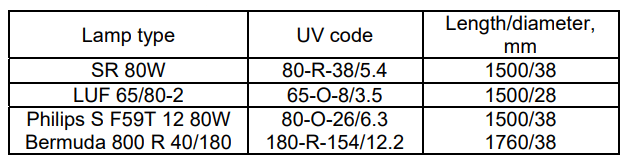
In most cases, low-pressure discharge lamps are used [30]. The parameters of some types of lamps are given in Table 1.
Studies carried out by the authors [31] have shown that the level of irradiation, which is created by low-pressure discharge lamps in the UVB range, is predominantly lower, and the irradiation in the UVA range is much higher than natural. In [32, 33] it was shown that the erythema-weighted irradiation of ultraviolet systems exceeded the established requirements of European standards.
According to IEC 61228 [29], information that must be provided by the manufacturer, upon request, including data on the spectral distribution of radiation depending on the product in the form of: spectral power of radiation, or spectral intensity, or spectral illumination and power conversion factor into radiant flux. Manufacturers are also required to provide information on the potential hazards associated with UV and optical radiation [34] sources upon request.
Table 1. Characteristics of low-pressure discharge lamps
The need to check UV lamps used in various photobiological systems for irradiation and stimulation of processes is caused by the discrepancy between the real parameters of the lamps and the requirements of international standards. The need for research is also due to the appearance of a large number of household UVaction devices to combat viral diseases, which are not monitored for compliance with photobiological safety requirements.
Materials and methods of research
Determining the risk group of lamp radiation and studying their photobiological safety in accordance with EN 62471 was the aim of this work [35]. Research objects:
1. Erythema lamps LE 15. Allow to receive additional erythema radiation in areas where the daylight hours are shorter or where there is no natural solar radiation at all. Erythema lamps are used at agricultural enterprises to reduce ultraviolet starvation of poultry and animals.
2. Lamp ultraviolet LUF 40-1. Low-pressure discharge lamps of the LUF type are intended for operation in various irradiation installations using the photochemical and biological action of ultraviolet radiation in the 300-420nm spectral region. Lamp LUF-40 has found wide application in the printing industry.
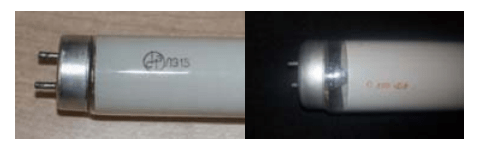
On fig. 1 shows the markings on the samples of the studied lamps.
Standardized methods for assessing and classifying the risks of ultraviolet blue and infrared radiation are given in the SIE S009 standard, and then adopted by the International Electrotechnical Commission in the IEC 61228 [29].
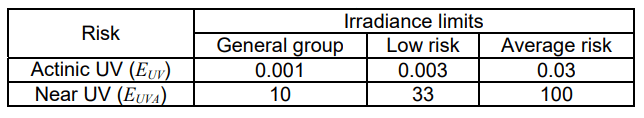
The significance function for assessing the danger of actinic UV radiation for the skin and eyes is presented in EN 62471 [35]. In EN 62471 limit values (RG) of irradiance are established, which, when using electrical devices and lamp systems, must not be exceeded. For UV lamps, the exposure limits for various groups of photobiological risks are given in table 2.
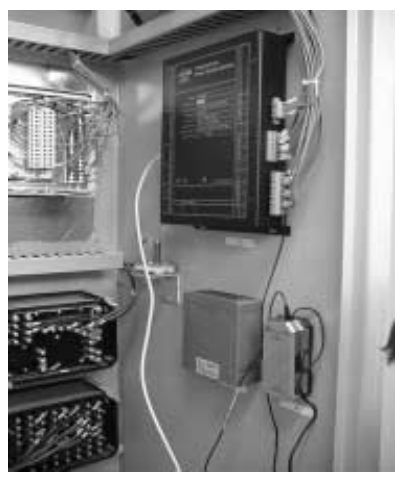
EN 62471 [35] is the only regulatory document by which the safety of UV lamps can be assessed. Spectral irradiance measurements E(λ) and calculations of the total actinic irradiance ЕUV in the wavelength range 200–400 nm and irradiance ЕUVA in the UVA range (320–400 nm) were carried out according to the method described in IEC 61228 [29] and EN 62471 [35]. The measurements were carried out using an OST-300 optical radiation system [30], which contains software for calculating the total actinic irradiance and irradiance in individual spectral ranges [36]. The program also allows you to calculate the exposure limits and the risk group.
Table 2. Exposure limits for different groups photobiological risks
Results of the research
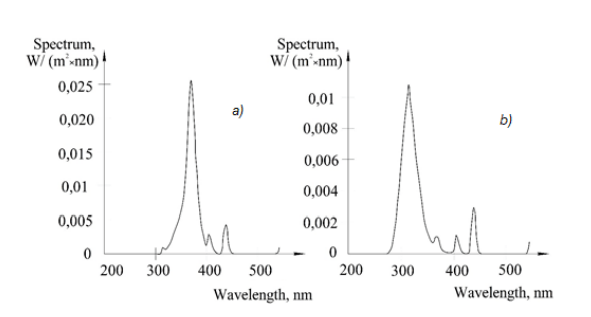
The results of measuring the spectral irradiance (W/(m2.nm) of LUF 40-1 and LE 15 lamps in the wavelength range of 200-500 nm are shown in figure 2.
In the studied lamps LUF 40-1 and LE 15 on the marking and in the additional information provided in the technical specifications for lamps LUF 40-1 and LE 15 there is not enough information to determine the equivalence code (UV code) according to IEC 61228 [34]. To determine the codes, it was necessary to measure and calculate the following indicators: total effective erythemal UV irradiation in the spectrum range of 250-400 nm; effective irradiation by the function of significance and carcinogenic – dangerous irradiation in the UVA (λ>320 nm) and UVB (λ<320nm) spectrum ranges; determination of the ratio of effective irradiance (irradiance) ЕUVB/ЕUVA.
The calculations were carried out in accordance with the requirements of IEC 61228 [29]. The calculation results are summarized in table 3.
Table 3. Calculation results of effective irradiance to determine the UV code of lamps according to IEC 61228
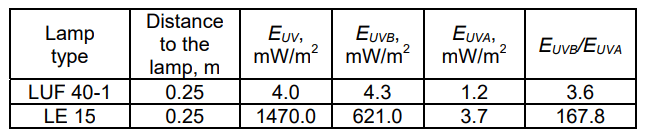
UV – code of the LUF 40-1 lamp: 40-O-4.0/3.6, where 40-O is a lamp without a reflector, with a power of 40 W; 4.0 – effective erythemal irradiance at a distance of 0.25 m in the spectral range of 250–400 nm; 3.6 – ЕUVB/ЕUVA.
UV code of the LE 15 lamp: 15-O-1470.0/167.8, where 15-O is a lamp without a reflector, with a power of 15 W, 1470.0 is an effective erythemal irradiance at a distance of 0.25 m in the spectral range 250–400 nm; 167.8 – ЕUVB/ЕUVA.
Calculated based on measurements, the value E(λ), ЕUV, ЕUVA for distances from the lamp of 0.25 m, as well the risk group are given below.
1. Ultraviolet lamp LUF 40-1: The total value of the ЕUV at a distance of 0.25 m is 1.33 mW/m2 . The energy illumination of the ЕUVA at a distance of 0.25 m is 2459 mW/m2 . Under these conditions, the radiation from the lamps is classified as low risk (RG1).
2. UV lamp LE 15: The total value of the ЕUV at a distance of 0.25 m is 31.9 mW/m2 . The energy illumination of the ЕUVA at a distance of 0.25 m is 214.2 mW/m2 . Under these conditions, the radiation from the lamps is classified as a high risk group (RG3).
Discussions
From the given results (table 3) it can be seen that in the spectral composition of LUF 40-1 lamps there is less radiation in the UVB range and it creates a much lower erythemal irradiance. The erythemal efficiency of LE 15 lamps are 47 times higher than that of LUF 40-1. Therefore, when using such lamps in various systems of ultraviolet exposure during human irradiation, it is necessary to take into account the obtained indicators and take the necessary safety measures [37, 38].
The maximum UV exposure time is defined as tmax=30/EUV. Limits of maximum exposure to UVA: the dose should be no more than 104 J/m2 at t<1000 s; at t>1000 s – EUVA≤10 W/m2 . The maximum UVA irradiation time (in seconds) is defined as tmax=104 /EUVA. The recommended exposure time for the first action should not exceed a dose of 100 J/m2 , for the second action the dose should not exceed 250 J/m2 , and the total dose should not exceed 3000 J/m2 .
Conclusion
Based on the results of the study, the following conclusions can be drawn:
1. The photobiological safety of LUF 40-1 lamps belongs to the low-risk group RG1, and the LE 15 lamps – to the high-risk group RG3.
2. The UV code of the LUF 40-1 lamps is 40-O-4.0/3.6 and the UV code of the LE 15 lamps is 15-O-1470.0/167.8. The erythemal efficiency of LE 15 lamps are 47 times higher than that of LUF 40-1, which requires additional safety measures.
REFERENCES
[1] Lerche С.M., Philipsen Р.А. Wulf H.C. UVR: sun, lamps, pigmentation and vitamin D., Photochemical & Photobiological Sciences, 16 (2017), No. 3, 291-301
[2] Heilingloh C.S., Aufderhorst U.W., Schipper L., Dittmer U., Witzke O., Yang D., … Krawczyk A. Susceptibility of SARSCoV-2 to UV irradiation, American Journal Infection Control, 48 (2020), No. 10, 1273-1275
[3] Semenov A., Semenova K. Ultraviolet disinfection of water in recirculating aquaculture system: a case study at sturgeon caviar fish farm, Acta agriculturae Slovenica, 118 (2022), No. 3, 1-4
[4] Semenov A., Hmelnitska, Y. Ultraviolet disinfection of activated carbon from microbiological contamination, Archives of Materials Science and Engineering, 115 (2022), No. 1, 34-41.
[5] Semenov A., Sakhno T., Hordieieva O., Sakhno Y. Pre-sowing treatment of vetch hairy seeds, viсia villosa using ultraviolet irradiation, Global Journal of Environmental Science and Management, 7 (2021), No. 4, 555-564
[6] Schmalwieser A.W., Siani A.M. Review on Nonoccupational Personal Solar UV Exposure Measurements, Photochemistry and Photobiology, 94 (2018), No. 5, 900-915
[7] World Health Organization. Artificial tanning devices: public health interventions to manage sunbeds, 2017. (Available 25.12.2022) http://apps.who.int/iris/bitstream/handle/10665/255695/9789241512596-eng.pdf?sequence=1
[8] Bogh M.K., Schmedes A.V., Philipsen P.A., Thieden E., Wulf H.C. Vitamin D Production after UVB Exposure Depends on Baseline Vitamin D and Total Cholesterol but not on Skin Pigmentation, Journal of Investigate Dermatology, 130 (2010), No. 2, 546-553
[9] Semenov А., Koshushko G. Device for germicidal air disinfection by ultraviolet radiation, Eastern-European Journal of Enterprise Technologies, 3 (2014), No. 10(69), 13–17
[10] Semenov A.A., Sakhno T.V. Disinfection of swimming pool water by UV irradiation and ozonation, Journal of water chemistry and technology, 43 (2021), No. 6. pp. 491-496.
[11] Eysteinsdottir J.H., Olafsson J.H., Agnarsson B.A., Luethviksson B.R., Sigurgeirsson B. Psoriasis treatment: faster and long-standing results after bathing in geothermal seawater. A randomized trial of three UVB phototherapy regimens, Photodermatology, Photoimmunology & Photomedicine, 30 (2014), No. 1, 25-34
[12] Almutawa F., Thalib L., Heckman D., Sun Q., Hamzavi I., Lim H.W. Efficacy of localized phototherapy and photodynamic therapy for psoriasis: a systematic review and meta-analysis, Photodermatology, Photoimmunology & Photomedicine, 31 (2015), No. 1, 5-14
[13] Cortat B., Garcia C.C.M., Quinet A., Schuch A.P., Lima-Bessa, K.M., Menck C.F.M. The relative roles of DNA damage induced by UVA irradiation in human cells, Photochemical & Photobiological Sciences, 12 (2013), No. 8, 1483-1495
[14] Brenner M., Hearing V.J. The Protective Role of Melanin Against UV Damage in Human Skin, Photochemistry and Photobiology, 84 (2008), No. 3, 539-549
[15] Neville J.J., Palmieri T., Young A.R. Physical Determinants of nVitamin D Photosynthesis: A Review, JBMR Plus, 5 (2021), No.1, e10460
[16] McKenzie R.L., Liley J.B., Bjorn L.O. UV radiation: balancing risks and benefits, Photochemistry and Photobiology, 85 (2009), No. 1, 88-98
[17] Ikehata H. Mechanistic considerations on the wavelengthdependent variations of UVR genotoxicity and mutagenesis in skin: the discrimination of UVA-signature from UV-signature mutation, Photochemical & Photobiological Sciences, 17 (2018), 1861–1871.
[18] Khan A.Q., Travers J.B., Kemp M.G. Roles of UVA Radiation and DNA Damage Responses in Melanoma Pathogenesis, Environmental Mutagen Society, 59 (2018), No. 5, 438-460
[19] Ivanov I.V., Mappes T., Schaupp P., Lappe C., Wahl S. Ultraviolet radiation oxidative stress affects eye health, Journal of Biophotonics, 11 (2018), No. 7, e201700377
[20] Modenese A., Gobba F. Cataract frequency and subtypes involved in workers assessed for their solar radiation exposure: a systematic review, Acta Ophthalmologica, 96 (2018), No. 8, 779–788
[21] Chen L.-J., Chang Y.-J., Shieh C.-F., Yu J.-H., Yang M.-C. Relationship between practices of eye protection against solar ultraviolet radiation and cataract in a rural area, PLoS One, 16 (2021), No. 7, e0255136
[22] Yan J., Ma L.-P., Liu F., Sun B., Tian M., Lu X., … Liu Q.-J. Effect of Ultraviolet B Irradiation on Melanin Content Accompanied by the Activation of p62/GATA4-Mediated Premature Senescence in HaCaT Cells, Dose Response, 20 (2022), No. 1, 1-7
[23] Kataria S., Jajoo A., Guruprasad K.N. Impact of increasing Ultraviolet-B (UV-B) radiation on photosynthetic processes, Journal of Photochemistry and Photobiology B: Biology, 137 (2014), 55-66
[24] Jansen M.A., Gaba V., Greenberg B.M. Higher plants and UV– B radiation: balancing damage? Repair and acclimation, Trends in Plant Science, 3 (1998), No. 4, 131-135.
[25] Dowdy J.C., Sayre R.M. Photobiological Safety Evaluation of UV Nail Lamps, Photochemistry and Photobiology, 89 (2013), No. 4, 961-967.
[26] MacFarlane D.F., Alonso C.A. Occurrence of nonmelanoma skin cancers on the hands after UV nail light exposure, Archives of Dermatology, 145 (2009), No. 4, 447-449.
[27] Boniol M., Autier P., Boyle P., Gandini S. Cutaneous melanoma attributable to sunbed use: systematic review and meta– analysis, British medical journal, 345 (2012), e4757.
[28] EN 60335-2-27:2013/A2:2021-11. Household and similar electrical appliances – Safety – Part 2–27: Particular requirements for appliances for skin exposure to ultraviolet and infrared radiation
[29] IEC 61228:2020. Fluorescent ultraviolet lamps used for tanning-Measurement and specification method
[30] Semenov A., Sakhno T., Sakhno Y. Photobiological safety of lamps and lamp systems in agriculture. Journal of Achievements in Materials and Manufacturing Engineering, 106 (2021), No. 1, 34-41
[31] Nilsen L.T.N., Hannevik M., Veierød M.B. Ultraviolet exposure from indoor tanning devices: a systematic review. British Journal of Dermatology, 174 (2016), No. 4, 730-740
[32] Sola Y., Baeza D., Gómez M., Lorente J. Ultraviolet spectral distribution and erythema–weighted irradiance from indoor tanning devices compared with solar radiation exposures. Journal of Photochemistry and Photobiology B: Biology, 161 (2016), 450-455
[33] Tierney P., Ferguson J., Ibbotson S., Dawe R., Eadie E., Moseley H. Nine out of 10 sunbeds in England emit ultraviolet radiation levels that exceed current safety limits. British Journal of Dermatology, 168 (2013), No. 3, 602-608
[34] Dybczyński W. Ocena zagrożenia spowodowanego promieniowaniem optycznym, Przegląd Elektrotechniczny, 01, 2003, 17-21
[35] EN 62471:2008. Photobiological safety of lamps and lamp systems (IEC 62471:2006, CIE S 009: 2002)
[36] Pawlak A. Spektroradiometryczna metoda oceny bezpieczeństwa fotobiologicznego źródeł emitujących promieniowanie, Przegląd Elektrotechniczny, 95, 2019, nr 10, 219-224
[37] Wolska A., Latała A. Ocena ryzyka zawodowego związanego z ekspozycją na naturalne promieniowanie nadfioletowe, Bezpieczeństwo Pracy : nauka i praktyka, 07-08, 2011, nr 7/8, 12-16
[38] Wolska A., Latała A., Brański Z., Suchowicz B. Zadanie Monitorowanie ekspozycji na naturalne promieniowanie nadfioletowe u pracowników zatrudnionych na zewnętrznych stanowiskach pracy. Sprawozdanie z 3 etapu pt. Weryfikacja metodyki na podstawie badań pilotażowych. Przeprowadzenie badań i oceny ekspozycji na naturalne promieniowanie UV pracowników zatrudnionych na zewnętrznych stanowiskach pracy. Opracowanie metody oceny ryzyka zawodowego związanego z naturalnym promieniowaniem UV. CIOP-PIB, Warszawa, 2010, nr 4.5,10 pt
Authors: Anatolii Semenov, professor of the Department of Mechanical and Electrical Engineering, Poltava State Agrarian University, 1/3, Skovorody, St., Poltava, 36003, Ukraine, E-mail: asemen2015@gmail.com; Stanislav Popov, professor, head of the Department of mechanical and electrical engineering, Poltava State Agrarian University, 1/3, Skovorody, St., Poltava, 36003, Ukraine, E-mail: stanislav.popov@pdaa.edu.ua; Serhii Yakhin, professor, head of the Department of Construction and Professional Education, Poltava State Agrarian University, 1/3, Skovorody, St., Poltava, 36003, Ukraine, E-mail: sergii.iakhin@pdaa.edu.ua; Bauyrzhan Yeleussinov, Director, Branch of JSC «NCPD Orleu» Institute of professional development in Kyzylorga region, 2, Aiteke bi, St. Kyzylorda, 120700, Kazakhstan, E-mail: baur_1960@mail.ru; Tamara Sakhno, professor of the Department of Biotechnology and Chemistry, Poltava State Agrarian University, 1/3, Skovorody, St., Poltava, 36003, Ukraine, E-mail: sakhno2001@gmail.com
Source & Publisher Item Identifier: PRZEGLĄD ELEKTROTECHNICZNY, ISSN 0033-2097, R. 100 NR 2/2024. doi:10.15199/48.2024.02.31


