Published by Elshad Safiyev1, Saida Kerimova2, Kubra Mukhtarova3, Azerbaijan State Oil and Industry University ORCID: 1. 0009-0005-4971-1721
Abstract. The article describes in detail the causes of electric danger, the types of its effects on the human body, and ways to protect against the danger. Schemes of connecting people to single-phase and two-phase current circuits and their possible consequences are investigated. The possible consequences of residual charge, induction charge, static electric charge in the circuit and their influence are reflected in the article. It is shown on what factors step tension depends on, how this tension affects people. The formation of the potential difference in the air gap, the piercing due to the decrease in the electric strength of the air, the effect of the thermal damage of the arc discharge on the body were analyzed.
Streszczenie. W artykule szczegółowo opisano przyczyny zagrożenia porażenia prądem elektrycznym, rodzaje jego oddziaływania na organizm ludzki oraz sposoby ochrony przed zagrożeniem. Badane są schematy podłączania ludzi do jednofazowych i dwufazowych obwodów prądowych oraz ich możliwe konsekwencje. W artykule omówiono możliwe skutki obecności ładunku szczątkowego, ładunku indukcyjnego, statycznego ładunku elektrycznego w obwodzie oraz ich wpływ. Pokazano od jakich czynników zależy napięcie krokowe, jak napięcie to oddziałuje na człowieka. Analizowano powstawanie różnicy potencjałów w szczelinie powietrznej, przebicie w wyniku spadku wytrzymałości elektrycznej powietrza, wpływ uszkodzeń termicznych wyładowania łukowego na ciało. (Badania niektórych problemów bezpieczeństwa elektrycznego)
Keywords: electrical safety, safety rules, single-phase touch, two-phase touch, residual load, induction load, static load, step voltage
Słowa kluczowe: bezpieczeństwo elektryczne, zasady bezpieczeństwa, dotyk jednofazowy, dotyk dwufazowy, obciążenie resztkowe
1.Introduction
The term “electrical safety” refers to the system of technical and organizational measures and means that ensure protection of people from the harmful and dangerous effects of electric current, electric arc, electromagnetic field and static electrification. The theoretical justification and development of such a system and its separate components is the most important part of the work done during the design of objects in any sector of the national economy. It is no coincidence that there are many divisions of electrical safety: in production, agriculture, mining industry, mobile devices, buildings and structures, etc. But all these sections are based on common requirements – electrical safety. Electrical safety requirements are regulated by various Regulations. Although the documents at the design stage of the object are agreed with the control bodies that require strict compliance with the Rules, a lot depends directly on the specific people who organize and perform the work during operation, and here, for various reasons, in some cases they ignore the requirements of the Safety Rules.
Scary posters have little effect on a modern person surrounded by technology. There can be only one effective way to prevent electrical injuries – to have a conscious attitude to electrical safety issues, based on the understanding of the nature of physical processes by employees. However, the Rules contain only unexplained requirements, and other literary sources are either presented in a populist or declarative manner and do not provide a complete picture of the danger of a specific violation of the Rules.
We recommend that the training of electrical safety issues in enterprises and organizations be carried out in a sequence based on current experience:
– the effects of electric current on the human body;
– possible schemes for connecting a person to an electrical circuit;
– characteristics of measuring insulation resistance of electrical devices;
– features of selecting technical means for protection against electric current when a person touches the body and live parts of electrical equipment.
Types of effects of electric current on our human body.
In the number of people who are temporarily disabled due to injuries at work, those who receive electrical injuries do not exceed 2%. However, among fatal injuries, electrical injuries account for more than 12%, which means that one-seventh of fatal injuries are due to electrical current. The main reasons for the widespread occurrence of fatal electrical injuries are:
– electric current and physiological incompatibility of biological processes in the body;
– lack of signs of danger (smoke, lighting or other signs) in current-carrying parts or metal structures that are under voltage due to accident;
– most workers do not understand that it is dangerous to touch live parts.
Electric current has a complex physiological effect on a person, which can be divided into the following four groups:
Biological effect. Human life depends on the normal functioning of the central nervous system and cardiovascular system. It has been determined that electrical processes are the basis of the work of both the central nervous system and the cardiovascular system. Therefore, the external current disrupts the work of these systems – it is not physiologically compatible with them.
Heat effect. Sources of thermal effects can be high-frequency currents, metal objects and resistors heated by current, electric arc and open current-carrying parts.
Chemical effect. The human body consists of nonpolar and polar molecules, cations and anions. All these elementary particles are in continuous chaotic heat movement, which ensures the vital functions of the body. When the elementary particles in the human body come into contact with current-carrying parts, they are not chaotic, but a directed, strictly oriented movement of ions and molecules that disrupts the normal functioning of the body is created.
Secondary injuries. A person’s reaction to the effect of current is usually manifested in the form of a sharp involuntary movement, such as withdrawing the hand from the point of contact with a hot object. Falling, hitting nearby objects, etc. during such movement. due to which body parts can get mechanical damage.
Possible schemes of connecting a person to a current circuit.
Current injection has individual characteristics. However, from a theoretical point of view (analysis of the physical nature of electrical sources and quantitative assessment of current circuit parameters), the causes of current flow through the human body are divided into the following typical schemes:
1) bipolar touch;
2) unipolar touch;
3) residual load;
4) induced load;
5) static electric charge;
6) step voltage;
7) electrical piercing of the air gap.
2. Materials and methods
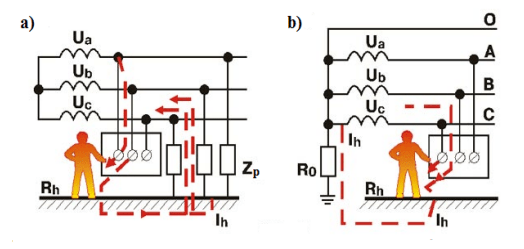
Bipolar (two-phase) contact. In this mode, a person touches parts of the body with opposite polarity currents with two points (Fig. 1).
Circumstances of generation. Cases of bipolar touch are relatively rare, as a rule, the result of gross violations of safety rules. They usually arise in electrical equipment with a voltage lower than 1000 V, when using faulty protective devices, when working under voltage, as well as in the operation of electrical installations with unprotected open current-carrying parts (unclosed switches, boards with unprotected clamps, experimental work, etc.) .
Possible consequences of bipolar touch. In this case, the touch voltage is equal to the operating voltage, and therefore the current passing through the human body in alternating current networks with a voltage above 100 V exceeds the permissible limit (16 mA) and the fibrillation limit (100 mA). Therefore, such contact with current-carrying parts usually results in death (if the injured person is not given timely help).
Protective measures. In this mode, the resistance of the human body is connected in parallel with the resistance of the network load. Therefore, it is not possible to detect the presence of a person in the circuit with automatic protection devices. In this case, it is necessary to fully implement the organizational protection measures provided for in the Safety Rules, which take into account the work in the case of non-disruption of the voltage in the current-carrying parts under tension, and to use the protective means.
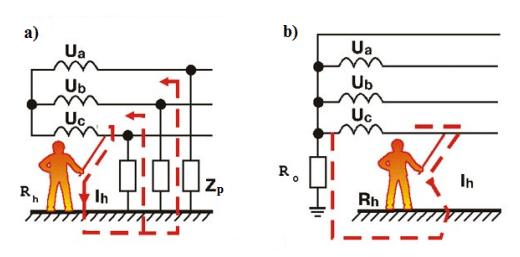
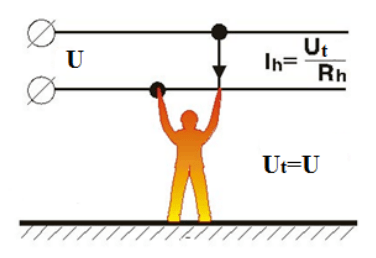
Single-pole (single-phase) contact. In the single-phase contact mode, only one point of the human body touches the current-carrying part. Conditions for creating the circuit. Figure 2 shows the direct contact of a person with a current-carrying part when violating the safety rules in one way or another. However, single-phase contact mode occurs more often if a person does not violate these rules, and only touches the body of the electrical equipment, not the current-carrying part (Fig. 3).
If there is a defect in the equipment, such as a phase-to-body fault, the circuit current Ih will be the same as in the previous scheme. Most electrical injuries occur in this mode.
Possible consequences of single-phase tapping. Here, the circuit current Ih is closed either by the leakage resistance ZF (in earth-isolated networks) or by the earthing resistance RO of the neutral of the power source. In general, single-phase touch mode is less dangerous than two-phase touch mode, because here the touch voltage value is limited by the leakage resistance. However, in networks with the neutral grounded, as well as in networks where the neutral is isolated but has a large capacity, the danger of this mode is adequate to the danger of the two-phase contact mode.
Technical protection measures. Depending on the type of electrical installation, the operating conditions and purpose of the electrical equipment, protective grounding, zeroing, protective opening, protective shunting, protective separation of networks and insulation control are applied.
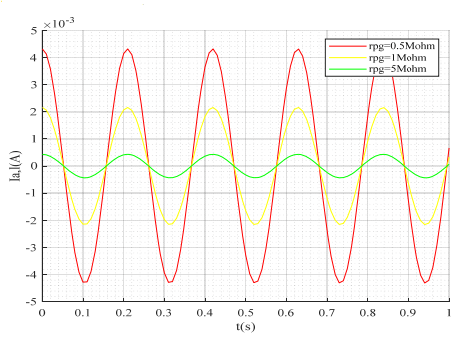
Residual load. Circuit diagram of a person. Residual charge refers to the charge that remains in the capacitor for some time after the power source is turned off. The scheme of connecting a person to an electric circuit is created when he touches one of the plates of the capacitor.
Circumstances of generation. Each network or device has a capacitance relative to earth (ground) and poles (phases). If the insulation resistance is high, the potential may remain for a long time in the current-carrying parts due to the residual charge of the capacitor after the operating voltage is removed. In this case, if a person touches a current-carrying part, the process of discharge of capacity passes through his body. Analogous processes also occur when there is inductance in the circuit. According to the Rules of Operation of Electrical Equipment, power transformers should be disconnected from the circuit every year and the ohmic resistance of their windings should be checked. Mobile ohmmeters usually use 4-6 V constant voltage sources. When you open the ohmmeter, for example, the current pulse generated during the discharge of its inductance in its low-voltage circuit is transformed into a high-voltage circuit. If at this moment a person hits the pole of the latter, secondary damage is inevitable. Let’s consider the scheme of damage by electric current in a single-phase network.
We assume (R1, R2) > Rh, which should be so, because at low values of insulation resistance, the residual charge quickly disappears and the network becomes safe in terms of the possibility of electric shock.
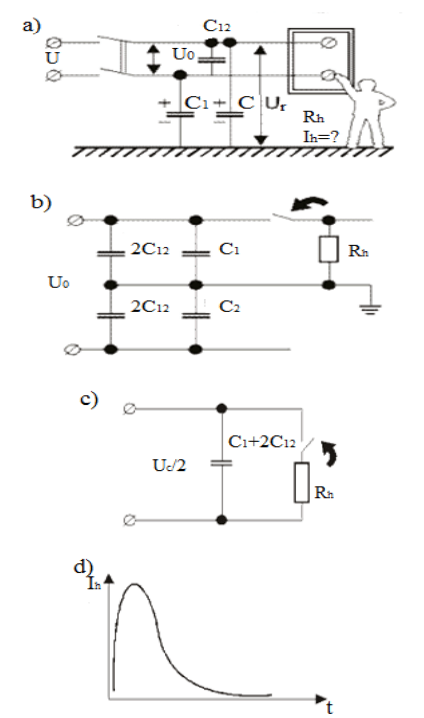
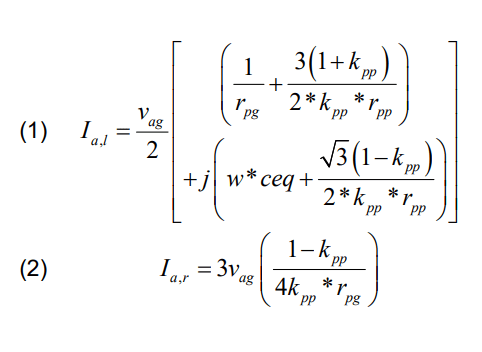
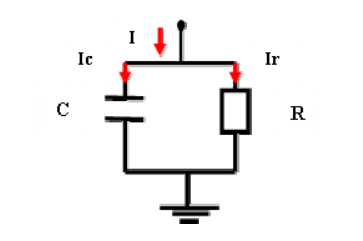
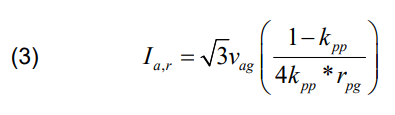
We simplify the calculation scheme by dividing the capacitance C12 into two consecutive combined capacitances, each of which has a value of 2C12 (Fig. 4,b). The last calculation scheme (Fig. 4,c) allows to find the discharge current of the capacitor (C1+2C12) passing through the resistor Rh at the starting voltage U0/2 using the known formula:
lh = U0 exp(-t/Rh(Cl + 2C12)/2Rh.
Protective measures. One of the main safety rules comes from the lh formula: after switching on the working voltage, do not touch the current-carrying parts without discharging the capacity.
Thus, the maximum value of the current lh is determined by the value of the residual voltage U0 and the resistance of the human body, and the duration of the transition process depends on the values of the capacitances relative to the ground and between the poles of the network. The usual effect of residual load is secondary damage. To discharge the capacitors, it is necessary to connect the wire (probe) of the discharger to the grounded structure (part), and then touch the current-carrying part with the probe. The sequence of the indicated operations cannot be changed, because in this case the discharge current will pass through the human body.
Inductive load. Circuit diagram of a person. In this mode, a person touches an impermeable metal object (structure) located in the zone of an external electromagnetic field.
Circumstances of generation. The conditions for the formation of induction loads are different. Induction charges are created in bulky metal objects located in the zone of influence of electromagnetic fields. Under the influence of the external field, the charge on the surface of the conductor is distributed in such a way that the total area inside the conductor is equal to zero. The relaxation time of electric charges in metals is 10-18 – 10-16 seconds, so the uniform distribution of charges on metal bodies makes changes in the external field practically inertia-less. The induction vector of the external field is connected to a load of a certain sign. A charge of opposite sign and equal value becomes free and causes the non-zero potential of the uncharged object to appear. When the external field disappears, the induced charges compensate each other. According to the law of electromagnetic induction, an electric motive force with a value of up to 1000 V is generated in metal objects located in the zone of a high-frequency electromagnetic field. Induction load is also formed under the influence of parasitic capacitance connections.
Possible consequences of the effect of induction. The forms of influence of induced loads are quite diverse. Dangerous consequences – secondary injuries, burns from spark (arc) discharge, fire when fuel ignites.
Static electricity charge. Circuit diagram of a person. In this mode, a person touches a metal object isolated from the ground or a structure made of insulating material carrying a static electric charge. When a person is on a floor made of insulating material and has a static charge on it, it can also be a mode of touching a grounded metal structure.
Circumstances of generation. Static electric charges are caused by the movement (friction) of solid, liquid or gaseous dielectrics against other conductive or nonconductive materials.
Possible effects of static electricity. With the widespread use of high-resistance plastic materials (pipes, floor coverings, etc.), the possibility of generating static electricity charges has increased significantly. Static electric charges create a high potential. The human body has a capacitance of about 200 pF relative to earth. When it is on an insulated floor (linoleum), a charge of up to 0.43 mCoul of energy can accumulate on it as a result of clothing rubbing against the skin. Thus, from the well-known formula of capacitor energy, we get that the value of the potential of the body relative to the ground is more than 500 V; When touching a grounded metal object (heat radiator, work clothes cabinet, etc.), a person will feel a surge (a discharge current of his own specific capacitance). Such loads pose a great danger to microcircuit elements during the installation of printed circuit boards. Usually, to prevent them from failing, the tip of the soldering iron is grounded, or the installer wears a grounded wristband; the most effective measure is to wear linen clothing that eliminates the possibility of creating an electrostatic charge.
The main types of static electricity discharges:
a) discharges between conductive bodies – formed as a result of electrification and accumulation of charge on isolated conductors (metal containers for people, liquids and materials, vehicles on rubber tires, etc.);
b) discharge from charged dielectric to conductive structures (rubber or plastic tanks; drums and canisters for storage and transportation of petroleum products and pomegranate materials; dielectric pipes for transportation of these materials, etc.);
c) crowning of dielectrics – the discharge caused by the potential difference between the internal and external surfaces of the structure (pipes for transporting liquid and pomegranate materials, pneumo-transport pipelines);
d) sliding discharges – arise in the process of electrification of solid surfaces by friction.
Protection measures. Protection is provided by creating circuits to eliminate static electric charges (grounding of metal structures, adding conductive mixtures to them to reduce the ohmic resistance of insulating materials, periodically washing insulating structures with conductive liquids, etc.).
Step voltage. Circuit diagram of a person. A person is exposed to the voltage in the zone of current propagation, that is, near the place where the current conductor is connected to the ground on the surface of the earth.
Circumstances of generation. In the current propagation zone, according to the expression I(x) = k/x, the potentials of all points on the earth’s surface are different.
Possible effects of step voltage. The step voltage depends on two main factors – the maximum potential of the current (I) in the propagation zone and the distance from the human error point (x). At the farthest points of the diffusion zone, the step voltage is small and the current through the human body flows in a “leg-to-leg” way Ih = Us/Rh. When a person approaches the point of closure of the current, the voltage Us increases, the value of the current rises, as a result of a convulsive reaction, the person falls, the size of the “step” increases (the distance becomes “arms-legs”), the value of Uad increases accordingly, the path of the current moves to the heart region.
Electrical piercing of the air gap. Circuit diagram of a person. This circuit is typical for high-voltage circuits. In a uniform electric field (for example, between the plates of a planar capacitor), the electrical strength of the air gap is 3-4 kV/mm, depending on the humidity of the air. That is, electric breakdown occurs between the plates of the capacitor at a voltage of 3-4 kV in an air gap of 1 mm at a voltage of 3-4 kV. When one or another part of the human body approaches a high-voltage conductive part, an electric field is created in the air gap, but this field is non-uniform (for example, like a needle plane or a needle line gap). In a non-homogeneous field, the electrical strength of the air gap sharply decreases to 4 kV/cm.
Circumstances of generation. What happens if a person enters the 6/0.38 kV transformer booth and puts his finger near the current-carrying part under 6 kV potential? The potential of the human body is equal to the ground potential (zero), so the potential difference in the “finger – conductive part” air gap is 6 kV. At this voltage, electrical breakdown of the air gap occurs and an arc discharge occurs. In unfavorable conditions, when the current in the circuit is interrupted, the thermal damage is completed by the biological electric current. An arc discharge (arc burn) destroys skin, muscle and bone tissue.
Protective measures. Protection of people from the dangers of the mode under consideration is achieved by ensuring the inaccessibility of current-carrying parts of the equipment.
3. Conclusion
1. Regardless of whether it is connected to the electric circuit with a single-phase or two-phase circuit, when the safety rules are violated, human life is in great danger.
2. Necessary measures should be taken from time to time to prevent induction loads and static loads and eliminate their effects on the human body.
3. People should be taught the rules of safe behavior in step stress.
4. Electrical safety rules should be constantly updated depending on the accumulated experience and scientific innovations.
REFERENCES
[1]. Wang B. et al. Electrical safety considerations in large-scale electric vehicle charging stations //IEEE Transactions on Industry Applications. – 2019. – Т. 55. – №. 6. – pp. 6603-6612.
[2]. CENELEC. EN 50522:2010. Earthing of Power Installations Exceeding 1 kV a.c.; European Committee for Electrotechnical Standardization: Brussels, Belgium, 2010.
[3]. Rules for electrical installations. 7th edition. Omega-L, 2008. – 272 p.
[4]. Rules for the technical operation of electrical installations of electrical energy consumers. PTEEP (as amended in 2022).
[5]. “Rules for the safe operation of consumer electrical installations”, Kyiv 1998
[6]. Dolin P.A., Medvedev V.T., Korochkov V.V. “Electrical safety: problem book: Textbook. allowance.” – M.: Gardariki, 2003.
[7]. Burgsdorf V.V., Jacobs A.I. Grounding devices for electrical installations. M: Energoatomizdat, 1987.
[8]. Belov S.V. and others. Life safety: Textbook for universities. M.: Higher. school, 2001. – 448 p.
[9]. J. Maxwell Adams. Electrical Safety: A guide to the causes and prevention of electrical hazards (Energy Engineering). The Institution of Engineering and Technology, 2004.
[10]. James R. White Electrical Safety: A Practical Guide to OSHA and NFPA 70E®, American Technical Publishers; 1st Edition, 2021- 438 p.
[11]. Elbrus Ahmedov, Sona Rzayeva, Nigar Ganiyeva, Elshad Safiyev, ”Improving the lightning resistance of high-voltage overhead power line”, Przeglad Elektrotechniczny journal, 2023(11).
[12]. Safiev E. S., & Abbasov V. I. (2022). COMPLEX ANALYSIS OF TRANSITION SUPPORTS OF THE MAIN HIGH-VOLTAGE LINES. Vestnik nauki, 4(11 (56)), 270-274.
[13]. Safıyev E., Pirieva N., & Bagirov G. (2023). “Analysis of the application of active lightning rods in lightning protection objects”. Internauka, 6, 14.
[14]. Safiev E. S., Ahmedov E. N., & Ibrahimova O. B. “ANALYSIS OF CRYOGENICS CABLES ELECTRIC ISOLATION WORKING CONDITIONS”.
[15]. Rzayeva S.V., Mammadov N.S., Ganiyeva N.A. “Overvoltages during Single-Phase Earth Fault in Neutral-Isolated Networks (10÷ 35) kV”, Journal of Energy Research and Reviews 2023 – 13 (1) – pp.7-13
[16]. Rzayeva S.V., Mammadov N.S., Ganiyeva N.A. “Neutral grounding mode in the 6-35 kv network through an arcing reactor and organization of relay protection against singlephase ground faults”, Deutsche Internationale Zeitschrift für Zeitgenössische Wissenschaft, 2023 – №42
[17]. N.M.Pirieva, S.V.Rzaeva, S.N.Talibov “Analysis of overvoltage protection devices in electrical networks” “Internauka”: scientific journal – No. 43 (266). Part 3. Moscow, 2022. pp. 14-17.
[18]. N.M.Piriyeva, S.V.Rzayeva, E.M,.Mustafazadeh. “Evaluation of the application of various methods and equipment for protection from emergency voltage in 6-10 kv electric networks of oil production facilities.” , Internauka, 2022. № 39(262). pp.40-44
[19]. Santos, M.; Calafat, M.A. Dynamic simulation of induced voltages in high voltage cable sheaths: Steady state approach. Int. J. Elect. Power Energy Syst. 2019, 105, 1–16.
[20]. IEEE. 80-2013/Cor 1-2015 IEEE Guide for Safety in AC Substation Grounding; Institute of Electrical and Electronics Engineers: Piscataway, NJ, USA, 2015.
Source & Publisher Item Identifier: PRZEGLĄD ELEKTROTECHNICZNY, ISSN 0033-2097, R. 100 NR 9/2024. doi:10.15199/48.2024.09.16