Published by Stanislaw CZAPP, Gdańsk University of Technology, ORCID: 0000-0002-1341-8276
Abstract. The main requirements of national regulations and international standards regarding protection against electric shock in electric vehicle charging installations are presented. The principles of using residual current devices (RCDs) in such installations are discussed. It is pointed out that RCDs are mandatory equipment for safe charging of electric vehicles. It is noted that the standards require the use of RCDs having an appropriate type of tripping, due to the fact that in the event of an earth fault in the charging circuit, a DC component of significant value may appear in the earth fault current. A new type of residual current devices for DC installations (DC-RCD) has been indicated.
Streszczenie. W artykule przedstawiono zasady ochrony przeciwporażeniowej i stosowania wyłączników różnicowoprądowych (RCDs) w instalacjach przeznaczonych do ładowania pojazdów elektrycznych. Omówiono wymagania przepisów i norm, w szczególności zwrócono uwagę na obowiązek stosowania takich zabezpieczeń w instalacjach ładowania pojazdów. Zaznaczono, że normy wymagają zastosowania wyłączników różnicowoprądowych o odpowiednim typie wyzwalania, aby zapewnić skuteczną ochronę przeciwporażeniową w przypadku pojawienia się w prądzie ziemnozwarciowym składowej stałej o znacznej wartości. Podano podstawowe informacje dotyczące nowego typu wyłączników różnicowoprądowych przeznaczonego do instalacji prądu stałego (DC-RCD). (Wyłączniki różnicowoprądowe w instalacjach ładowania pojazdów elektrycznych).
Keywords: charging, electric vehicles, protection against electric shock, residual current devices.
Słowa kluczowe: ładowanie pojazdów, pojazdy elektryczne, ochrona przed porażeniem elektrycznym, wyłączniki różnicowoprądowe.
Introduction
The number of electric vehicles (EVs) on the roads of many countries, including Poland, has significantly increased in recent years. The increase in the number of these vehicles contributes to the development of the charging infrastructure. Vehicles containing an electric motor(s) used for propulsion can be divided as follows:
• BEV (Battery Electric Vehicle) – a vehicle with a fully electric drive, without a combustion engine; the electric motor is powered by batteries that are charged from an external electrical installation (e.g. a dedicated charging station or a charging point powered by a home installation);
• PHEV (Plug-in Hybrid Electric Vehicle) – a vehicle equipped with both an electric motor and internal combustion engine; it can move in hybrid mode (combustion engine with electric assistance), or be propelled only by the electric motor or only by the combustion engine; the batteries that power the electric motor can be charged from the home electrical system or a charging station;
• HEV (Hybrid Electric Vehicle) – a vehicle equipped with both an electric motor and internal combustion engine; batteries powering the electric motor cannot be charged from an external electrical installation, and the energy for charging them comes from the system powered by the internal combustion engine and is recovered when the vehicle brakes;
• FCEV (Fuel Cell Electric Vehicle) – a vehicle equipped with an electric motor powered by fuel cells; hydrogen is refuelled from an external tank, which reacts with oxygen to generate electricity; this vehicle is not charged from the electrical power system.
Therefore, the charging installations are used by BEVs and PHEVs. The following charging modes for such vehicles are distinguished [5, 8, 11].
1) Mode 1 – the vehicle is connected to the AC installation using a single-phase (up to 250 V) or three-phase (up to 480 V) plug socket, with a rated current not exceeding 16 A; the vehicle power supply circuit should contain live conductors and a protective conductor. Therefore, the TN-C system is excluded. This charging mode is used in particular to charge the EV from a home installation. It is required that the circuit supplying the charging socket be protected by a residual current device (RCD).
2) Mode 2 – the vehicle is connected to the AC installation using a single-phase (up to 250 V) or three-phase (up to 480 V) plug socket, with a rated current not exceeding 32 A; the vehicle power supply circuit should include a protective conductor and a control system as well as a device for protection against electric shock (residual current device or as a module providing safety and control functions built into the vehicle power cable). Usually, the control and protection against electric shock is the responsibility of the control and protection module IC-CPD (In-Cable Control and Protection Device) integrated with the cable. In this charging mode, a power of up to 22 kW is obtained.
3) Mode 3 – the vehicle is connected to the AC installation via dedicated equipment, thanks to which communication between the charging point and the vehicle is ensured. The voltage is supplied to the vehicle only after proper communication between the charging point and the vehicle.
4) Mode 4 – the vehicle is connected to a DC charging point; charging can be done with very high power (even several hundred kW). In this mode, communication between the charging point and the vehicle is ensured, which performs safety and control functions.
Technical requirements relating to the charging infrastructure for electric vehicles are mainly contained in the regulations [18, 19]. The most important standards relating to the design of electrical installations, in particular in the field of protection against electric shock and the use of residual current devices, include PN-HD 60364-4-41 [6] and PN-HD 60364-7-722 [8]. The study discusses the most important provisions regarding protection against electric shock in EV charging installations and the use of residual current devices in them.
General principles of protection against electric shock
The basic rules regarding the safety of operation, repair and modernization of charging stations and charging points that are part of the charging infrastructure for public transport are contained in the regulation [19]. This regulation specifies that charging stations and charging points should be equipped with at least the following devices related to protection against electric shock:
• a main switch, disconnecting the power supply to all circuits;
• a residual current device, in the case of supply from the AC installation;
• an overcurrent protection.
This provision shows that a mandatory element of the charging installation is an RCD. However, the regulation [19] does not specify either the required rated residual tripping current or the type of the RCD (AC, A, F, or B). Regulation [19] also requires verification which includes, among others, the following tests relating to electrical installations:
• measurements of the continuity of protective conductors, including main and supplementary equipotential bonding conductors,
• measurements of the continuity of live conductors when there are ring final circuits,
• measurements of the insulation resistance of conductors, measured between live conductors themselves and between live conductors and the earthed protective conductor, • measurements of the earth electrode resistance if applied,
• verification of the operation of RCDs,
• other measurements necessary to assess the effectiveness of protection against electric shock.
The measures of protection against electric shock and other detailed requirements are specified in the PN-HD 60364-7-722 standard [8]. From the full set of measures listed in the PN-HD 60364-4-41 standard [6], the PN-HD 60364-7-722 [8] allows the use of measures in accordance with Table 1. If a TN system is utilized, the TN-S subsystem should be used.
Table 1. Measures of protection against electric shock in installations for charging of electric vehicles, according to PN-HD 60364-7-722 [8]

Rules for selection of RCDs
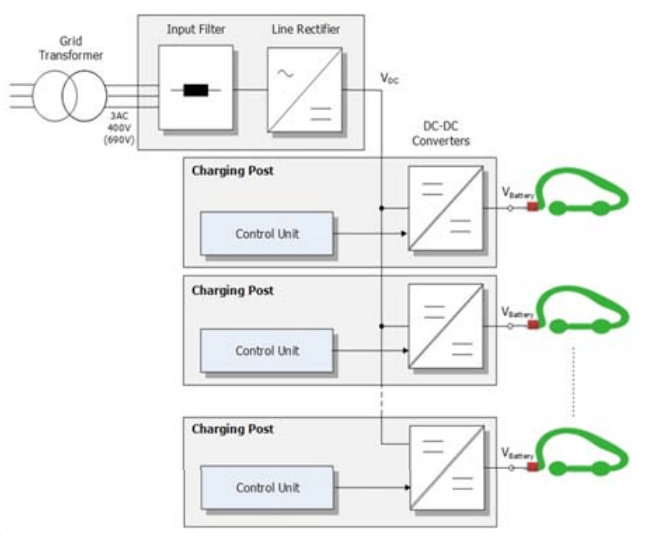
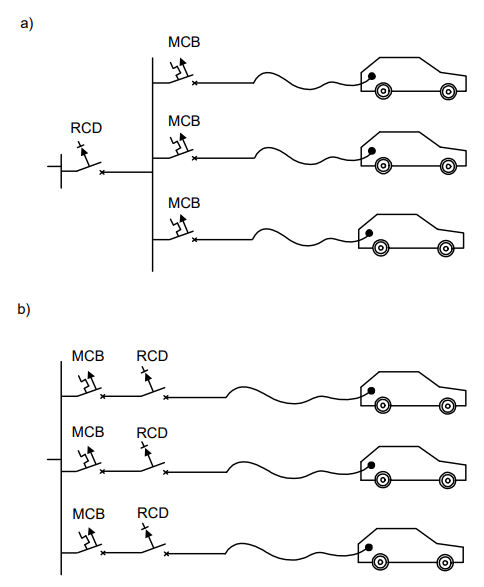
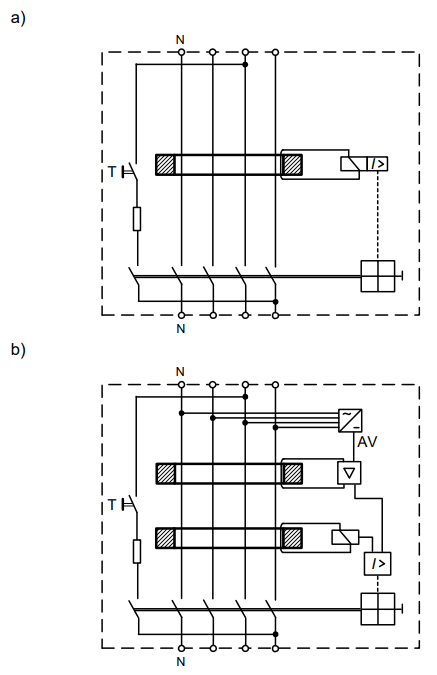
In accordance with the provisions of the PN-HD 60364- 7-722 standard [8], each connecting point of an electric vehicle should be individually protected with an RCD having a rated residual operating current not exceeding 30 mA. It follows that one RCD should not protect two or more circuits intended for EVs charging. If the RCD protects more than one circuit (Fig. 1a), then in the event of an earth fault in any of the final circuits, it is most likely that the RCD will trip and de-energize all final circuits. In the case of the solution presented in Fig. 1b, each circuit is equipped with an RCD. An earth fault on a given circuit will trip the RCD in the faulty circuit and will not interrupt power to EVs connected to other circuits. The application of a separate RCD per each circuit has yet another justification. In the case of a significant value of leakage currents appearing during the charging (several vehicles being charged at the same time), unnecessary tripping of the RCD collectively protecting several circuits could occur. If the solution from Fig. 1b is used, the probability of a large resultant leakage current is lower (only one charged EV per RCD).
It is important to choose the correct RCD from the point of view of its ability to detect the specific shape of the residual current. In EV charging installations, a DC component may appear in the earth/residual current, and for this reason, the PN-HD 60364-7-722 [8] standard requires the use of at least A-type RCDs (RCDs are not required if electrical separation as fault protection is used). In some cases, even this type of RCDs (A-type) is insufficient. The standard [8] requires that EV charging stations having sockets/connectors compliant with IEC 62196 [17] are protected by devices detecting a DC component of significant value (more than 6 mA). These may be devices built into the EV charging station or independent of it. Therefore, it should be used for this purpose:
• B-type RCDs or,
• A-type RCDs along with an additional device which enables detecting a DC component (RDC-DD device compliant with IEC 62955 [14]) or,
• F-type RCDs along with an additional device which enables detecting a DC component (RDC-DD device compliant with IEC 62955 [14]).
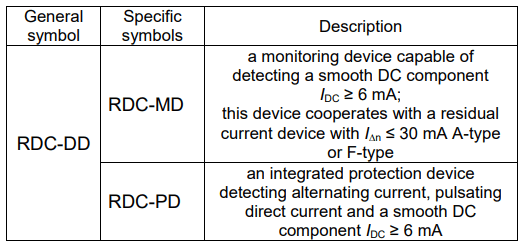
Table 2 presents the types of RCDs due to their ability to detect a specific shape of the residual current waveform and their usefulness in EV charging installations. Table 3 shows the RDC-DDs, which are intended for installations utilized for mode 3 charging.
Table 2. Types of RCDs due to the ability to detect a specific waveform shape of the residual current and their usefulness in installations for charging of EVs, according to [8-10]
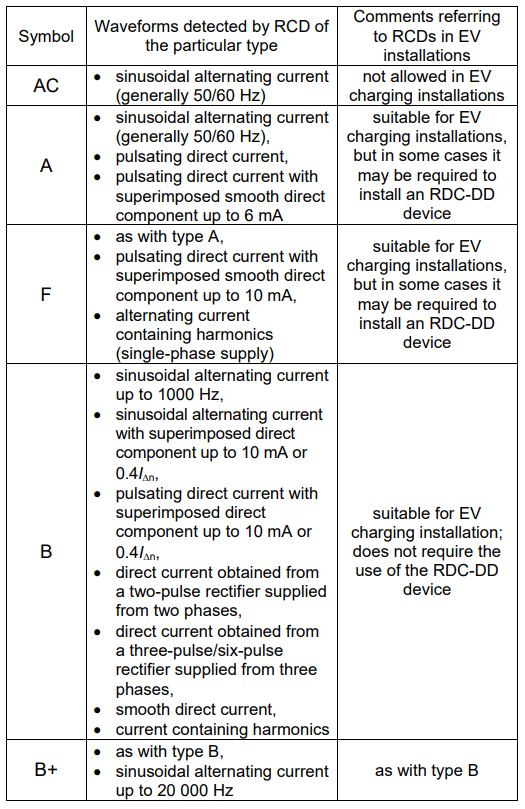
Table 3. Residual current protection devices intended for installations using mode 3 charging (RDC-DDs) according to [14]
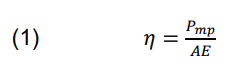
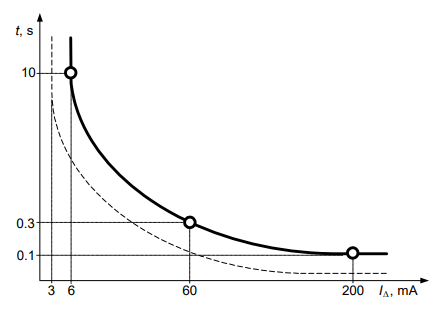
According to the IEC 62955 [14] standard, the following rated parameters of the RDC-DD device relating to DC residual current are specified:
• rated residual operating current IΔdc = 6 mA.
• rated residual non-operating current IΔndc = 0.5IΔdc = 3 mA.
The given rated value of IΔdc = 6 mA is related to the DC operating characteristics presented in Fig. 2. The standard [14] specifies the maximum permissible break time for the following three points: 6 mA, 60 mA and 200 mA. For rated residual operating current (6 mA) it is 10 s.
Due to the fact that the RDC-DDs are required to detect a high-value DC component (more than 6 mA), they need an auxiliary voltage to function properly. Fig. 3 shows a comparison of internal diagrams of A-type RCD vs. RDCDD.
For EV charging in mode 2, one can use a cable with the in-built IC-CPD device mentioned in section “1. Introduction”. This device should meet the requirements of the PN-EN 62752 standard [12, 13]. The cable with the IC-CPD device includes an RCD of IΔn ≤ 30 mA, which ensures the required protection against electric shock when it is uncertain whether there is a suitable RCD in the upstream power supply system. With regard to IC-CPD devices, the PN-EN 62752 standard [12, 13] requires detecting, among others:
• a DC component IDC ≥ 6 mA,
• a waveform containing a high-frequency component.
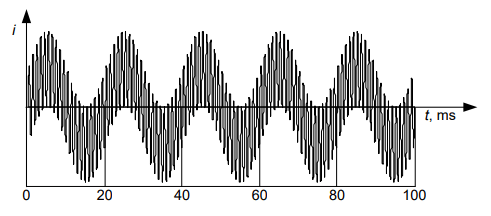
According to the standard [12, 13], the distorted test current should contain the following two components (50% each):
• a fundamental frequency component (usually 50 Hz),
• a high-frequency component 1000 Hz.
Fig. 4 shows the waveform composed of these two components. It is required that with such a distorted current, the RCD built into the IC-CPD device operates within the range (0.5–1.4)IΔn.
DC-RCD – residual current protection designed for DC systems
Recently, there has been an increasing interest in DC microgrids [1-3]. Such microgrids use photovoltaic sources and DC voltage to supply e.g. lighting in buildings [4]. Therefore, there is a need for RCDs that could be installed in DC networks and installations. The requirements for residual current devices for DC systems are regulated by the following standards:
• IEC 60755-1 General safety requirements for residual current operated protected devices – Part 1: Residual current operated protective devices for DC systems [15],
• IEC TS 63053 General requirements for residual current operated protective devices for DC systems [16].
These standards have introduced a new type of residual current protection – DC-RCD protection, which is adapted to DC systems. Among the main differences compared to RCDs designed for AC systems, some values of the rated residual operating current IΔn should be mentioned. The standard [15] distinguishes the following currents IΔn: 20 mA, 80 mA, 300 mA, 600 mA, 1 A, 2 A, 3 A, 5 A, 10 A, 20 A, 30 A. It should be noted that the value 80 mA is the highest permitted value that can be used to provide additional protection. Thus, DC-RCDs having IΔn ≤ 80 mA are equivalent to RCDs having IΔn ≤ 30 mA used in AC systems.
The tripping current of DC-RCDs should be within the range (0.5–1.0)IΔn. This is the same range as required for common RCDs when alternating current flows.
Conclusions
Residual current devices in electric vehicle charging installations are mandatory equipment. In these installations, the use of AC-type RCDs is not allowed. In the case of A-type or F-type RCDs, additional devices capable of detecting the smooth DC residual current of values higher than 6 mA have to be installed in some charging systems. It should be expected that in the near future, a new type of residual current protection – DC-RCD – will become popular on the market. This is a protection dedicated to direct current installations, which are more and more widely used.
REFERENCES
[1] Bignucolo F., Coppo M., Caldon R., Interconnecting neighbors’ buildings: advantages of energy districts realized through private DC lines, IEEE Int. Conf. on Environment and Electrical Engineering and IEEE Industrial and Commercial Power Systems Europe (EEEIC/I&CPS Europe), Palermo, Italy (2018)
[2] Marah B., Bhavanam Y. R., Taylor G. A., Darwish M. K., Ekwue A. O., A practical application of low voltage DC distribution network within buildings, 52nd Int. Universities Power Engineering Conf. (UPEC), Heraklion, Greece (2017)
[3] Weiss R., Ott L., Boeke U., Energy efficient low-voltage DCgrids for commercial buildings, IEEE First Int. Conf. on DC Microgrids (ICDCM), Atlanta, USA (2015)
[4] Zhang F., Meng Ch., Yang Y., Sun Ch., Ji Ch., Chen Y., Wei W., Qiu H., Yang G., Advantages and challenges of DC microgrid for commercial building – A case study from Xiamen university DC microgrid., IEEE First Int. Conf. on DC Microgrids (ICDCM), Atlanta, USA (2015)
[5] Czapp S., Residual Current Devices: Selection, Operation, and Testing, Academic Press (2022), https://doi.org/10.1016/C2020-0-02927-0
[6] PN-HD 60364-4-41:2017-09 Low-voltage electrical installations – Part 4-41: Protection for safety – Protection against electric shock
[7] PN-HD 60364-6:2016-07 Low-voltage electrical installations – Part 6: Verification
[8] PN-HD 60364-7-722:2019-01 Low-voltage electrical installations – Part 7-722: Requirements for special installations or locations – Supplies for electric vehicles
[9] PN-EN 61008-1:2013-05 Residual current operated circuitbreakers without integral overcurrent protection for household and similar uses (RCCBs) – Part 1: General rules
[10] PN-EN 62423:2013-06 Type F and type B residual current operated circuit-breakers with and without integral overcurrent protection for household and similar uses
[11] PN-EN IEC 61851-1:2019-10 Electric vehicle conductive charging system – Part 1: General requirements
[12] PN-EN 62752:2016-12 In-cable control and protection device for mode 2 charging of electric road vehicles (IC-CPD)
[13] PN-EN 62752:2016-12/A1:2020-10 In-cable control and protection device for mode 2 charging of electric road vehicles (IC-CPD)
[14] IEC 62955:2018-03 Residual direct current detecting device (RDC-DD) to be used for mode 3 charging of electric vehicles
[15] IEC 60755-1:2022-10 General safety requirements for residual current operated protected devices – Part 1: Residual current operated protective devices for DC systems
[16] IEC TS 63053:2017-06 General requirements for residual current operated protective devices for DC systems
[17] IEC 62196 Plugs, socket-outlets, vehicle connectors and vehicle inlets – Conductive charging of electric vehicles (multipart standard)
[18] Obwieszczenie Marszałka Sejmu Rzeczypospolitej Polskiej z dnia 10 marca 2023 r. w sprawie ogłoszenia jednolitego tekstu ustawy o elektromobilności i paliwach alternatywnych (Dz.U. z 2023, poz. 875)
[19] Rozporządzenie Ministra Energii z dnia 26 czerwca 2019 r. w sprawie wymagań technicznych dla stacji ładowania i punktów ładowania stanowiących element infrastruktury ładowania drogowego transportu publicznego (Dz.U. z 2019, poz. 1316)
[20] DFS 4, DFS 4 A EV, data on Doepke products, http://www.doepke.de
Author: prof. dr hab. inż. Stanisław Czapp, Gdańsk University of Technology, Faculty of Electrical and Control Engineering, ul. G. Narutowicza 11/12, 80-233 Gdańsk, Poland, E-mail: stanislaw.czapp@pg.edu.plAuthor: prof. dr hab. inż. Stanisław Czapp, Gdańsk University of Technology, Faculty of Electrical and Control Engineering, ul. G. Narutowicza 11/12, 80-233 Gdańsk, Poland, E-mail: stanislaw.czapp@pg.edu.pl
Source & Publisher Item Identifier: PRZEGLĄD ELEKTROTECHNICZNY, ISSN 0033-2097, R. 100 NR 2/2024. doi:10.15199/48.2024.02.11