Published by Dranetz Technologies, Inc., Case Study
Data Center uses Encore to monitor Demand Response Performance
A 1.2M square ft Data Center located in Northern New Jersey was participating in a Demand Response program utilizing their backup generators as the primary means of reducing their 7MW of load. The service provider that they worked with installed telemetry metering from the utilities KYZ pulse output to report the performance to the grid operator. However, the facility director wanted live access to the generators output so that they could measure the performance of the generators and watch loading on each of the four 2.5MW turbines in real-time and historically. And, it had to painlessly integrate into his existing BMS system over an IP backbone.
Backup generators are critical to the operation of a 24×7 facility, downtime is lost revenue and lost customers. A facility operator needs to know what’s happening to his system all the time, and electricity is the main backbone of his entire operation. Let’s face it, no matter how many T1’s are coming in from different carriers and different POP’s, if the electricity goes out everything stops working including communications.
Utilizing the Encore Series ES230 DataNode’s along with their existing Encore Series Software installation, the Facility Director was able to give his BMS team a Modbus map for the instruments which were easily programmed. Because these were backup generators installation was much easier, however they were done sequentially in bypass mode because no one knows if or when the power will go out and the engines would be needed for an emergency. After the installation was complete and the integration into the BMS was done, the facility manager performed a live test and the results were perfect. The facilities network operations center (NOC) was able to read the instantaneous values from the generators from their control room, the ES230’s were also integrated into the existing Encore Series Software system so the facilities engineers also gained that they were able to see all of the instruments remotely when needed.
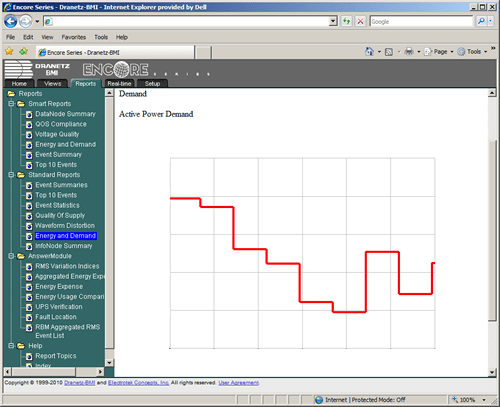
The graphs below display how easy it is for a user to view their reports on energy usage, demand, and any other electrical parameters recorded in the Encore Series Software from any remote location.
.
.
The ES230 DataNode’s are small and easy to install and configurable either at the local display or through the Encore Series Software. These instruments are capable of recording Volts, Amps, kW, kWh, kVA, kVAR, Power Factor, Harmonics, and a variety of other parameters simultaneously. They also have the option of RS232, RS485, or Ethernet communications and support native Modbus protocols. The Encore Series Software is a web enabled application that does not require the installation of any software on a local users computer. The system can be accessed from any web-enabled browser by multiple people simultaneously, and performs a variety of operations, including; data collection, data analysis, reporting, alarming, and remote setup of the equipment. With the Modbus driver installed the software can easily read data from any previously installed instrument that supports the Modbus protocol. Additionally, the software allows for easy expansion, including the addition of Power Quality instruments for more detailed analysis of power anomalies.
Published by Tomasz SIEŃKO1, Jerzy SZCZEPANIK2, Cracow University of Technology, Krakow Poland (1), Cracow University of Technology, Krakow Poland (2) ORCID: 1. 0000-0002-3645-5694; 2. 0000-0001-5633-8359
Abstract. Increased Penetration of the Polish Power Supply System by renewable sources (RES) leads to a number of serious and new problems. The problems are associated with evacuating energy from producers (particularly visible for PV installations), change in the direction of power flow in the lines of the transmission and distribution system, problems with balancing energy production in the system related to uncertainty production of RES and a limitations in the possibility of control range of classic power plants. The current EU legislation leading to the increase of RES penetration will cause a significant rise appearance of in these problems. In principle these problems are unsolvable without the use of effective and achievable on a large scale methods and technologies of energy storage. The article estimates the generation level, generation variability and possible shortages in wind energy production in Poland in the case of the expansion of wind farms into offshore farms on the Baltic Sea. Data used in paper are based on some years of work inland RES in Poland available from PSE site. The idea is to adjust an operation of the power system to the basic formula of energy production and consumption balance with the required stability margins. A simple algorithm for estimating the size of the energy reserve necessary to stabilize the operation of the power system has been proposed. An important problem is also the assessment of the “geographical premium” (location). Theoretically, with the growth of the analyzed RES production area, the stability of DER production should increase since it become independent from purely local weather conditions.
Streszczenie. Wzrost Penetracji Polskiego Systemu Elektroenergetycznego przez źródła odnawialne (OZE) prowadzi do szeregu problemów: kłopotów wyprowadzeniem energii od producentów (szczególnie widoczne dla instalacji PV), zmiana kierunku przepływu mocy w liniach systemu przesyłowego i rozdzielczego, kłopoty z bilansowaniem systemu związane z niepewnością produkcji OZE oraz ograniczeniem w możliwości regulacji klasycznych elektrowni. Obecne prawodawstwo UE spowoduje znaczny wzrost tych problemów, w zasadzie nierozwiązywalnych bez efektywnego i olbrzymiego składowania energii w SEE. W artykule oszacowano poziom generacji, zmienność generacji oraz możliwe niedobory w produkcji energii wiatrowej (produkcja DER) w Polsce w przypadku rozbudowy farm wiatrowych na farmy morskie nad Bałtykiem. Ideą jest dostosowanie pracy systemu elektroenergetycznego do podstawowego bilansu produkcji i zużycia energii z wymaganymi marginesami stabilności. Zaproponowano prosty algorytm szacowania wielkości rezerwy energii niezbędnej do ustabilizowania pracy systemu elektroenergetycznego. Istotnym problemem jest również ocena „premii geograficznej” (lokalizacji). Teoretycznie wraz ze wzrostem analizowanego obszaru powinna wzrastać stabilność produkcji DER (niezależność od czysto lokalnych zjawisk pogodowych). (Rosnąca penetracja OZE do Systemu Elektroenergetycznego w Polsce)
Keywords: distributed energy resources, power system, wind power generation, power system stability, power system reserves. Słowa kluczowe: rozproszone źródła energii, system elektroenergetyczny, generacja energii z wiatru, stabilność systemu elektroenergetycznego, zapasy energii w systemie elektroeneretycznym.
Introduction
Until today, in power system, the energy needs by system loads has to be met by energy production to obtain constant frequency and voltages at system nodes. Of course some changes of those quantities are possible, but they are limited by system energy quality and stability constraints standards. Figure 1 shows the structure of production, usage and planned storage of energy in power system in Poland.
In general, two power systems operations modes are possible: one when system energy production and usage is balanced and energy is delivered to all customers constantly and uninterrupted according to the energy quality standard and second operation mode where breaks and disturbances in power delivery will be acceptable for less demanding applications and customers. This means, that in second case, customers has to be divided into ones where delivery breaks are possible and to ones where brakeless energy delivery is required. First group include mainly housing estate and second one is mainly industry and loads where continuous supply is required and customers such as hospitals, road traffic, rail power supplies etc. Such segregation of customers will be done on relatively low voltage and it has to work similar to SCO (self-acting frequency-dependent system unload who can disconnect the certain groups of customers from a supply). Legal regulations together with technical instructions still exist in Poland and they are related to the situation energy shortages at the turn of the 1970s and 1980s. Usually local operators can disconnect certain medium voltage feeders outgoing from high to medium voltage stations (in Poland is called GPZ – main supply 110/15 kV stations) to balance energy flow.
This modes of work of supply network should be discussed by the inhabitants of a given area.
The second mode of power system work is quite possible even now, when the supply from DER’s sources is on relatively high level and due the weather conditions it will rapidly decrease, and level supplied from basic power stations and existing reserve will be too small or to slow to balance system. Unfortunately, in the most of the analyses of wind energy costs as for example in the works [1], [2] the cost assessment ignores the cost of reserves and does not consider the real variability of energy production in the area [3]. The cost ocean, which in the case of grid connection analysis is an acceptable simplification but in in the case of the EEE stability analysis, no. It should be mentioned that in this case when support from neighbouring countries is possible (look at the failure of the energy supply to system from the Bełchatów power plant – 3500MW (compare to about 18000MW produced by whole coal using power plants). The breakdown lasted fiew hours and do not influenced system work due to support from power systems of neighbouring countries. Especially small support was given by German power system where large amount of energy is produced by DER.
As we can see two concepts of system work are possible and at the end, for both cases, the balance of the supply system is achieved in different ways- by increasing the energy production, or by decrease its load for a certain time. The increase of energy delivery is usually done by employing system reserves or by increasing energy import from adjacent countries (if it is possible).
Fig.1. Schematic of energy flow in polish power system with predicted extra energy storage for energy surplus from renewable sources.
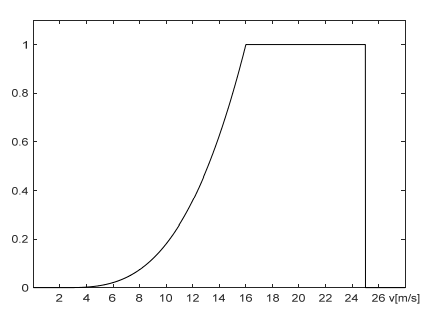
Fig.2. Typical windmill power characteristics – X axle wind speed, Y axle relative (per unit) windmill power
The second mode of power system work include not only increase of the production but also the decrease of energy usage for a certain time needed to balance system. The observation of power flow on the PSE (Polish System Operator) internet site clearly shows large influence of intersystem flows from neighbouring countries in Polish system balance even during relatively calm times (small changes in energy usage and production from conventional power stations). Questions is if they will be enough to create reserve for new installations of DER sources since new massive investments at Baltic Sea.
Offshore windmills have different characteristics than onshore ones – utilization rate up to 40% and more stable production. Thus in principle, they require a separate analysis and later a possible analysis of cooperation for onshore and off shore cooperation. Analysing available data, one has to think about windmills located onshore right next to the sea – maybe some of their share resulted in the formed used factor of 0.26 instead of 0.22-0.24 for windmills located deep onshore what appears in several publications.
DER resources production data variability and Analysis of wind and solar energy production for existing data
DER sources energy production depends not only on weather conditions, but also on resources characteristics. They are non- linear functions of wind speed for windmills (figure.2) and also for solar modules the dependence of energy production on solar radiation is highly non-linear. Moreover solar panels do not work during the night and windmills do not produce energy when wind speed is lower than their starting point.
DER sources in Poland are mainly windmills and photovoltaic panels. The available data to estimate production of those sources and their dynamics are based on:
Data from meteorological stations regarding wind and solar operation. The data from those sources are generally from inhabited areas inside landmass and are affected by local conditions (wind and solar station location). This happens especially in Poland where majority of DER stations right now are located inland (urban conditions)and they are separated from the location of meteorological stations [4] To estimate DER production additionally one has to include sources distribution and characteristics (regardless of the meteorological data). The advantage of these sources are long series of measurement data, but unfortunately moderately useful in the light of the impact of climate change [5].
New wave measurements based on satellite systems data – available for every part of the globe as the continuous measurements –for a certain areas which are available due to satellite placement. The measurements data are more area dependent and usually available for a certain area and also these data can contain historical information for a certain areas which are available. The problems which are associated to DER usage are: Energy production estimation is similar to shown in previous section – this information is used in DER expansion planning, production forecasting and modelling. The measurements are available in [6].
Information from energy markets regarding present DER energy production and maximisation of this production according to European energy low. The information delivered by the energy markets contained hidden data about DER distribution at a certain area – in existing onshore locations, beneficial locations were already identified and for average characteristics of DER optimal energy production was calculated. This limits the expected changes for those windmills locations. The EU legal situation is as follows: each production of DER sources must be purchased by the electricity system operator in accordance with the provisions of EU law [7] [8]. This means that the market data about DER generation in local power subsystems should be very close to maximum temporary energy production which depend on actual weather conditions. When analysing the impact of the law on DER sources energy production it is worth to compare the data available from European operators [9], [10], and Californian operators [11].
Analysis of electrical energy production by wind energy at the area of Poland (PSE DATA)
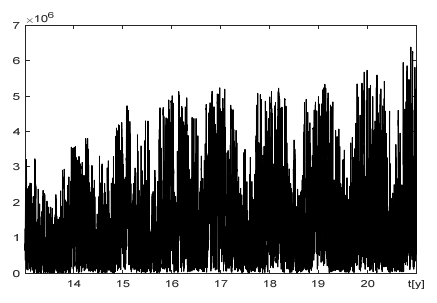
The analysis of the energy production by windmills was done on basic on available old PSE data from period of time between 01.01.2013 to 12.31.2021. The choice of data was dictated by relatively large power of windmills installed during this time it ranged from 3 to 7 GW (During this time the windmills were installed only inland) The available data about windmills production are shown in Figure 3. The available interval of data is one hour for the time period under consideration.
Fig.3. Power delivered by windmills to Polish power system in years 2014-2021 – x axis time in years, y axis – production of power in GW; data with one hour interval
Fig.4. Windmill power installed in Poland in GW during the years (according [12] and [13]).
The figure shows the increase of windmill power associated to the increase of yearly installed production facilities. Thus, further analysis required data normalization with respect to the power of installed windmills [12],[13]. Powers of installed windmills are available at monthly intervals in figure 4. To normalize data windmill power production during the month was divided by the number of windmills installed and able to give power during this month. The information about the normalized production (coefficient of windmill power utilization), its variability and degree of its usage are compared to maximum the power of installed windmills what is shown in Figure 5.A.
It should be noted that the maximum possible production of wind energy could be higher than in this diagram since energy absorption by power system is limited by the stability requirements or local power transmission possibilities (overload of system elements). The legal situation forces the consumption of all possible renewable energy, so probably the minimum values and the slope of the falling slopes are more error-prone than the values of the maximum values and the slope of the rising slopes (the value sought and estimated is rather the maximum possible use of wind energy at a given moment).
Based on the energy production availability data, the following data were also estimated: median (median value from normalized values of function of windmills usage) – 0.2057; mean value -0.2652; effective value (RMS) -0.3388; maximum value –0.9609; and minimum-0.0014; and the production was averaged in annual intervals – the results are presented in the Figure 6
Fig.5. Normalized variation and utilization rate of production for windmills in years 2014-2021 -X axis time years, y axis currently obtained power in relation to installed power. Its cumulative distribution function is shown in figure b)- X axis Value, Y axis cumulative probability (probability that the value will be lower than on the axle X)
Mathematic elements of the analysis
The averaging of energy production by windmills was performed in yearly periods according to the following algorithm:
.
The analogic times intervals were used when the median values were calculated – they and shown in figure 6.
Visible not too large fluctuations in the average usage in each calculation period can be justified by opening a new wind farm with a slightly higher or lower (than the average for the system) average utilization of windmills related to better location or better use of turbines which adaptation to local conditions are improved or the influence of cyclical or cyclical quasi climatic oscillations with a period of phenomenon different from one year (like for example ELNINO).
Fig.6. Mean value (blue) and median one(red) of the coefficient of windmill power utilization in wind farms connected to the Polish power system, averaged over an annual moving range. X axis beginnings of averaging interval (hour from the beginning of the measurement series), Y axis mean (blue line) value and median value (red line).
It should be recalled that due to the non-linear characteristics of the windmill shown in Fig.2 small changes in wind speed can translate into significant changes in energy generation. This fact influences median that way that it is smaller than average value (widely dispersed values of energy production) [fig. 6].
Analyzing Figures 5 and 6, it should be noted that wind generation in Poland is characterized by a low coefficient of windmill power utilization thus the median value (i.e. the value for which 50% of samples are of lower value) falls to the levels of 0.16 to 0.24 and are interrupted by (relatively short) episodes of large energy production. The generation value during these episodes raises the average value from 0.22 to 0.3.
The second important parameter allowing to determine the level of ‘stress’ (need for use reserves or local blackout for power system balance) of electrical power system related to the operation of DER is the speed of energy production changes.
The analysis was performed according to the formula:
.
The results are presented in the figure 7 and were calculated in order to capture possible correlations between the volume of production and the size and speed of changes. No regularity was found. In order to confirm the analysis, a comparison of the relative variability of production to production value was compared (fig 8). Again, no other regularities were found.
Analysis of production charts and production variation charts indicates that wind energy production can possess very high dynamics and be highly dependent on weather conditions. As the penetration of these types of sources in the system structure increases, the amount of “stress” generated by them in power system will increase. It is especially related to the need to fast replacement. For example, if 10% -20% of the power generated by DER has to be replaced by other sources, not only it requires fast increase of the energy production in fully controllable power stations or reserve but also can introduce limitations of demand (by use local blackout or spinning blackout). The probability of the DER power change can be estimated on the basis of the figure 7b.
Fig.7. Absolute variability of the windmills production with respect to actual power (a) and its cumulative distribution function (b)
The scope of the analyzes of the impact of variability of wind energy generation on the operation of EPS covers the current situation (as in the paper [14]). However it is assumed that the lack of energy from these sources does not lead to serious disturbances in the operation of EPS what does not have to be true during high content of renewable resources in EPS energy production balance. It is worth to note that a high level of ‘stress’ will be associated with a situation, where a large energy production change occurs with high DER generation. In this situation the level of power system reserves may turn out to be insufficient. Due to the increase in DER generation, conventional generation consequently decreases and its possible reserves become limited. Thus, as installed power of DER grow, the probability of using SCO increases. An increase of DER power may also entail an increase in nonused energy – an increase in production or the speed of growth will not allow it to be used or stored for future use. At this point, the shape of the distribution function (symmetric with respect to 0) proves that the power system has no problems with absorbing this energy (assuming that the magnitude of the coal based generation change). Assuming that probability of wind change is similar in both directions (figure 7b)- we do not observe a cut in the upper part distribution associated with possible limitations of the power absorption by system, but so far as seen in the figure 7b the expected biggest change in generation has not exceeded 1.4 GW (20% installed windmill power) in absolute numbers.
The probability of using SCO (frequency load limiter) is also a function of the amount of windmills power installed, electricity production technologies used, existing power system reserves and the time horizon in which we are able to predict a certain event and time length of this event what depends on the weather prediction.
Fig.8. The relationship between the current power of the windmill and its change (X axis power in a given hour and Y axis change in a given hour) during whole year
There are many studies analyzing the production from DER in various timescales and geographical wind statistics [15 – 20]. They are usually assessing the production variability [21] and the possibility of its prediction [22-28], however there are no studies on the impact of DER generation instability on work EPS as a whole with a significant share of these sources (in the EU up to 40% of energy is generated from DER). Therefore, an attempt was made to assess the possible “stress” generated by windmills in the Polish SEE without cross-border cooperation.
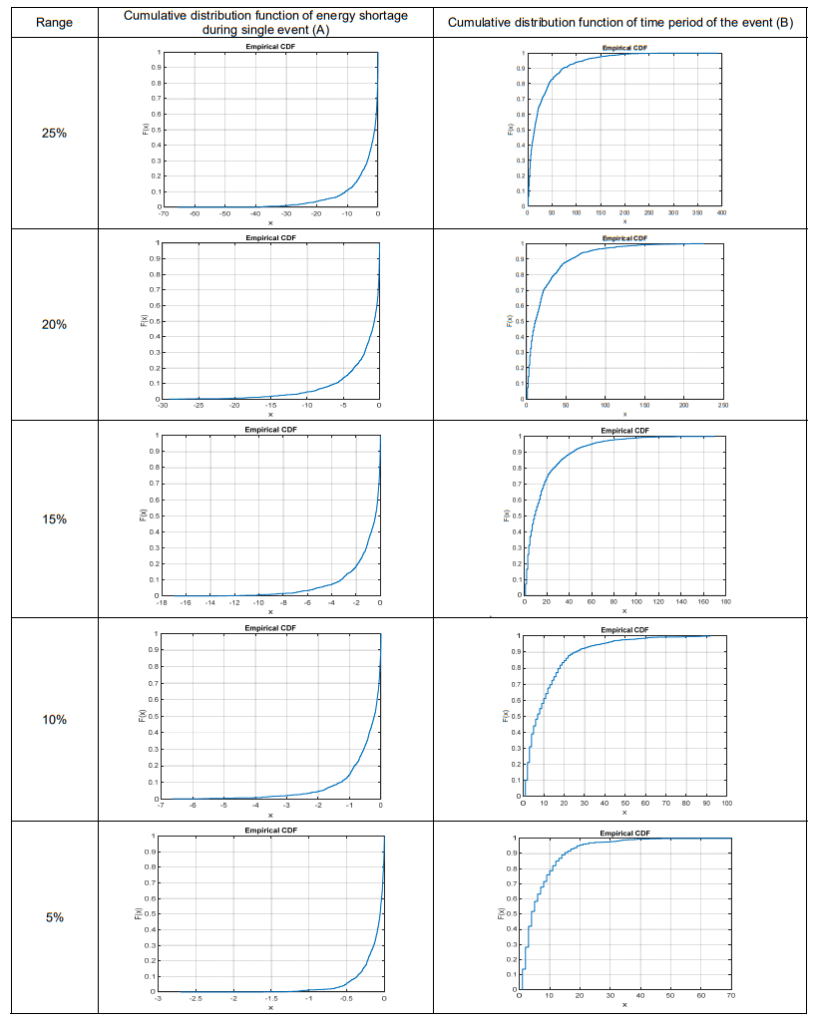
Table 1. Energy shortage caused by changes in windmills production
.
In order to capture the parameters of the “stress” and possibility of power system response to it (voltage unbalance, frequency changes, power shortage, change in power distribution, required reserves energy and total power in system) and related to cooperation with windmills, several analyzes were performed for arbitrarily selected levels of windmills utilization – 5%, 10%, 15%, 20% and 50%. Even for level of utilization lower than 5% the cases of shortage of production longer than 24 hours are quite common. Thus, the disregard of daily variability and choosing average daily demand do not introduce large errors during analysis.
The table (1) below indicates the values of changes of energy as production of windmills deceases for a certain level of windmills productions, certain time lengths of events, median time of the event, relative mean energy of the scarcity, median of the relative energy scarcity and maximum relative energy shortage.
Discussion of analysis of the results
The above-mentioned distribution factors (Table 2) together with the knowledge of the dependence of the power system on wind energy allow to easily estimate what event we are prepared to (and probability with which this event can occur) . Analyses shown in Table 2 show also what is the level of energy reserves that should be concerned in order to prepare for a certain event with probability X. Such analyzes will undoubtedly be needed in the future for connection with the EU-promoted policy of increasing DER share (at this point the addiction is 0, ie in SEE SCO automation is not used, even when the generation from wind is 0).
We propose, in principle, 2 coefficients which describe the dependence of power system on wind generation. Both are connected to the coefficients of windmills utilization. First one tells – what percentage of windmill power has to be produced so SCO is not used in power system (without the use of stored energy) and the second one describe situation where power system works only to supply the most important loads (hospitals, traffic lights, telecommunication and industry which requires continuous supply)
It is also worth recalling the catastrophic events in Texas at the beginning of 2021 [29-32] related to the underestimation of the duration of extreme weather events and the emergence of a new factor that could lead to a blackout.
It should also be noted that regardless of our ability to predict the weather (energy production from windmills), reserves for the time when the energy generation by windmills has to be limited, must always be available , in one form or another. As DER penetration in the system increases, the scope of system balancing by thermal power plants will decrease. Thus, the investments in high dynamic power plants or energy storage are needed.
The shape formed in figure 8 is extremely important for future analyzes, especially in the area of the lower right corner – the highest energy production by windmills (i.e. the smallest cushion in thermal power plants and the greatest variability in others) in the case of unexpected weather event either it needs to be covered by high dynamic energy sources or SCO should be utilized.
Conclusion
The analysis done using figures 5 and 6 shows that onshore wind energy production in Poland is characterized by low level of basic production (median much lower than medium values) what indicates that we have frequent episodes of very low and high production. The shape in figure 6 shows this instability of the windmills energy generation. Even considering yearly periods we can observe high levels of variability of windmills energy production. This requires further analysis, especially when further windmills will be located also onshore and offshore in the Baltic sea.
Table 2. Cumulative distribution functions of energy shortage and time period of the event. Range – arbitral level of windmill usage below with power system experiences energy shortage, axes at (A) column – X axle: energy shortage [h x installed windmill power], Y axle: probability of events for which the lack of energy was greater than the value determined on the X axis; axes at (B) column – X axle: time period of event in hours, Y axle: probability that the time length of a certain event is shorter than x value.
.
Thus, the new data sets dependent on DER penetration in the power system will be different what force new approach to their analyses:
• The necessary level of basic energy production or reserve to keep system stability during the windmill production variability (with a certain probability)
• For a given basic production (fully controllable power stations) what production of windmills is necessary to keep a certain state of work of power supply system
• What is the probability of the event for which the operator want to prepare to be able to neutralize its influence on power system stability
• What amount of energy is necessary during the generation shortage by windmills (which happens with a certain probability) and what data are required to calculate reserves of stored energy or fuel necessary to cover energy needs if shortage event happens. All these calculations should be performed for the situation when will be no possibility of the restoration of energy reserves and fuel (second event just after first one)
Nowadays, not only the influence of DER sources production on energy price is visible but as the DER sources penetration in power system will grow, the limitation of energy availability from these types of sources become visible This can cause SCO (disconnection of a certain users) usage during severe energy shortages.
Takin under consideration analysis performed for Poland area we suggest to do similar analysis foe larger and varied terrain covering different areas in EU (UCPTE area). It is very unusual that there is no any attempts to cover all EU terrain (including off-shore locations) by analysis similar to performed in this paper especially in the case when penetration of DER sources is forced by EU officials.
In the available literature, one can also observe a strange indifference of the electrician community towards the problems of power system stability and unpredictability of RES generation. This problem was referred to in the works[33-39] and the amount of reserves needed for efficient balancing of the power system [40-42] in the articles published at that time in Przegląd Elektrotechniczny. The problems raised in the article may have an impact on the functioning of the economy and society – so far we have functioned in conditions of widespread availability of electricity and the only possible problem was its price. As the penetration of DER in the power system increases and with the expected development of energy storage technologies, a reduction in the reliability of supplies should be taken into account.
The motivation for the creation of this work was to check how large energy storage facilities should exist in Poland when switching to renewable energy.
REFERENCES
[1] Joos M., Staffell I., Short-term integration costs of variable renewable energy: Wind curtailment and balancing in Britain and Germany, Renew Sustain Energy Rev, 86 (2018), pp. 45- 65, 10.1016/j.rser.2018.01.009 [2] Warren Katzenstein, Jay Apt,” The cost of wind power variability,Energy” Policy,Volume 51,2012,Pages 233-243, ISSN0301-4215,https://doi.org/10.1016/j.enpol.2012.07.032. (https://www.sciencedirect.com/science/article/pii/S0301421512006246) [3] Eser, Patrick & Chokani, Ndaona & Abhari, Reza. (2017). “Optimal RES portfolio to achieve 45% renewable electricity in central Europe by 2030”. 1-5. 10.1109/PESGM.2017.8273819. [4] IMGW https://www.imgw.pl/ (on-line 18.10.2022 [5] S.C. Pryor, R.J. Barthelmie,”Climate change impacts on wind energy: A review,”Renewable and Sustainable Energy Reviews, Volume 14, Issue 1,2010, Pages 430-437, ISSN 1364-0321, https://doi.org/10.1016/j.rser.2009.07.028. (https://www.sciencedirect.com/science/article/pii/S1364032109001713) [6] https://www.renewables.ninja/ (on-line18.10.2022) [7]IEA European Union 2020: Energy Policy Review: Tech. Rep. IEA (2020) URL https://www.iea.org/reports/european-union2020 [8] Dyrektywa Parlamentu Europejskiego I Rady (UE) 2018/2001 zdnia 11 grudnia 2018 r. w sprawie promowania stosowania energii ze źródeł odnawialnych [9] PSE-operator https://www.pse.pl/home (on-line 19.10.2022] [10] Entso https://www.entsoe.eu/ (on-line 19.10.2022] [11] California ISO https://www.caiso.com/Pages/default.aspx (online 19.10.2022] [12] instrat.energy https://energy.instrat.pl/ (18.10.2018) [13] Agencja Rynku Energii (ARE) Comiesięczne publikacje “Informacja Statystyczna o Energii Elektrycznej” na podstawie badania statystycznego zleconego przez Ministra Aktywów Państwowych (wcześniej Ministra Energii) – 1.44.02. Elektroenergetyka i ciepłownictwo – opracowanego wspólnie z Prezesem Urzędu Regulacji Energetyki. [14] Murcia Leon J., Koivisto M., Sørensen P., Magnant P. Power fluctuations in high installation density offshore wind fleets Wind Energy Science Discussions, 2020 (2020), pp. 1-23, 10.5194/wes-2020-95 [15] Cannon D.J., Brayshaw D.J., Methven J., Coker P.J., Lenaghan D.; Using reanalysis data to quantify extreme wind power generation statistics: A 33 year case study in great Britain, Renew Energy, 75 (2015), pp. 767-778, 10.1016/j.renene.2014.10.024 [16] Frank C.W., Pospichal B., Wahl S., Keller J.D., Hense A., Crewell S. The added value of high resolution regional reanalyses for wind power applications Renew Energy, 148 (2020), pp. 1094-1109, 10.1016/j.renene.2019.09.138 [17] Monforti F., Gonzalez-Aparicio I., Comparing the impact of uncertainties on technical and meteorological parameters in wind power time series modelling in the European union, Appl Energy, 206 (2017), pp. 439-450, 10.1016/j.apenergy.2017.08.217 [18 ] Nuño E., Maule P., Hahmann A., Cutululis N., Sørensen P., Karagali I., Simulation of transcontinental wind and solar PV generation time series, Renew Energy, 118 (2018), pp. 425-436, 10.1016/j.renene.2017.11.039 [19]Hilal Arslan, Hakki Baltaci, Bulent Oktay Akkoyunlu, Salih Karanfil, Mete Tayanc,’Wind speed variability and wind power potential over Turkey: Case studies for Çanakkale and İstanbul”,Renewable Energy,Volume 145,2020, Pages 1020-1032, ISSN 0960-1481, https://doi.org/10.1016/j.renene.2019.06.128.https://www.sciencedirect.com/science/article/pii/S0960148119309620) [20] Frank, Christopher & Fiedler, Stephanie & Crewell, Susanne, 2021. “Balancing potential of natural variability and extremes in photovoltaic and wind energy production for European countries,” Renewable Energy, Elsevier, vol. 163(C), pages 674-684. [21] Koivisto M, Plakas K, Ellmann ERH, Davis N, Sørensen P. “Application of microscale wind and detailed wind power plant data in large-scale wind generation simulations. Electr Power Syst Res190; 106638. http://dx.doi.org/10.1016/j.epsr.2020.106638. [22] Staffell I., Pfenninger S.”Using bias-corrected reanalysis to simulate current and future wind power output” Energy, 114 (2016), pp. 1224-1239, 10.1016/j.energy.2016.08.068 [23] Gonzalez-Aparicio I., Monforti F., Volker P., Zucker A., Careri F., Huld T., Badger J’.Simulating European wind power generation applying statistical downscaling to reanalysis data’ Appl Energy, 199 (2017), pp. 155-168, 10.1016/j.apenergy.2017.04.066 [24] Olauson J.,ERA5: The new champion of wind power modelling?, Renew Energy, 206 (2018), pp. 322-331, 10.1016/j.renene.2018.03.056 [25] Jourdier B., Evaluation of ERA5, MERRA-2, COSMO-REA6, NEWA and AROME to simulate wind power production over France, Adv Sci Res, 17 (2020), pp. 63-77, 10.5194/asr-17-63-2020 [26] Pickering B., Grams C.M., Pfenninger S. Sub-national variability of wind power generation in complex terrain and its correlation with large-scale meteorology, Environ Res Lett, 15 (4) (2020), Article 044025, 10.1088/1748-9326/ab70bd [27] Koivisto M., Jónsdóttir G.M., Sørensen P., Plakas K., Cutululis N.,Combination of meteorological reanalysis data and stochastic simulation for modelling wind generation variability, Renew Energy, 159 (2020), pp. 991-999, 10.1016/j.renene.2020.06.033 [28] Susanne Drechsel1, Georg J. Mayr1, Jakob W. Messner1, and Reto Stauffer1,Wind Speeds at Heights Crucial for Wind Energy: Measurements and Verification of Forecasts, Journal of Applied Meteorology and Climatology Print Publication: 01 Sep 2012 DOI: https://doi.org/10.1175/JAMC-D-11-0247.1 Page(s): 1602–1617 [29]A. Menati and L. Xie, “A Preliminary Study on the Role of Energy Storage and Load Rationing in Mitigating the Impact of the 2021 Texas Power Outage,” 2021 North American Power Symposium (NAPS), 2021, pp. 1-5, doi: 10.1109/NAPS52732.2021.9654452. [30]N. Shang and X. Zhang, “Analysis of Extreme Cold Weather Event in Texas of February 2021 and Suggestions for China,” The 10th Renewable Power Generation Conference (RPG 2021), 2021, pp. 252-257, doi: 10.1049/icp.2021.2213. [31]G. Zhang, H. Zhong, Z. Tan, T. Cheng, Q. Xia and C. Kang, “Texas electric power crisis of 2021 warns of a new blackout mechanism,” in CSEE Journal of Power and Energy Systems, vol. 8, no. 1, pp. 1-9, Jan. 2022, doi:10.17775/CSEEJPES.2021.07720. [32]S. Ghosh, A. Bohra and S. Dutta, “The Texas Freeze of February 2021: Event and Winterization Analysis Using Cost and Pricing Data,” 2021 IEEE Electrical Power and Energy Conference (EPEC), 2021, pp. 7-13, doi:10.1109/EPEC52095.2021.9621500 [33]Amar Bensaber, A., Benghanem, M., Guerouad, A., & Amar Bensaber, M. (2019). Power flow control and management of a Hybrid Power System. Przegląd Elektrotechniczny, 95. [34]Raczkowski, R., & Robak, S. (2021). System magazynowania energii elektrycznej jako środek poprawy elastyczności systemu elektroenergetycznego z dużym udziałem generacji OZE. Przegląd Elektrotechniczny, 97, 1-8. [35]Halinka, A., Rzepka, P., Szewczyk, M., & Szablicki, M. (2011). Przyłączanie farm wiatrowych-potrzeba nowego podejścia do sposobu funkcjonowania automatyki elektroenergetycznej sieci WN. Przegląd Elektrotechniczny, 87(9a), 218-221 [36]Gała, M. (2017). Praca turbin wiatrowych w systemie elektroenergetycznym oraz ich wpływ na jakość energii elektrycznej. Przegląd Elektrotechniczny, 93 [37]Jiang, Z., & Xie, K. (2012). Identification and effect analysis of the weak parts of large-scale wind energy conversion system using the reliability tracing technique. Przeglad Elektrotechniczny, 88(8), 192-196 [38]Suproniuk, M., Skibko, Z., & Stachno, A. (2019). Diagnostyka wybranych parametrów energii elektrycznej produkowanej w elektrowniach wiatrowych. Przegląd elektrotechniczny, 95(11) [39] Piekarz, M. The analysis of the wind generation impact on the power system stability PRZEGLĄD ELEKTROTECHNICZNY, ISSN 0033-2097, R. 97 NR 11/2021 doi:10.15199/48.2021.11.27 [40]Kazanowski Robert, Dariusz Sztafrowski, ” System elektroenergetyczny oparty o odnawialne źródła energii – możliwości i bariery rozwoju,” Przegląd Elektrotechniczny, 02/2023 pp. 186 [41]DOWEJKO, J., JAWORSKI, J., Banaszak, S., Zeńczak, M., Małyszko, O. (2022). Wybór miejsca zainstalowania wodorowego bufora energetycznego w systemie elektroenergetycznym. Przegląd Elektrotechniczny. doi:10.15199/48.2022.10.51 [42]Kudria, S., Lezhniuk, P., Riepkin, O., & Rubanenko, O. Hydrogen technologies as a method of compensation for inequality of power generation by renewable energy sources. Przegląd Elektrotechniczny, ISSN, 0033-2097
Authors: dr. inż. Tomasz Sieńko, Politechnika Krakowska, Katedra Inżynierii Elektrycznej, ul. Warszawska 24, 31-155 Kraków, E-mail: tomasz.sienko@pk.edu.pl; dr hab. inż. Jerzy Szczepanik, Politechnika Krakowska, Katedra Inżynierii Elektrycznej, ul. Warszawska 24, 31-155 Kraków, E-mail: jerzy.szczepanik@pk.edu.pl.
Source & Publisher Item Identifier: PRZEGLĄD ELEKTROTECHNICZNY, ISSN 0033-2097, R. 99 NR 9/2023. doi:10.15199/48.2023.09.08
Published by Dranetz Technologies, Inc., Case Study
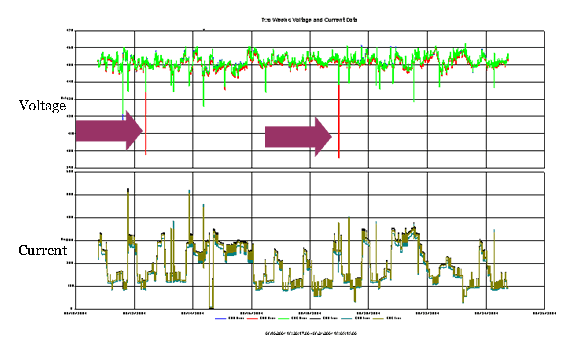
A busy trading floor was experiencing difficulties with their six air handling units, which were fed from a single 480V, 400-amp service. The units were malfunctioning, stalling and at times were unable to start, causing the temperature in the control room to rise to unacceptable levels. A Dranetz Power Platform PP4300 was installed for a two-week period to evaluate the voltage and current of the 400-amp service feeding the handlers.
.
Based on the collected data, we learned the following:
The top graph shows the voltage, which averages about 450V as opposed to the 480V expected. This resulted in a continual undervoltage situation, putting the system at a higher susceptibility for sags.
Three large sags, greater than 10% of nominal occurred (see purple arrows), and numerous sags at around 5% of nominal.
The lower graph shows the current, expected to be 400 amps. As you can see, on numerous occasions it rose above 400 A, and in several cases rose to 500 A.
The current rise can be correlated to voltage sags.
.
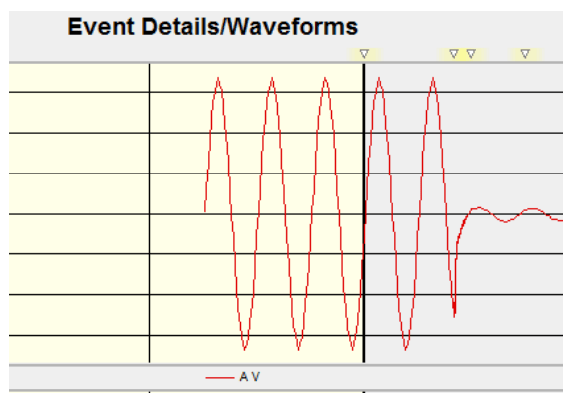
In the above, we see that the voltage (in red) and the current (in blue) are both decreasing, indicating that the source of the sag can be found upstream of the monitoring point (PQ Rule #1). As a result of this survey, two of the air handlers were moved to a different service, eliminating an overloaded circuit condition and a source for voltage sags.
Published by Dranetz Technologies, Inc., Application Note
INTRODUCTION
Most of the world distributes power at 50Hz or 60Hz. However, there are certain specialized applications that distribute power at other frequencies. Applications such as aviation, naval, and others distribute power at 400Hz to improve system efficiencies. 400Hz applications can be a challenge for the end user since most products only measure at 50 and 60Hz. Many users think that all AC applications are the same and do not consider the fundamental frequency of the power system, assuming their instrument can handle this application, but few actually can. A misapplication of a 50/60Hz instrument in a 400Hz application will most likely result in inaccurate measurements, inconsistent instrument behavior, and loss of time and money as a result of surveys that do not collect useful data. 400Hz measurements require some enhancements to hardware and instrument firmware to accommodate the 400Hz fundamental frequency, and its associated measurement and synchronization requirements.
INSTRUMENTATION
Dranetz is one of the few Power Quality instrumentation manufacturers that offers products for 400Hz applications. The Dranetz HDPQ Xplorer 400, and its predecessor, the PowerXplorer PX5 400 fully function at 400Hz, as well as the traditional 50Hz and 60Hz ranges.
.
The 400Hz versions of these advanced power quality, demand, and energy instruments offer the same powerful feature set as the traditional versions, but add 400Hz capabilities. They can meet virtually every application by accurately measuring traditional 50/60Hz, 400Hz circuits and DC systems. All of the Dranetz HDPQ Xplorer and PowerXplorer PX5 capabilities are available in their respective 400Hz versions, including high speed transient measurements.
AVIATION APPLICATION
400Hz power systems have the same concerns as traditional 50/60Hz systems, yet many users don’t know that an advanced tool is available to help them. Power quality, demand, and energy are important in any application, regardless of the power frequency. With the Dranetz 400Hz capable products, users can apply industry leading Dranetz monitoring technology to these more specialized applications. As an example, aviation power distribution reliability can involve three main components: the aircraft, jetway, and ground equipment/power. Any link in this chain that doesn’t perform to expectations can cause failures that may result in delays, lost productivity, and lost revenues. Therefore, it is important to have the tools available to quickly resolve any problems to reduce the economic impact of interruptions in service. The Dranetz HDPQ Xplorer 400 is an indispensable tool for not only troubleshooting problems, but when applied proactively, problems can be avoided altogether by understanding the dynamics of the power distribution system.
.
As an example, the figure below shows a voltage sag displayed in our Dran-View 7 software that was recorded measuring the 400Hz aircraft supply from a jetway at a major east coast airport.
.
Aviation power distribution can also go beyond 400Hz as aircraft power systems can distribute power at 50/60Hz, 28VDC, and other levels. Whether the application is troubleshooting onboard the aircraft or ground based equipment, it’s important to have the ability to measure the entire electrical environment without compromises. The Dranetz HDPQ Xplorer 400 has such capabilities, all in one easy-to-use instrument.
GATE POWER DEMAND AND ENERGY APPLICATION
An interesting new application is aircraft support energy surveys. In many cases, airport gates are rented or leased to airlines. The cost of the energy consumed by an airplane while parked at the gate is intended to be included in the fees charged to the airlines. However, in many cases, owners estimate energy usage and do not measure actual aircraft consumption for the purposes of adjusting fees accordingly. A Boeing 777 consumes more electricity than a regional jet, and owners need to make sure contracts and pricing are based upon actual usage and not estimates. The Dranetz HDPQ Xplorer 400 demand and energy monitoring capabilities can be used by airport authorities, ground maintenance teams, and airlines to easily conduct power consumption surveys to measure actual usage, making the information readily available to adjust billing/contracts accordingly. Such surveys can range from short term spot checks to longer duration monitoring surveys.
BAGGAGE CONVEYOR ENERGY EFFICIENCY APPLICATION
A major US airline planned to retrofit a portion of their baggage handling system at their Texas hub to include energy efficient 60Hz drives. The airline wanted to prove the effectiveness of this upgrade and to verify that the actual energy savings met those advertised by the supplier. They wanted a power monitoring tool to measure energy consumption before and after the upgrade that could also be their ‘go to’ tool for many other applications, including 400Hz aircraft power applications, facility and terminal power quality, demand, and energy monitoring applications.
The airline chose Dranetz, with the first application being to benchmark the energy consumption before the retrofit of the baggage handling system. After the retrofit, they did a comparable survey that positively verified that energy savings were as expected and met the supplier’s claims.
CONCLUSION
Aviation power systems have the same power quality, demand, and energy concerns as traditional 50/60Hz systems. However, due to the various power distribution methods (400Hz, 50/60Hz, DC), specialized instrumentation is required to accurately measure in this environment. The Dranetz HDPQ Xplorer 400 was specifically designed for such applications, yet retains traditional 50/60Hz capabilities, making it an indispensable tool for use in any power system in any airport or aircraft environment.
Dranetz HDPQ Xplorer 400 Aviation Applications
• Power quality troubleshooting • Real-time 50/60 or 400 Hz monitoring • Power system performance testing • Preventive or just-in-time maintenance • Testing of AC/DC systems • Power consumption, billing and allocation • Compliance with Mil std 1399 testing
Published by Dranetz Technologies, Inc., Case Study
Willows Swim Club is a private, member-owned swimming and recreational facility located in central New Jersey. The swim club provides kitchen space to a local restaurant to operate a food concession. Being offered as a service to its membership, there is presently no charge for rent or utilities. However, given the current economic climate the swim club is considering charging the concession operator next season to be reimbursed for the utility costs incurred operating the concession area. The primary objective of this energy audit was to measure the electrical demand and energy consumption of the concession area to determine demand and usage during an average summer peak operating period, representing worst case Demand and Energy usage. This information will be used to determine reasonable utility charges when negotiating the contract for next season.
.
The swim club is seasonal business operating during the summer months from Memorial Day to Labor Day each year. The concession operates 7 days a week from about 11am to 7pm each day. Certain days have extended hours due to demand and other factors but days can also be shortened due to inclement weather. Swimming pools are outdoors so the facility may close or limit operating hours due to rain or cool temperatures. The concession area electrical loads are primarily comprised of cyclical loads such as refrigerators, freezers and room air conditioners but constant loads such as overhead lighting exist.
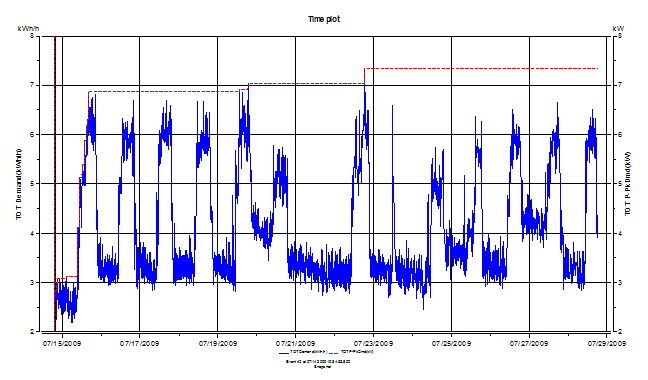
A two week energy survey using the Dranetz Energy Platform EP1 was conducted from July 14, 2009 to July 28, 2009. The EP1 was connected to the dedicated 120V split phase sub panel feeding the concession area. Two model TR2550, 100A CT’s were used for current measurements.
Below is the demand profile recording during the survey with the Peak Demand overlaid. Data is show in DranView 6 software:
.
Survey results indicated the following:
Peak demand measured during the period was 7.353 KW.
Total electricity consumed was 1375.6 KWh
The survey ran for 13.95 days with an average consumption of about 98.5 KWh per day
General observations
The demand was cyclical and peaked during mid day hours as expected.
More consistent demand profile was observed during the first week of the survey vs. the second week.
Local weather data during the monitoring period was obtained from the Internet and compared to the demand profile. The comparison indicated rain and poor weather conditions corresponded with the reduction and inconstancy of the demand measured during the second week of the survey. Since such weather is consistent with a normal summer in the area this demand data should be included in the overall 2 weeks results being considered normal.
Electricity Cost Estimation
The local utility is Public Service Electric & Gas (PSE&G) Company. New Jersey, being a deregulated state provides consumers the option to purchase electricity supply from an independent provider other than the delivery company. The facility owner chose PSE&G as the electricity supplier so both Delivery and Supply charges come from the one utility. Even though the swim club is a comparatively small consumer of electricity the utility bill is more complex than a residential bill. The utility rate structure applied is PSE&G’s GLP, General Lighting & Power rate. Also being the electricity supplier, PSE&G charges their BGS, Basic Generation Service rate structure for supply charges. The resultant utility bill demonstrates the complexity of billing in a deregulated energy environment and also the importance of understanding your electrical usage in order to manage and reduce your utility costs:
Delivery:
Service charge: $4.27
Distribution charges
Annual Demand @ $3.9202/KW
Summer Demand @ $7.2755/KW
KWh charges @ $0.0145/KWh
Societal Benefits (recovery of costs incurred achieving government policy) @ $0.0075/KWh
This is a complex calculation that represents the customers share of the overall peak load assigned to the utilities transmission zone.
BGS Energy (tiered usage per KWh)@ $0.1089/KWh (first tier <9755 KWh)
Being such a complex rate structure with many billing factors, it can be difficult to relate some of these costs to actual usage by the concession. Since the objective is to estimate worst utility costs, a fair method was found with the following assumptions taken into account:
The operation of the swim club during the 2 week survey was deemed typical and representative an average two week period during peak summer months.
Actual usage results will be used in the estimated charges opposed to determining a percentage of the concession usage vs. the overall bill.
Service charge will be 100% paid by the owner.
BGS capacity charge will be ignored since there is no fair way to determine the concessions portion of these charges. The owner will bear this charge.
The various KW Demand and KWh Energy utility charges can be consolidated into one charge for KW and KWh portions of the estimate:
Consolidated KW Demand charge is: $11.1957
Consolidated KWh Energy charge is: $0.1413
Demand and Energy Summary Report
Site: Willows Concession final Measured from 07/14/2009 11:12:09.0 to 07/29/2009 02:37:01.0 BILLING DAY OF MONTH: 1
.
Time of Use Billing
Site: Willows Concession final
Measured from 07/14/2009 11:12:09.0 to 07/29/2009 02:37:01.0 BILLING DAY OF MONTH: 1
Published by Dranetz Technologies, Inc., Case Study
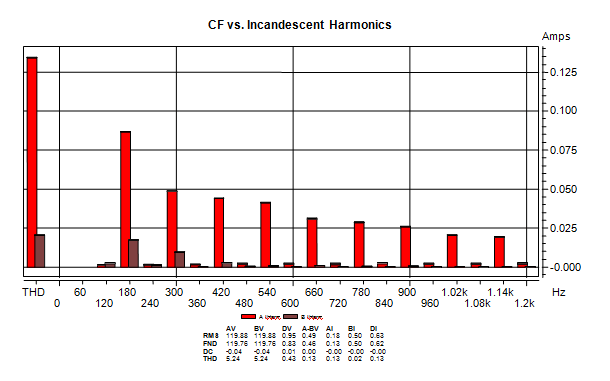
With the proliferation of Compact Florescent (CF) lighting, we thought it would be interesting to do a side by side comparison to an incandescent bulb using our new Energy Platform EP1. Not only is it a great demonstration of the capabilities of the EP1 but it’s also an opportunity to explore the energy savings advantages while also looking at the potential effects on power quality.
Energy Star (www.energystar.gov) promotes the energy savings of CF lighting verses traditional incandescent bulbs. The industry claims a 75% reduction in energy usage of CF bulbs vs. incandescent. Is this true? To find out we used an EP1 to conduct a simple test to validate this claim. We randomly selected a 60W incandescent bulb and the equivalent (light output) 13W compact florescent. The CF bulb was connected to Channel A of the instrument while the incandescent was connected to channel B. Current was measured using two of our TR2501, 1A CT’s.
.
As you can see from the EP1 screen capture above, the CF bulb does indeed consume 75% less energy than the equivalent incandescent. What about the power quality effects? Let’s look at the waveshapes…
.
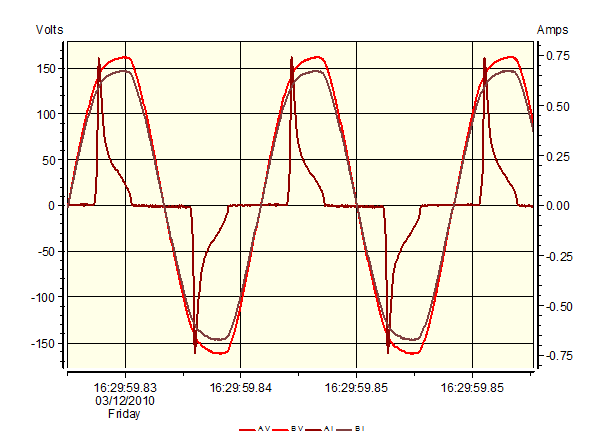
From the DranView screen shot above you can see that unlike the linear resistive load of the incandescent bulb, the electronic ballast in the CF is a non linear load. Like a computer power supply, it’s rich in harmonics. There are other PQ concerns such as start up currents but we’ll focus on the harmonics since it seems to be getting the most concern.
The CF current looks quite bad with a very high current THD of about 107%. However, when taking a closer look the actual current levels are quite small. The predominant harmonic is the 3rd at about 80ma.
.
Will these low level harmonics cause any problems? If you Google something like “compact fluorescent thd” you’ll find numerous results on this topic. CF manufacturers claim no significant impact from such harmonics. Utilities are keeping a close eye on this issue as the proliferation of compact fluorescents continues to see if THD levels increase on their systems. One thing is clear; it will be the cumulative effects of a large number of such bulbs that would ultimately cause an issue. Even though 100+% current THD sounds bad, at such low current levels one bulb rich in harmonics clearly isn’t a problem. What happens when each house has 10, 20 or more of such bulbs operating simultaneously? That remains to be seen, hence the utilities concerns. However, as consumers, saving 75% in energy costs is the overriding factor!
Published by Dranetz Technologies, Inc., Case Study
The customer was experiencing repeated failures electronic controls and instruments in a new glass factory. The factory had been imported from a 60hz country to a 50hz country. In this case, the new factory capacity was reduced by 50% or more do the frequent shut downs and stoppages. The cost of repair of the electronics was a small part of the total cost of each failure. “You don’t just turn a glass factory off and on”. The customer had attempted identify the source of the problem with voltmeters and simple power monitors. They were not able to capture the damaging voltage variation. The graph from the meter showed no significant voltage variation. See Graph 1 for example of line to line and line to neutral RMS values show no high voltage variations.
Graph 1 – Example of line to line and line to neutral RMS values
We installed a Dranetz PG4400 Power Quality Monitor at the 400 volt buss level. The results are shown in graph 2. Notice the peak voltage graph clearly shows multiple high voltage transients recorded by the unique voltage peak recording capability of the PG4400. Graph 3 shows the detail of the voltage transient. In order to find the source of the transient, we installed additional Dranetz PX-5 and PG4400 monitors at the source voltage of 10Kv.
Graph 2 – Peak voltage, and multiple high voltage transients
Graph 3 – Detail of the voltage transient
Based on this evidence we determined the voltage transient had multiple sources. One source was from the 10KV voltage level as shown by these graphs. The second source was investigated in a separate project.
Published by Dranetz Technologies, Inc., Application Note
EXECUTIVE SUMMARY
As solar photovoltaic (PV) systems become more prevalent in commercial and industrial environments, the emphasis on financial return and concise performance expectations has rightly intensified. However, one often-overlooked aspect of solar deployment is the comprehensive evaluation of power quality (PQ)—both before and after installation. By identifying existing grid or facility issues and evaluating the impact of PV systems on power quality, stakeholders can protect infrastructure, enhance performance, and uphold warranty and compliance standards. This white paper explores the strategic benefits of PQ assessments in solar installations, drawing insight from field operations and test data, such as those captured during site evaluation in Xalapa, MX.
UNDERSTANDING POWER QUALITY IN THE CONTEXT OF SOLAR
Power quality refers to the stability and purity of the electrical power supplied to a facility or distributed across a grid. It encompasses factors such as voltage regulation, harmonics, flicker, and transients. These all can degrade equipment performance or signal systemic issues.
.
IEEE 1547, a widely adopted standard for interconnecting Distributed Energy Resources (DERs) with electric power systems, must be taken into consideration, and all PV systems must comply with it. A recent amendment, IEEE 1547.1 – 2020 defines conformance testing and requires that IEC 61000-4-30 Class A compliant PQ meters are used for voltage and current distortion, and other evaluations.
PV systems, while beneficial, can interact with the grid in complex ways. Inverters and interconnection points may introduce harmonics or voltage fluctuations. Additionally, grid conditions that exist outside of expected parameters can prevent inverters from operating, negatively impacting PV system production and potentially damaging expensive componentry.
Without prior and post-installation PQ testing it can be difficult to identify the source of PQ problems as being caused by the PV system, previously existing on the grid, or an interaction between the two systems. Also, anomalies may go unnoticed, potentially leading to preventable and costly system inefficiencies or failures.
REAL-WORLD INSIGHT: LESSONS FROM THE XALAPA SITE
A recent evaluation was performed at a rooftop pergola mounted PV array in Xalapa, Mexico. The site can generate 16kW AC / 16.35kW DC with two single phase inverters of 10kW and 6kW.
The purpose of the evaluation was to conduct a ‘health check’ and demonstrate the benefits of a PQ study in a PV system. The field engineers utilized both PV and PQ instruments to evaluate the performance of the system and interaction with the grid. The instrumentation used was:
● Seaward PV210 IV-curve tracer, a tool specifically designed to verify that solar modules are performing at a consistent level ● Dranetz HDPQ Xplorer Plus, an IEC 61000-4-30 Class A, portable PQ instrument
OBSERVATIONS AND FINDINGS
PV Performance Issue Identified
IV-curve tracing is a method of testing solar modules and arrays to assess their performance and identify potential problems. It involves plotting the current (I) and voltage (V) relationship of the module. In this case, I-V curve trace data collected by the Seaward PV210 revealed an imperfect (defect) for one of the three solar strings tested. The root cause, which could be a problem like soiling, shading, or hardware failure, required further investigation to pin down. Without this test data, however, the defect may have gone unnoticed, potentially leading to long-term performance issues.
PQ Harmonics Issue Identified
Using the HDPQ meter, the site engineers were able to detect that harmonics on the inverter AC outputs were very high and well beyond the recommended limits of IEEE 519. As shown in Figure 1 below, Vthd was about 60% and there were significant even order harmonics which typically do not exist in most power systems. Harmonics can cause overheating in inductive devices such as transformers, resonances, high neutral currents, and overvoltage issues, and ultimately can cause system shutdown. Further investigations needed to be carried out to determine the source of the harmonics.
Figure 1. High harmonic content and significant even harmonics on the inverter AC output.
As shown in Figure 2, the DC input to the inverters has an approximately 11V oscillating at 120Hz. This is twice the 60Hz fundamental frequency and most likely due to the significant second order harmonics (120Hz) as described above.
Figure 2. Inverter AC output (top) and DC input (bottom). DC input oscillates at twice the grid frequency.
STAY OUT OF TROUBLE WITH THESE BEST PRACTICES
Conduct PQ testing pre- and post-installation. PQ testing before the PV system’s commissioning can provide a baseline to identify legacy issues, insulating the PV installer from preexisting issues. Post-commissioning tests can then isolate any PQ disruptions introduced by the PV installation itself.
This two-phase approach ensures grid readiness and verifies that PV integration has not degraded power quality. For the Xalapa site, it is difficult to determine if the harmonics problem existed before the PV system went online, or the PV system is the source.
Implement annual PQ and electrical health audits.
By testing power quality at least annually, project teams can assign responsibility for faults, validate performance, and ensure long-term reliability.
Correlate system performance with PQ metrics.
Make it part of your system maintenance process to conduct PQ tests and correlate PQ metrics to system performance. This helps you spot issues before they become problems and provides deeper insight into potential degradation and operational health.
Incorporate PQ results into acceptance and warranty protocols.
Doing so increases accountability across all stakeholders, from suppliers to installers, and site owners.
Spec in and install a fixed, permanent PQ meter.
While more expensive, a permanent PQ meter installation will provide far more data, on a consistent basis, into PQ events. Moreover, this may be the best option for problematic sites.
Compile warranty and compliance evidence
Creating a paper trail of electrical performance test data goes a long way to supporting warranty claims. In addition, it satisfies regulatory requirements.
THE BOTTOM LINE
As demonstrated in the Xalapa project, a structured approach to PQ testing that incorporates power quality evaluation into the lifecycle of solar installations can keep equipment up and running longer, and more importantly, keeps you out of trouble.
Published by 1. Justyna HERLENDER, 2. Jan IŻYKOWSKI, Wroclaw University of Science and Technology, Faculty of Electrical Engineering, Department of Electrical Power Engineering Professor emeritus. ORCID 1. 0000-0002-9469-4546; 2. 0000-0002-1048-551
Abstract. This paper presents the algorithm intended for localizing faults in a power transmission line for an inspection-repair purpose. Its innovative element is that a specific input signals of the algorithm have been considered. In particular, incremental positive-sequence voltages and currents taken from directional elements of protective relays installed at both line ends have been taken as the input signals of the localizing algorithm. More general case with regards to synchronism of the measurements is considered, i.e. the measurements acquired asynchronously at both line ends. The fault signals from ATP-EMTP simulations of faults on the sample transmission line were applied for validation of the presented algorithm and for evaluating the fault location accuracy.
Streszczenie. Artykuł przedstawia algorytm przeznaczony do lokalizowania zwarć w elektroenergetycznej linii przesyłowej, z zastosowaniem do celów inspekcyjno-remontowych. Jego elementem innowacyjnym jest to, że rozważono specyficzne sygnały wejściowe badanego algorytmu. W szczególności, przedstawiono zastosowanie przyrostowych sygnałów napięć i prądów dla składowej zgodnej z elementów kierunkowych w przekaźnikach zabezpieczeniowych, zainstalowanych na obu końcach linii, jako sygnałów wejściowych dla algorytmu lokalizującego. Bardziej ogólny przypadek dotyczący synchronizmu pomiarów został rozważony, tj. wzięto pod uwagę pomiary dokonywane na obu końcach linii w sposób niesynchroniczny. Do walidacji przedstawionego algorytmu oraz oceny dokładności lokalizowania zwarć zastosowano sygnały zwarciowe z symulacji zwarć w rozważanej linii przesyłowej, wykonane w programie ATP-EMTP (Lokalizowanie zwarć w elektroenergetycznej linii przesyłowej z użyciem sygnałów z elementów kierunkowych z dwóch końców linii).
Keywords: transmission line, protection, directional element, incremental quantities, fault localizing, fault simulation. Słowa kluczowe: linia przesyłowa, zabezpieczenie, element kierunkowy, wielkości przyrostowe, lokalizowanie zwarć, symulacja zwarć.
Introduction
Transmission lines play an important role in delivering electrical energy from the generation to consumption centres [1]. Operation of overhead power lines is affected by faults which are of random nature. Demand of a reliable supply for the customers with electrical energy and also power system stability concerns cause that identification of faults becomes of a vital importance. Faults have to be cleared by circuit breakers tripped by protective relays as quickly as possible. Therefore, an identification of faults on a transmission line by protective relays is performed with use of fast measuring and decision making algorithms, operating in on-line regime. Then, a cleared fault has to be located in off-line regime by a fault locator [2]-[6]. Its task is performed for an inspection-repair purpose, what imposes a demand of high accuracy of locating a fault, while its speed is not so critical. The result from a fault locator is utilized for sending a repair crew to remove the fault and thus allowing the line to be switched on again into operation.
Different fault locating methods are known and applied in practice for transmission lines. A main division of them [4] is:
• impedance based methods, • traveling waves methods, • reflectometry methods, • knowledge based methods, i.e. with use of artificial neural networks, fuzzy logic and the other techniques.
Mostly the first two kinds of the above listed methods are in practical use. Especially, the impedance based methods are widely used. They, yield a distance to fault result basing on determining the impedance of the faulted line section in a proportion to the whole line impedance. Such the methods are still considered as quite attractive since they can be embedded into protective relays [7]-[9], thus increasing a functionality of them. This paper is intended to contribute to that by dealing with locating transmission line faults using two-end measurements acquired from protective relays installed at both line ends. Specific input signals of the proposed fault localizing algorithm are taken for consideration. Namely, the incremental positive-sequence voltage and current [10]-[12], which are processed in the directional elements [10] from protective relays installed at both line terminals (Fig. 1) are the algorithm input signals.
The considerations of this paper are related to a faulted transmission network presented schematically in Figure 1. The faulted transmission line of the impedance ZL is between the local (L) and remote (R) buses. It is considered that a fault (F) is placed at a relative distance d [p.u.] (counted from the local bus L). Different kinds of shunt faults are taken into account. Vicinity of the considered transmission line L-R is represented by equivalent subsystems with electromotive voltages (EL, ER) and internal impedances (ZL, ZR). The transmission line is protected against spreading out the fault effects by protective relays installed at both line ends (RELL, RELR). Both relays communicate each other via a dedicated communication channel. In order to identify a fault, both relays are provided with three-phase voltages ({vL}, {vR}) and currents ({iL}, {iR}) from voltage (VTsL, VTsR) and current (CTsL, CTsR) instrument transformers in all three phases. Detailed contents of voltage and current measurement chains (such as analogue anti-aliasing lowpass filters, matching transformers, A-D converters) are not visualized in Figure 1.
Protective relays (RELL, RELR) in case of identifying a fault within a pre-defined zone send a trip signal (TRIPL, TRIPR) to operate their circuit-breakers (CBL, CBR), causing that a faulted line is disconnected from a power system. In such a case performing the calculations aimed at determining a distance to fault appears as the next step.
Directional element using incremental positive-sequence quantities
Protective relays (RELL, RELR – Figure 1) in order to perform adequately their role consist of several components and among them one can distinguish directional elements (DEL, DER). They discriminate faults in terms whether it is a forward or a backward fault with respect to a relaying point.
It is considered here that directional elements (DEL, DER) are based on a principle presented in [10], where direction of a fault is determined with processing incremental positive-sequence voltages and currents.
Fig.1. Single line model of faulted transmission network: L, R – local and remote buses of faulted line; EL, ZL – e.m.f. and impedance of equivalent source behind bus L; ER, ZR – e.m.f. and impedance of equivalent source behind bus R; RELL, RELR – protective relays at both line ends; COMMUNICATION – channel for exchanging information (signals) between relays; VTsL, VTsR – voltage transformers at both line ends; CTsL, CTsR – current transformers at both line ends; CBL, CBR – circuit-breakers at both line ends; F- fault on line at relative distance d [p.u.]; TRIPL, TRIPR – relays signals tripping circuit-breakers; DEL, DER – directional elements, FL – fault locator yielding a distance to fault d [p.u.] result
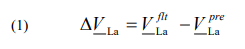
The relay RELL processes phasors: ΔVL1, ΔIL1, while the relay RELR: ΔVR1, ΔIR1 (note that Δ denotes here that a quantity is incremental and ‘1’ in the subscripts stands for positive-sequence). The incremental quantity is obtained here by subtracting the pre-fault quantity (superscript: pre) from the fault quantity (superscript: flt), as for example for a voltage samples from phase ‘a’ at the local end (L) is:
.
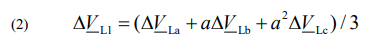
Analogously, the calculations are performed to obtain the incremental quantities for phases ‘b’ and ‘c’: ΔVLb, ΔVLc. Note that strings of both ‘flt’ and ‘pre’ fault quantities have to be of identical width and be away by integer number of the cycles. Then, the incremental positive-sequence voltage is calculated with use of the F.C. Fortescue theory [4]:Analogously, the calculations are performed to obtain the incremental quantities for phases ‘b’ and ‘c’: ΔVLb, ΔVLc. Note that strings of both ‘flt’ and ‘pre’ fault quantities have to be of identical width and be away by integer number of the cycles.
Then, the incremental positive-sequence voltage is calculated with use of the F.C. Fortescue theory [4]:
.
where: a=exp(j2π/3) is the complex number operator shifting by an angle: 2π/3.
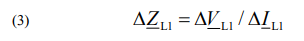
Analogously, the calculations are performed to obtain the incremental positive-sequence current ΔIL1 and finally the criterion quantity for discriminating a fault direction by the relay at the L terminal is of the form [10]:
.
According to [10] a fault is identified as a forward one (with respect to the relay RELL) if the criterion impedance (3) is located in a 3rd quadrant of the complex plane. Adversely, in case of having this impedance located in a 1st quadrant then a fault is backward.
It is further assumed that the incremental positive-sequence voltage and current calculated for direction discrimination at the terminal L: ΔVL1, ΔIL1 and at the terminal R: ΔVR1, ΔIR1 are memorized in the relays and thus can be used for formulating a fault locating algorithm, as presented in the next section.
Fault localizing algorithm – formulation of the algorithm
Figure 2 presents a simple lumped model of a faulted power line for an incremental positive-sequence. It is assumed that phasors of voltages and currents at both local (L) and remote (R) line ends for incremental positive-sequence are calculated from the phase quantities measured asynchronously. Assuming the measurements at the remote terminal (R) as the base, then in order to provide a common time base of all measurements, the phasors at the local end (L) are multiplied by the introduced synchronization operator: exp(jδ), where δ is an unknown synchronization angle.
Fig.2. Model of faulted transmission line for incremental positive-sequence
The model of Figure 2 can be described as follows:
.
where except the processed signals there are: Z1L – impedance of the whole line for the positive sequence, d – distance from the bus S to fault point F [p.u.],
By subtracting (4) and (5) one obtains the formula in which the unknown quantity ΔVF1 is eliminated and the synchronization operator equals:
.
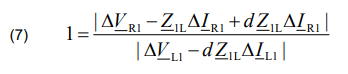
Calculation of absolute values for both the sides of (6) gives elimination of the unknown synchronization angle:
.
The nominator and the denominator of the right-hand term of (7) requires formulating their real and imaginary parts and then calculating their absolute values. After tedious calculations one gets a quadratic algebraic equation for the unknown fault distance (d) in the form:
.
where: A2, A1, A0 – real numbers involving real & imaginary parts of the positive-sequence line impedance (Z1L), real & imaginary parts of the measured phasors at the local side (ΔVL1, ΔIL1) and also from the remote side (ΔVR1, ΔIR1).
Solving the quadrating equation (8) results in obtaining two results for a sought fault distance: d1, d2. Selection of the valid solution appears not troublesome since one of the solutions can be easily rejected since it indicates that a fault is outside a protected line, what is contradictory to the decision reached by the directional elements from both line terminals. Only in very rare cases could happen that both results for a sought fault distance d1, d2 indicate a fault as within a line. In such rare cases a valid solution can be selected with considering the other symmetrical components of the measured phasors or by applying phase quantities.
Evaluation of the fault localizing algorithms
The derived fault localizing algorithm has been tested and evaluated with use of the fault signals obtained from versatile simulations of faults on the test 220 kV, 300 km double fed transmission line (Table 1). The simulation was performed using the ATPDraw software [13], while the algorithms were implemented in MATLAB.
Table 1. Parameters of the modelled transmission line
.
The phasors of measured currents and voltages were determined by the full-cycle Fourier filtering [4], under a sampling frequency fs=1000 Hz. The signals from the simulation are in a natural way perfectly synchronized [14]. Therefore, to adapt to the case of unsynchronized measurements considered here, the signals from the remote end (R) were analytically delayed by a half sampling period (tΔ=0.5 ms or Δ=18o in the angle domain).
Figure 3 and 4 present the example of localizing the sample fault on the test line. The specifications of the fault are: a-E fault, d=0.1 p.u., fault resistance: RF= 10 Ω. Figure 3 presents the waveforms of three-phase currents and voltages recorded at both line terminals. In turn, Figure 4 presents determination of a distance to fault with use of two methods processing the signals of Figure 3. Firstly, the localizing is performed with use of the incremental positive-sequence quantities (the derived algorithm (8)). Just for comparison purpose, additionally, the localizing was conducted by using (8), but with the positive-sequence voltages and currents taken from the fault interval (t>0.06 s).
Solving (8) for both kinds of the input signals gave two values for a distance to fault. Then, mean values of the distance were determined by averaging within the windows indicated in Figure 4.
In case of the derived method (usage of incremental positive-sequence quantities) the solution dΔ1I is rejected since it is false as indicating the fault as outside the line. In turn, the second solution dΔ1II corresponds to the real position of the applied fault. The obtained mean value is 0.1052 p.u. and thus the error (0.0052 p.u. or 0.52%) can be considered as of low value, especially when taking into account the length of the modelled line: 300 km.
In case of the second method (usage of positive-sequence quantities) again one gets two solutions and only one of them is accepted, while the second, which indicates the fault as outside the line, is rejected without a doubt. The valid solution exhibits much worse accuracy. Now the obtained mean value is 0.047 p.u. and thus the error equals 0.053 p.u. or 5.3%
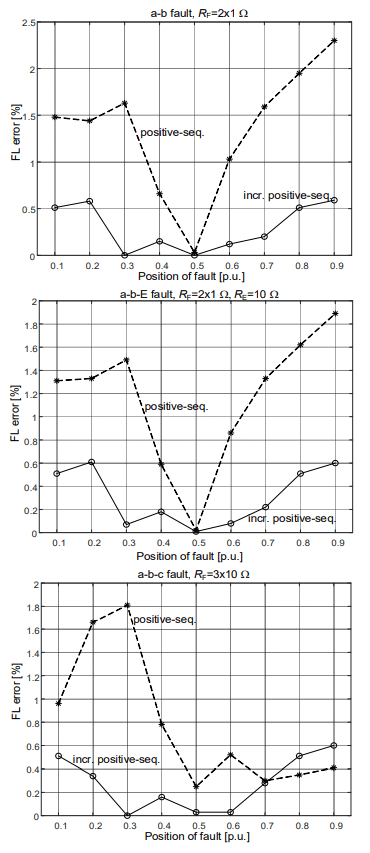
The presented example (Figure 3, Figure 4) illustrates the considered two methods. More detailed analysis on accuracy of those methods is presented in Figure 5.
Fig.3. The example: three-phase currents and voltages at both line under the sample a-E fault at d=0.1 p.u., RF=10 Ω
Fig.4. The example: localizing the sample a-E fault at d=0.1 p.u., RF=10 Ω: usage of incremental positive-sequence quantities and usage of positive-sequence quantities
.
Fig.5. Fault location errors of the two methods for different fault types: a-E, a-b, a-b-E, a-b-c and different fault resistances (RF) as the functions of position of a fault on the test transmission lines
The evaluation of fault location accuracy for the tested 300 km line, presented on Figure 5, clearly indicates that the derived fault locating algorithm processing incremental positive-sequence components exhibits much superior accuracy than when using positive-sequence components taken from the fault interval only. The error for the derived algorithm is basically not exceeding 0.5%, while for the other algorithm from this comparative analysis one obtains higher values of the errors, even of the order of 10%. In case of such big errors a compensation of transmission line shunt capacitances has to incorporated obligatory.
Conclusions
This paper introduces the algorithm for localizing faults on power transmission lines for an inspection-repair purpose. Innovative input signals of the algorithm have been taken into account. Namely, incremental positive-sequence voltages and currents from directional elements of protective relays at both line ends were taken for processing aimed at determination of a sought distance to fault. For a comparison purpose also the other algorithm which processes positive-sequence quantities, but taken from a fault interval itself, has been also tested.
The derived algorithm applies practical input signals which are available in contemporary micro-processor based protective relays. Accomplishing such localizing algorithm will increase a functionality of relays.
The comparison analysis has revealed that the derived algorithm exhibits superior accuracy in comparison to the other algorithm from the comparison. The introduced algorithm can be applied even for comparatively long lines. This is important that this algorithm does not require synchronization means for the measurements acquired at both line terminals.
REFERENCES
[1] Dołęga W., Failures of overhead lines in national electric power system – selected aspects, Przegląd Elektrotechniczny, 97 (2021), nr 8, 9-14 [2] IEEE Guide for Determining Fault Location on AC Transmission and Distribution Lines IEEE Std. C37.114-2014,New York, NY, USA: IEEE, (2014) [3] Das S., Santoso S., Gaikwad A., Patel M., Impedance-based fault location in transmission networks: Theory and application, IEEE Access, (2014), vol. 2, 537-557 [4] Saha M.M., Izykowski J., Rosolowski E., Fault Location on Power Networks, Springer, London, (2010) [5] Gonzalez-Sanchez V.H., Torres-García V., Guillen D., Ramírez-Zavala S., Review of fault location algorithms in transmission lines, IEEE International Autumn Meeting on Power, Electronics and Computing (ROPEC), Ixtapa, Mexico, (2021), 1-8 [6] Panahi H., Zamani R., Sanaye-Pasand M., Mehrjerdi H., Advances in Transmission Network Fault Location in Modern Power Systems: Review, Outlook and Future Works, IEEE Access, (2021), vol. 9, 158599-158615 [7] Sachdev M.S., Agarwal R., A technique for estimating line fault locations from digital distance relay measurements, IEEE Transactions on Power Delivery, (1988), vol. 3, no. 1, 121-129 [8] Izykowski J., Rosolowski E., Saha M.M., A fault location method for application with current differential relays of threeterminal lines, IEEE Transactions on Power Delivery, (2007), vol. 22, no. 4, 2099-2107 [9] Avendano O., Kasztenny B., Altuve H.J., Bin Le, Fischer N.,Tutorial on fault locating embedded in line current differential relays – methods, implementation, and application considerations, 17th Annual Georgia Tech Fault and Disturbance Analysis Conference, (2014) [10] McLaren P.G., Swift G.W., Zhang Z., A new positive sequence directional element for numerical distance relays, IEEE Transactions on Power Delivery, (1995), vol.2, 334-339 [11] Hoq T.M.D., Wang J., Taylor N., An incremental quantity based distance protection with capacitor voltage estimation for series compensated transmission lines, IEEE Access, (2021), vol. 9, 164493-164502 [12] Blumschein J.,Dzienis C., Kereit M., Directional comparison based on high-speed-distance protection using delta quantities, Siemens AG, (2014) [13] ATPDRAW for Windows, version (7.3), Users’ Manual (2021), https://www.atpdraw.net/ [14] Stanojevic V.A., Preston G., Terzija V., Synchronised measurements based algorithm for long transmission line fault analysis, IEEE Trans. Smart Grid, (2018), vol. 9, no. 5, 4448-4457
Authors: dr Justyna Herlender, Wroclaw University of Science and Technology, Department of Electrical Power Engineering, 27 Wybrzeże Wyspiańskiego St., 50-370 Wroclaw, Poland; E-mail: justyna.herlender@pwr.edu.pl, prof. dr Jan Iżykowski, professor emeritus, IEEE fellow for contributions to fault localization on power lines.
Source & Publisher Item Identifier: PRZEGLĄD ELEKTROTECHNICZNY, ISSN 0033-2097, R. 99 NR 7/2023. doi:10.15199/48.2023.07.25
Published by Paweł SZCZEŚNIAK1, Piotr POWROŹNIK2, Elżbieta SZTAJMEC3, University of Zielona Góra, Institute of Automatic Control, Electronics and Electrical Engineering (1), University of Zielona Góra, Institute of Metrology, Electronics and Computer Science (2), Rzeszow University of Technology, Departament of Power Electronics and Power Engineering (3) ORCID: 1.0000-0002-5822-3878; 2.0000-0001-7485-9959; 3.0000-0002-2125-0207
Abstract. The growth in new prosumer electricity generators (especially PV) has led to problems with power quality in the low-voltage (LV) distribution network. The main problems occur with the increase of the voltage value above the normative values. This may result in damage to electrical household appliances. The inverters connecting the energy source with the power grid are also switched off. In the scientific literature there can be find a lot of articles describing this problem as well as methods to solve it. The article present selected ways of reducing the voltage of the LV distribution network which are the result of the authors’ own research. The results show the use of an energy storage (ES) prototype (100 kW and 100 kWh) to provide voltage regulation services with active and reactive power. Then, the idea of using static compensators or hybrid transformers to regulate the voltage in the LV network by generating additional compensation voltage is presented. The last part of the article concerns the proposal of increasing electricity consumption during the occurrence of a large generation from prosumer installations (demand response). The results of the analysis show that by increasing the demand for energy, the value of the voltage in the grid can be reduced as well as by increasing the amount of energy fed into the grid from renewable energy sources.
Streszczenie. Rozwój nowych prosumenckich generatorów energii elektrycznej (zwłaszcza PV) doprowadził do problemów z jakością energii w sieci dystrybucyjnej niskiego napięcia (NN). Główne problemy pojawiają się przy wzroście wartości napięcia powyżej wartości normatywnych. Może to spowodować uszkodzenie elektrycznych urządzeń gospodarstwa domowego. Wyłączane są również falowniki łączące źródło energii z siecią elektroenergetyczną. W literaturze naukowej można znaleźć wiele artykułów opisujących ten problem oraz metody jego rozwiązania. W artykule przedstawiono wybrane sposoby obniżenia napięcia sieci dystrybucyjnej nn będące wynikiem badań autorów. Wyniki pokazują wykorzystanie prototypu magazynu energii (ME) (100 kW i 100 kWh) do realizacji usług regulacji napięcia mocą czynną i bierną. Następnie przedstawiono ideę wykorzystania kompensatorów statycznych lub transformatorów hybrydowych do regulacji napięcia w sieci nn poprzez generowanie dodatkowego napięcia kompensacyjnego. Ostatnia część artykułu dotyczy propozycji zwiększenia zużycia energii elektrycznej w okresie występowania dużej generacji z instalacji prosumenckich (odbiór energii). Wyniki analizy wskazują, że poprzez zwiększenie zapotrzebowania na energię można zmniejszyć wartość napięcia w sieci oraz zwiększyć ilość energii wprowadzanej do sieci z odnawialnych źródeł energii. (Wybrane metody regulacji napięcia w lokalnych sieciach dystrybucyjnych niskiego napięcia o dużej penetracji PV)
Keywords: energy management, energy storage, hybrid transformers, static voltage compensators, demand response. Słowa kluczowe: zarządzanie energią, magazyny energii, transformatory hybrydowe, statyczne kompensatory napięcia, odpowiedź zapotrzebowania.
Introduction
Contemporary LV power grids not only provide electricity to the end user, but are also designed to receive energy from local, prosumer distributed energy sources (DES) [1]. As the process of changing the paradigm of the operation of the LV distribution system has been quite rapid in its implementation, the distribution network has not adequately adapted to the new tasks. The new reality has created various technical problems. These problems include overvoltages, rapid voltage fluctuations, voltage harmonics, protection coordination problems and backflows of energy into the medium voltage grid. The presented issues result mainly from excess energy in local balancing areas. This phenomenon causes local voltage to increases in the network above the normative values Vn+10% [2]. The problem of the excessive voltage level in the LV grid can be solved by rebuilding the grid by using larger cable diameters with lower impedance and using shorter lengths of radial lines. This is a very expensive and time-consuming solution. In addition, investment costs are passed on to distribution system operators. Another solution to prevent the increase in voltage is the use of local, distributed energy storage (ES) systems (also in the form of electric vehicles) which would accumulate excess energy production from DES [3]. This is a solution more and more often considered by distribution network operators as well as the owners of installations with renewable energy sources (RES). In addition, the ES could return the stored energy during high demand for energy during peak system load hours. The costs of investing in ES facilities could be divided between distribution system operators, prosumers, and additional participants in the system services market. Another technical solution for the voltage regulation in the LV network is the use of transformers with taps where a step voltage regulation is possible. Most often it is a manual adjustment applied seasonally. This could already find solutions for automatic change of transformer taps, the socalled on-load tap changer for OLTC distribution transformers [4]. Hybrid transformer systems [5] as well as static compensators for voltage changes [6] can be used for smooth voltage regulation in the network. These solutions are not fully and commercially available and are currently considered only in scientific research. Nevertheless, these solutions provide great flexibility in regulating voltage changes in the LV grid. An interesting solution for voltage regulation in distribution networks is the so-called demand regulation [7]. The scientific literature describes many concepts of controlling the demand for electricity with the use of intelligent household appliances, electrical and thermal ES systems and other electrical devices.
This article will be a short review of selected methods of voltage regulation in a low-voltage distribution network, the changes of which are caused by variable or excessive generation of energy from renewable energy sources. Below there is discussion of the exemplary results of research on the ES system for voltage regulation with active and reactive power, which are the result of a project implemented jointly with the local energy distributor Enea Operator [8]. In the next chapter selected concepts of hybrid transformers and static voltage compensators will be presented. Exemplary results showing the possibilities of this type of system will be presented. The last topic will be voltage regulation by increasing the network load during high energy generation from RES. The presented results of the authors’ research will concern the concept of using intelligent home devices.
Energy storage
As part of the project [8], a prototype ES with a power of 100 kW and a capacity of 100 kWh, and in Valve Regulated Lead Acid (VRLA) technology (Fig. 1a) was created. This prototype was tested in both laboratory and real-life conditions. It was connected to the LV distribution network at the transformer station. The integration of the batteries with the LV distribution network was carried out using a power electronic converter made in the (SiC) technology. In the control of the power electronic converter, the algorithm for regulating the voltage of the power grid with the active and reactive power generated by the energy storage system has been implemented [9-12]. In the verification tests of the active and reactive power voltage control algorithm, voltage parameters in the power grid at the energy storage terminals were recorded. The power quality analyzer PQ-Box 150/200 for measurements was used. The results of voltage regulation for regulation both with and without active and reactive power were performed on the same day of the week (Fig. 1b). It is obvious that it is impossible to obtain identical operating conditions for the power system. Measuring voltage parameters on the same day of the week (presented results refer to Thursday) will give some approximation of comparable system operating conditions. Instantaneous network voltage values may exceed the set values which results from the dynamics of the control algorithm. There is a clear reduction in voltage fluctuations when the control algorithm is turned on [11]. In the power system without the regulation service turned on, the voltages reached values even above 250 V. The minimum voltages dropped to 238 V.
Fig.1. Voltage regulation using ES: a) interior of a container with an energy storage with a capacity of 100 kW, 100 kWh made in VRLA technology, b) voltage change in the LV distribution network with and without an energy storage providing the network voltage regulation service
The details of changes in the grid voltage value are shown in the box plot in Fig. 2. A boxplot contains information about the location, dispersion, and shape of the data distribution. The box contains the first (Q1) and the third (Q3) quartiles. The points between the first and third quartiles represent 50% of the scores, and the median represents the middle of the scores. The median does not have to lie in the middle of the box. In addition, the minimum and maximum values are marked on the chart. The boxplot for the results with the compensation algorithm enabled indicates that the span between the voltage values was 238 V to 248 V. The span of the box, however, is 241.5 V to 245.8 V. The median was 243.5 V. For the results without compensation, the span the voltage results was from 238.2 V to 251.5 V and the box value was from 241.5 V to 247 V. The median was 244.1 volts. The presented results indicate the effectiveness of the applied voltage regulation with the use of energy storage.
Fig.2. Box plot of voltage variation in the power grid, with and without the active and reactive power voltage control algorithm
Hybrid transformers and static voltage compensators
Another concept of voltage regulation in the network, compensation and voltage fluctuations is the use of hybrid transformers (HT) installed in a typical distribution station [5], [13] – [15]. The HT concepts are so far described in scientific articles as systems with high regulatory potential. They consist of an electromagnetic transformer that works with an AC/AC power electronic converter with PWM modulation. Fig. 3 shows single-phase implementations of two HT configuration concepts with a serial converter. In Fig. 3a, any AC/AC converter that regulates the root mean square (RMS) value of the voltage can be used as a power electronic converter. These can be frequency converters (back-to-back [5], matrix converter (MC) [14], [15]) or AC/AC voltage controllers [6], [13]. Fig. 3b also shows the scheme of the HT concept with a series power electronic converter with an additional battery energy storage. An additional DC energy storage is used to support the compensation process. An HT can be switched on anywhere in the power grid, but the most sensible solution is to replace classic substation transformers with the HT.
Fig.3. The single-phase realizations of the HT configurations: a) series AC/AC converter with galvanic separation, b) series with AC/DC/AC converter and additional DC energy storage element
Fig.4. The MPC of the HT with MC with minimalization of the output voltage tracking error and input reactive power
One of the HT concepts is the topology with the MC [14], [15]. Using the MC, it is possible to compensate for both symmetrical and asymmetrical voltage changes as well as harmonic distortions. It is also obvious that the grid voltage can be regulated in situations where the voltage is too high as a result of large generation of energy from RES.
Fig.5. Results of compensations of electric power grid voltage fluctuation using the HT with the MC and MPC control
The model predictive control (MPC) scheme for the proposed HT with MC is shown in Fig. 4. To illustrate the beneficial properties of the HT with the MC (Fig. 4), test results of the system are shown in Fig. 5. As can be seen in Fig. 5, the load voltage is kept at a constant amplitude without harmonic distortion, despite large variations in the main voltage. As already mentioned, voltage regulation can also be implemented using static compensators. Then it can be used anywhere on the power grid. An example of a selected AC voltage compensator topology using a bipolar AC chopper is shown in Fig. 6 [16]. These compensators have quite complex control strategies, but they can compensate for large voltage dips in one phase. In addition, they can be used to regulate long-term voltage and compensate for fast-changing voltage fluctuations. This article only shows the topology concept without analysing it in detail.
Fig.6. Diagram of the three-phase voltage compensator with a bipolar AC/AC chopper
Energy management with smart home appliances
The concept of using and integrating smart home appliances (SHA) in the local low voltage balancing of the distribution grid in order to counteract the increase and decrease of voltage in the network is widely discussed in various scientific articles. Such concepts are still at the stage of theoretical consideration and prototype testing due to the lack of many household devices with free remote access to their regulation or activation. The emergence of the Internet of Things (IoT) technology may lead to a breakthrough in the use of home devices in regulating the load of the power system. Nevertheless, the first IoT applications in the SHA are focused on increasing the comfort and elasticity of using a given device. From the point of view of power system load regulation, the SHA should have the functionality of reacting to signals from the environment (remote control signals) and operating conditions – e.g., to the voltage level in the network. Therefore, the concept of a smart device suggests that smart devices not only perform their main functionality in a user-defined manner, but also autonomously respond to the environmental conditions in which they work.
Appropriate SHA control can bring the following benefits to the power system: balancing the supply of energy generated by RES to reduce transmission losses and thus increase the energy efficiency of the system; regulating the grid voltage and thus improving the reliability of the system and the devices operating in it; increasing the production from RES by not switching off the photovoltaic inverters under high voltage conditions in the power grid. It should be emphasized that to achieve these goals, the use of the SHA will require users to change their usage behaviour.
Works [17] – [19] propose to manage the work of the SHA through an algorithm called Elastic Energy Management (EEM). Various functionalities of the SHA operation were defined, which were controlled by an external signal from the central unit or based on the measurement of the voltage in the grid. These functionalities were related to limiting power consumption, pauses in operation or shifting the activation time [17]. All these functionalities have been saved in the EEM algorithm, where a database of devices and their ability to change power during operation should be created. The algorithm was implemented in the Raspberry PI device, which was controlled by a Programmable AC Load device (Fig. 7). During the test, the power was changed according with the settings and the number of simulated devices. The EEM algorithm changed the power of the devices until they reached the set limit of the mains voltage. Reaching the set voltage was associated with an increase (Fig. 8a) or decrease (Fig. 8b) in the grid load, which resulted in a change in the voltage drop on the line impedance.
Fig.7. Schematic diagram of experimental setup of using SHA for regulation of voltage in electric power grid
While reducing the load on the line may be related to the shutdown of certain low-priority devices, increasing the load is not so simple. Devices must be defined that can be switched on freely or are prepared for operation in advance by the user [18]. The first group includes all battery devices (electric vehicles, laptops, tablets, telephones, etc.), whose chargers can be activated by an external signal. In addition, these can be water heating devices or ventilation and cooling devices. The second group consists of devices such as a washing machine, dishwasher, electric cooker. They are prepared by users for operation, and they can be activated by an external signal from the central control unit, which will send appropriate information about the RES generation. The use of the second group of home appliances will involve a change in the habits of users, as the activities can be permitted to be performed when the appropriate conditions for generating energy occur. It is obvious that the user will be able to freely change the settings of these devices so that their use corresponds to current needs. All work is focused on ensuring user comfort. In this case, the user has decisive roles. A decision may be made to switch the system to fully autonomous mode or manually. Some users will obviously use the autonomous mode most often, which will provide financial benefits (e.g., reduction of electricity bills). For a selected group of users, i.e., those with greater technological awareness, the manual or semi-manual mode will allow for better adjustment to their needs. Regardless of the target group of users, it would be required from the front-end side of the system to ensure that it was user friendly and responsive.
Fig.8. Voltage changes in the power grid due to load changes, which is the effect of the EEM algorithm: a) increasing load power, b) reducing load power
Conclusions
The article presents selected methods of the voltage regulation in the LV distribution network, the changes of which are caused by variable or excessive generation of energy from RES. There has been presented the discussion of exemplary results of the research on methods of the voltage regulation in a power grid with an ES system, HT and static voltage compensators, as well as by increasing the grid load during the production of large energy from RES with the use of smart home appliances.
The research results on a mature technological method of voltage regulation with the use of the ES are also presented. Voltage regulation can be achieved by controlling the active and reactive power generated by the power electronic converter connected to the ES. Similar results can be achieved by controlling the reactive power of solar inverters [19], or by using parallel reactive power compensators. The other proposals presented in the article are, for now, only scientific concepts. Nevertheless, it should be noted that the application of all three proposals could significantly improve the operation of the power system when too much energy is generated from RES. More detailed studies must be carried out considering the simultaneous operation of all the proposed methods.
Acknowledgments – Some of the results of this paper are part of projects that have received funding from the National Centre for Research and Development in the frame of the European Regional Development Fund (ERDF), program Smart Growth Operational Programme, action 1.2, project number: POIR.01.02.00-00-0232/16.
REFERENCES
[1] Benysek G., Kazmierkowski M.P., Popczyk J., Strzelecki R., Power electronic systems as a crucial part of Smart Grid infrastructure – a survey, Bulletin of the Polish Academy of Sciences: Technical Sciences, 59 (2011), No. 4, 455-473 [2] Hashemi S., Østergaard J., Methods and strategies for overvoltage prevention in low voltage distribution systems with PV, IET Renewable Power Generation, 11 (2017), 205-214 [3] Faisal M., Hannan M.A., Ker J., Hussain A., Mansor M.B., Blaabjerg F., Review of energy storage system technologies in microgrid applications: Issues and challenges, IEEE Access, 6 (2018), 35143-35164 [4] Aziz T., Ketjoy N., Enhancing PV penetration in LV networks using reactive power control and on load tap changer with existing transformers, IEEE Access, 6 (2018), 2683-2691 [5] Carreno A., Perez M., Baier C., Huang A., Rajendran S., Malinowski M., Configurations, Power Topologies and Applications of Hybrid Distribution Transformer, Energies, 14 (2021) [6] Kaniewski J., Szcześniak P., Jarnut M., Benysek H., Hybrid voltage sag/swell compensators: a review of hybrid AC/AC converters, IEEE Industrial Electronics Magazine, 9 (2015), No. 4, 37-48 [7] Siano P., Demand response and smart grids – A survey, Renew. Sustain. Energy Rev, 30 (2014), 461-478 [8] https://www.gov.pl/web/ncbr/innowacyjne-uslugisystemowe-magazynow-energii [9] Majumder R., Aspect of voltage stability and reactive power support in active distribution, IET Generation, Transmission & Distribution, 8 (2014), 442-450 [10] Zimann J.F., Batschauer A.L., Mezaroba M., Neves F.A.S., Energy storage system control algorithm for voltage regulation with active and reactive power injection in low-voltage distribution network, Electric Power Systems Research, 174 (2019), 105825 [11] Smoleński R., Szcześniak P., Drożdż W., Kasperski Ł., Advanced metering infrastructure and energy storage for location and ˙mitigation of power quality disturbances in the utility grid with high penetration of renewables, Renewable and Sustainable Energy Reviews, 157 (2022) [12] Leżyński P., Szcześniak P., Waśkowicz B., Smoleński R., Drożdż W., Design and Implementation of a Fully Controllable Cyber-Physical System for Testing Energy Storage Systems, IEEE Access, 7 (2019), 47259-47272 [13] Kaniewski J., Fedyczak Z., Szcześniak P., Threephase hybrid transformer using matrix-chopper as an interface between two AC voltage sources, Archives of Electrical Engineering, 63 (2014), No. 2, 197-210 [14] Szcześniak P., A modelling of AC voltage stabilizer based on a hybrid transformer with matrix converter, Archives of Electrical Engineering, 66 (2017), No. 2, 371-382 [15] Szcześniak P., Tadra G., Kaniewski J., Fedyczak Z., Model predictive control algorithm of AC voltage stabilizer based on hybrid transformer with a matrix converter, Electric Power Systems Research, 170 (2019), 222-228 [16] Kaniewski J., Power flow controller based on bipolar direct PWM AC/AC converter operation with active load,. Archives of Electrical Engineering, 68 (2019), No. 2, 341-356 [17] Powroźnik P., Szcześniak P., Piotrowski K., Elastic energy management algorithm using IoT technology for devices with smart appliance functionality for applications in smart-grid, Energies, 15 (2022), No. 1 [18] Powroźnik P., Szcześniak P., Turchan K., Krysik M., Koropiecki I., Piotrowski K., An elastic energy management algorithm in a hierarchical control system with distributed control devices, Energies, 15 (2022), No. 13 [19] Chmielowiec K., Topolski Ł., Piszczek A., Hanzelka Z., Charakterystyki inwerterów fotowoltaicznych w świetle zapisów kodeksu sieciowego oraz wymagań polskich operatorów systemów dystrybucyjnych, Przegląd Elektrotechniczny, 97 (2021), No. 4, 81-87
Authors: dr hab. inż. Paweł Szcześniak, prof UZ, University of Zielona Góra, Institute of Automatic Control, Electronics and Electrical Engineering, Podgórna 50, 65-246 Zielona Góra, e-mail: p.szczesniak@iee.uz.zgora.pl; dr inż. Piotr Powroźnik, Uniwersity of Zielona Góra, Institute of Metrology, Electronics and Computer Science, Podgórna 50, 65-246 Zielona Góra, e-mail: p.powroznik@imei.uz.zgora.pl; mgr inż. Elżbieta Sztajmec, Rzeszów University of Technology, Departament of Power Electronics and Power Engineering, 35-959 Rzeszów, e-mail: e.sztajmec@prz.edu.pl.
Source & Publisher Item Identifier: PRZEGLĄD ELEKTROTECHNICZNY, ISSN 0033-2097, R. 99 NR 11/2023. doi:10.15199/48.2023.11.11