Published by Electrotek Concepts, Inc., PQSoft Case Study: Electric Arc Furnace Flicker and Harmonic Control, Document ID: PQS0314, Date: April 16, 2003.
Abstract: A steel manufacturer plans to construct an electric arc furnace-based steel making facility using a thin slab casting machine directly coupled to a hot strip rolling mill. The planned melt shop contains two dc electric arc furnaces (EAF) and will supply two ladle metallurgy furnaces (LMF) which will feed two thin slab casting machines. Concerns are raised with regards to voltage flicker and harmonic distortion levels associated with the proposed steel plant. The main objectives of this study are to evaluate the need for a Static-var Compensator (SVC) to control voltage fluctuations and to develop a minimum harmonic filter design that will provide required reactive compensation for the plant loads and will control harmonic levels to meet IEEE Std. 519 limits.
INTRODUCTION
This case study presents the results of an engineering study evaluating concerns for flicker and harmonic distortion levels associated with a proposed steel plant. The steel manufacturer plans to construct an electric arc furnace-based steel making facility using a thin slab casting machine directly coupled to a hot strip rolling mill. The planned melt shop contains two dc electric arc furnaces (EAF) and will supply two ladle metallurgy furnaces (LMF) which will feed two thin slab casting machines.
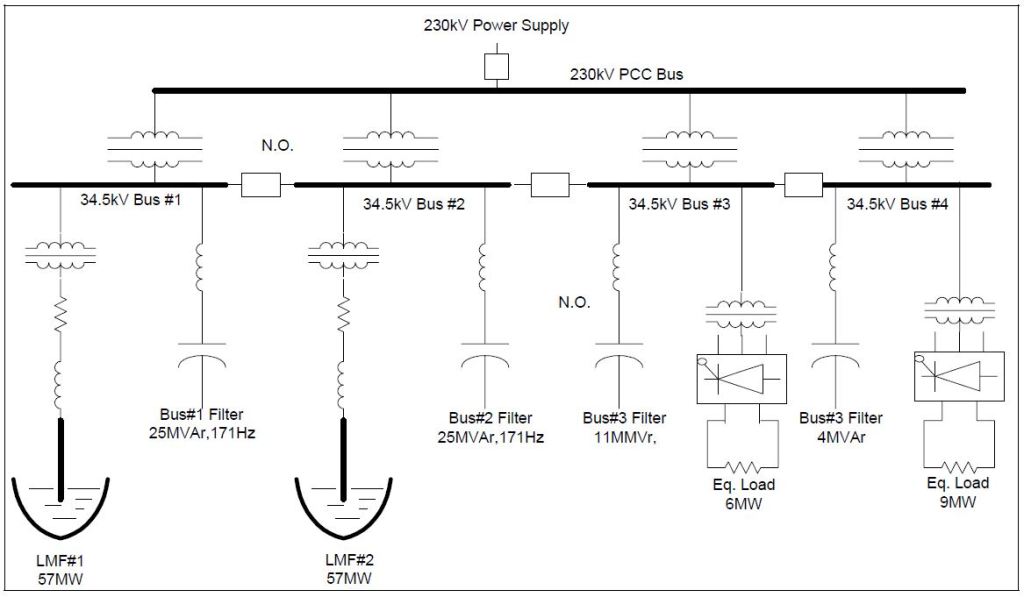
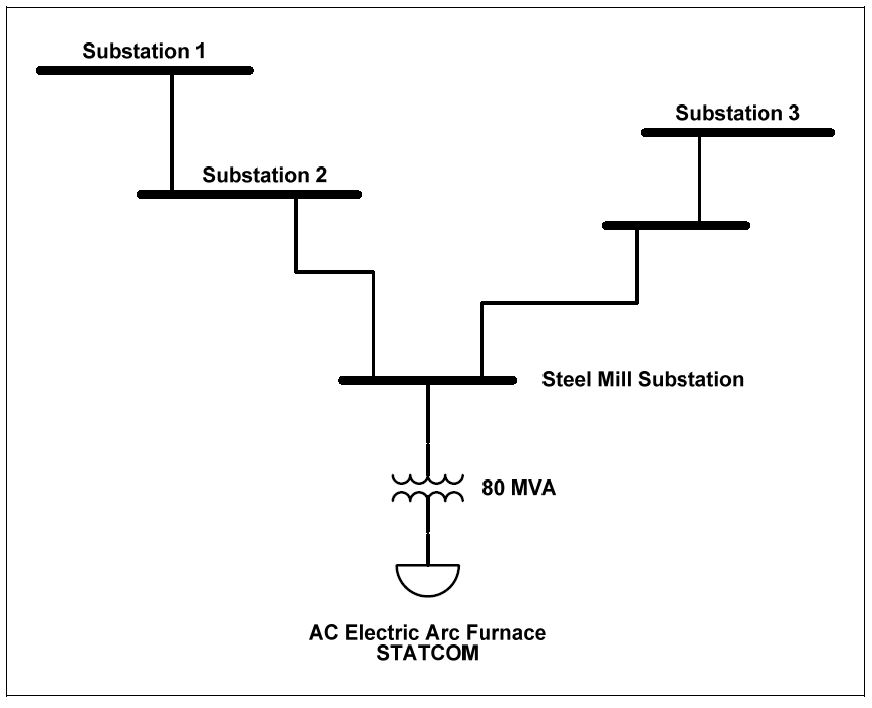
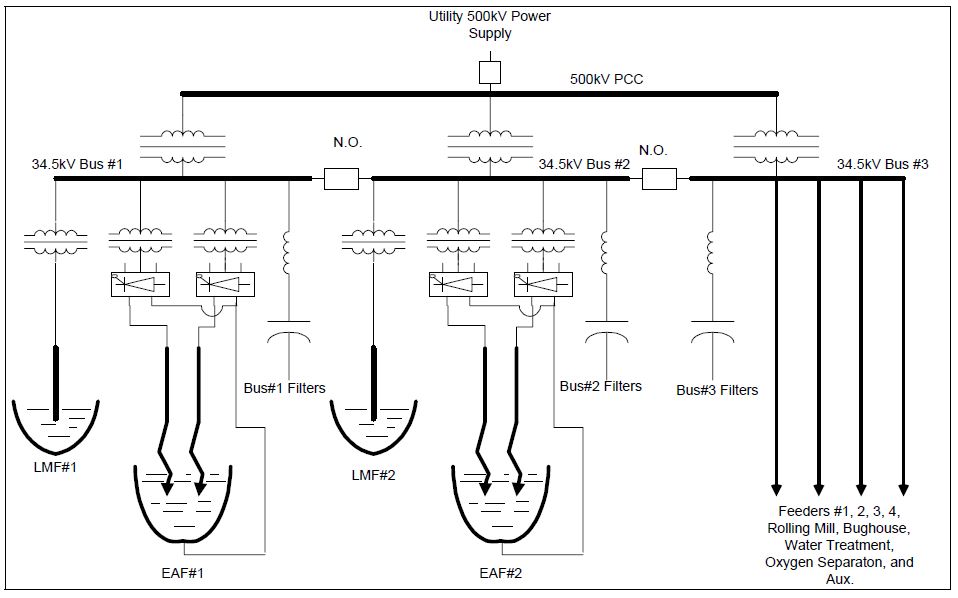
The steel plant will be supplied by a utility from its 500kV transmission system. The available short-circuit capacity from the utility will be 25,000A, 21,600 MVA; 19233A, 16,648 MVA; and 12,940A, 11,205 MVA respectively under different utility operation conditions. The steel plant’s electric power system will consist of a 500kV to 34.5kV substation. The substation 34.5kV bus is sectionalized. Sections 1 and 2 supply the melt shop, each has an 80 MW dual electrode dc arc furnace (EAF) and a 15 MW ac ladle furnace (LMF). Section 3 of the 34.5kV bus supplies a distribution system for the rolling mill. The auxiliary system of the steel plant will contain various types of air compressors, water pumps, ac drives and cycloconverters. A diagram of the overall facility represented for the study is provided in Figure 1. For simplicity, details of the system connection have not been shown. Multi-stage harmonic filters on each of the 34.5kV buses are indicated using a single filter symbol.
The steel manufacturer intends to operate this system with a minimum installation of reactive power compensation and harmonic filtering. The major concerns associated with operating the steel plant, as far as utility power quality is concerned, are harmonic distortion, flicker (voltage fluctuations), and transients caused by switching on the utility system or by switching a filter bank in the steel plant.
Operation of electric arc furnaces introduces random variations in the demand of the real and reactive power from the utility supply system. Due to the nonlinear characteristics of an electric arc furnace, the furnace current will be rich with harmonics. An installation of a static var compensator (SVC) at the steel plant will help to reduce the level of the system voltage fluctuations. However, the SVC operation can also generate harmonics. In addition to the arc furnaces, adjustable speed drives and cycloconverters used in the plant will also generate harmonics. The combined effects of all these harmonic producing loads will determine the levels of voltage and current distortion at the point of common coupling (PCC) between the utility and the steel plant. The filter designs developed in this study are based on the combined impacts of all the nonlinear loads in the facility.
Objectives
The main objectives of this study are to evaluate the need for an SVC to control voltage fluctuations and to develop a minimum harmonic filter design that will provide required reactive compensation for the plant loads and will control harmonic levels to meet IEEE Std. 519 limits at the 500kV PCC.
Approach
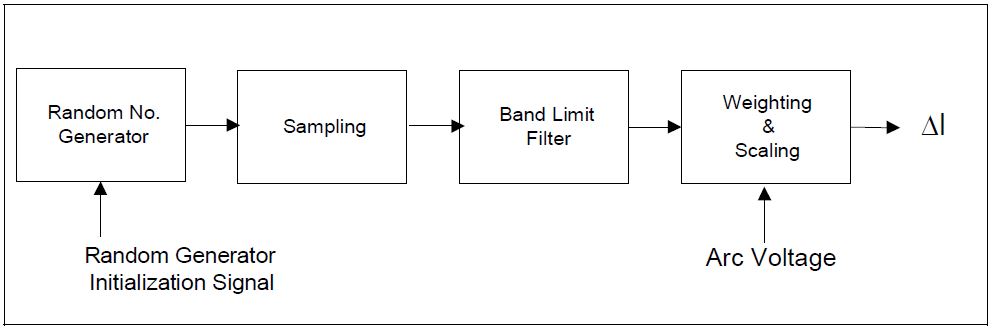
Electrotek developed a complete steel manufacturer power supply system model for the evaluation using the Electromagnetic Transient Program (EMTP). The model includes all important system components from the 500kV utility power supply to the 480V steel plant power systems. The model is used to characterize the harmonics generated by the nonlinear loads in the facility (arc furnaces, ladle furnace, cycloconverter, ac drives, etc.). The model also includes a dynamic representation of the arc characteristics to permit evaluation of voltage fluctuations at the PCC with the utility supply system.
Circuit components such as power transformers, arc furnaces, cycloconverters, ac drives, SVC system as well as capacitor or harmonic filter banks are represented in the system model using data modules developed by Electrotek. If future evaluations are needed or if there are any system changes, this modularized approach for the model implementation will make additional simulations much easier.
The EMTP model is used directly for the evaluation of flicker concerns but it is inefficient for the many cases required for filter (each case requires many hours to run). Therefore, a steady state system representation is developed using Electrotek’s SuperHarm® program for harmonic evaluations. This SuperHarm model is used for the filter design task using frequency domain simulations. The program allows evaluation of response to the whole range of frequencies generated by the steel plant nonlinear loads (integer and non-integer harmonics).
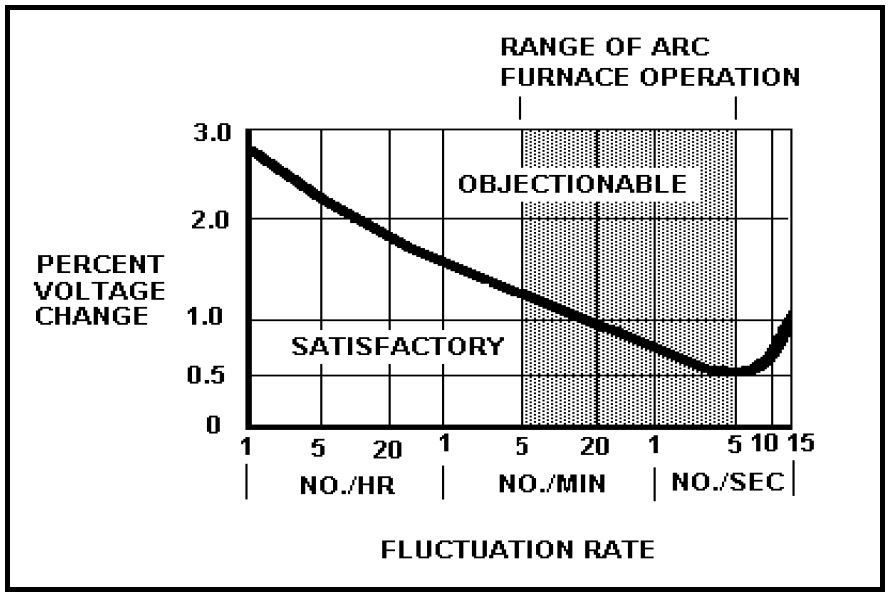
VOLTAGE FLUCTUATION EVALUATION
There are two kinds of power changes associated with the melt shop operation. First, at each stage of the melt, the furnace demands different levels of active heating power. The furnace operating voltage and current settings are correspondingly changed during the heating cycle to meet with a designed furnace load profile. This type of change happens several times per melting cycle. Corresponding to each of these input power adjustments, disturbances in the system voltage occur. However, these power level adjustments do not result in the voltage flicker investigated here.
The voltage fluctuations of interest are those associated with uncontrollable variations of the dc arc length. These variations are highly random, and occur much more frequently than the power level adjustments described above. The greatest change in arc length occurs during initial scrap meltdown, with variations in equivalent arc resistance diminishing as the melt progresses. Different types of scrap exhibit different arc variation profiles.
The flicker study examines the following questions:
- What flicker level can be expected on the 500kV PCC bus with no reactive compensation or other mitigation?
- Does two-furnace operation double the flicker level of single-furnace operation? What is the worst case scenario?
- Is a SVC necessary for flicker control? If yes, what is the minimum size needed to reduce 500kV flicker magnitude to an acceptable level?
Summary of Flicker Evaluation Cases
The source strength at the 500kV PCC varies with on-line generation. The multiple system configurations can be reduced to three approximate capacity levels, as shown below:
Table 1 – Possible Utility Supply System Strength at 500kV PCC Bus
| Source Strength | Short-Circuit Strength (MVA) at 500kV PCC | Short-Circuit Isc (Amps) at 500kV PCC |
|---|---|---|
| Weak | 11206 | 12940 |
| Normal | 16648 | 19223 |
| Strong | 21650 | 25000 |
Results of the EMTP voltage flicker simulations are summarized in Table 2 and Table 3.
As expected, comparing the first and fourth case in the table shows that a 100Mvar capacitor at the melt shop 34.5kV bus has only a slight impact on the voltage flicker at 34.5kV and basically no impact on flicker at 500kV. The reason is that, compared with the utility supply source, the current loop impedance of the compensation circuit is fairly high, especially at flicker frequencies. As a result, even with the local var supply, the major portion of the fluctuation in reactive power is delivered from the utility system. The capacitor compensation is mainly for melt shop power factor correction.
The table also summarizes flicker levels with an SVC consisting of a 100Mvar TCR and 95Mvar of fixed tuned filter banks. It is shown that the SVC effectively reduces flicker at both 34.5kV and 500kV.
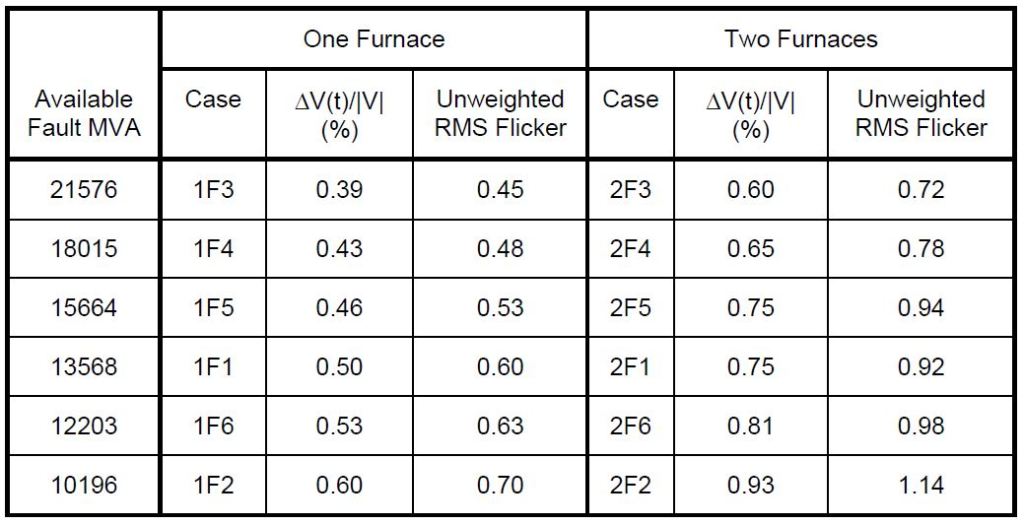
Only a weak system was considered for single furnace operation. In all single furnace cases, the maximum instantaneous voltage flicker magnitude is less than 0.3% of system line-to-ground voltage. The dominant frequency of the flicker voltage is around 4 Hz. Voltage fluctuations at this level should not cause any problem.
Table 2 – Maximum Instantaneous Voltage Flicker for Single Furnace Operation
| Case | Conditions | MW | Max ΔV/V at 34.5kV (1000*%) | Max ΔV/V at 500kV (1000*%) |
|---|---|---|---|---|
| 80 MW | Weak Source, a single furnace, No compensation | 80.3 | 2400 | 300 |
| 80CAP | Weak Source, a single furnace, With 95Mvar cap./filter | 80.3 | 2500 | 300 |
| 80TCR | Weak Source, a single furnace, With 65 Mvar cap./filter and 100Mvar TCR | 80.3 | 1350 | 200 |
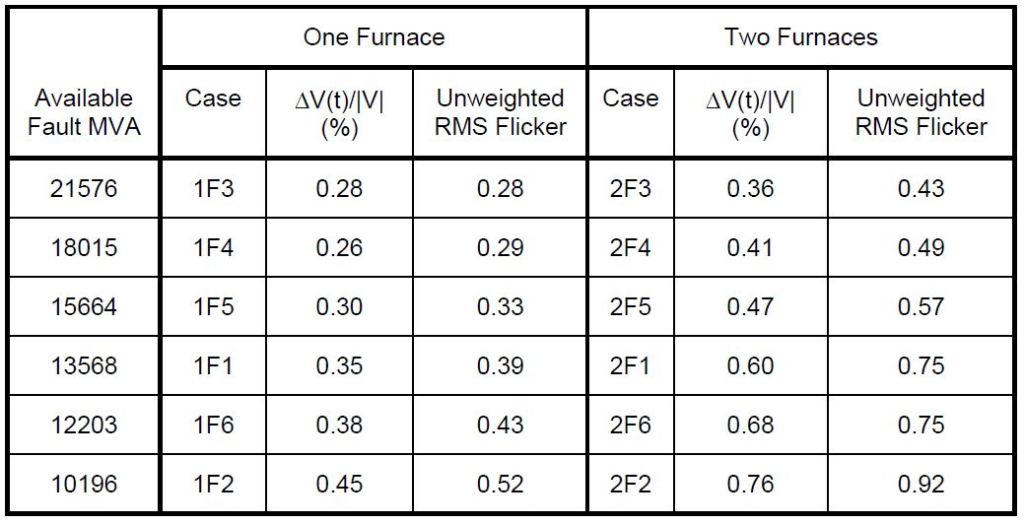
For the two furnace cases, the maximum instantaneous voltage flicker at 34.5kV reached 5% and 500kV flicker reached 0.6% with two furnace operation on a weak source.
Table 3 – Maximum Instantaneous Voltage Flicker for Double-Furnace Operation
| Case | Conditions | MW | Max ΔV/V at 34.5kV (1000*%) | Max ΔV/V at 500kV (1000*%) |
|---|---|---|---|---|
| 2-80MW | Weak Source, two furnaces, no compensation | 2*80.3 | 5000 | 600 |
| 2-80TCR | Weak Source, two furnaces, With 95Mvar cap./filter and 100Mvar TCR on each furnace bus | 2*80.3 | 1500 | 300 |
| 2-80MW2 | Normal Source, two furnaces, no compensation | 2*80.3 | 4000 | 380 |
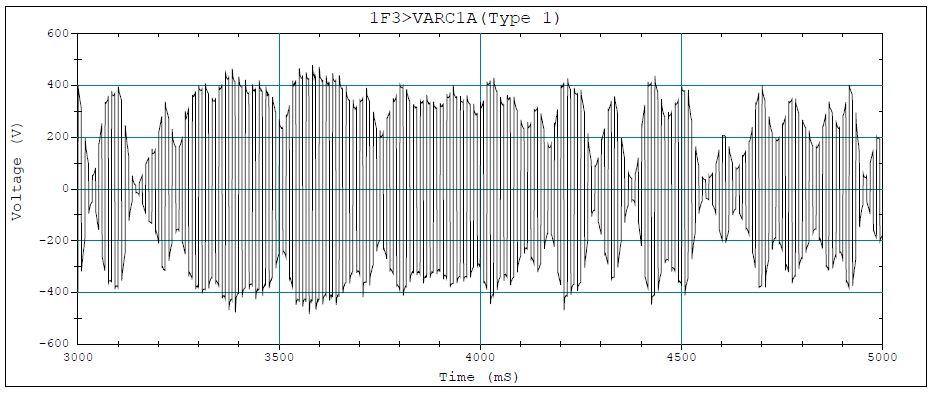
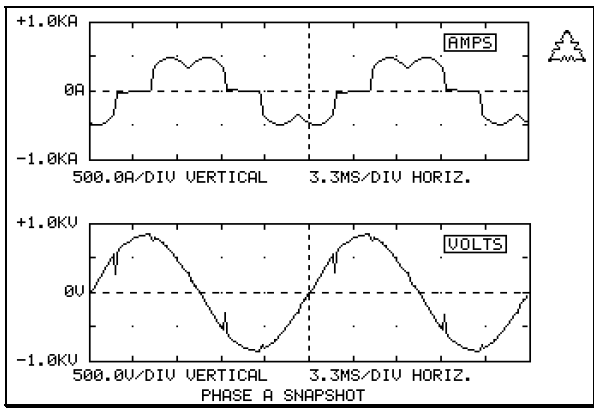
Typical Waveforms from Simulation
Simulations with normal source strength showed that an SVC is not needed to control flicker. It was not necessary to analyze the strong source condition, since flicker level would be even lower. However, the weak source condition was analyzed to obtain the worst case flicker level.
Two sets of flicker simulation waveforms are shown below. The first set shows single furnace operation on a weak system with the balancing control between two rectifiers activated. The second set two furnace operation on a normal system with fully independent rectifier operation (i.e., balancing control disabled). No reactive power compensation was assumed for these simulations.
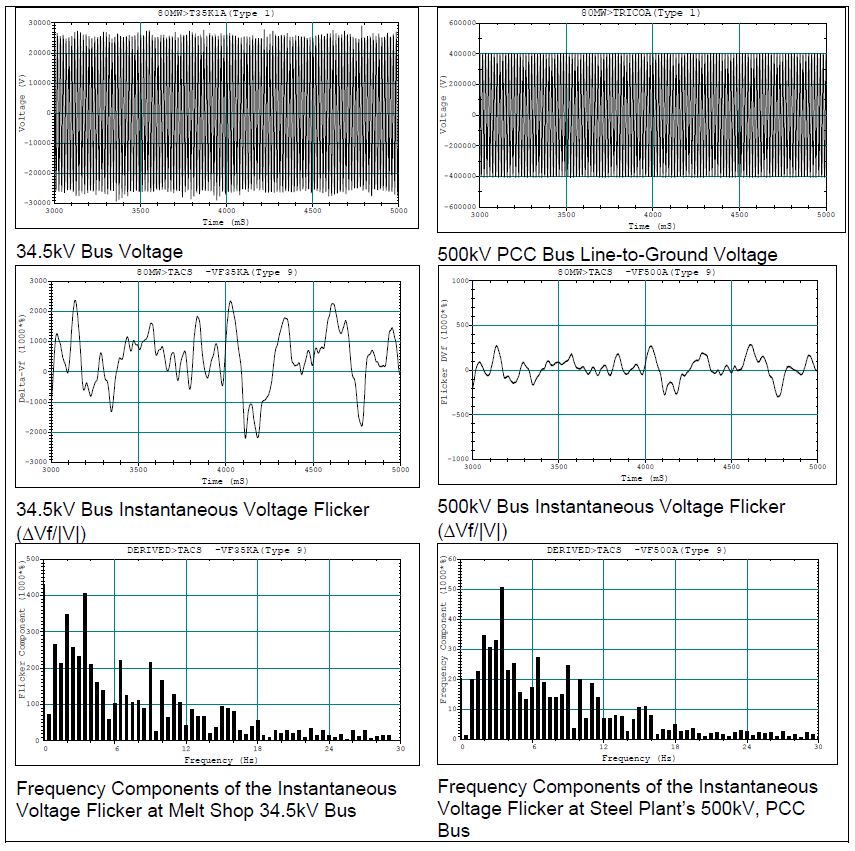
Single Furnace, Weak Source Condition
This case simulated a single dual-electrode dc arc furnace operating on a weak supply with no reactive compensation. An average melting power of 80.3 MW was specified by setting the rectifier dc bus voltage reference to 535 V and the electrode dc current reference to 75 kA/electrode.
For this single furnace case, the maximum instantaneous flicker reached 2.5% at 34.5kV bus and 0.3% at the 500kV PCC. Flicker voltage frequency content ranged from 1 to 15 Hz, with great concentration at about 4 Hz.
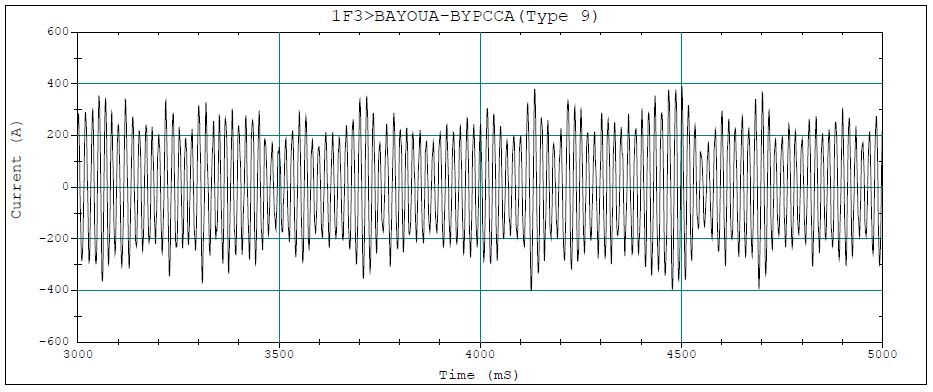
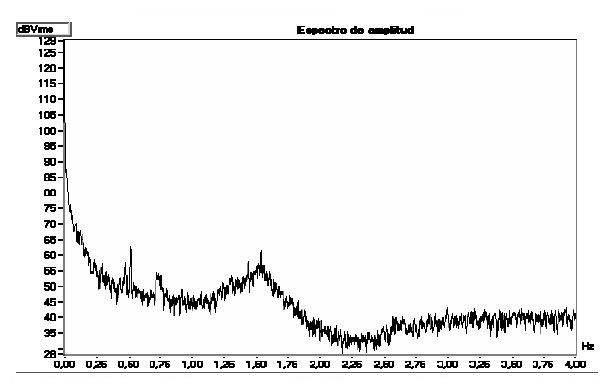
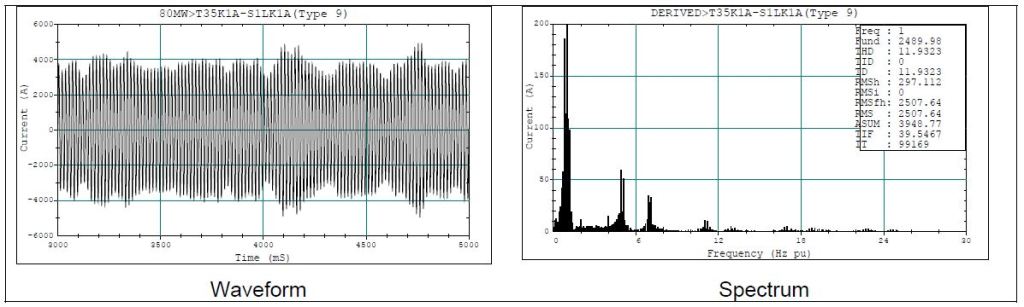
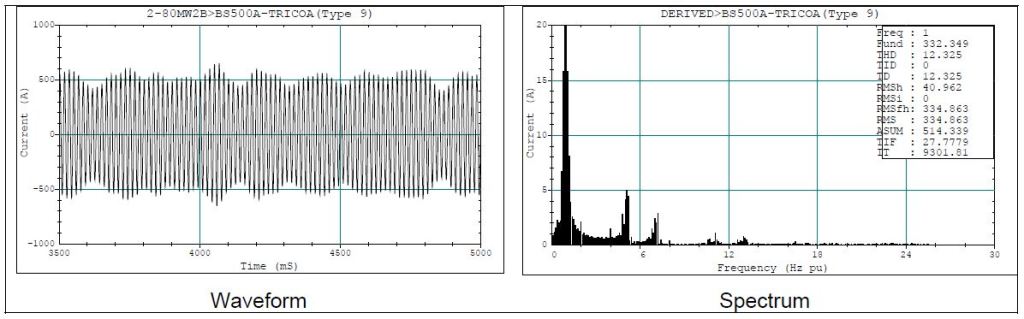
Figure 2 shows the waveform and spectrum of the total current injection into the 34.5kV side of the 150 MVA melt shop supply transformer.
Voltage variations at 34.5kV and at 500kV were evaluated, with flicker at 500kV being the more important with regard to the need for an SVC.
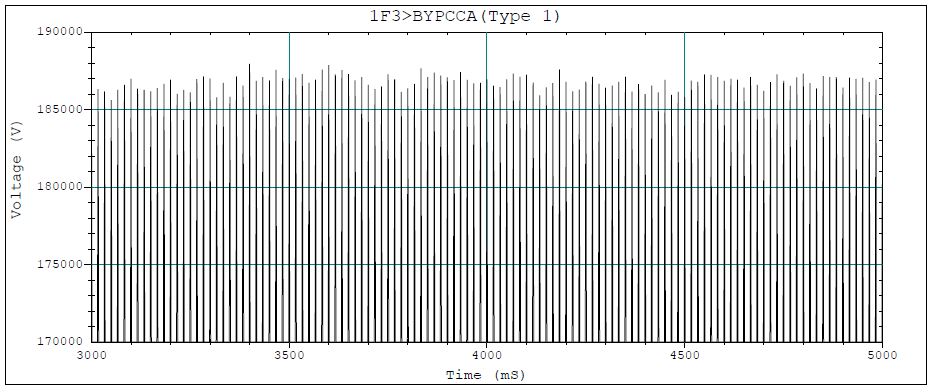
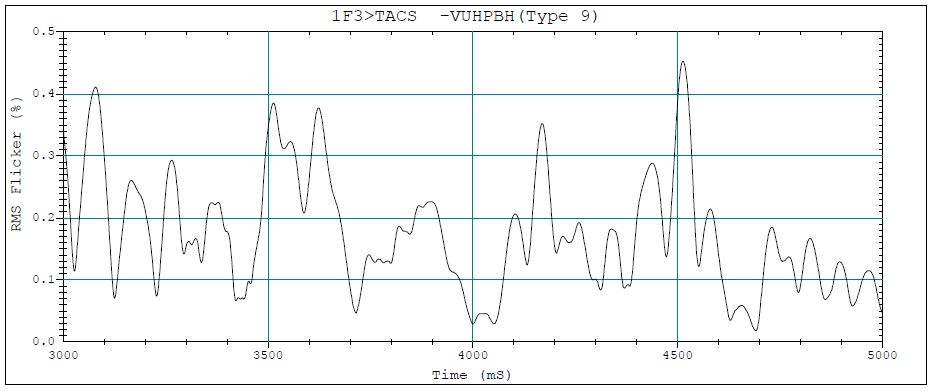
Line-ground voltage, instantaneous flicker voltage, and flicker voltage frequency content waveforms at 500kV and 34.5kV are shown in Figure 3.
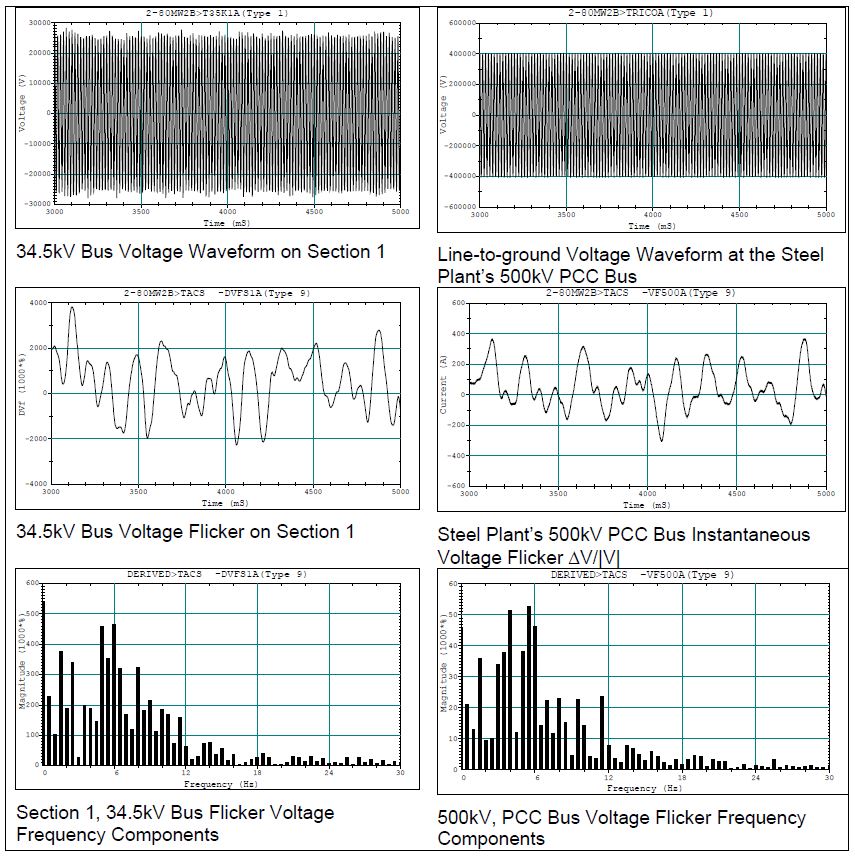
Two Furnaces, Normal Source Conditions
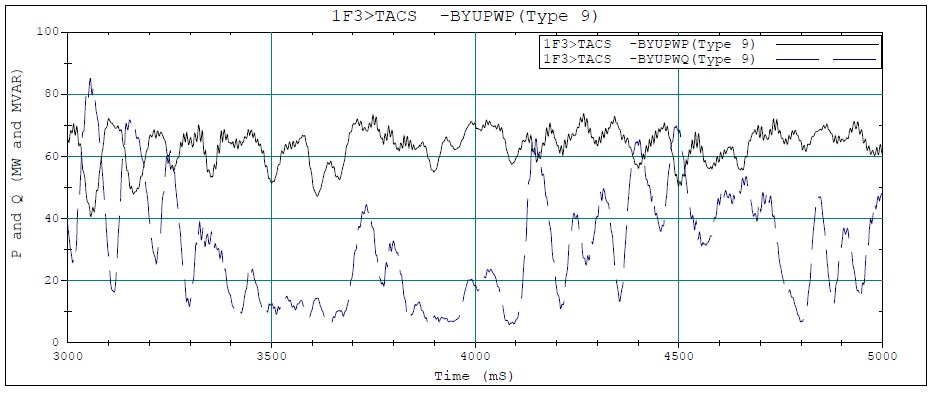
This case simulates two-furnace operation with normal source strength. The furnace melting power settings and other system conditions are the same as those given in Case 80 MW, but the balancing control circuit was disabled to obtain independent operation of the two six pulse rectifiers for each furnace. This is the normal procedure for the initial portion of the melt. Therefore, this case should represent worst case conditions with two furnaces operating in the initial melt period. Electrical quantities for this case are shown in Figure 4 and Figure 5.
Two furnace operation with normal source strength produced a maximum flicker of 3.8% at 34.5kV and 0.37% at 500kV. Flicker voltage frequency content was found to be different than that for single furnace operation. The dominant frequency in this case is close to 6 Hz with the spectrum spread from 2 to 12 Hz. In general, 500kV voltage flicker of this magnitude should not create problems for the other customers on the utility transmission system.
Figure 4 shows the waveform and spectrum of the total current injection into the 500kV transmission system.
Voltage variations at 34.5kV and at 500kV were evaluated, with flicker at 500kV being the more important with regard to the need for an SVC.
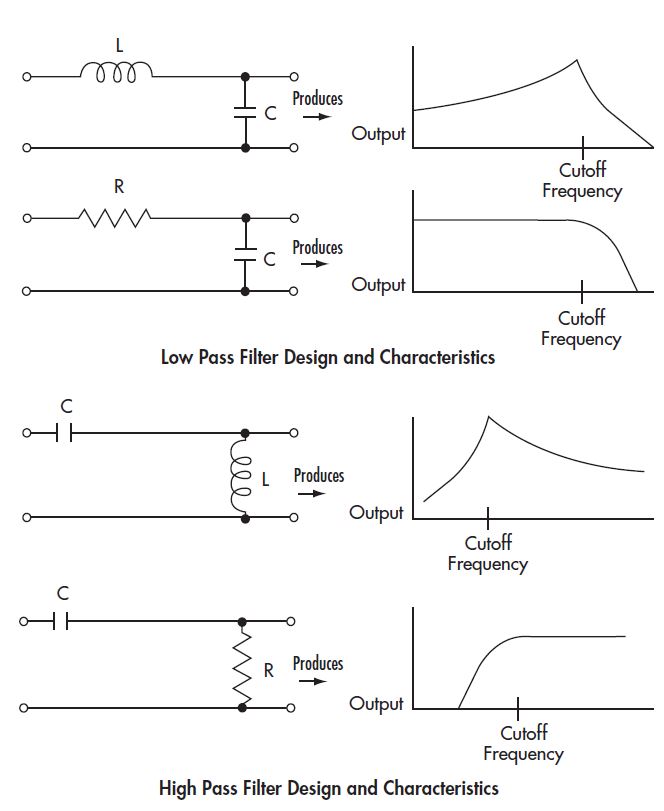
Harmonic Filter Design
Filter Options Evaluated
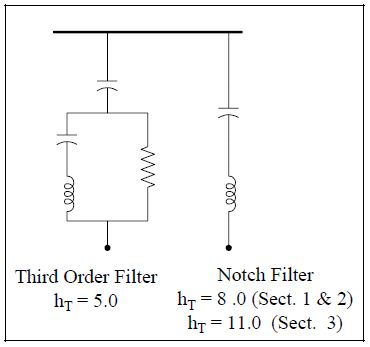
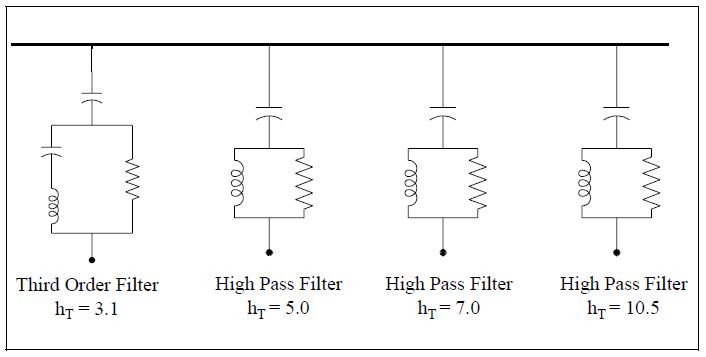
Four different filter options were considered and presented to the utility. The first option was a classic filter design with individual tuned branches at the 2nd, 3rd, 4th, 5th, 7th, and 11th harmonics (Sections 1 and 2). This results in a very expensive design because many branches require damping resistors to avoid high impedance parallel resonances that could excite non-integer harmonic components. Options 2 and 3 both involve the third order filter tuned to the fifth harmonic with a damping resistor to prevent resonance problems. In option 2, a 2nd harmonic filter was included on Section 1 and a 3rd harmonic filter on Section 3 to provide some reduction of these non-characteristic harmonics at the 500kV PCC.
Option 4 consists of a third order filter tuned near the third harmonic to provide damping at the lower order components. Tuned branches are included at the 5th, 7th, and 11th (actually 10.5) to control the characteristic harmonics of the dc furnaces operating in the independent 6-pulse control mode. The filter on Section 3 is the same as option 3. While this configuration has excellent characteristics, the additional cost may not be warranted.
The first two options were reviewed at a meeting with the customer and it was decided to focus on Options 3 and 4. These are illustrated in Figure 6 and Figure 7, respectively. Option 3 is the simplest of the configurations evaluated and is the configuration recommended for the facility.
Frequency Response Characteristics
The frequency response is illustrated as a measure of the current amplification that can be expected as a function frequency. Figure 8 shows the current amplification as a function of frequency for both filter designs being considered. The frequency response at Section 1 and Section 2 are the same so only Section 1 is provided. Both filter options use the same design for Section 3 so only one frequency response curve is included for Section 3.
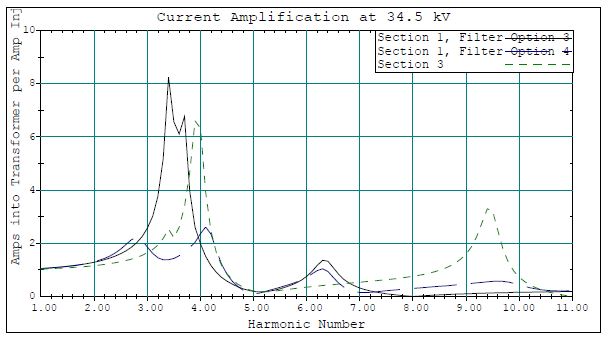
Comparing the response for options 3 and 4 shows that the additional branches and damping in option 4 provide significant reduction of the current magnification between the third and fourth harmonics. However, the performance actually at the third and fourth harmonics is very similar (actually better at the fourth harmonic for option 3). The interharmonics between the third and the fourth are much lower than the maximum values most of the time and the maximum magnification is less than 10 for the proposed design. The damping provided by the recommended design (option 3) is sufficient to prevent problems at the interharmonic frequencies.
Expected Harmonic Levels
Expected voltage and current harmonic distortion levels are evaluated for both filter options 3 and 4. Typical maximum levels are calculated using the worst case spectrums with the following harmonics included: 5, 7, 11, 13, 17, 19, 23, and 25. Short time maximums are calculated using all of the harmonic components. These levels should occur for only a very small percentage of the time since the non-characteristic harmonics are all considered at their worst case values simultaneously.
34.5kV Voltage Distortion Levels
Voltage distortion levels at the 500kV level resulting from the steel plant operation will be extremely low due to the low impedance of the 500kV system. It is more important to consider voltage distortion levels at the 34.5kV sections, where they can affect all of the steel plant loads. Table 4 gives the expected voltage distortion levels at the individual sections. The typical maximum values are well within the IEEE Std. 519 guidelines and the short time values should not cause any problems.
Table 4 – Expected Voltage Distortion levels at 34.5kV Sections
| Section | 34.5kV Bus VTHD | Option 3 | Option 4 |
|---|---|---|---|
| 1,2 | Typical Maximum | 3.5% | 3.4% |
| 1,2 | Short Time | 5.6% | 6.5% |
| 3 | 1.9% | 1.9% |
Harmonic Current Levels at the PCC
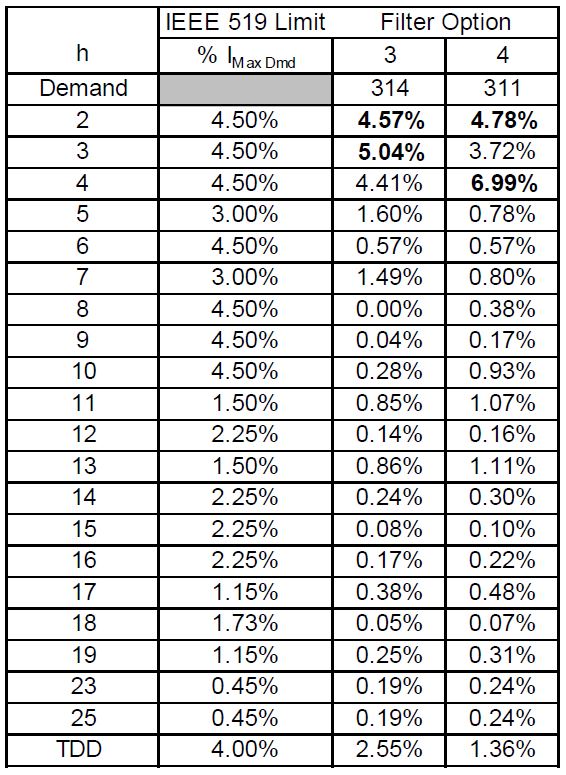
The harmonic current levels are evaluated at the 500kV PCC. These are based on the combination of harmonic currents from all three 34.5kV sections. The expected harmonic current levels are compared with the limits outlined in IEEE Std. 519. For the characteristic harmonics (5, 7, 11, 13, etc.), the actual limits are used. For non-characteristic harmonics, 150% of the limits are used for comparison because IEEE Std. 519 allows the specified levels to be exceeded by this amount for up to one hour per day.
The following table shows a compares the expected harmonic current levels at the PCC with the IEEE Std. 519 limits for both filter options 3 and 4. Note that all harmonic currents are expressed in percent of a calculated demand current (first row of the table). This estimated demand current includes the effect of the filter-provided reactive compensation.
Note that even the 150% limits at the second, third, and fourth harmonics could be exceeded (depending on the filter option). However, the furnace harmonic characteristics provided for these components are considered to be conservative and the summation effects assumed for these non-characteristic harmonics should be very rare (furnaces on sections 1 and 2 both generating high non-characteristic harmonics at the same instant). It is expected that the actual maximum harmonic current levels at these harmonic orders will be well within the 150% limits.
The following table shows a comparison of expected harmonic currents at the 500kV PCC with IEEE Std. 519 limits (harmonic levels expressed in % of average maximum demand current, including the effect of reactive power compensation).
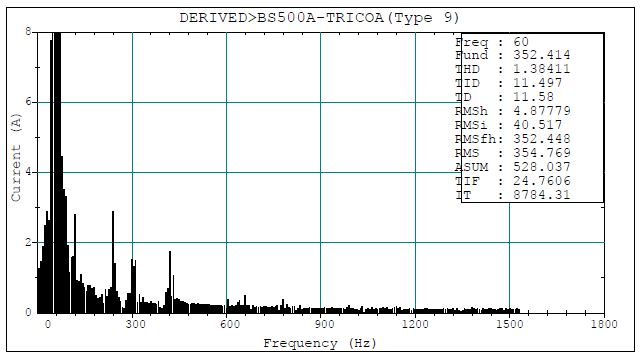
EMTP Simulated Harmonic Injection at 500kV PCC Bus
EMTP simulations are used to verify the results of the harmonic investigation. The simulation presented here is for a two-stage filter configuration similar to Option 3. With these filters connected, the current injected into the 500kV PCC bus is shown in Figure 9. The THD of this current is about 1.4%.
SUMMARY
Flicker
Simulations show that with the normal supply, without reactive power compensation, the maximum instantaneous flicker level at the 500kV bus is around 0.4% when two dc arc furnaces are in operation. The maximum instantaneous flicker is the maximum percentage value of the fluctuation voltage on the system line-to-ground peak voltage base, within a sampling time window of 2 seconds. In other words, this 0.4% means that all frequency components of the voltage flicker are smaller than 0.4% of system nominal peak voltage. Usually, this level of flicker does not cause problems. The flicker at the steel plant 34.5kV furnace supply buses is about 4%. However, only the furnace loads are connected on these buses and these loads can withstand relatively high voltage fluctuations. Based on these results, an SVC is not required to control flicker levels. Strong source conditions will result in even lower flicker levels.
Under weak source conditions and both furnaces operating simultaneously, the maximum instantaneous flicker level reached 0.6% at the 500kV PCC bus and reached 5% at the 34.5kV furnace supply buses inside the steel plant. The simulation shows that the frequency spectra of the instantaneous flicker range from 0.5 to 30 Hz, with a great concentration within the 2 to 10 Hz range. This level of flicker, especially with these frequency components in the most sensitive range, has the potential to cause problems. If the steel manufacturer plans to operate both furnaces simultaneously with this weak source condition, installation of an SVC is recommended.
If a 95 MVAr SVC (95 MVAr tuned filter bank + 100 MVAr TCR) is installed on each 34.5kV furnace supply bus in the steel mill, with the same weak source supply, the maximum instantaneous voltage levels at the 500kV PCC bus and at the 34.5kV buses can be reduced to 0.3% and 1.5% respectively.
Reactive Power Compensation and Harmonic Filtering
The reactive power compensation is sized with consideration of a required +0.95 to -0.95 average displacement power factor within a 30-consecutive minutes metering period. The total capacitive compensation needed at each 34.5kV furnace supply bus is determined based on the steel furnace melting cycle MW load profile. The rolling mill 34.5kV bus reactive power compensation requirement is estimated based on load conditions provided by the steel manufacturer and the rolling schedules supplied by Siemens. It is estimated that approximately 65 MVAr of compensation is needed at each 34.5kV furnace supply bus and 38 MVAr is needed on the rolling mill bus. The reactive compensation requirements are used as the starting point for sizing harmonic filters. It is assumed that the filters will be installed without an SVC.
A number of different filtering options were evaluated. The filter performance evaluation and energy duty requirements for damping resistors were mainly based on the supplied ac ladle furnace, dc arc furnace and rolling mill harmonic generation characteristics. A two-stage filter combining a 3rd order filter with non-power frequency damping resistor and a tuned 2nd order filter is the recommended configuration.
REFERENCES
IEEE Std. 519-1992, “IEEE Recommended Practices and Requirements for Harmonic Control in Electrical Power Systems.”
RELATED STANDARDS
IEEE Std. 519, “IEEE Recommended Practices and Requirements for Harmonic Control in Electrical Power Systems.”
GLOSSARY AND ACRONYMS
EMTP: Electromagnetic Transient Program
PCC: Point of Common Coupling
SVC: Static-Var Compensator
TACS: Transient Analysis of Control Systems
TCR: Thyristor Controlled Rectifier
THD: Total Harmonic Distortion
Voltage Flicker: Observable changes in light as a result of voltage fluctuations