Published by CEA Technologies Inc. (CEATI), POWER QUALITY Energy Efficiency Reference Guide, Chapter 3 – Power Quality Problems.
3.1 How Power Quality Problems Develop
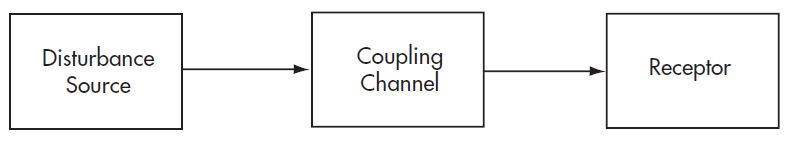
Three elements are needed to produce a problematic power line disturbance:
- A source
- A coupling channel
- A receptor
If a receptor that is adversely affected by a power line deviation is not present, no power quality problem is experienced.
The primary coupling methods are:
- Conductive coupling
A disturbance is conducted through the power lines into the equipment. - Coupling through common impedance
Occurs when currents from two different circuits flow through common impedance such as a common ground. The voltage drop across the impedance for each circuit is influenced by the other. - Inductive and Capacitive Coupling
Radiated electromagnetic fields (EMF) occur during the operation of arc welders, intermittent switching of contacts, lightning and/or by intentional radiation from broadcast antennas and radar transmitters. When the EMF couples through the air it does so either capacitively or inductively. If it leads to the improper operation of equipment it is known as Electromagnetic Interference (EMI) or Radio Frequency Interference (RFI). Unshielded power cables can act like receiving antennas.
Once a disturbance is coupled into a system as a voltage deviation it can be transported to a receptor in two basic ways:
1) A normal or transverse mode disturbance is an unwanted potential difference between two current carrying circuit conductors. In a single-phase circuit it occurs between the phase or “hot” conductor and the neutral conductor.
2) A common mode disturbance is an unwanted potential difference between all of the current-carrying conductors and the grounding conductor. Common mode disturbances include impulses and EMI/RFI noise with respect to ground.
The switch mode power supplies in computers and ancillary equipment can also be a source of power quality problems.
The severity of any power line disturbance depends on the relative change in magnitude of the voltage, the duration and the repetition rate of the disturbance, as well as the nature of the electrical load it is impacting.
3.2 Power Quality Disturbances

The IEEE has provided a comprehensive summary of the types and classes of disturbances that can affect electrical power. The classifications are based on length of time, magnitude of voltage disturbance and the frequency of occurrence. These classifications are shown in the previous table.
3.3 Load Sensitivity: Electrical Loads that are Affected by Poor Power Quality
3.3.1 Digital Electronics
Digital electronics, computers and other microprocessor based equipment may be more sensitive to power line disturbances than other electrical equipment depending on the quality of their power supply and how they are interconnected. The circuits in this equipment operate on direct current (DC) power. The source is an internal DC power supply which converts, or rectifies, the AC power supplied by the utility to the various DC voltage levels required. A computer power supply is a static converter of power. Variations in the AC power supply can therefore cause power quality anomalies in computers.
The Computer Business Equipment Manufacturers Association Curve (CBEMA, now called the ITIC Curve) published in the IEEE Orange Book is intended to illustrate a suggested computer susceptibility profile to line voltage variations. The ITIC curve is based on generalized assumptions, is not an industry standard and is not intended for system design purposes. No ITIC member company is known to have made any claim for product performance or disclaimer for non-performance for their products when operated within or outside the curve. The ITIC curve should not be mistakenly used as a utility power supply performance curve.

The susceptibility profile implies that computers can tolerate slow variations from -13% to + 5.8%, and greater amplitude disturbances can be tolerated as their durations become shorter. In fact, many computers can run indefinitely at 80% of their nominal supply voltage; however, such operation does lead to premature wear of the power supply.
While the operating characteristics of computer peripherals may at one time have been more dependent on the types of power supply designs and components used, generalizations that infer that computers are highly sensitive to small deviations in power quality are no longer true.
There is also no validity in the contention that, as the operating speed of a computer increases, so does its sensitivity to voltage variations. IT equipment sensitivity is due to the manner in which its power supply components interact with the supplied AC power.
3.3.2 Lighting
There are three major effects of voltage deviations on lighting:
- Reduced lifespan
- Change of intensity or output (voltage flicker)
- Short deviations leading to lighting shutdown and long turn-on times
For incandescent lights the product life varies inversely with applied voltage, and light output increases with applied voltage. In High Intensity Discharge (HID) lighting systems, product life varies inversely with number of starts, light output increases with applied voltage and restart may take considerable time. Fluorescent lighting systems are more forgiving of voltage deviations due to the nature of electronic ballasts. Ballasts may overheat with high applied voltage and these lights are usually less susceptible to flicker.
Information on lighting is available from the companion “lighting reference guide” that can be easily found through the various internet web search engines.
3.3.3 Motors
Voltages above the motor’s rated value, as well as voltage phase imbalance, can cause increased starting current and motor heating. Reduced voltages cause increased full-load temperatures and reduced starting torques.
3.4 Types and Sources of Power Quality Problems
3.4.1 Transients, Short Duration and Long Duration Variations
A general class of power quality variations (summarized in the following charts) are instantaneous variations. Th ese are subdivided as:
- Transients (Impulsive and Oscillatory; up to 50 ms)
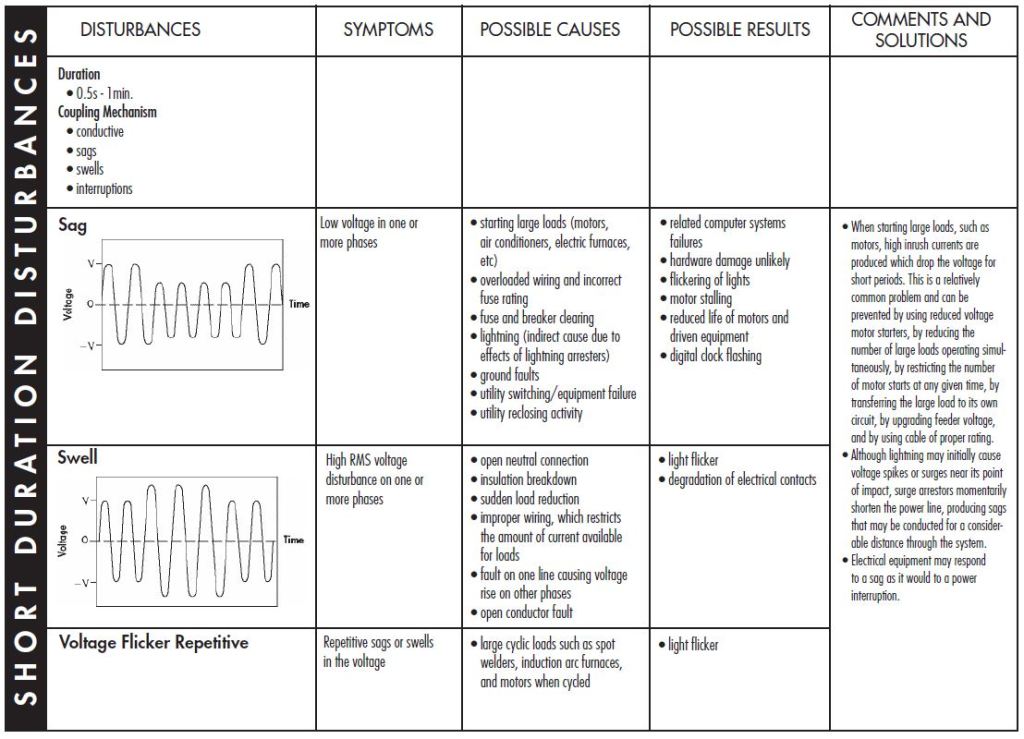
- Short-Duration (0.5 cycles to 1 minute)
- Long-Duration (>1 minute but not a steady state phenomenon)
Generally, instantaneous variations are unplanned, short-term effects that may originate on the utility line or from within a facility. Due to the nature and number of events that are covered by this class of power quality problem, a summary chart has been provided to highlight the key types of variation.
Power Line Disturbances Summary


3.4.2 Steady State Disturbances
3.4.2.1 Waveform Distortion and Harmonics
Harmonics are currents and voltages with frequencies that are whole-number multiples of the fundamental power line frequency (which is 60 Hz in North America). Harmonics distort the supplied 60 Hz voltage and current waveforms from their normal sinusoidal shapes.
Each harmonic is expressed in terms of its order. For example, the second, third, and fourth order harmonics have frequencies of 120 Hz, 180 Hz, and 240 Hz, respectively. As order, and therefore frequency, of the harmonics increases, the magnitude normally decreases. Therefore, lower order harmonics, usually the fifth and seventh, have the most effect on the power system. Due to the nature of power conversion techniques, odd numbered harmonics are usually the only frequencies of concern when dealing with harmonic problems. The presence of low levels of even harmonics in a system requires expert mitigation advice from a power quality professional.
The effect of a given harmonic on the power system can be seen by superimposing the harmonic on the fundamental waveform, to obtain a composite:
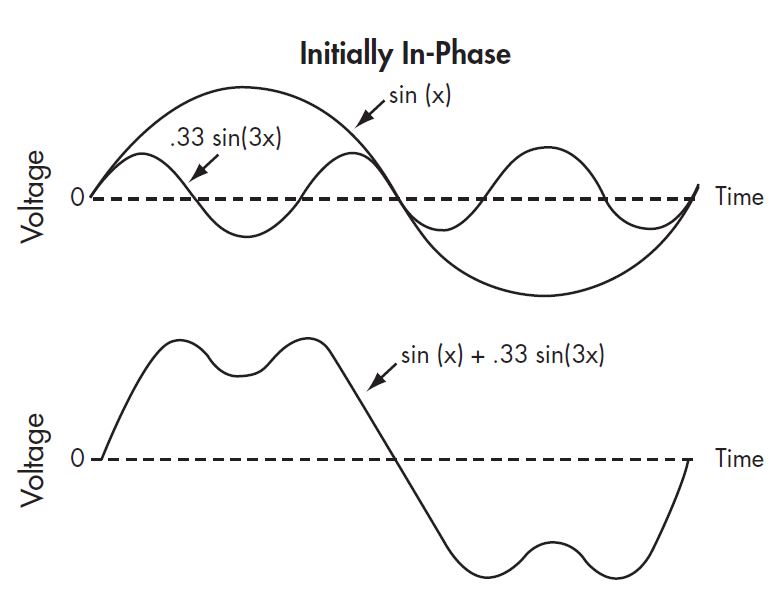
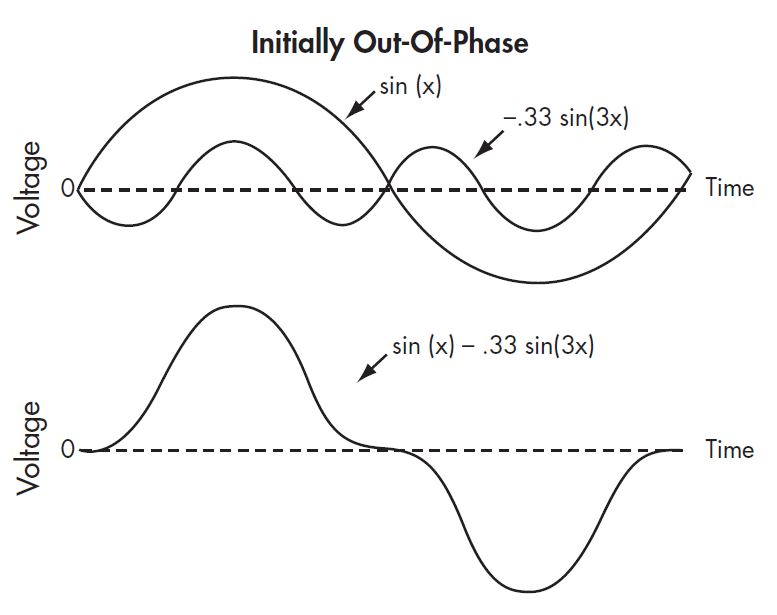
In this example, the two waveforms begin in-phase with each other, and produce a distorted waveform with a flattened top. The composite waveform can be changed by adding the same harmonic, initially out-of-phase with the fundamental, to obtain a peaked effect:
Harmonics can be differentiated from transients on the basis that transients are not periodic and are not steady state phenomena.
Production and Transmission
Most harmonics result from the operation of customer loads, at residential, commercial and industrial facilities.
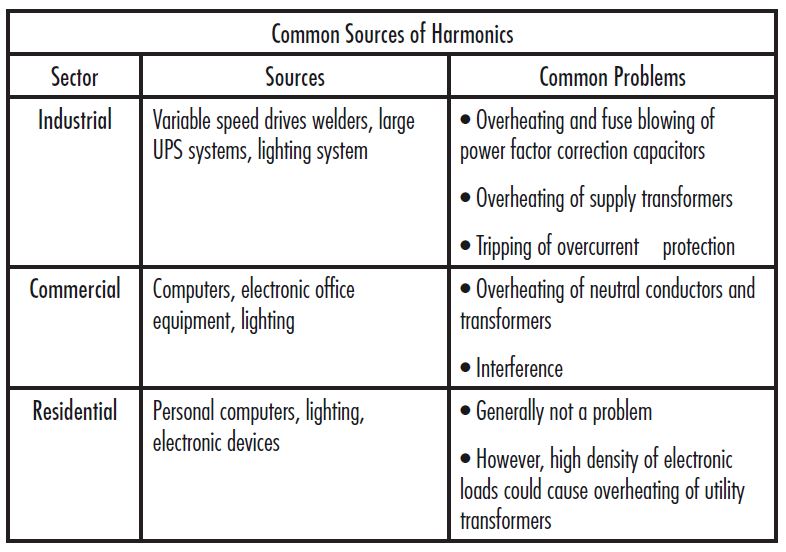
Harmonics are caused by any device or equipment which has nonlinear voltage-current characteristics. For example, they are produced in electrical systems by solid state power converters such as rectifiers that conduct the current in only a portion of each cycle. Silicon Controlled Rectifiers (SCRs) or thyristors are examples of this type of power conversion device.
The levels of harmonic current flowing across the system impedance (which varies with frequency) determine the harmonic voltage distortion levels.

(Reproduced with Permission of Basic Measuring Instruments, from “Handbook of Power Signatures”, A. McEachern,1988)
Aside from solid state power converters, loads may also produce harmonics if they have nonlinear characteristics, meaning that the impedance of the device changes with the applied voltage. Examples include saturated transformers and gaseous discharge lighting, such as fluorescent, mercury arc and high pressure sodium lights.
As harmonic currents flow through the electrical system, they may distort the voltage seen by other electrical equipment. Since the system impedances are usually low (except during resonance), the magnitudes of the voltage harmonics, and the extent of voltage distortion are usually lower than that for the corresponding current distortion. Harmonics represent a steady state problem, since they are present as long as the harmonic generating equipment is in operation.
Third harmonic currents are usually most apparent in the neutral line. Th ese occur due to the operation of single-phase nonlinear loads, such as power supplies for electronic equipment, computers and lighting equipment.
As lighting equipment has been a cause of many neutral problems adequate precaution must be taken to mitigate the harmonic emission of lighting equipment, in particular in case of re-lamping. Th ese harmonic currents occur due to the operation of single-phase nonlinear loads, such as power supplies for electronic equipment and computers. The third harmonic produced on each phase by these loads adds in the neutral. In some cases, the neutral current can be larger than the phase currents due to these third harmonics.
Effects of Harmonics
In many cases, harmonics will not have detrimental effects on equipment operation. If the harmonics are very severe, however, or if loads are highly sensitive, a number of problems may arise. The addition of power factor correction capacitors to harmonic producing loads can worsen the situation, if they have parallel resonance with the inductance of the power system. This results in amplifying the harmonic currents producing high harmonic voltages.
Harmonics may show up at distant points from their source, thus causing problems for neighbouring electrical end-users, as well as for the utility. In flowing through the utility supply source impedance, harmonic currents produce distortion in the utility feeder voltage.

In addition to electrical conduction, harmonics can be coupled inductively or capacitively, thus causing interference on analog telecommunication systems. For example, humming on telephones can be caused by induced harmonic distortion.
A power harmonic analysis can be used to compare distortion levels against limits of acceptable distortion. In addition, the operation of some solid state devices will produce a notched effect on the voltage waveform.
Harmonic Prevention and Reduction
It is very important when designing an electrical system, or retrofitting an existing one, to take as many precautions as necessary to minimize possible harmonic problems. This requires advanced planning and, potentially, additional capital. The complete electrical environment must be considered.
Filters
Harmonic filters can be used to reduce the amplitude of one or more harmonic currents or voltages. Filters may either be used to protect specific pieces of equipment, or to eliminate harmonics at the source. Since harmonic filters are relatively large, space requirements may have to be budgeted for. In some situations, improperly tuned filters may shift the resonant frequencies close to the characteristic harmonics of the source. The current of the high harmonics could excite the resonant circuit and produce excessive voltages and attract high oscillating harmonic currents from elsewhere in the system.
Capacitors
Harmonic amplification due to resonance associated with capacitor banks can be prevented by using converters with high pulse numbers, such as twelve pulse units, thereby reducing high-amplitude low order harmonics. A similar effect occurs with pulse width modulated converters.
| Method | Advantages | Disadvantages |
|---|---|---|
| Change the size of the capacitor bank to shift the resonant point away from the major harmonic | • relatively low incremental cost • ease of tuning | • vulnerable to power system changes |
| Place an inductor in series with the capacitor bank, and tune their series resonance below the major harmonics | • better ability to minimize harmonics • flexibility for changing load conditions | • series inductor increases the fundamental frequency voltage of the capacitor; therefore, a higher rated capacitor may be required |
Telephone Line Interference
Telephone interference can be reduced by the aforementioned prevention and reduction methods, by rerouting the telephone lines, improved shielding and balance of telephone cables, compatible grounding of telephone cables, or by reducing the harmonic levels on the power line. The degree of telephone interference can be expressed in terms of the Telephone Interference Factor (TIF).
Harmonic Study
Single calculation of resonant frequencies, transient network analysis, and digital simulation are among the techniques available today to perform harmonic studies. These tools could be used to accurately model the power network, the harmonic sources, and perform the harmonic analysis in the same manner as traditional load flow, short circuit and transient stability studies are conducted. Experienced consultants may be approached to conduct or assist in a harmonic study.
Equipment Specifications
Consider the effect on your power system when ordering harmonic producing equipment. Large projects may require a pre-installation harmonic study. Be prepared for filtering requirements if necessary to ensure compatibility with the power system. If a harmonic filter is required, a description of the power system should be considered in its design, including:
- Fault level at the service entrance
- Rating and impedance of transformers between the service entrance and the input to the power conditioning equipment
- Details of all capacitor banks in the facility.
Where a choice is available, consider using equipment with low harmonic emission characteristics. This should be explicitly stated in the manufacturer’s literature. Where Variable Speed Drives (VSDs) will be deployed, active front end designs generate lower harmonic levels and have a power factor close to unity. Variable Speed Drives are also the same equipment as Adjustable Speed Drives (ASDs); Variable Frequency Drives (VFDs); Adjustable Frequency Drives (AFDs), etc.
3.4.2.2 Flicker
Flicker is the impact a voltage fluctuation has on the luminous intensity of lamps and fluorescent tubes such that they are perceived to ‘flicker’ when viewed by the human eye. The level at which it becomes irritating is a function of both the magnitude of the voltage change and how often it occurs. A voltage flicker curve indicates the acceptable magnitude and frequency of voltage fluctuations on a distribution system. Flicker is caused by rapidly changing loads such as arc furnaces, electrical welders, and the starting and stopping of motors.

3.4.3 Distribution and Wiring Problems
Many power quality problems are due to improper or ineffective electrical distribution wiring and/or grounding within the customer’s site.
Grounding and distribution problems can result from the following:
- Improper application of grounding electrodes or mistakenly devising alternate “grounds” or grounding systems
- High impedances in the neutral current return path or fault current return path
- Excessive levels of current in the grounding system, due to wiring errors or equipment malfunction
It must be realized that although mitigating equipment when properly applied will resolve voltage quality problems, it will do nothing to resolve wiring or grounding problems. It is essential that the site distribution and grounding system be designed and installed properly and in accordance with the applicable Electrical Safety Code to ensure the safety of personnel and proper equipment operation. All electrical equipment used must be approved by the applicable authority, such as the CSA or UL, or inspected by the local authority in order to ensure that regulatory minimum safety standards have been achieved.
3.4.3.1 Fault Protection in Utility Distribution Systems
Faults resulting in overvoltages and over-currents may occur in the utility system, typically due to lightning, construction, accidents, high winds, icing, tree contact or animal intervention with wires.4 These faults are normally detected by over-current relays which initiate the operation of fault clearing by equipment.
Faults may be classified as temporary or permanent. Temporary faults may be caused by momentary contact with tree limbs, lightning flashover, and animal contact. Permanent faults are those which result in repairs, maintenance or equipment replacement before voltage can be restored. Protection and control equipment automatically disconnects the faulted portion of a system to minimize the number of customers affected.
The utility distribution system includes a number of devices such as circuit breakers, automatic circuit re-closers and fused cutouts which clear faults. Automatic re-closers and re-closing breakers restore power immediately after temporary faults. Fused cutouts that have operated must have their fuse replaced before power can be restored. Th ese protective devices can reduce the number of customers affected by a fault, reduce the duration of power interruptions resulting from temporary faults and assist in locating a fault, thereby decreasing the length of interruptions.
Automatic reclosers and reclosing breakers open a circuit on over-current to prevent any further current flow, and reclose it after a short period of time. If a fault does not disappear after one reclosure operation, additional opening/reclosing cycles can occur.
4 – A worst case event of tree contact with utility lines contributing to power problems took place on August 15, 2003. See “U.S.- Canada Power System Outage Task Force Final Report on the August 14, 2003 Blackout in the United States and Canada: Causes and Recommendations,” April 2004.
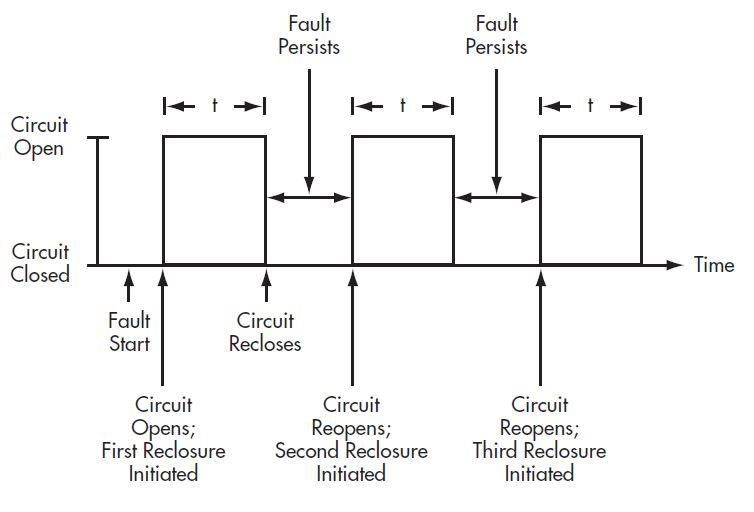
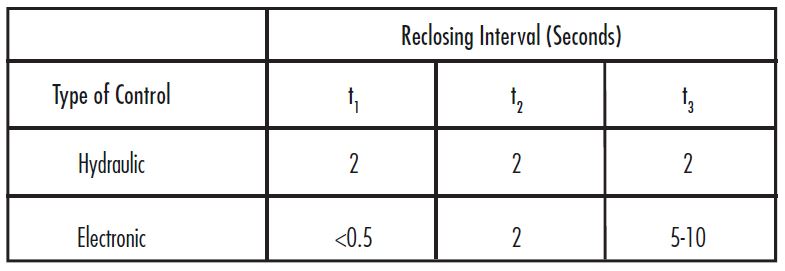
Normally a few seconds are required to clear a fault and energize the appropriate circuitry for a reclosure. The reclosing interval for a recloser is the open circuit time between an automatic opening and the succeeding automatic reclosure. In the above diagram, three intervals of duration ‘t’ are indicated. Some hydraulic reclosers may be able to provide instantaneous (0.5 seconds) or four second reclosing intervals. In addition to these reclosers, circuit breakers at substations, on the secondary or distribution side, are equipped with timers which allow a range of reclosing times to be selected. A commonly available range is 0.2 to 2 seconds.

(Reproduced with Permission of Basic Measuring Instruments, from “Handbook of Power Signatures”, A. McEachern,1988)
When a solid fault on a feeder is cleared, the voltage at the fault point declines to near zero instantaneously. However, the time constant in the detection circuitry results in the graph above. In this figure, small voltage rises indicate when reclosure was attempted unsuccessfully due to the persistence of the fault. If a fault persists, the recloser or breaker may lock open, or a fuse or sectionalizer will operate. An autoreclosure on one feeder that is faulted can produce a disturbance that travels on neighbouring feeders.
Customers frequently mistake the effects of a temporary (0.5s – 2s) interruption, such as the loss of time-keeping abilities of digital clocks, as evidence of a sustained power interruption. The fact that most High Intensity Discharge (HID) lighting, which is frequently used in industrial settings, can take 10-20 minutes to come back on after a fault has cleared is a further example of an apparent power supply problem that actually represents normal operation of the utility distribution network. The lengthy period of time before light is restored results from the characteristics of the lighting system. Although special HID systems are available that eliminate this problem, they do not represent the majority that are currently used.
3.4.4 Voltage Unbalance
A voltage unbalance is a condition in a three-phase system in which the measured r.m.s. values of the phase voltages or the phase angles between consecutive phases are not all equal. Voltage unbalance is a significant concern for users that have poorly distributed loads and impedance mismatches. An excessive level of voltage unbalance can have serious impacts on induction motors, leading to large inefficiencies causing over-heating and winding failure. Excessive losses in the motor may cause over-current protection systems to operate. Although induction motors are designed to accept a small level of unbalance they have to be derated if the voltage unbalance is 2% or higher. If an induction motor is oversized, then some protection is built into its operation although the motor does not operate at the best efficiency and power factor. Voltage unbalance may also have an impact on AC variable speed drive systems unless the DC output of the drive rectifier is well filtered.
There are two major sources of voltage unbalance:
1) the unbalance of load currents, which can be controlled by making sure load currents are balanced to within 10%
2) high impedance or open neutrals, which represent a major wiring fault that needs to be corrected by your electrician.
3.5 Relative Frequency of Occurrence
Frequently, the source of a disturbance originates within a customer’s plant or building. Some pre-existing data studies conducted in the United States indicate that as many as 90% of the origins of power quality problems originate within a customer’s or a neighbour’s facility. Many of these disturbances are due to the use of disturbance producing equipment, improper wiring and grounding, or the misapplication of mitigating equipment.
Some disturbances are caused by normal utility operations such as fault clearing, capacitor switching, and line switching. Although fewer in number than those generated within a facility, these events can cause great difficulty for customers that have equipment incompatible with these normal operations.

Source: Goldstein and Speranza, “The Quality of U.S. Commercial AC Power”; Proceedings of INTELEC Conference, 1982.
In 1991 and 2000, the Canadian Electrical Association undertook major studies of power quality in Canada – the National Power Quality Survey . Utilities from across the country performed monitoring at hundreds of sites. By comparing primary and secondary metered sites, the survey concluded that the average power quality provided by Canadian utilities is very good, and the average quality experienced by customers is good.
There are considerable differences in the state of power quality between sites or locations. This is because of the large number of factors involved, such as customer equipment and wiring practices, the effects of neighbouring customers, geography and weather conditions. Sites that have a small independent power source, or one utility transformer that supplies a number of users, such as strip malls and large buildings, are particularly prone to power quality problems. This is because both disturbing and sensitive loads share the same power supply. In addition, the individual loads can represent a very large proportion of the total amount of electricity supplied to the building, so that changes in voltage can be very significant when one of these loads is turned on or off . Frequently, customers unknowingly cause their own power quality problems by operating disturbance-producing process equipment in the same vicinity as electronic control devices.
From 1992 to 1995, the Electrical Power Research Institute (EPRI) collected data at 300 sites in the U.S. to assess utility power quality at the distribution level. A report* indicated that sites experienced an average of 9 voltage sag or interruption events per year. In addition, the data indicated that voltage THD (Total Harmonic Distortion) peaked during late afternoon and evening periods. For residential feeders this data is consistent with past experience, since this is where harmonic sources such as television sets are the predominant load on the system.

(Reproduced with Permission of EPRI, from * “Preliminary Results For Eighteen Months of Monitoring from the EPRI Distribution Power Quality Project”, D. Sabin, T. Grebe, A. Sundaram, 1994)
3.6 Related Topics
3.6.1 Electromagnetic Compatibility (EMC)
Electromagnetic compatibility is the term given to the measure and creation of electrical equipment that has both its susceptibility and transmission of electromagnetic noise reduced. The amount of reduction may be regulated by government rule or may be required to meet a certain operational requirement.
Areas of EMC that may overlap with power quality are:
- Extremely Low Frequency (ELF) magnetic field interference from power lines (solved by distance, field cancellation or shielding techniques)
- Radiated noise from electronic devices (usually solved with filtering or shielding)
- Radiated noise from power wires (solved with rerouting, shielding or filtering)
- Generation of harmonics by electrical loads (solved with filtering or re-design of the circuitry).
3.7 Three Power Quality Case Studies
3.7.1 Case Study: Meter, Monitor & Manage: A proactive response to power quality
The site in question is located in a multi-story office tower. The top four floors of the building have been designated as a “Business Recovery Center” (BRC) of a large financial institution. The function of the center is to provide backup, mirror and support services for the company’s business units. If a natural or operational disaster occurred, many of the business functions could be temporarily routed to this center. As a result, the BRC contains a significant concentration of computing resources that need to be available at any time. Workstation computing requirements are based on the actual working systems used by line personnel.
Disaster and recovery planning must allow for unforeseen events. Even the best disaster planner will realize that some events contain the seeds for others; some problems are cascading in nature and this requires adaptability on the part of the recovery center. At this location, electrical capacity has been designed to allow for increased loading from extra workstations and servers that may be brought to the site subsequent to the on-set of a recovery situation and added to the existing complement of business equipment. This could result in system over-loading at some points in the distribution network. In the modern context of loading, harmonic currents need special attention, thus a real time monitoring system was requested to provide harmonic and true loading of the center’s distribution grid.
As was pointed out to the BRC personnel and engineering staff , for only a small additional cost, a total power quality monitoring system could be installed that would provide building envelope information along with distribution point data within the envelope. The BRC utilizes a 600 V base building distribution system. BRC business equipment transformers are fed from one of two bus risers, while mechanical equipment is fed from a separate 600 V bus duct. In the event of a total loss of utility power these bus ducts can be fed by two diesel generators that have an extended operating capability.
The following requirements were developed both from BRC requests and expert input from the various stakeholders:
- Each dry-type transformer in the BRC was to be monitored in order to provide current and harmonic loading, current and voltage distortion, voltage unbalance, and neutral current readings in real time
- Power quality meters to provide transient, sag/swell and waveform deviation graphs and statistics
- Power quality thresholds must be programmable and accessible
- Energy monitoring must provide an aggregated table of consumption criteria with graphs on a monthly basis
- All meters must be fully networked utilizing open standards networking architectures and protocols
One of the key decisions that was made at this site on the basis of data viewed from the power quality component of the meters was with regard to Uninterruptible Power Supplies (UPS). Two issues arose that lead to cost savings. The first of these concerned the need for a large on-site UPS system which was advocated by some. While servers require the ride-through of the UPS, management determined that the impact of transfer switching, while annoying for some is acceptable and that most workstations did not need the protection of 0.5 – 2s of ride through afforded by the UPS. Data from monthly generator tests revealed however that transfer switch wave shape anomalies were impacting the servers, leading to some network anomalies. Th e UPSs in use at the site were of a hybrid type that allowed transient and switching noise to pass through the UPS. UPSs were also subjected to excessive battery wear. Based on waveform data captured during testing, a decision was made to switch to an on-line UPS design and to institute a networked UPS management system.
Within 8 months of operation, an increased voltage unbalance was noted on a non-K-rated dry-type transformer. Normally this would indicate a high impedance neutral to ground bond which, if left undetected, would lead to overheating and equipment failure. A check of the meter revealed however that the neutral to ground bond on the meter was loose. Upon tightening this connection the voltage unbalance indication was corrected on the operator display.
This site’s experience with the monitoring system has been beneficial in the following ways:
- Data is presented to management that allows new insight into equipment utilization
- Information is available at all times that can defi ne load factors for key processes
- Reporting is available that shows the size, shape and duration of building envelope power quality anomalies.
The money invested in the monitoring system has generated great returns in terms of the impact power quality data has had on equipment purchase and utilization since installation.
3.7.2 Case Study: High Demand Load in an Aircraft Assembly Facility
A pulsed laser system used by an aircraft manufacturer was used to number and identify wires on each and every plane manufactured. The unit was malfunctioning and would stop operating for short durations. The cost to the operation involved downtime of staff and equipment but, more importantly, inconsistent wire marking presented a massive safety liability.
The machine operated at 20 Hz supplied from a standard 120V, 60 Hz single phase branch circuit. The system relied on an effective transfer of peak power from the power supply to the laser. Anything less than the peak power during pulse operations resulted in reduced laser intensity with a consequent lack of quality in the process. Further investigation revealed that the quality of voltage at the site was distorted by 4.5%, and that the peaks of the voltage waveform were flattening out.
A second point of concern occurred when the laser unit was powered up. There was a large current inrush that led to a voltage notch and a drop in peak voltage. This is an impedance interaction: essentially the source is unable to provide the kind of current the load is asking for.
Moving beyond the start-up phase to a period when the laser was being “fired”, the voltage flat-topping was more obvious and the loss of peak voltage was chronic and severe. The peak power delivered to the laser was over 25% less than what was required. Product marking during this cycle was substandard.
Facility electricians were instructed to wire up a temporary source close to the laser load which had a lower impedance and higher capacity. Th is solution provided a healthier situation for the internal workings of the power supply, since capacitors reach full charge and more power was available for the laser.
Why was the capacity of the source increased? Nominally the unit operated on a 20 A breaker at 120 V giving us a rough capacity rating of 2400 VA. The system required large charging currents to power its laser, and therefore a source of 50 A at 120V, 6000 VA, was needed. It is not unusual to have to up-size source requirements considerably for loads of this type.
3.7.3 Case Study C: Motor Drive and Transformer Incompatibility in a Commercial Building
This case study looks at a commercial office building which utilizes two banks of AC motors with variable speed drives (VSDs) to control Heating, Ventilating and Air Conditioning (HVAC) functions. Each of the banks is serviced by its own 45 kVA transformer; the only loads on these transformers are the AC drives. The figure below shows a rather innocuous looking snapshot. Th e variable speed drives are rather like large switch mode power supplies which demand peak current after reaching peak voltage.
Power quality experience tells one that a concentration of electronic, single phase loads leads to a 3rd harmonic neutral current. The neutral current in this case is shown in the second figure and can be seen to be primarily composed of 180 Hz. current, peaking above 150 Amps.
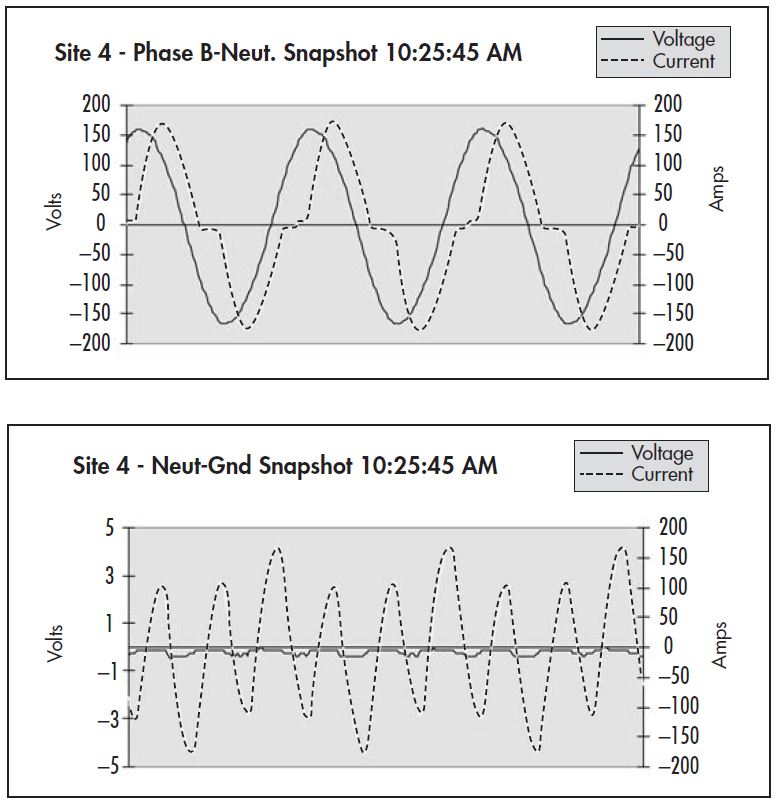
The major problem at this site was the intense heating in the service transformers. The problem became especially acute when tenants on the second floor complained about the smell of smoke from the transformers below them. The transformers were doing a fi ne job of providing isolation from the third harmonic; the problem was that they were not the right size for the electronic load. In order to provide a complete analysis of a transformer with regard to IEEE 519 harmonics guidelines, some calculations from the name-plate of the transformer needed to be performed.
What was discovered was that the load on the transformers was at least 5 kVA over their nominal de-rated capacity which accounted for the severe heating. Both transformers were operating just above their maximum designed temperatures which will lead to premature insulation failure. What is not shown here, and was required to obtain the results is the raw data analysis from the power quality instrument that obtained the RMS and peak currents.
The solution for this site was new K-rated transformers for each drive bank. Given the isolated nature of the drives and the low neutral to ground voltage, there was no need for phase shifting transformers or special neutral current limiting devices.
