Published by Electrotek Concepts, Inc., PQSoft Case Study: Wind Plant Voltage Flicker Data Analysis, Document ID: PQS1202, Date: January 26, 2012.
Abstract: This case study presents the results for a wind plant voltage flicker data analysis. The characteristics of voltage flicker are mainly determined by load characteristics and the short-circuit capacity. The wind plant substation supplied 65 wind turbine generators and the power quality monitor was connected to the 34.5 kV transformer secondary winding, which was considered the point of common coupling (PCC) for the voltage flicker harmonic analysis.
INTRODUCTION
A wind plant voltage flicker data analysis case study was completed for the 34.5 kV wind plant substation shown in Figure 1.

The wind plant substation was supplied from a 230 kV transmission line and included a 180 MVA, 230/34.5/13.8 kV step-down transformer with a number of 34.5 kV collector circuits supplying 65 2.3 MW (690 V secondary) wind turbine generators. The monitor was connected at the 34.5 kV transformer secondary, which was considered the point of common coupling (PCC) for the analysis.
The twenty-four day monitoring period was from November 16, 2009 through December 13, 2009. The power quality instrument used to complete the voltage flicker measurements was a Dranetz Power Xplorer PX5. The instrument samples voltage and current at 256 points-per-cycle, and follows the IEC 61000-4-15 method for characterizing voltage flicker data. The sampling rate also allows characterization of low to medium frequency oscillatory transients and harmonics through the 63rd harmonic. The voltage flicker measurement and statistical analysis was completed using the PQView® program.
MEASUREMENT DATA ANALYSIS
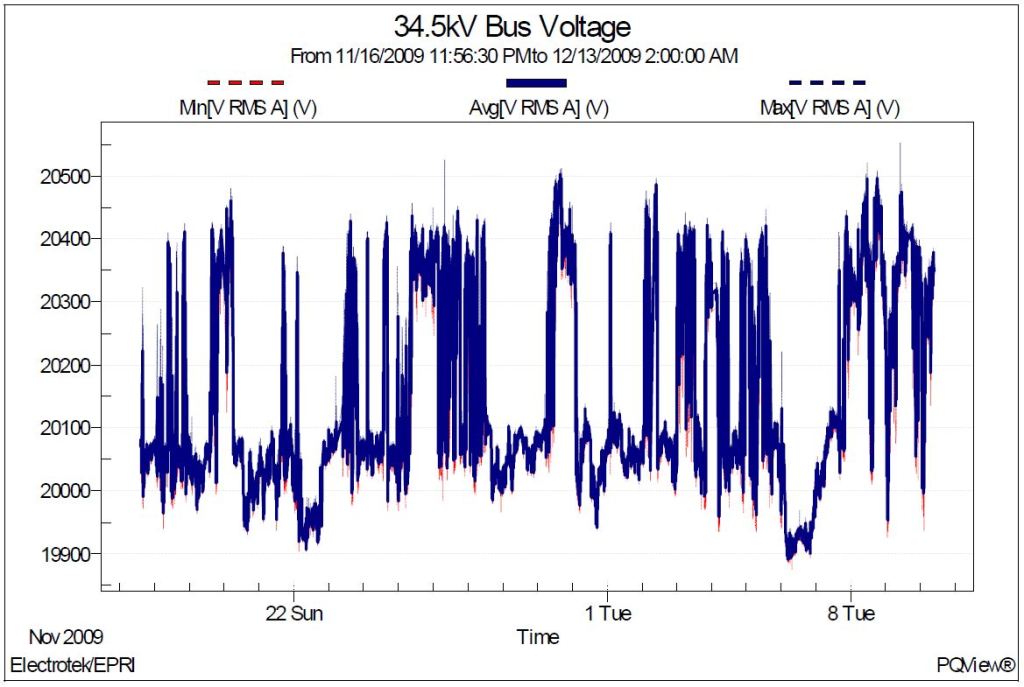
Error! Reference source not found. shows the measured 34.5 kV substation bus voltage during the twenty-four day monitoring period. Statistical analysis of the 61,901 individual steady-state voltage measurements yielded an average value of 20.141 kV, a maximum value of 20.502 kV, a CP95 value of 20.399 kV, and a CP99 value of 20.445 kV (1.03 per-unit).
IEEE Std. 1453 and IEC 61000-2-2 include specifications for measurement of voltage flicker and recommended compatibility levels. The standards recommend a compatibility level of Pst= 1.0 for power systems met by 99% of the measured values (CP99) with a minimum assessment period of one week. Table 1 shows the voltage flicker compatibility levels for Pst and Plt for low voltage and medium voltage systems.
Table 1 – Flicker Compatibility Levels for Medium Voltage Systems
| Flicker Quantity | Compatibility Levels (CP99) |
|---|---|
| Pst | 1.0 |
| Plt | 0.8 |
The envelope of the 60 Hz variations is defined as the flicker signal, Vf, and its rms magnitude is expressed as a percent of the fundamental. Voltage flicker appears as a modulation of the fundamental frequency (similar to amplitude modulation of an am radio signal). Therefore, it is easiest to define a magnitude for voltage flicker as the rms magnitude of the modulation signal. This can be obtained by demodulating the waveform to remove the fundamental frequency and then measuring the magnitude of the modulation components. A magnitude that is as low as 0.5% can sometimes result in perceptible light flicker if the frequencies are in the range of 1-5 Hz.
The voltage flicker severity is dependent on factors such as the turbine/transformer ratings, distances from substations, and the power system source strength. Flicker mitigation alternatives include increasing the source strength and power electronic-based mitigation equipment, such as static var compensators.
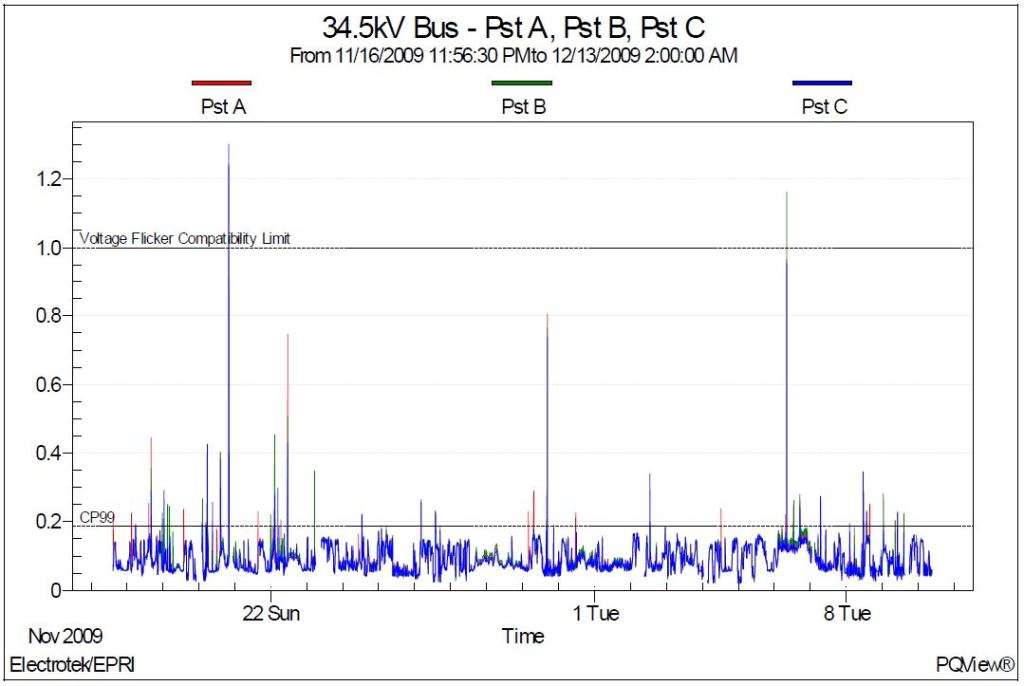
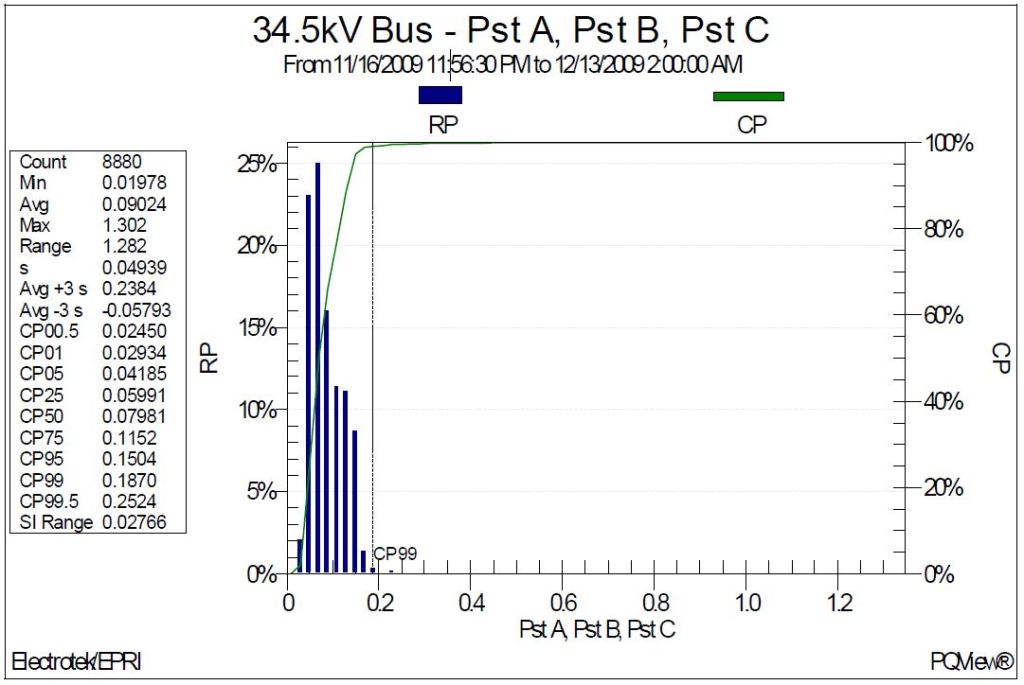
Figure 3 shows the measured short-term voltage flicker Pst trend at the 34.5 kV substation bus during the twenty-four day monitoring period. Figure 4 shows the corresponding voltage flicker histogram. Statistical analysis of the 8,880 individual flicker measurements yielded a CP50 value of 0.08, a CP95 value of 0.15, and a CP99 value of 0.19. The results show that the CP99 compatibility limit of 1.0 is not exceeded.
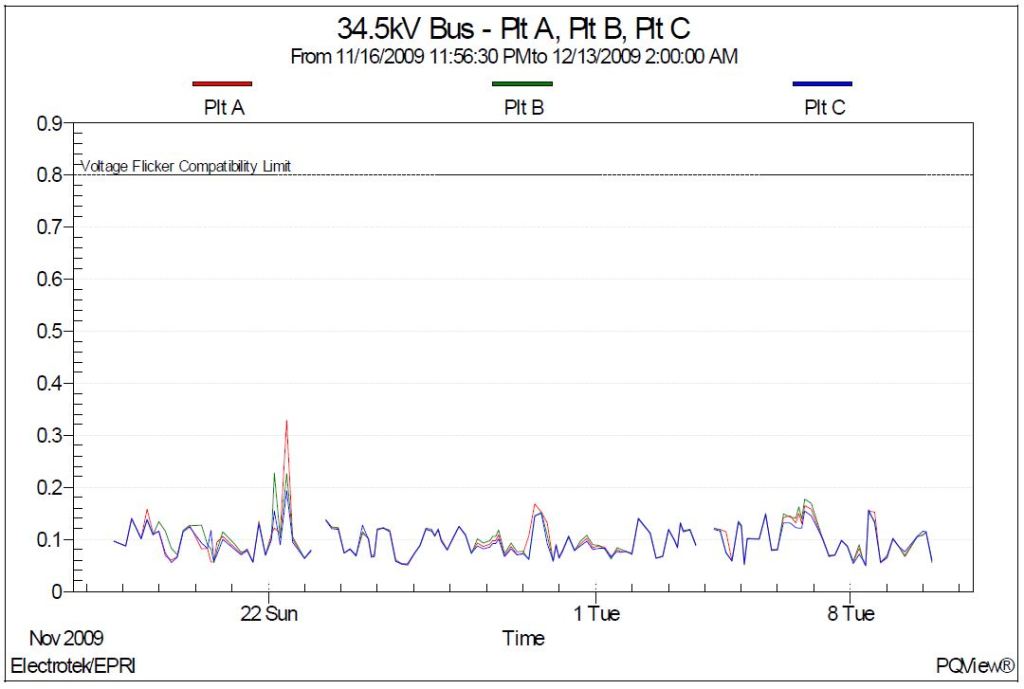
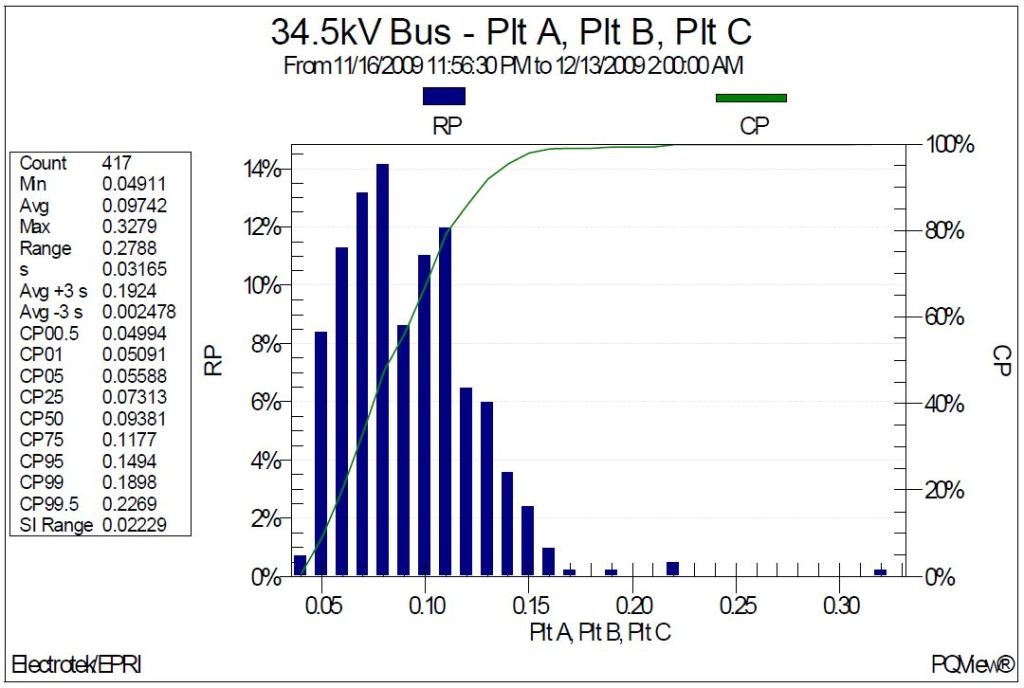
Figure 5 shows the measured long-term voltage flicker Plt trend at the 34.5 kV substation bus during the twenty-four day monitoring period. Figure 6 shows the corresponding voltage flicker histogram. Statistical analysis of the 417 individual flicker measurements yielded a CP50 value of 0.09, a CP95 value of 0.15, and a CP99 value of 0.19. The results show that the CP99 compatibility limit of 0.8 is not exceeded.
SUMMARY
This case study summarizes a wind plant voltage flicker data analysis. The characteristics of voltage flicker are mainly determined by load characteristics and the short-circuit capacity. The measurement results showed that both the short-term (Pst) and long-term (Plt) voltage flicker measured at the 34.5 kV wind plant substation bus did not exceed the respective CP99 compatibility limits.
REFERENCES
- IEEE Recommended Practice for Measurement and Limits of Voltage Fluctuations and Associated Light Flicker on AC Power Systems, IEEE Std. 1453-2004, IEEE, 2005, ISBN: 0- 7381-4482-7.
- IEEE Recommended Practice for Monitoring Electric Power Quality, IEEE Std. 1159-1995, IEEE, October 1995, ISBN: 1-55937-549-3.
- IEEE Recommended Practices and Requirements for Harmonic Control in Electrical Power
Systems, IEEE Std. 519-1992, IEEE, ISBN: 1-5593-7239-7.
RELATED STANDARDS
IEEE Std. 1453
GLOSSARY AND ACRONYMS
DFT: Discreet Fourier Transform
PCC: Point of Common Coupling
TDD: Total Demand Distortion
THD: Total Harmonic Distortion
