Published by Electrotek Concepts, Inc., PQSoft Case Study: Substation Voltage Flicker Data Analysis, Document ID: PQS1208, Date: June 4, 2012.
Abstract: This case study presents a substation arc furnace flicker measurement data evaluation. The characteristics of voltage flicker are mainly determined by load characteristics and the short-circuit capacity. The analysis included a helpful index for comparing voltage flicker measured at a source and at a remote substation. The measurement results showed that the three-phase voltage flicker Pst measured at the 138kV Steel Mill Substation and the three other substations exceeded the CP99 compatibility limit. Mitigation alternatives for excessive voltage flicker may include a synchronous compensator (STATCOM).
SUBSTATION VOLTAGE FLICKER DATA ANALYSIS CASE STUDY
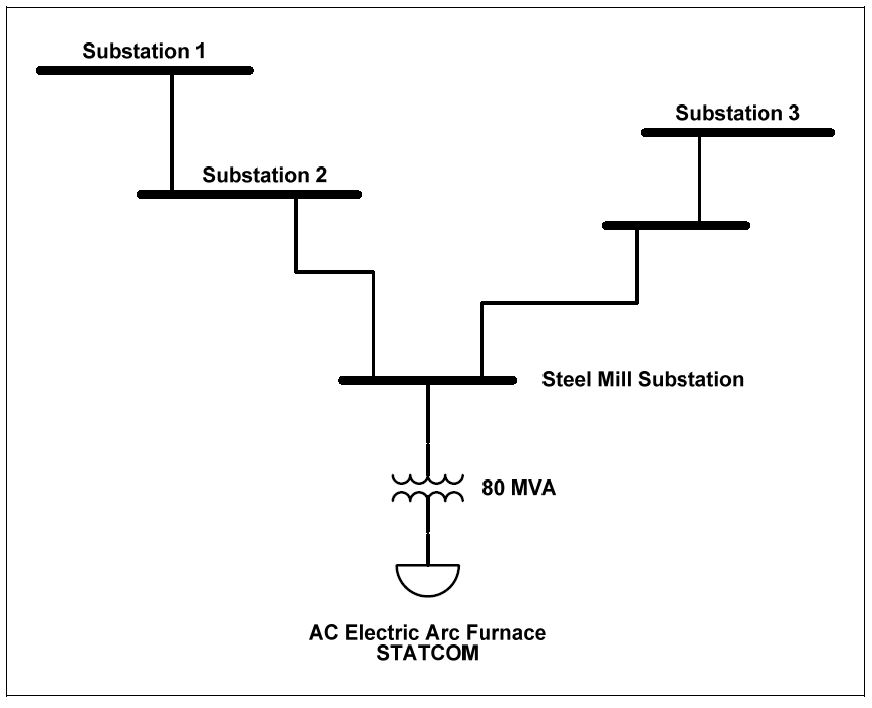
A substation arc furnace voltage flicker measurement data evaluation case study was completed for the system shown in Figure 1. Voltage flicker is a power quality problem caused by large time-varying loads like electric arc furnaces. The steel mill facility included an arc furnace and STATCOM supplied from a utility substation that included one 80 MVA, 138kV/13.8kV transformer. A static synchronous compensator (STATCOM) is a regulating device based on a power-electronic voltage-source converter that can act as either a source or sink of reactive power and therefore be used for mitigating voltage flicker.
The monitoring period was from May 21, 2010 thru November 4, 2010. The power quality instruments used to complete the voltage flicker and power quality measurements were the Dranetz Encore SeriesTM and Dranetz PowerXplorer PX5. The instruments sample voltage and current at 256 points-per-cycle, and follow the IEC 61000-4-15 method for characterizing voltage flicker data. The sampling rate also allows characterization of low to-medium frequency oscillatory transients and harmonics thru the 63rd. The measurement and statistical analysis was completed using the PQView® program.
Any load that has important time variations, especially in the reactive component, can cause voltage flicker. The term flicker is derived from the impact of varying voltage magnitudes on lighting intensity. Loads that can exhibit continuous, rapid variations in the load current magnitude can cause voltage variations referred to as flicker. Arc furnaces are the most common cause of voltage flicker on utility transmission and distribution systems. Other sources of voltage flicker include motor starting, welders, rolling mill drives, main winders, electric saws and hammers, cranes, and elevators. In general, loads with a high rate-of-change of power with respect to the short-circuit capacity at the point of connection are all possible sources of voltage flicker.
The envelope of the 60 Hz variations is defined as the flicker signal, Vf, and its rms magnitude is expressed as a percent of the fundamental. Voltage flicker appears as a modulation of the fundamental frequency (similar to amplitude modulation of an am radio signal). Therefore, it is easiest to define a magnitude for voltage flicker as the rms magnitude of the modulation signal. This can be obtained by demodulating the waveform to remove the fundamental frequency and then measuring the magnitude of the modulation components. A magnitude that is as low as 0.5% can sometimes result in perceptible light flicker if the frequencies are in the range of 1-5 Hz.
Voltage flicker is measured with respect to sensitivity of the human eye. IEC 61000-4-15 defines the methodology and specifications of instrumentation for measuring voltage flicker. This standard includes a method for describing the potential for visible light flicker through voltage measurements. The measurement method simulates the lamp/eye/brain transfer function and produces a fundamental metric called short-term flicker sensation (Pst). This value is normalized to 1.0 to represent the level of voltage fluctuations sufficient to cause noticeable flicker to 50 percent of a sample observing group. Another measure called long-term flicker sensation (Plt) is sometimes used for verifying compliance with compatibility levels established by standards bodies and used in utility power contracts. This value is a longer-term average of Pst samples.
Figure 2 shows a representative voltage and current waveform measured at the point of common coupling (PCC) 138kV transformer primary in the Steel Mill Substation. The fundamental frequency phase-to-ground voltage was 81.657kV (1.03 per-unit), the rms voltage was 81.703kV, and the total harmonic voltage distortion (VTHD) was 1.86%. The fundamental frequency current was 208.8 A, the rms current was 251.7 A, and the current distortion (ITHD) was 33.16%.

IEEE Std. 1453 and IEC 61000-2-2 include specifications for measurement of voltage flicker and recommended compatibility levels. The standards recommend a compatibility level of Pst=1.0 for power systems met by 99% of the measured values (CP99). Figure 3 shows the three-phase voltage flicker Pst histogram measured at the 138kV Steel Mill Substation for the entire monitoring period. Statistical analysis of the 66,486 individual steady-state measurements yielded a CP50 value of 0.97, a CP95 value of 1.90, and a CP99 value of 2.19. The results show that the CP99 compatibility limit of 1.0 is exceeded. Note that CP95 refers to the cumulative probability, 95th percentile of a value.

A useful index for comparing voltage flicker measured at a source and at a remote substation is the “flicker transfer factor”. The flicker transfer factor is the ratio of the voltage flicker measured at the remote bus against the flicker at the source:
TPstAB = PstB / PstA
A voltage flicker transfer factor of 1.0 would mean that the remote substation bus has the same amount of voltage flicker as produced by the source of the disturbance; while a flicker transfer factor of 0.5 means that the remote substation bus sees the flicker diminished by half the value. Typically, flicker transfer factors are less than 1.0 because network impedances and generation sources tend to stiffen the system, while distribution loads also tend to lessen the effect.
Figure 4 shows the three-phase voltage flicker Pst histograms measured at the 138kV Steel Mill Substation and at Substation #2. The results for the Steel Mill Substation included a CP50 of 0.75, a CP95 value of 1.69, and a CP99 value of 1.95. The results for Substation #2 included a CP50 of 0.56, a CP95 value of 1.26, and a CP99 value of 1.47.
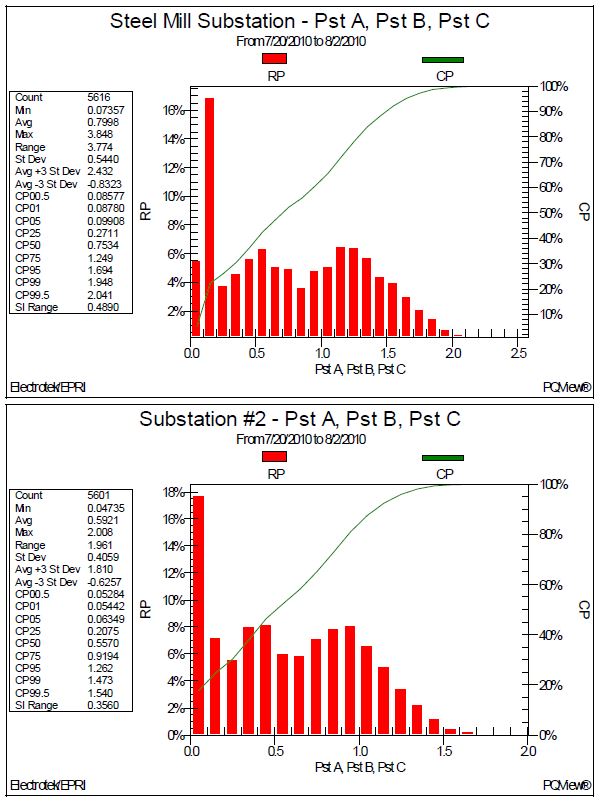
The voltage flicker transfer factors for Substation #2 include:
| Location | CP50 | CP95 | CP99 |
|---|---|---|---|
| Steel Mill Substation | 0.75 | 1.69 | 1.95 |
| Substation #2 | 0.56 | 1.26 | 1.47 |
| Flicker Transfer Factor | 0.75 | 0.75 | 0.75 |
The CP99 flicker transfer factor of 0.75 indicates that Substation #2 sees 75% of the flicker produced by the arc furnace at the Steel Mill Substation.
Figure 5 shows the three-phase voltage flicker Pst histograms measured at the 138kV Steel Mill Substation and at Substation #3. The results for the Steel Mill Substation included a CP50 of 1.12, a CP95 value of 2.01, and a CP99 value of 2.33. The results for Substation #3 included a CP50 of 0.85, a CP95 value of 1.53, and a CP99 value of 1.81.
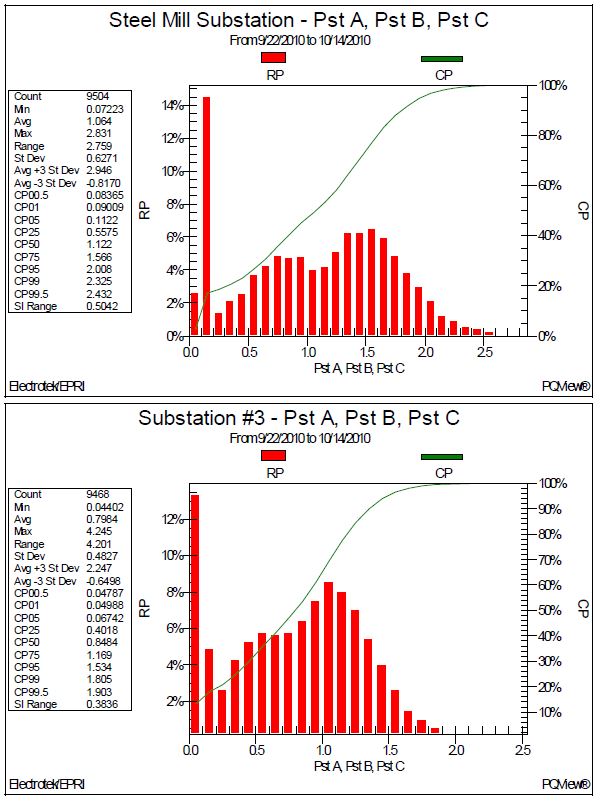
The voltage flicker transfer factors for Substation #3 include:
| Location | CP50 | CP95 | CP99 |
|---|---|---|---|
| Steel Mill Substation | 1.12 | 2.01 | 2.33 |
| Substation #3 | 0.85 | 1.53 | 1.81 |
| Flicker Transfer Factor | 0.76 | 0.76 | 0.78 |
The CP99 flicker transfer factor of 0.78 indicates that Substation #3 sees 78% of the flicker produced by the arc furnace at the Steel Mill Substation.
Figure 6 shows the three-phase voltage flicker Pst histograms measured at the 138kV Steel Mill Substation and at Substation #1. The results for the Steel Mill Substation included a CP50 of 1.06, a CP95 value of 2.03, and a CP99 value of 2.29. The results for Substation #1 included a CP50 of 0.56, a CP95 value of 1.05, and a CP99 value of 1.21.
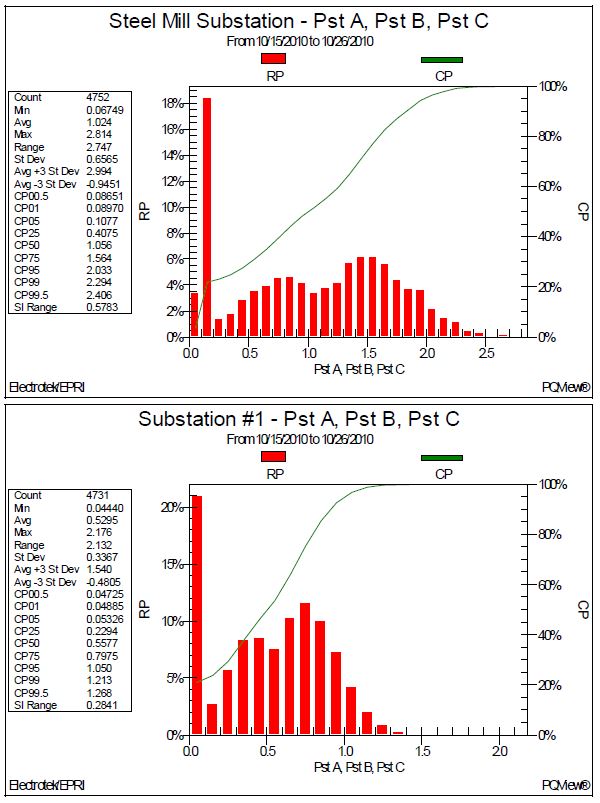
The voltage flicker transfer factors for Substation #1 include:
| Location | CP50 | CP95 | CP99 |
|---|---|---|---|
| Steel Mill Substation | 1.06 | 2.03 | 2.29 |
| Substation #1 | 0.56 | 1.05 | 1.21 |
| Flicker Transfer Factor | 0.53 | 0.52 | 0.53 |
The CP99 flicker transfer factor of 0.78 indicates that Substation #1 sees 53% of the flicker produced by the arc furnace at the Steel Mill Substation.
Table 1 shows a summary of relevant terms and indices related to power quality problems on utility and customer power systems.
Table 1 – Power Quality Related Equations and Indices

SUMMARY
This case study summarized a substation arc furnace flicker measurement data evaluation. The characteristics of voltage flicker are mainly determined by load characteristics and the short-circuit capacity.
The analysis included a helpful index for comparing voltage flicker measured at a source and at a remote substation. Flicker transfer factor is the ratio of the voltage flicker measured at the remote bus against the flicker at the source bus. Flicker transfer factors are often less than 1.0 because network impedances and generation sources tend to stiffen the system, while distribution loads also tend to lessen the effect.
The measurement results showed that the three-phase voltage flicker Pst measured at the 138kV Steel Mill Substation and the three other substations exceeded the CP99 compatibility limit. Mitigation alternatives for excessive voltage flicker may include a synchronous compensator (STATCOM).
REFERENCES
- IEEE Recommended Practice for Measurement and Limits of Voltage Fluctuations and Associated Light Flicker on AC Power Systems, IEEE Std. 1453-2004, IEEE, 2005, ISBN: 0-
7381-4482-7. - IEEE Recommended Practice for Monitoring Electric Power Quality, IEEE Std. 1159-1995, IEEE,
October 1995, ISBN: 1-55937-549-3. - IEEE Recommended Practices and Requirements for Harmonic Control in Electrical Power
Systems, IEEE Std. 519-1992, IEEE, ISBN: 1-5593-7239-7.
RELATED STANDARDS
IEEE Std. 1453
GLOSSARY AND ACRONYMS
DFT: Discreet Fourier Transform
PCC: Point of Common Coupling
TDD: Total Demand Distortion
THD: Total Harmonic Distortion
