Published by Mark Stephens, PE, Manager, Industrial Studies, Electric Power Research Institute (EPRI), 942 Corridor Park Blvd, Knoxville, Tennessee 37932, Phone 865.218.8022, Email: mstephens@epri.com


Published by Mark Stephens, PE, Manager, Industrial Studies, Electric Power Research Institute (EPRI), 942 Corridor Park Blvd, Knoxville, Tennessee 37932, Phone 865.218.8022, Email: mstephens@epri.com
Published by Electrotek Concepts, Inc., PQSoft Case Study: General Reference – Performing Power Quality Audits, Document ID: PQS0306, Date: February 4, 2003.
Abstract: Power quality investigations often require monitoring to identify the exact problem and then to verify the solutions that are implemented. Before embarking on extensive monitoring programs, it is important to develop an understanding of the customer facility, equipment being affected, wiring and grounding practices, and operating considerations. Often, power quality problems can be solved without extensive monitoring by asking the right questions when talking to the customer and performing an initial power quality audit.
This document provides a guide for performing a power quality audit.
Power quality investigations often require monitoring to identify the exact problem and then to verify the solutions that are implemented. Before embarking on extensive monitoring programs, it is important to develop an understanding of the customer facility, equipment being affected, wiring and grounding practices, and operating considerations. Often, power quality problems can be solved without extensive monitoring by asking the right questions when talking to the customer and performing an initial site survey. Audit procedures generally include the following steps:
Utilities are generally blamed for power quality problems. They are not necessarily responsible. There are four sources for most customer-encountered problems:
While most problems have nothing to do with the utility, customers often blame the utility for causing or contributing to the problem. In fact, eighty percent of all power quality related problems in commercial and industrial facilities are caused on the customer side of the meter. In residential facilities, eighty percent of the problems are due to weather and weather-related actions.
The first step is to understand how customers perceive power quality problems. Customers rarely see or understand these problems. They see symptoms of them and the resulting difficulties in their businesses and homes.
Some of the more common symptoms include:
− Equipment damage
− Blinking digital displays
− Data or information loss / software glitches
− Loss of instructional programming and controller timing
− An abnormal number of service calls on sensitive equipment
− Disk drive problems / computers re-booting
− Static shock
Performing a Site Survey
Data Collection Process
The initial site survey should be designed to obtain as much information as possible about the customer facility and the problems being experienced. Specific information that should be obtained at this stage includes:
Data Recording Process
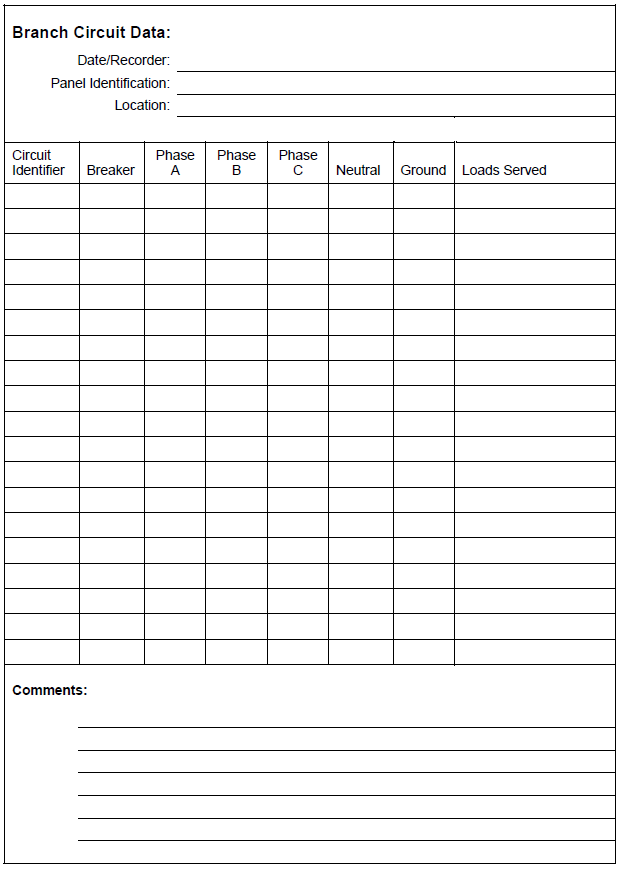
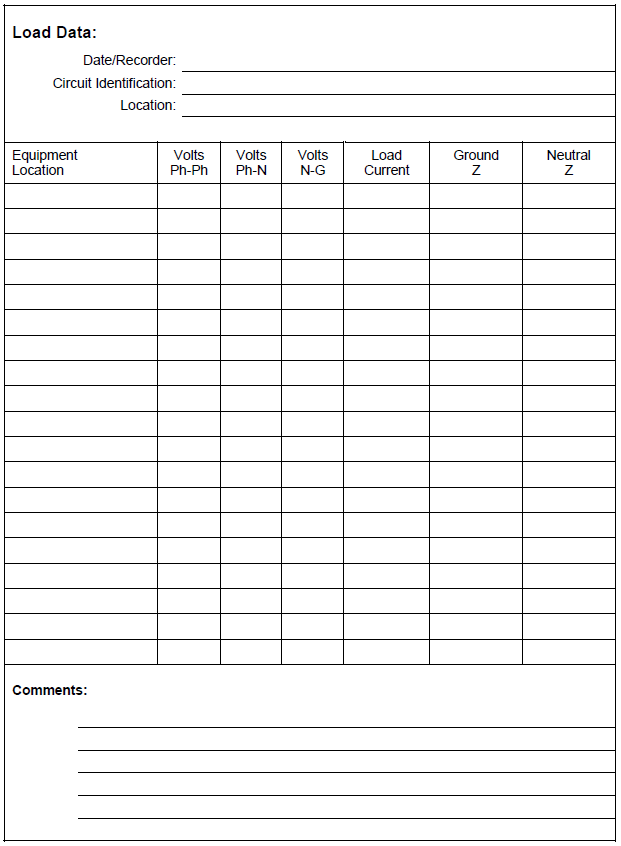
Once this basic data is obtained through discussions with the customer, a site survey should be performed to verify the oneline diagrams, electrical system data, wiring and grounding integrity, load levels, and basic power quality characteristics. Data forms that can be used for this initial verification of the power distribution system are provided in Figure 1 through Figure 4.

Performing Wiring and Grounding Inspections
Wiring and grounding problems are responsible for many power quality variations within customer facilities. Some electric utility engineers have estimated that 80% of all the power quality problems reported by customers are found to be due to their own wiring and grounding problems. While end-users may have a different opinion, it is commonplace for many power quality problems to be resolved by simply tightening a loose connection, removing an unnecessary ground connection, bonding ground conductors, or replacing a corroded conductor. Therefore, the first step in most power quality investigations is to evaluate the wiring and grounding practices of the facility.
Wiring and grounding problems are identified by physical inspections of wiring, connections etc.; infrared scans to identify heating that may be caused by overloaded conductors or bad connections; and measurements to characterize circuit loading and identify grounding problems. Steps for a wiring and grounding inspections include:
1. Check rms voltage levels.
2. Check for extra neutral-ground bonds. There should be only one neutral-to-ground bond per separately derived system. This is a common problem that causes load currents to flow in the building ground system, creating the potential for serious interference problems. This can be checked by measuring the current in the green wire grounds at the service entrance or at the source of the separately derived system. These currents should be very close to zero. If any current is flowing in the ground, the source of the current should be found and corrected.
3. Check for overloaded neutral conductors. In three-phase, four wire systems supplying single-phase electronic loads, the neutral currents can be as high as 173% of the rms phase current. This can cause overloading of the neutral conductor because the code does not require the neutral conductor to be rated for currents higher than the phase conductor. The neutral currents should be measured with a true rms meter and checked against the ampacity of the neutral conductors. This problem can be corrected by filtering the harmonics of the electronic loads, using a zig-zag transformer, reducing the load, or increasing the neutral conductor capacity.
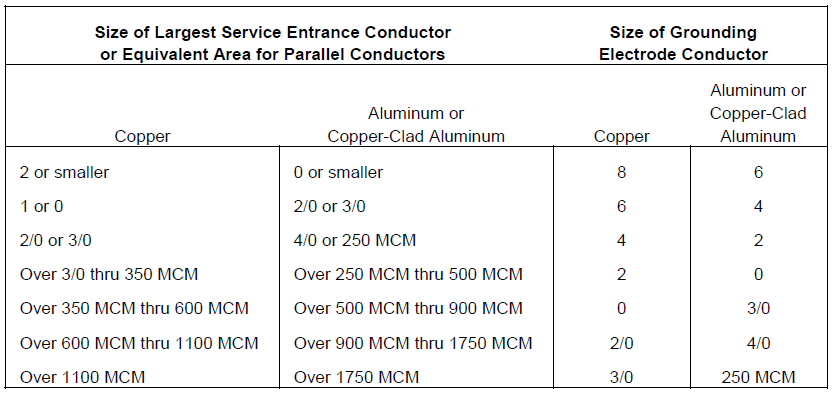
4. Checking grounding electrode system. The grounding electrode system consists of all the grounded elements of the building that are bonded together to form a grounding system. This can include ground rods, metal water pipe, building steel, concrete-encased electrodes, a ground ring, etc. All of these things should be bonded together to form the best equipotential reference for equipment in the building as possible. It is not advisable to have separate, isolated ground rods for individual equipment in the facility. If a separate ground rod is driven for equipment, it should be bonded with the overall building grounding electrode system. Guidelines for the grounding electrode conductor are provided in Table 1.
5. Check isolated ground receptacle wiring. Isolated ground receptacles are a good way to provide a separate, clean ground for sensitive equipment. These receptacles require a separate ground wire in addition to the safety ground. The isolated ground is insulated from the case of the receptacle and should go back to the ground of the separately derived system, where it is tied in to the building grounding electrode system.
Table 1 – Grounding Electrode Conductor for AC Systems
6. Check overall circuit layouts. Are sensitive equipment loads on separate circuits from disturbing loads? Loads that are switched or that have power electronic components can create transient disturbances that can impact the operation of some sensitive equipment. Loads like switched motors, copiers, laser printers, elevators, etc. should be on separate circuits from sensitive equipment. The separate circuits provide isolation for high frequency transients and a clean ground reference for the sensitive loads.
7. Check for use of separately derived systems. Separately derived systems permit the bonding of the ground and neutral. In circuits with significant neutral currents (e.g., single-phase electronic loads), a significant neutral-to-ground voltage will build up if there is a significant length between the loads and the supplying transformer. Using an isolation transformer close to the loads minimizes the neutral-to-ground voltage and provides isolation for transient overvoltages.
8. Check for ground loops. Ground loops are probably the most common cause of interference in network systems and the most common problems with multi-port devices in general. Multi-port devices have more than one type of interface. For instance, a television has a power input and a cable input; a computer has a power input and a phone input for the modem and a network input for a LAN. All of these ports require a ground reference. This multiple ground reference scenario creates the potential for serious ground loop problems. Ground loop problems are best avoided by making sure all equipment that is tied together through other ports (e.g., on a LAN) has the same ground reference. This means that all the equipment is part of the same separately derived system.
9. Apply protection to data/communication lines if there is ground loop potential. Sometimes, the ground loop problem described above cannot be avoided. In these cases, protection for data circuits, communication circuits, etc. should be applied. Optical coupling provides the most isolation and prevents the ground loops completely. Where ground loop problems exist, data lines should be protected with baluns, ferrite cores, or data line surge protectors.
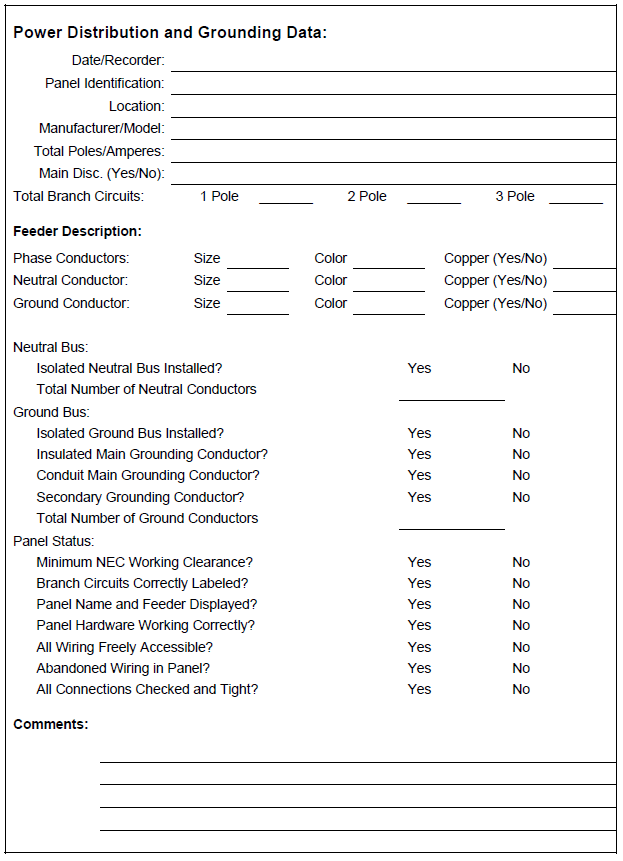
A data form that can be used for recording the power distribution and grounding information is provided in Figure 5.
Problems with Conductors and Connectors
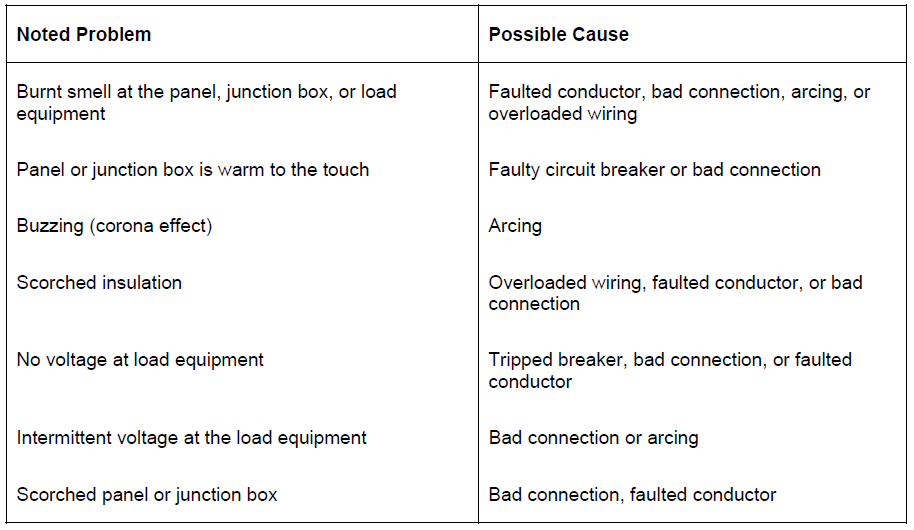
The first things to look for when inspecting the service entrance, panel boards, and equipment wiring during a site survey are problems with conductors or connections. A bad connection (faulty, loose, or resistive connection) will result in heating, possible arcing, and burning of insulation. Table 2 summarizes some of the wiring problems that can be uncovered during a site survey.
Table 2 – Problems with Conductors and Connectors
Missing Safety Ground
If the safety ground is missing, a fault in the equipment from the phase conductor to the enclosure results in line potential on the exposed surfaces of the equipment. No breakers will trip and a hazardous situation results.
Multiple Neutral to Ground Connections
Unless there is a separately derived system, the only neutral to ground bond should be at the service entrance. The neutral and ground should be kept separate at all panel boards and junction boxes. Double neutral-to-ground bonds result in parallel paths for the load return current where one of the paths becomes the ground circuit. This can cause misoperation of protective devices. In addition, during a fault condition, the fault current will split between the ground and the neutral that could prevent proper operation of protective devices (a serious safety concern). This is a direct violation of the NEC.
Ungrounded Equipment
Isolated grounds are sometimes used due to the perceived notion of obtaining a clean ground. Procedures which involve an illegal insulating bushing in the power source conduit and replacing the prescribed equipment grounding conductor with one to an Isolated Dedicated Computer Ground are dangerous, violate code, and are unlikely to solve noise problems.
Additional Ground Rods
Ground rods for a facility should be part of a grounding system, connected where all the building grounding electrodes are bonded together. Multiple ground rods can be bused together at the service entrance to reduce the overall ground resistance. Isolated grounds can be used for sensitive equipment, as described previously. However, these should not include isolated ground rods to establish a new ground reference for the equipment. The most important problem with additional ground rods is that they create additional paths for lightning stroke currents to flow. With the ground rod at the service entrance, any lightning stroke current reaching the facility goes to ground at the service entrance and the ground potential of the whole facility rises together. With additional ground rods, a portion of the lightning stroke current will flow on the building wiring to reach the additional ground rods. This creates a possible transient voltage problem for equipment and a possible overload problem for the conductors.
Ground Loops
Ground loops are one of the most important grounding problems in many commercial and industrial environments that include data processing and communication equipment. If two devices are grounded via different paths and a communication cable between the devices provides another ground connection between them, a ground loop results. Slightly different potentials in the two power system grounds can cause circulating currents in this ground loop. Because the communication signal levels can be quite low (e.g., five volts), very low magnitudes of circulating current can cause serious noise problems. The best solution to this problem is to use optical couplers in the communication lines, thereby eliminating the ground loop.
Insufficient Neutral Conductor
Switched-mode power supplies and fluorescent lighting with electronic ballasts are becoming increasingly prevalent in commercial facilities. The high harmonic currents produced by these loads can have a very important impact on the required neutral conductor rating for the supply circuits. The most important harmonic component in these load currents is the third. Third harmonic currents in a balanced system appear in the zero sequence circuit. This means that third harmonic currents from three single phase loads will add in the neutral, rather than cancel as is the case for the 60 Hz current. In typical commercial buildings with a diversity of switch-mode power supply loads, the neutral current is typically in the range 140%-170% of the fundamental frequency phase current magnitude. CBEMA has recognized this concern and has prepared a brief to alert the industry to problems caused by harmonics from computer power supplies.
Preparing an Audit Report
The result of a power quality audit is often a formal written report to a customer. The report may be as simple as a one or two page summary letter, or as detailed as a multi-section report. A standardized format for writing audit reports is recommended. In addition, since power quality is very technical and often confusing for a non-technical person, the report should be presented in easily understood language and organization. A suggested outline for an audit report includes the following sections:
− Executive Summary
• Description of the Problem
• Objectives of the Investigation
• Important Conclusions and Recommendations
− System Description
• Overview of the Utility Supply System
• Overview of the Customer System
− Engineering Analysis Summary
• Power Quality Concerns and Related Symptoms Evaluated in the Report
• Summary of Computer Simulation Results (if applicable)
• Mitigation Alternatives
• Economic Analysis (cost/benefit)
− Monitoring Results Summary
• Monitoring Period
• System Voltage Performance
• Summary Harmonic Distortion Levels
• Summary of Voltage Sags and Interruptions
• Summary of Transient Overvoltages
• Discussion of Major Events
− Appendices
• Glossary of Terms
The Executive Summary section should acknowledge that the utility or company is interested in helping the customer use electricity without problem, and is pleased to assist the customer in that pursuit. This section should provide a brief history of the events leading up to the audit work, and a description of all work that was done. Include any information that helps the reader understand the purpose and use of the audit report.
The Important Conclusions and Recommendations subsection may be organized by each conclusion drawn from the engineering and monitoring effort. In this structure, the rationale for each conclusion is stated and a specific recommendation is made. Each conclusion should state the cause of the problem, and its relative impact and importance to the customer. Recommendations should be described completely and leave no ambiguity about what actions should be undertaken.
The System Description section should include an overview of both the utility and customer systems, including all power system data collected during the investigation. Oneline or facility wiring diagrams should be included where appropriate.
The Engineering Analysis Summary section should present exactly what was found in each step of the diagnostic process. For example, what types of power quality problems or disturbances were found, and where. Include specific information to help the reader understand what was done. Photos and references to specific points on wiring diagrams or facility layouts are helpful. This section is also a good place to discuss the estimates made by facility personnel of the actual or estimated cost associated with each identified problem. This information is valuable in establishing a cost/benefit analysis for the customer and demonstrating the value of problem mitigation. This is particularly true if the solution to a specific problem involves the outlay of capital funds.
The Monitoring Results Summary section should include summary results for the relevant steady-state and disturbance quantities.
The Appendices section(s) should include supplemental information such as a glossary of terms and detailed monitoring results.
REFERENCES
IEEE Standard 1100. IEEE Recommended Practice for Powering and Grounding Sensitive Equipment (The Emerald Book).
IEEE Standard 1159. IEEE Recommended Practice on Monitoring Electric Power Quality.
ANSI/NFPA 70-1993, National Electrical Code.
Power Quality Considerations for Adjustable Speed Drives, EPRI Publication CU.3036.4.91, Electric Power Research Institute, 1991.
RELATED STANDARDS
IEEE Standard 1159
IEEE Standard 1346
IEEE Standard 1250
IEEE Standard 1036
IEEE Standard 519
GLOSSARY AND ACRONYMS
ASD: Adjustable-Speed Drive
CVT: Constant Voltage Transformer
GPR: Ground Potential Rise
IEEE: Institute of Electrical and Electronics Engineers
MOV: Metal Oxide Varistor
PWM: Pulse Width Modulation
TVSS: Transient Voltage Surge Suppressors
UPS: Uninterruptible Power Supply
Published by Pablo Diaz, P.Eng, Grounding Systems Technologies (GST), The Electricity Forum, Power Quality and Ground Articles.
Electrical Grounding is defined as the process of transferring the immediate discharge of electricity directly to the Earth with the help of a low-resistance wire.
Electrical grounding was invented as a safety system to help prevent people and equipment from accidentally coming in contact with electrical hazards. In a short circuit situation, electrical current wants to find the shortest distance to the earth that has the least possible resistance. A system has to be designed to allow a controlled path to ground that is safe. If not, then the uncontrolled path might be a person’s body or equipment. This can be injurious to people and damaging to equipment. Therefore, electrical grounding is accomplished by connecting the non-current-carrying part of electrical equipment or the neutral part of the supply system to the ground.
The National Electrical Code and Canadian Electrical Code provide rules to govern the proper installation of ground wires in an electrical system to avoid potentially dangerous electric shock accidents. The ground connection provides a path for electric current to flow, for instance from a circuit breaker or electrical box through an electrical connection to a cold water pipe that travels into the earth, and that assists the dissipation of energy into the actual ground.
These are the Top 10 Electrical Grounding questions people ask.
Plastic electrical boxes have their pluses and minuses. Because they are plastic, there is no need to attach a bonding conductor to it. Since it is made of a non-conductive material, switches and outlets cannot short out if they touch the side of the box. The only requirement is that the system is grounded.
When using plastic electrical boxes there is no need to attach a “Bonding Conductor”, because they are plastic, which means they are made with “No Conductive Materials.
You only need to bond those metallic boxes or “non-current carrying” metallic enclosures” which can carry electrical currents only during a “Ground Fault” or exposed to energized parts of the electrical system.
It is needed to attach a ground wire only to metallic boxes or boxes made of conductive plastics that conduct electrical current.
If the box is made from a material that does not conduct electricity, such as polyethylene plastic or glass, bonding or grounding is not necessary.
Improper grounding can create a lethal hazard. Correct grounding is essential for correct operation and safety of electrical equipment. Grounding can solve many problems, but it can also create new ones. One of the most common problems is called “ground loop”.
Generally, a ground loop connection is created when an electrical system is connected to ground at several points. When two or more pieces of equipment are connected to a common ground through different paths, a “ground loop occurs”. Currents flow through these multiple paths and develop voltages which can cause damage and noise in audio or video systems.
These problems occur because there is a conflict between safety and noise reduction.
To prevent ground loops, all signal grounds need to have a common point and when two grounding points can not be avoided, one side must isolate the signal and ground from the other.
An open ground is present when a three-prong receptacle does not have a “Bonding Conductor”.
These open grounds are common in houses built prior to the adoption of the 1962 electrical code. In these older homes the original wiring does not have the safety ground called the “bonding conductor”. In some instances, these houses have ungrounded outlets distinguished by their two-hole/slot rather than the tree holes slots.
The best fix available, rather than rewire the entire house is to utilize an ‘Ground Fault Circuit Interrupter” (GFCI), This device takes place of the standard outlet and replaces it with a special GFCI protected outlet. These are commonly used in the kitchen and bathrooms. They are known for their black and red buttons.
Ungrounded outlets increase the chance of: Electrical fire. Without the ground present, errors that occur with the outlet may cause arcing, sparking and electrical charge that can create fire
Grounding of electrical receptacles (which some laypeople refer to as outlets) is an important safety feature that has been required in new construction since 1962, as it minimizes the risk of electric shock and protects electrical equipment from damage.
An ungrounded outlet is it dangerous in that it dramatically increases personal and property risk and increase the chance of Electrical fire, health hazards (risk of shock) and property loss. It is important to note that it takes only 80 milliamps to cause death by electrocution.
Electrical ground or earth is the reference point in an electrical circuit from which voltages are measured.
A neutral wire is the common current carrying wire in a multiwire electrical circuit. It is generally the wire to which all current carrying conductors are voltage referenced.
It may or may not be grounded, depending on the circuit requirements.
It is not the same as the ground wire in an electrical circuit, because a ground wire does not normally carry any current except in abnormal circumstances such as a ground fault.
But in a network set up (two hot’s sharing a neutral) the neutral is common. Terminology can cause great confusion in electrical work, be sure exactly which way the terms are being used or you could be in trouble. It is essential to use the terminology of the CEC.
The term grounding is commonly used in the electrical industry to mean both “equipment grounding” and “system grounding”.
Equipment grounding means the connection of earth ground to non-current carrying conductive materials such as conduit, cable trays, junction boxes, enclosures and motor frames.
System grounding means the connection of earth ground to the neutral point of current carrying conductors such as the neutral point of a circuit, a transformer, rotating machinery, etc.
System grounding, or the intentional connection of a phase or neutral conductor to ground, is for the purpose of limiting the voltage to ground, facilitate the over-current device operation, stabilize the voltage-to-ground during normal operations and to drain leakage currents.
Electrical grounding is a direct connection to the earth.
Electrical grounding is important because it provides a reference voltage (called zero potential or ground potential) against which all other voltages in a system are established and measured. An effective electrical ground connection also minimizes the susceptibility of equipment to interference, reduces the risk of equipment damage due to lightning and eliminates electrostatic buildup that can damage system components.
When a point is connected to a good ground, that point tends to stay at a constant voltage, regardless of what happens elsewhere in the circuit or system. The earth, which forms the ultimate ground, has the ability to absorb or dissipate an unlimited amount of electrical charge.
An effective grounding system consists of three 6 to 8 foot grounding rods, ground rod clamps, and 20 KV insulated hook up wire.
The first grounding rod must be driven into the soil within 20 feet of the fence energizer. Additional grounding rods should be spaced 10 feet apart from the previous rod.
Using a ground rod clamp at each rod, connect the 20 KV insulated hook up wire to each rod in a linear fashion. Remember to strip the end of the wire so the metal is exposed when clamping it to the rod in order to establish a connection.
Once all three rods are connected one to another, the wire can be hooked up to the fence energizer. It must go to the ground terminal on the charger. Do not make the mistake of connecting it to the fence wire or fence terminal
Electrical motor windings are normally insulated from all mechanical parts of the motor. However, if the insulation system should fail, then the motor frame could become energized at line voltage. Any person contacting a grounded surface and the energized motor frame simultaneously could be severely injured or killed. Grounding the motor frame prevents this possibility.
The most common method is to use a grounding connector. This connector is placed into the motor’s frame. The other common method is to weld or braze a copper or steel ground pad to the motor frame. The ground should always bolt directly to the main part of the motor frame.
The NEC/Canadian Electrical Code gives for ensuring electrical continuity at Main Electrical panel or service equipment. It requires bonding of all metallic electrical components and a Neutral-to-Ground connection
It requires Bonding jumpers to bond metal parts to the service neutral conductor. This requires a main bonding jumper because the service neutral conductor provides the effective ground-fault current path to the power supply.
It will require threaded fittings, to terminate metal raceways to metal enclosures by threaded hubs on enclosures. If using thread less fittings it must terminate metal raceways to metal enclosures if made tight.
It can also use. bonding-type locknuts, bushings, wedges, or bushings with bonding jumpers.
When a metal raceway containing service conductors terminates to an enclosure without a ringed knockout, you can use a bonding-type locknut. Bonding one end of a service raceway to the service neutral provides the low-impedance fault current path to the source.
Source URL: https://www.electricityforum.com/iep/power-quality/what-is-electrical-grounding
Published by Keaton A. Wheeler, Anthony W. Bowers, Charlie H. Wong, Jonathan Y. Palmer and Xue Wang, Primary Engineering and Construction, Saskatoon/Kelowna, Canada
{kwheeler, abowers, cwong, jpalmer & swang}@primaryeng.com
Published in: 2018 IEEE Electrical Power and Energy Conference (EPEC)
Date of Conference: 10-11 Oct. 2018
DOI: 10.1109/EPEC.2018.8598358
Abstract— This paper conducts a load and power quality analysis on a 3-feeder distribution system with a cryptocurrency mining system connected. The study includes power factor and harmonic distortion analysis of actual measured 15-minute data over three days in conjunction with measurements of startup and steady state waveforms to determine the load profile of a cryptocurrency mine when connecting to the electrical grid. In addition, comments are made on the effect of the substation transformer. In the context of this paper, multiple load levels are investigated through a thorough analysis of a sample test system. The effects of the cyptocurrency mine are then quantified through comparison to standards indicated in IEEE Std. 519.
Index Terms — Cryptocurrency mine, power quality, load analysis.
Modern power systems are aiming to deliver economic and reliable power to various customers connecting to the grid. The load characteristics associated to these customers can affect utility networks through their interconnection. Power quality (PQ) is one of the most important indicators of safety and efficiency required to be considered when connecting independent facilities to the electrical grid. Most utility company has a specified guideline for interconnection systems, including factors such as total harmonic distortion (THD), individual harmonic currents and voltages and power factors [1]-[2]. In cases where the consumer’s load does not meet these criteria, mitigation factors are required to be employed to meet all the interconnection requirements. These interconnection requirements exist to prevent unnecessary burden on the utility grid and prevent detrimental operation on other energy users.
When connecting a customer-owned facility to the electrical grid, two key factors that are of interest to the utility are power demand and power quality. Power demand is of interest as loads absorb real and reactive power from the network which can result in changes in the existing operational behaviors of the grid when significant energy demands are present. A load analysis may be mandated by the utility when there is limited information available on a certain type of load. Based on the reactive power characteristic of the load, the utility may require power factor correction via methods such as capacitive power compensation to mitigate detrimental effects or reduce burden on the network [1]-[2].
The level of harmonics is another parameter which utilities will consider when a new load is being connected to the network. When new loads are nonlinear in nature they can affect the sinusoidal characteristics of existing current and voltage waveforms thereby introducing harmonics into the network, affecting the operation of electrical equipment [3]-[4]. Different utility companies tend to develop local standards for interconnecting customers. IEEE Std. 519 [3] has been employed by many utilities to quantify limits that are required to maintain power quality while also offering determination methods. Therefore, in this paper, IEEE Std. 519 is used to quantify the power quality of a system connecting with cryptocurrency mine.
Cryptocurrencies are defined as peer-to-peer digital exchange systems which then generate and distribute currency units [5]. Transactions are verified through a process known as “mining”. The concept of cyptocurrency mining can be explained as a process where digital currency is verified (confirms the transaction amount and that the seller originally owned the currency) and added to the blockchain (an electronic ledger) [6]. This verification process is completed using specialized computing devices to solve computationally difficult mathematical problems to be able to create a new block on the chain. The resulting creation of the block rewards the creator with newly created cryptocurrency units and transaction fees [6]. Due to the fast-growing market for cryptocurrencies [7], facilities dedicated to the mining process are beginning to be constructed and connected to the electrical grid. These facilities connect thousands of individual processing units together with the same purpose of creating blocks in the chain, resulting in significant energy demands on the electrical grid [8].
As evident in the literature, an understanding of load electrical characteristics in the context of energy demand and power quality is essential to dictating whether additional infrastructure requirements will need to be employed by the consumer. Through a literature survey, it is apparent that no power quality or loading analysis has been reported on cryptocurrency mines despite their growing prevalence in grid energy demands. As a result, in this paper a cryptocurrency mine is analyzed to determine loading profiles and power quality using measured data. Relevant parameters are calculated and compared to interconnection standards to offer insights into how these mines will affect the electrical grid.
A. System Under Study
The system utilized in the studies of this paper is depicted in Fig. 3. The system consists of three distribution feeders which are constructed with four switching cubicles while servicing three unit substation transformers per switching cubicle. This gives a total of 36 unit substation transformers (12 per feeder) and 12 switching cubicles (4 per feeder). All feeders and unit transformers are assumed to be the same. The point of common coupling (PCC) is the location where the transmission network connects to the substation transformer. The system nominal frequency is 60 Hz.

Cryptocurrency mining systems include many individual processing units which are connected to perform a transaction verification purpose. At the time of this analysis, the AntMiner s9 was one of the most efficient hardware’s available on the market for the purposes of cryptocurrency mining [9]. Each AntMiner can be considered to be the smallest power consuming component in one cryptocurrency mining system. A simplified mining system setup is shown in Fig. 2. The loading characteristics would be determined by the accumulated loading profile of individual AntMiner units. For cooling purposes, induction motor-based fans are installed in the facility housing the processing units. These fan loads can be assumed to be 5 MVA operating at a lagging power factor of 0.8. It is assumed that the building fan load is distributed evenly among all the unit substation transformers and all AntMiner units are distributed evenly amongst the three phases.
As shown in Fig. 1, The distribution feeder consists of 500 meters of Hawk 477 kcmil ACSR conductor. The short circuit current of the network is 2.95 kA at the PCC on the high voltage side of the transformer. Conductor data is available in the Appendix.
B. Power Quality and Load Analysis Test Setup
In order to determine how the processor loads behave electrically, an ION 7650 PQ meter capable of sampling at 1028 samples/cycle was connected to ten AntMiner s9 processing units with the default firmware framework employed. It should be noted that the ten AntMiner units were connected in parallel with one another.

The meter was wired in a single-phase mode as outlined in Fig. 3. It should be noted that the neutral current transformer (CT) was not used as the loads were connected directly across the phase conductors resulting in no neutral current flow [10].

Utilizing the test setup depicted in Figs. 2 and 3, 15-minute data and waveform captures were logged for three full days while the 10 processing units were running. This data included information on real time energy demand and power quality.
To determine the load demand and power factor associated with the processing units, three days of 15-minute data was accumulated while the PQ meter was connected to 10 AntMiner s9 units.
Due to the accumulated data, it can be observed that in 99.3% of all logged values, the power factor was between 0.994 and 0.995 leading. It should be noted that the power factor was observed at lower levels only during processing unit startup conditions. Due to this observation, when conducting the remaining studies in this paper, the processing units were assumed to have a power factor of 0.994 leading.
In the context of power demand; it can be determined that the peak power consumption was 1.595 kVA. As can be observed in the load distribution depicted in Fig. 4, the load demand of the processing units is between 1.55 and 1.6 kVA in 66.2% of logged values. In addition, it is above 1.5 kVA in 98.26% of all cases. Again, it should be noted that the power demand was lower only during startup conditions. As a result, the power consumption was taken as 1.6 kVA per processing unit for all studies conducted in this paper.
Occurrence of load demand intervals

A. Power Factor Analysis
To determine the expected power factor of the system under study, four different load levels were selected with a constant fan load to demonstrate how the power factor changes according to mine size. The load levels used in this case study can be expressed in Table I.
TABLE I: PROCESSING UNITS WITH CORRESPONDING LOAD LEVELS
| # of Units | Load Level (MVA)/unit sub | Power factor (lead) |
|---|---|---|
| 1302 | 2.187 | 0.994 |
| 1128 | 1.908 | 0.994 |
| 954 | 1.630 | 0.994 |
| 781 | 1.354 | 0.994 |
In addition to the processing units, a fan load of 0.139 MVA with a lagging power factor of 0.8 is assumed to be present on each unit substation transformer.
As depicted in Section II, there are a total of 36 unit substation transformers that are connected in parallel in the network. By superposition the total power demand of the system at the PCC can be observed as per Table II.
TABLE II: SYSTEM POWER DEMAND IN TERMS OF POWER FACTOR AND LOAD LEVEL
| Total Load Level (MVA) | Power factor | Leading/Lagging? |
|---|---|---|
| 78.72 | 0.9978 | leading |
| 68.71 | 0.9982 | leading |
| 58.70 | 0.9987 | leading |
| 48.75 | 0.9992 | leading |
Due to scaling of the power demand by the number of unit substation transformers in the network, the total power demand of the system can be determined.
TABLE III: SYSTEM POWER DEMAND
| System Load Demand (MVA) | System Power Demand (MW) | System Reactive Power Demand (MVAR) (capacitive) |
|---|---|---|
| 78.72 | 78.55 | 5.20 |
| 68.71 | 68.58 | 4.11 |
| 58.70 | 58.62 | 3.01 |
| 48.75 | 48.72 | 1.92 |
As can be observed in Table III, the load from the system is expected to be capacitive in nature. This result is significant in that it has the potential to prevent utilities from requiring private facilities owners from adding capacitive compensation to attain power factor correction. In addition, observation of Table II makes it apparent that the power factor only changes marginally when varying the load demand of the system while keeping fan loads constant. This highlights that the system’s power factor is influenced by the level of fan load utilized in the network. As a result, it can be inferred that most cryptocurrency mining facilities would not be required to employ methods such as capacitive compensation in the context of power factor correction.
An additional key consideration from this finding is there is an indication, due to its capacitive nature, that the processing unit loads may be prone to harmonic resonant conditions when combining the system impedance along with the overall network impedance. Although outside of the scope of this paper, this is significant as the processing units may be subject to significant resonant conditions and thus causing a detrimental effect on their operation [11]-[12].
To ascertain the power quality effects of the processing units utilized in the system under study, the voltage and current waveforms of ten of the AntMiner s9’s were captured in real time during startup and steady state. The startup waveform is depicted in Fig. 5.

As can be observed in Fig.5, the startup voltage appears to not suffer from distortion. This is to be expected as the processing units were connected directly to a power supply rather than through a distribution conductor which would be present in the actual system. The current waveform suffers from distortion, this can be attributed to the processing unit’s power supply circuitry. As per the measured data, this waveform begins to appear like the steady state within a 15-minute timeframe.
The steady state current and voltage waveforms of the ten AntMiner s9 units is depicted in Fig. 6

As can be seen in Fig. 6, it is apparent that there is a notching phenomenon occurring at the zero crossing of the current waveform. This indicates that the current waveform is subject to harmonic distortion. Taking the fast Fourier transform (FFT) of the current signal at a sampling frequency of 256 samples/cycle, the current harmonic spectrum demonstrated in Fig. 7 is obtained.
It should be noted that Fig. 7 only displays up to the 18th harmonic however harmonics were factored into calculations in this paper up to the order of 34. As can be observed in Fig. 7, the individual harmonics with the greatest magnitude are harmonics 3, 5, 7 and 9 with percentages of 7.97, 4.23, 2.17 and 1.78 percent respectively.
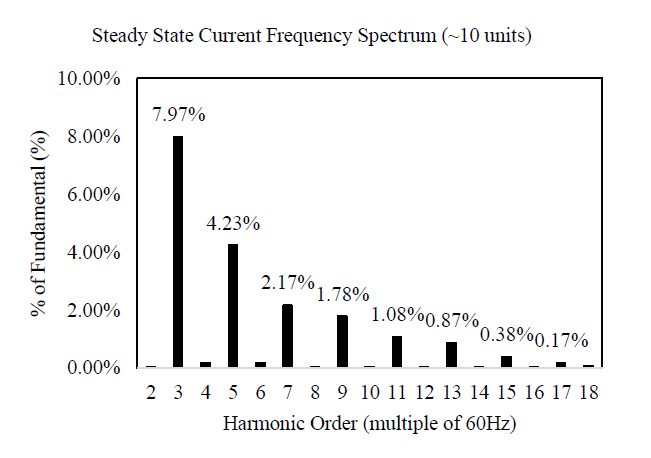
In order to determine the THD from the individual current harmonics, (1) is utilized as defined by references [3]-[4]:
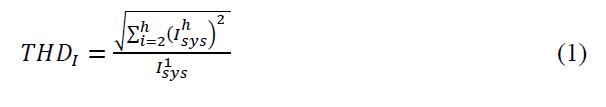
Where THDI is the total harmonic distortion of the current, Isys is the system nonlinear load current in Amps, Iload is the total system load current in Amps and h is the harmonic number.
As indicated in Fig. 1, the substation transformer in the system under study has a delta to wye grounded configuration. Therefore, the triplen harmonics will circulate in the delta winding of the transformer and thus will not be observed in the transmission system [4]. The THD levels experienced by the system for both the voltage and current will be lower than when there is no delta winding in the configuration. For the purposes of comparison, the THD levels are calculated to account for triplen filtering but are also given for the topology where triplen filtering does not occur.
Utilizing (1) in conjunction with the harmonic distortions indicated in Fig. 7 with the network loading profiles yields a current THD at the PCC with the following values:
TABLE IV: PCC CURRENT THD FOR THE NETWORK UNDER STUDY
| Load Level (MVA) | 78.72 | 68.71 | 58.70 | 48.75 |
| Current THD (%) (no triplen filtering) | 9.045 | 8.958 | 8.842 | 8.681 |
| Current THD (%) (with triplen filtering) | 4.732 | 4.686 | 4.626 | 4.541 |
With the knowledge of the current harmonic levels, it is possible to determine the voltage harmonics on the network from the given measured PQ data. Utilizing calculation methods outlined in reference [4] whereby the impedance is determined at each harmonic level and multiplied by the harmonic current, the individual voltage harmonics can be determined for the system under study:
TABLE V: PCC INDIVIDUAL VOLTAGE HARMONICS FOR THE NETWORK UNDER STUDY
| Harmonic Number | Load Level (MVA) | Load Level (MVA) | Load Level (MVA) | Load Level (MVA) |
|---|---|---|---|---|
| 78.72 | 68.71 | 58.70 | 48.75 | |
| 3 | 2.32% | 2.01% | 1.70% | 1.39% |
| 5 | 2.05% | 1.78% | 1.50% | 1.23% |
| 7 | 1.47% | 1.27% | 1.08% | 0.88% |
| 8 | 1.55% | 1.35% | 1.14% | 0.93% |
It should be noted that the Table V only indicates the worst of the voltage harmonics. With the knowledge of the voltage harmonic levels, the THD can be determined using (2).

Where THDV is the total harmonic distortion of the voltage and Vsys is the system voltage.
TABLE VI: PCC VOLTAGE THD FOR THE NETWORK UNDER STUDY
| Load Level (MVA) | 78.72 | 68.71 | 58.70 | 48.75 |
| Voltage THD (%) (no triplen filtering) | 4.623 | 4.005 | 3.387 | 2.773 |
| Voltage THD (%) (with triplen filtering) | 3.514 | 3.045 | 2.575 | 2.108 |
As can be observed in Tables IV and VI, the THD for both the voltage and current is significantly changed when accounting for triplen filtering due to the connection topology of the transformer.
A factor that would need to be considered during the design stage of any cryptocurrency mine project would be heating of the transformer due to harmonics. This heating factor can be assessed by using the k-factor which is defined in (3) [13]:

The k-factor weights the harmonic load currents in accordance with their effects on transformer heating. The k-factor will be 1.0 when a purely linear load is present. This is of interest when creating specifications for transformers, particularly in the context of substations. A k-factor rating greater than the calculated value from the load for a transformer will mitigate degradation associated to heating effects of harmonics. Utilizing the data obtained in conjunction with (3), the k-factor calculated for the network given in Fig. 1 can be determined as:
𝑘−𝑓𝑎𝑐𝑡𝑜𝑟 = 1.218
In the case of the system under study indicated in Fig. 1, the ratio of the three-phase short circuit current to the load current is indicated in Table VII:
TABLE VII: SHORT CIRCUIT OVER LOAD CURRENT RATIO OF THE SYSTEM
| Load Level (MVA) | 78.72 | 68.71 | 58.70 | 48.75 |
| Isc/Iload | 10.28 | 11.76 | 13.72 | 16.46 |
As can be observed in Table VII, the short circuit over load current ratio is below 20 in all calculated cases.
IEEE Std. 519 quantifies a measure for power quality when loads and generation sources connect to the utility network. As per Table VII, the short circuit over load ratio is always less than 20. As such the limits expressed in Table VIII can be applied from IEEE Std. 519.
It should be noted that the individual harmonic values in Table VIII should be 25 percent of the specified values for even harmonics. As per IEEE Std. 519 the voltage harmonics should be limited to a maximum of 1 percent for individual values and 1.5 percent for voltage THD for system voltages above 138 kV.
TABLE VIII: CURRENT HARMONIC LIMITS
| Harmonic Number | Less than 11 | 11 to 17 | 17 to 23 | 23 to 35 |
| Harmonic current limit (%) | 4.0 | 2.0 | 1.5 | 0.6 |
| Current THD limit (%) | 5.0 | 5.0 | 5.0 | 5.0 |
Observation of Fig. 7 and Table IV in conjunction with harmonic requirements outlined in IEEE Std. 519 [3] give the following observations:
Through observation of results in Tables V and VI in conjunction with voltage harmonic requirements outlined in IEEE Std. 519 [3] the following conclusions can be drawn for a system voltage of 161 kV:
Through observation of results obtained in conjunction with IEEE Std. 519, it is apparent that the connection topology of the transformer is required when determining the harmonic effects employed on the system. Furthermore, in the case of the AntMiner s9 processing units, when a delta winding is not present in the substation transformer the current harmonics propagating back into the grid can be as high as 9%, nearly double that of the recommended levels outlined in the literature. Furthermore, it can be observed that the harmonic voltages are consistently higher than the recommendations outlined in IEEE Std. 519.
A potential solution to the excessive harmonics would be to use a higher quality power supply that is capable of both power factor correction and harmonic filtering although this is outside the scope of investigations in this paper.
Although IEEE Std. 519 indicates its own recommended harmonic distortion maximums, individual utilities may indicate their own values. In this case it is imperative that these levels be understood and communicated to stakeholders when attempting to connect a cryptocurrency mine to the network.
This paper conducts a load and power quality analysis on a cryptocurrency mine using AntMiner s9 processing units. Startup and steady state voltage and current waveforms are presented in conjunction with three days of 15-minute data to determine the power demand and harmonic distortion of the processing units.
Results indicate that the expected power factor of the processing units is in excess of 0.99 with a leading characteristic. This is significant in that it may mean that consumers wishing to connect a cryptocurrency mine to the utility network may not be mandated to install power factor compensation equipment such as capacitor banks. This, from an economic system operation and feasibility standpoint, can be critical as it can dictate the expectations of the utility on the customer.
Furthermore, it can be observed that the cyptocurrency processing units have a nonlinear characteristic and are subject to harmonic distortion. Results indicate that triplen filtering via delta windings in the transformer should be present to prevent high THD levels when significant load demand is present. In addition, it can be observed that despite triplen filtering, individual harmonics may exceed standard prescribed maximums. As a result, it can be determined that a PQ and load analysis, such as the one conducted in this paper, should be mandated by utilities to ensure that power quality conditions are met by facility owners wishing to connect to the grid.
Considering the rapid rise of occurrence of cryptocurrency mines in utility grids, the results and considerations discussed in this paper offer significant practical value in the context of network expansion planning.
The authors would like to acknowledge and thank DMG Blockchain Solutions Inc. for providing the AntMiner s9 units and supporting the research conducted in these studies.
APPENDIX A
TABLE A.I
CONDUCTOR DATA
| Conductor | R1 (Ω/km) | L1 (Ω/km) |
| Hawk 477 kcmil ACSR | 0.120 | 0.267 |
[1] FortisBC, “Facility Connection Requirements,” September 2016. [Online]. Available: https://www.fortisbc.com/Electricity/ CustomerService/TransmissionServices/Documents/FortisBC_Facility_Connection_Requirements.pdf. [Accessed February 2018].
[2] SaskPower, “Electric Service Requirements,” November 2017. [Online]. Available: http://www.saskpower.com/wp-content/uploads/Guide-ElectricalInspections-ServiceRequirements.pdf. [Accessed: February 2018].
[3] IEEE Recommended Practice and Requirements for Harmonic Control in Electric Power Systems, IEEE Std. 519, 2014.
[4] M.A. Masoum and E.F. Fuchs, Power Quality in Power Systems and Electrical Machines, 2nd ed., London: Elsevier Inc., 2015.
[5] U. Mukhopadhyay, A. Skjellum, O. Hambolu, J. Oakley, L. Yu and R. Brooks, “A Brief Survey of Cryptocurrency Systems,” in IEEE Conference on Privacy, Security and Trust, pp. 745-752, Auckland, 2017.
[6] I. Eyal, “The Miner’s Dilemma,” in IEEE Symposium on Security and Privacy, San Jose, 2015.
[7] R.C. Phillips and D. Gorse, ” Predicting Cryptocurrency Price Bubbles Using Social Media Data and Epidemic Modelling,” in IEEE Symposium on Computational Intelligence, Honolulu, 2017.
[8] Digiconomist, Bitcoin Energy Consumption Index. 2018, [Online]. Available: https://digiconomist.net/bitcoin-energy-consumption. [Accessed: March 2018].
[9] N. Drake. (2018, January). “Best ASIC devices for Bitcoin mining in 2018,” TechRadar. [Online]. Available: https://www.techradar.com/ news/best-asic-devices-for-bitcoin-mining-in-2018. [Accessed: March 2018].
[10] Schneider Electric, “PowerLogic ION7550/ION7650 Energy and power quality meter User Guide,” 2009. [Online]. Available: http://www2.schneider-electric.com/resources/sites/ SCHNEIDER_ELECTRIC/content/live/FAQS/31000/FA31689/es_ES/ION7650%20Third%20Party%20protocols%20(70002-0248-06).pdf. [Accessed: January 2018].
[11] S.S. Rangarajan, E.R. Collins and J.C. Fox, “Harmonic Resonance Repercussions of PV and Associated Distributed Generators on Distribution Systems,” in IEEE North American Power Symposium, Morgantown, 2017.
[12] N.D. Rao, S.I. Sporea and A.Sawma, “Analysis of Resonance Problems and Harmonic Filter Design in Power Factor Correction Capacitor Applications,” in IEEE Canadian Conference on Electrical and Computer Engineering, Waterloo, 1998.
[13] IEEE Recommended Practice for Establishing Liquid-Filled and Dry-Type Power and Distribution Transformer Capability When Supplying Nonsinusoidal Load Currents, IEEE Std. C57.110, 2008.
Published by Electrotek Concepts, Inc., PQSoft Case Study: General Reference – Power Quality Assessment Procedure, Document ID: PQS0608, Date: July 1, 2006.
Abstract: Power quality is a frequently used term that means different things to different people. Common power quality problems include all of the issues that arise from the incompatibility between a utility’s power and the customer’s energy-using equipment that result in impaired operation. These include transients, sags and swells, harmonics, and short- and long-term voltage variations and outages. Also included under this broad area are issues of power reliability.
This case describes a general procedure for performing on-site case studies of power quality concerns.
This case describes a general procedure for performing on-site case studies of power quality concerns. The power quality assessment procedure is based on the variety of different power quality concerns that can exist and focuses on a combination of monitoring and analysis to characterize these concerns. Once the power quality concerns are characterized, the analysis procedures developed can be used to evaluate possible solutions to the power quality problems. These solutions must then be evaluated from both a technical and an economic perspective. There are a number of important areas that must be addressed in the power quality assessment procedure. These include:
The procedure presented here, along with the information included in the previous sections, provides the framework for performing case studies in a variety of customer categories. It is worthwhile to group customers in categories that involve the application of similar equipment and have similar electrical system designs. With this in mind, the following list of customer categories is provided as an example of possible customer segments:
Besides classifying the case studies by the type of customer involved, it is also possible to categorize the studies by the type of sensitive equipment involved or the specific type of power quality variation of concern. The results of multiple case studies can be combined to develop descriptions of general power quality concerns for various classes of customer equipment. Some of the most important equipment categories to consider include:
The power quality assessment procedure provides a general framework that contains all the possible elements that may be needed in a power quality case study. Each case study will have unique requirements, depending on the type of customer, equipment sensitivity, and other factors. These unique requirements will influence the level of effort needed for each step or may even permit bypassing a particular step of the overall procedure. The following sections summarize the general steps involved in the procedure.
Identify Power Quality Concerns
The specific power quality concerns that need to be evaluated will be different from customer to customer. A review of the types of equipment used by the customer, process requirements, and economic impacts of problems will lead to a list of concerns that need to be studied. The concerns can include possible problems with both the utility distribution system and the customer facilities. Possible power quality problem categories to be evaluated include the following:
Identification of the particular concerns involved for an installation provides a focus for the study. Development of a model for analysis of the problem is dependent on the frequency range of the power quality variations that need to be studied. The model can be for computer simulations, hand calculations, or application of simple rules. Analysis of voltage sags often requires modeling all the way up to the utility transmission system. Analysis of high frequency transients might only require a model for a local part of the customer facility.
Monitoring requirements are also based on the particular concern involved. If harmonic distortion is a concern, monitoring of steady state conditions with a harmonic analyzer is required. Analysis of disturbances requires a disturbance monitor. The duration of monitoring depends on how often the problems occur. Some problems with voltage sags or momentary interruptions might only occur a few times per year due to faults on the transmission system while problems caused by capacitor switching might occur every day. Other voltage variations of interest probably fall somewhere between these extremes.
Collect Data/Develop Initial Models
A representation of the customer system and important parts of the utility system should be developed for preliminary analysis. This model can be used for preliminary simulations or analysis to predict power quality problems and evaluate possible solutions to problems. In cooperation with the customer, the data for the model is collected and compiled into a database for convenient reference during the analysis. Important information includes:
Perform Simulations
Simulations provide a convenient means to characterize power quality problems, predict disturbance characteristics, and evaluate possible solutions to problems. They should be performed in conjunction with monitoring efforts and measurements for verification of models and identification of important power quality concerns. The models required for the simulations depend on the system characteristics and the power quality variations being evaluated. The simulations fall into three major categories:
1.Transients. Transient simulations can be performed with the Electromagnetic Transients Program (EMTP). This is a valuable tool for analysis of circuit switching operations, capacitor switching, lightning transients, and transients associated with power electronic equipment operation.
2.Harmonics. Harmonic PLCs is usually performed using steady state analysis techniques at the individual harmonic frequencies. The SuperHarm program can be used for these simulations. Harmonic producing loads can be modeled as harmonic current sources and the simulations used to predict harmonic voltages and currents throughout the customer and utility systems.
Overloading of neutral conductors, transformer heating considerations, resonances caused by capacitor applications, and harmonic currents injected onto the utility system can be evaluated in the simulations.
3.60 Hz Voltage Variations. Variations in the fundamental frequency voltage can be evaluated with conventional analysis tools. Load flow programs give system voltages as a function of load levels on the system. Fault programs can calculate system voltage profiles during fault conditions for analysis of voltage sag concerns.
The models being developed during the case studies in the second phase of this project will serve as templates for future case studies by utility personnel. The models will be verified and refined using the results of monitoring at customer sites.
Develop Monitoring Program
The utility and customer systems being evaluated should be monitored to characterize the power quality variations and to verify the analytical models developed for simulations. The measurement program should be designed based on initial simulation results and on the particular sensitive loads existing at the customer facilities. Monitoring will typically be performed at the customer service entrance and close to particular sensitive loads in order to characterize disturbances coming from the utility system and disturbances that are localized at the sensitive loads. A measurement program plan should be developed which specifies:
Available monitoring instruments should be evaluated for the measurements required. The problem of obtaining adequate representation of both harmonic and transient conditions must be addressed in particular if both of these concerns exist at a facility.
A customer site survey should be part of the measurement program design. The site survey should characterize the wiring and distribution system integrity and provide basic information about circuit and equipment loading. The data collection forms provided in Chapter 8 can be used to assist with this data collection effort. The site survey should also include discussions with facility personnel regarding characteristics of equipment problems and known customer system conditions at the time power quality variations have occurred.
The actual monitoring effort requires close cooperation between the customer and utility personnel. Monitoring sites and instrumentation should be selected based on the particular concerns being characterized. The duration of monitoring will depend on the parameters that can affect the power quality concerns. It is likely that the customer will need to be responsible for making sure the monitor is operating properly on a day-to-day basis. The monitoring results should be compiled and analyzed for verification of analytical models and to provide a concise description of the possible concerns.
The customer should participate in the monitoring effort by keeping a log of equipment problems during the monitoring period. It is very important to correlate actual equipment problems with power quality variations and with operations on the customer system or the utility system.
Evaluate Measurements Results
The measurement results are analyzed along with the results of simulations to correlate customer problems with the utility system power quality levels. The initial measurements and the site survey are used to identify the phenomena involved and the important parameters. The subsequent measurement results are used to verify the model and characterize the actual power quality variations. Using this information, the model can then be used for more detailed simulations of possible solutions to the power quality problem. The simulations provide the means to evaluate a range of possible solutions from a technical point of view.
Once the range of technical solutions is identified, economic analyses need to be performed to evaluate the possible alternatives for solving customer power quality problems. These alternatives will generally include the following options:
− Power conditioning and/or filtering at the sensitive loads.
The requirements for each of these options will be developed from the simulation effort and the analysis of measurement results. Power conditioning in this case includes surge suppression, voltage regulation, and possibly backup for momentary interruptions. Harmonic filtering to solve harmonic problems can be applied either at individual loads or at the main service for a facility. Customer system design modifications, such as changing power factor correction procedures and equipment, can have an important impact on power quality variations. If particular loads are much more sensitive that other loads in the facility, either power conditioning at the particular load or design changes to the load equipment should be considered.
Momentary interruptions and voltage sags deserve careful consideration. Distribution system modifications could include implementation of switching procedures to minimize transients associated with capacitor switching events or addition of current limiting devices to minimize the voltage sags that occur during faults on parallel feeders. The impact of protection practices on power quality levels experienced by customers should be evaluated carefully using both the analytical and measurement results. Conclusions will be developed from this effort regarding optimum locations for power quality improvement and the impact of distribution system design practices on customer power quality levels.
The procedure described in the previous sections is summarized by the block diagram in Figure 1.

REFERENCES
IEEE Standard 100. Terms and Definitions
IEEE Standard 1100. IEEE Recommended Practice for Powering and Grounding Sensitive Equipment (The Emerald Book).
IEEE Standard 1159. IEEE Recommended Practice on Monitoring Electric Power Quality.
RELATED STANDARDS
IEEE Std. 1159
IEEE Std. 1346
IEEE Std. 1250
IEEE Std. 1036
IEEE Std. 519
GLOSSARY AND ACRONYMS
ASD: Adjustable-Speed Drive
CVT: Constant Voltage Transformer
GPR: Ground Potential Rise
IEEE: Institute of Electrical and Electronics Engineers
MOV: Metal Oxide Varistor
PWM: Pulse Width Modulation
TVSS: Transient Voltage Surge Suppressors
UPS: Uninterruptible Power Supply
VCR: Video Cassette Recorder
Published by Mirus International Inc., [2010-01-08] MIRUS-FAQ001-B2, FAQ’s Harmonic Mitigating Transformers, 31 Sun Pac Blvd., Brampton, Ontario, Canada. L6S 5P6.

Some manufacturers are promoting the use of 3rd harmonic (180 Hz) blocking filters for the treatment of high neutral currents caused by non-linear loads such as personal computers. These devices are parallel L-C filters tuned to 180 Hz and are connected in the neutral of 4-wire systems between the transformer secondary and the neutral-to-ground connection. Their high impedance to the flow of 3rd harmonic current forces all connected equipment to draw current that does not contain the 3rd harmonic. Although their use will result in a significant reduction in 3rd harmonic current, it is achieved at the risk of rather severe consequences.

Some reasons for concern are as follows:
1. The installation raises questions with respect to NEC 2002 compliance. NEC 250.30(A)(2)(a) states that “a grounding electrode conductor for a single separately derived system … shall be used to connect the grounded conductor of the derived system to the grounding electrode…” In addition, “the grounding electrode conductor shall be installed in one continuous length without a splice or joint…” [italics added. See NEC 250.64(C)]. If a simple splice connection is not allowed, then certainly the L-C circuit of the 3rd harmonic blocking filter should not be allowed either. Also, the installation results in an impedance grounded wye system rather than a solidly grounded system.
The only reference in NEC that allows for the introduction of an impedance between the neutral and the grounding electrode is found in Section 250.36, High-Impedance Grounded Neutral Systems. However, these systems are permitted only at 480V and higher and only if they do not serve line-to-neutral loads. They also require the use of ground fault detectors. None of these requirements is met in the normal application of the 3rd harmonic blocking filter where the loads are primarily 120V, phase-to-neutral connected computer or other power electronic equipment.
2. Although tuned to 180 Hz, the L-C circuit will introduce some impedance at 60 Hz as well. The consequences are:
3. High impedance to the flow of 3rd harmonic current will produce voltage distortion in the form of flat-topping – a dramatic reduction in peak to peak voltage. This will:
At first, when loading is light, problems may not be extremely obvious. However, as the load increases, voltage distortion and flat-topping will also increase until problems do arise. Figure 2 shows the voltage waveform of a 3rd Harmonic Blocking Filter installation at a financial institution. Although neutral current was indeed reduced, it was achieved at the expense of a tremendous increase in voltage distortion. At 30%, the voltage distortion was 6 times the maximum limit of 5% recommended by IEEE std 519. In addition, the crest factor of 1.19 was 19% below the normal sinusoidal crest factor of 1.414. (For an explanation of the effect of voltage flat-topping on connected equipment, blog)

4. The 180 Hz L-C blocking filter requires the use of capacitors and it is well known that capacitors are less reliable than inductors and transformers. Failure of the capacitor or its protection could result in a very high impedance ground at the neutral over the full frequency range. This would have a dramatic effect on 60 Hz unbalance and fault currents.
5. At frequencies above the resonant point (180 Hz), the parallel L-C circuit becomes capacitive which could result in a resonant condition at some higher harmonic frequency.
A much better strategy for 3rd harmonic current treatment is the use of a parallel connected low zero sequence impedance filter such as the MIRUS Neutral Current EliminatorTM (NCETM). This device provides a lower impedance, alternate path for the flow of 3rd harmonic and other zero sequence currents, thereby off-loading the neutral conductor and upstream transformer. In addition, voltage distortion is decreased because the harmonic currents no longer pass through the transformer and cable impedance. For more information on the zero sequence filter, blog.
References:
1. A. Hoevenaars, 3rd Harmonic Blocking Filters – Is the Cure Worse than the Disease, IAEI News, Sept/Oct 2002, pp. 68 – 74
Harmonics and Harmonic Mitigating Transformers (HMT’s) Questions and Answers
This document has been written to provide answers to the more frequently asked questions we have received regarding harmonics and the Harmonic Mitigating Transformer technology used to address them. This information will be of interest to both those experienced in harmonic mitigation techniques and those new to the problem of harmonics. For additional information visit our Website at www.mirusinternational.com.
Published by Marcus Lu, Visual Capitalist, Energy Archive, April 20, 2021
Website: visualcapitalist.com
Cryptocurrencies have been some of the most talked-about assets in recent months, with bitcoin and ether prices reaching record highs. These gains were driven by a flurry of announcements, including increased adoption by businesses and institutions.
Lesser known, however, is just how much electricity is required to power the Bitcoin network. To put this into perspective, we’ve used data from the University of Cambridge’s Bitcoin Electricity Consumption Index (CBECI) to compare Bitcoin’s power consumption with a variety of countries and companies.

When people mine bitcoins, what they’re really doing is updating the ledger of Bitcoin transactions, also known as the blockchain. This requires them to solve numerical puzzles which have a 64-digit hexadecimal solution known as a hash.
Miners may be rewarded with bitcoins, but only if they arrive at the solution before others. It is for this reason that Bitcoin mining facilities—warehouses filled with computers—have been popping up around the world.
These facilities enable miners to scale up their hashrate, also known as the number of hashes produced each second. A higher hashrate requires greater amounts of electricity, and in some cases can even overload local infrastructure.
On March 18, 2021, the annual power consumption of the Bitcoin network was estimated to be 129 terawatt-hours (TWh). Here’s how this number compares to a selection of countries, companies, and more.
| Name | Population | Annual Electricity Consumption (TWh) |
|---|---|---|
| China | 1,443M | 6,543 |
| America | 330.2M | 3,989 |
| All of the world’s data centers | – | 205 |
| State of New York | 19.3M | 161 |
| Bitcoin network | – | 129 |
| Norway | 5.4M | 124 |
| Bangladesh | 165.7M | 70 |
| – | 12 | |
| – | 5 | |
| Walt Disney World Resort (Florida) | – | 1 |
If Bitcoin were a country, it would rank 29th out of a theoretical 196, narrowly exceeding Norway’s consumption of 124 TWh. When compared to larger countries like the U.S. (3,989 TWh) and China (6,543 TWh), the cryptocurrency’s energy consumption is relatively light.
For further comparison, the Bitcoin network consumes 1,708% more electricity than Google, but 39% less than all of the world’s data centers—together, these represent over 2 trillion gigabytes of storage.
In a 2020 report by the University of Cambridge, researchers found that 76% of cryptominers rely on some degree of renewable energy to power their operations. There’s still room for improvement, though, as renewables account for just 39% of cryptomining’s total energy consumption.
Here’s how the share of cryptominers that use each energy type vary across four global regions.
| Energy Source | Asia-Pacific | Europe | Latin America and the Caribbean | North America |
|---|---|---|---|---|
| Hydroelectric | 65% | 60% | 67% | 61% |
| Natural gas | 38% | 33% | 17% | 44% |
| Coal | 65% | 2% | 0% | 28% |
| Wind | 23% | 7% | 0% | 22% |
| Oil | 12% | 7% | 33% | 22% |
| Nuclear | 12% | 7% | 0% | 22% |
| Solar | 12% | 13% | 17% | 17% |
| Geothermal | 8% | 0% | 0% | 6% |
Hydroelectric energy is the most common source globally, and it gets used by at least 60% of cryptominers across all four regions. Other types of clean energy such as wind and solar appear to be less popular.
Coal energy plays a significant role in the Asia-Pacific region, and was the only source to match hydroelectricity in terms of usage. This can be largely attributed to China, which is currently the world’s largest consumer of coal.
Researchers from the University of Cambridge noted that they weren’t surprised by these findings, as the Chinese government’s strategy to ensure energy self-sufficiency has led to an oversupply of both hydroelectric and coal power plants.
As cryptocurrencies move further into the mainstream, it’s likely that governments and other regulators will turn their attention to the industry’s carbon footprint. This isn’t necessarily a bad thing, however.
Mike Colyer, CEO of Foundry, a blockchain financing provider, believes that cryptomining can support the global transition to renewable energy. More specifically, he believes that clustering cryptomining facilities near renewable energy projects can mitigate a common issue: an oversupply of electricity.
“It allows for a faster payback on solar projects or wind projects… because they would [otherwise] produce too much energy for the grid in that area”
– MIKE COLYER, CEO, FOUNDRY
This type of thinking appears to be taking hold in China as well. In April 2020, Ya’an, a city located in China’s Sichuan province, issued a public guidance encouraging blockchain firms to take advantage of its excess hydroelectricity.
Source URL: https://www.visualcapitalist.com/visualizing-the-power-consumption-of-bitcoin-mining/
Published by European Distribution System Operators (E.DSO), Why smart grids?
Website: edsoforsmartgrids.eu
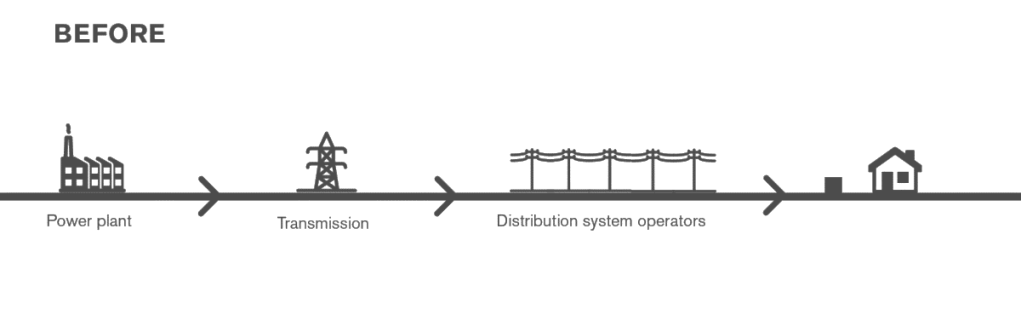
Distribution system operators (DSOs) are the operating managers (and sometimes owners) of energy distribution networks, operating at low, medium and, in some member states, high voltage levels (LV, MV). Transmission grids transport large quantities of high (and extreme high) voltage (HV, EHV) electricity across vast distances, often from large power plants to the outskirts of large cities or industrial zones, where it is transformed into lower voltages distributed to all end-users through the distribution network. Over-head and underground cables leading to your home or business are operated by DSOs.
Traditionally, energy systems from power generation to homes are one-directional and based on more predictable, controllable and centralised power generation, looking something like this:
Increasingly, more energy is being generated locally and connected directly to distribution networks, from solar panels on your roof, to small power plants. This is generally referred to by DSOs as distributed energy resources (DER) and in the specific case of renewables, distributed renewable energy sources (DRES).
Since 2007, the European Union has committed to reaching the so-called 20-20-20 targets. By 2020, the EU will reduce its greenhouse gas emissions by 20% compared to 1990 levels, produce 20% of the energy consumed from renewable energy sources (RES), and will have consumed 20% less energy. Beyond 2020, the EU expects to cut its greenhouse gas emissions by 85-90% by 2050 and plans to set intermediate targets for 2030.
For such objectives to be achieved, an ever increasing share of RES is being connected to our electricity networks. Electricity generated from renewable sources is predominantly variable in nature (wind and solar) and is connected to distribution networks, making the DSO’s core mission of providing a secure electricity supply and quality of service increasingly challenging.
To add to the changing nature of the energy supply are new forms of energy demand, such as electric vehicles (EV).
The changing energy scenario in Europe requires a dramatic re-thinking of how to keep the lights on while both making the best use of new energy sources and keeping infrastructure costs down. Instead of only extending / reinforcing physical infrastructure, which is extremely costly and disruptive to local communities, complementary IT solutions are being introduced, adding communication, sensors and automation allowing DSOs to actively manage the varying generation and demand. This combination of solutions is what is commonly referred to as a smart grid.
Instead of the one-directional system shown above, distribution networks are starting to look more like this:

The core responsibilities of DSOs, security of supply and quality of service, remain the same, but to continue to ensure these, DSOs are having to evolve, becoming increasingly active network managers. For this, DSOs need a larger toolbox and adapted legislative and regulatory frameworks.
Smart grids are still in their infancy but will be key-enablers of other technological developments. These and other relatively new technologies, such as smart metering and energy storage, are being tested on a large scale and in real-life scenarios and have, in some EU member states, even been deployed.
More information on the EU smart grid related policy can be found on E.DSO’s Policy page.
Source URL: https://www.edsoforsmartgrids.eu/home/why-smart-grids/
Published by Electrotek Concepts, Inc., PQSoft Case Study: General Reference – Wiring and Grounding, Document ID: PQS0609, Date: July 1, 2006.
Abstract: Wiring and grounding problems are responsible for many power quality variations within customer facilities. Some electric utility engineers have estimated that 80% of all the power quality problems reported by customers are found to be due to their own wiring and grounding problems. While end-users may have a different opinion, it is commonplace for many power quality problems to be resolved by simply tightening a loose connection, removing an unnecessary ground connection, bonding ground conductors, or replacing a corroded conductor. Therefore, the first step in any power quality investigation is to evaluate the wiring and grounding practices of the facility.
This case provides general information on proper grounding practices and outlines common problems that are encountered.
This case describes a general review of wiring and grounding with respect to power quality. Wiring and grounding problems are responsible for many power quality variations within customer facilities. Some electric utility engineers have estimated that 80% of all the power quality problems reported by customers are found to be due to their own wiring and grounding problems. While end-users may have a different opinion, it is commonplace for many power quality problems to be resolved by simply tightening a loose connection, removing an unnecessary ground connection, bonding ground conductors, or replacing a corroded conductor. Therefore, the first step in any power quality investigation is to evaluate the wiring and grounding practices of the facility.
IEEE wiring regulations and other important standards provide the minimum standards for wiring and grounding. These work well at 60Hz, or power frequency. However, it is often necessary to go beyond the minimum requirements of safety standards to achieve a system that also minimizes the impact on connected equipment of power quality variations that have higher frequency components.
Personnel Safety
Personnel safety is the primary reason that all equipment must have a safety equipment ground. This is designed to prevent the possibility of high touch voltages when there is a fault in a piece of equipment (see Figure 1). The touch voltage is the voltage between any two conducting surfaces that can be simultaneously touched by an individual. The earth may be one of these surfaces.
There should be no “floating” panels or enclosures near electric circuits. In the event of insulation failure or inadvertent application of moisture, any electric charge that appears on a panel, enclosure, or raceway must be drained to “ground” or to an object that is reliably grounded.
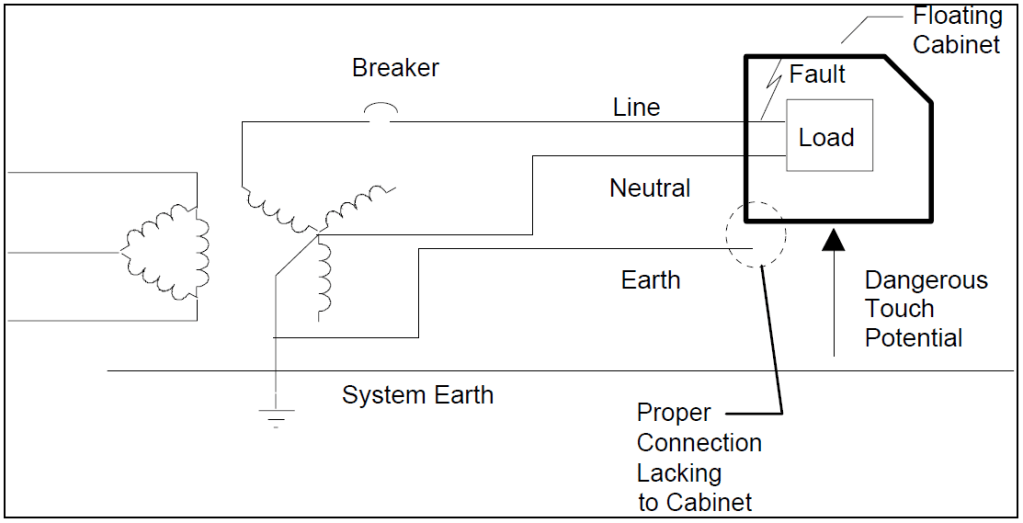
Grounding to Assure Protective Device Operation
A ground fault return path to the point where the power source neutral conductor is grounded is an essential safety feature. The NEC and some local wiring codes permit electrically continuous conduit and wiring device enclosures to serve as this ground return path. Some codes require the conduit to be supplemented with a bare or insulated conductor included with the other power conductors.
An insulation failure or other fault that allows a phase wire to make contact with an enclosure will find a low impedance path back to the power source neutral. The resulting overcurrent will cause the circuit breaker or fuse to disconnect the faulted circuit promptly. NEC, Article 250-51 states that an Effective Grounding Path (the path to ground from circuits, equipment, and conductor enclosures) shall:
Noise Control
This is where grounding relates to power quality. The safety reasons for grounding described above are not related to power quality concerns. However, they define the minimum requirements for a grounding system. Anything that is done to the grounding system to improve the noise performance must be done in addition to the minimum requirements defined in the National Electric Code and local codes.
The primary objective of grounding for noise control is to create an equipotential ground system. Potential differences between different ground locations can create circulating ground currents and interference with sensitive equipment that may be grounded in multiple locations. Steady state circulating currents and associated potential differences will be at 60 Hz or at harmonic frequencies and are caused by potential differences at the main ground locations of the two facilities. Transient potential differences will be caused by switching events or lightning surges that cause ground currents or protective device operation from line-to-ground.
Ground Voltage Equalization of voltage differences between parts of an Automated Data Processing (ADP) grounding system is accomplished in part when the equipment grounding conductors are connected to the grounding point of a single power source. However, if the equipment grounding conductors are long, and if the ground currents are significant, the impedance of grounding conductors may be too high to achieve a constant potential throughout the grounding system. Supplementary conductors that may be needed for improving power quality must be in addition to the equipment ground conductors that are required for safety and not a replacement for them.
Often, selection of proper size grounding conductors and assuring good ground connections is sufficient to achieve an equipotential ground system. However, with higher speed communication and processing, the high frequency characteristics of the ground system can also be important. A Signal Reference Grid (see Figure 2), or Zero Reference Grid as used in IEEE Std. 1100, can provide an equipotential reference over a wide frequency range for computers and data processing equipment. This type of configuration is most common in mainframe computer installations.
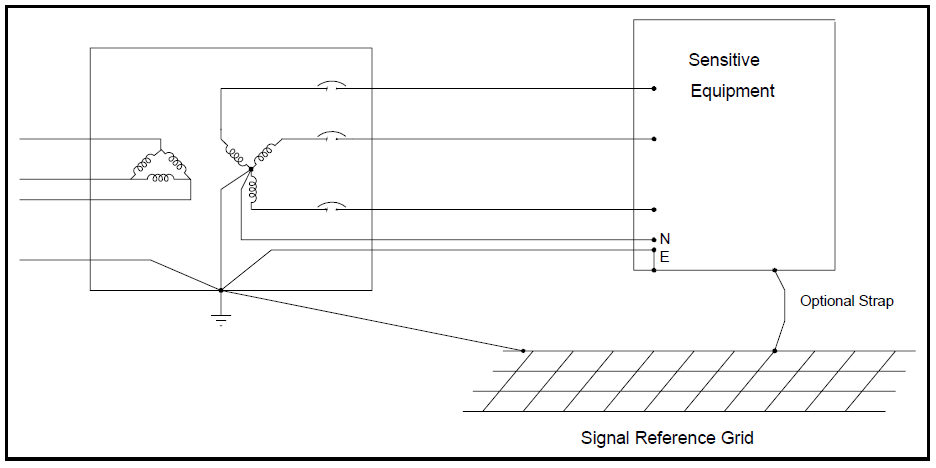
Figure 3 illustrates the basic elements of a properly grounded electrical system. The important elements of the electrical system grounding are described below.
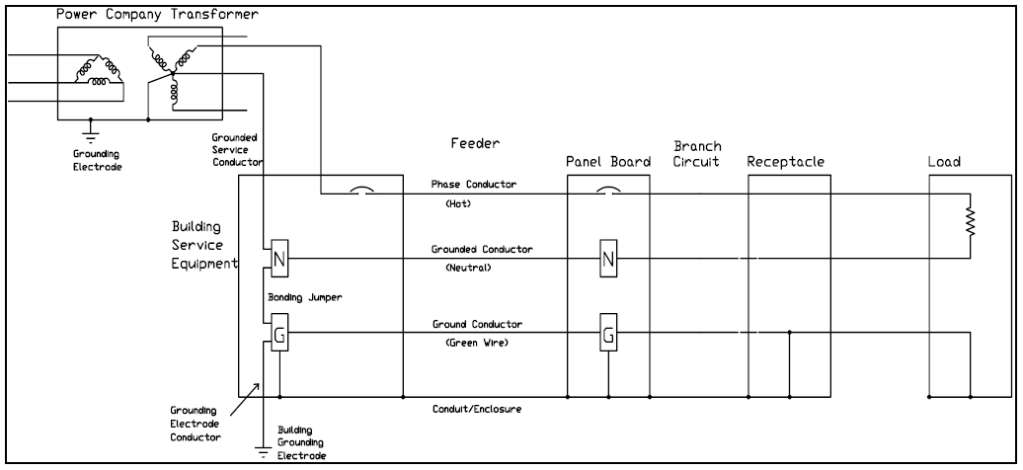
Ground Rod
The grounding rod is the basic component of most grounding schemes to provide the electrical connection from the power system ground to earth. The item of primary interest in evaluating the adequacy of the ground rod is the resistance of this connection. There are three basic components of resistance in a grounding rod:
The resistance of the ground rod connection is important because it influences transient voltage levels during switching events and lightning transients. High magnitude currents during lightning strokes result in a voltage across the resistance, raising the ground reference for the entire facility. The difference in voltage between the ground reference and true earth ground will appear at grounded equipment within the facility and this can result in dangerous touch potentials.
Service Entrance Connections
The service entrance is where the primary components of a properly grounded system are found. The neutral point of the supply power system is connected to the grounded conductor (neutral wire) at this point. This is also the one location in the system (except in the case of a separately derived system) where the grounded conductor is connected to the ground conductor (green wire) via the bonding jumper. The ground conductor is also connected to the building grounding electrode via the grounding electrode conductor at the service entrance. For most effective grounding, the grounding electrode conductor should be exothermically welded at both ends.
The grounding electrode conductor is sized based on guidelines in the National Electric Code (Section 250-94). Table 250-94 from the Code provides the basic guidelines.
There are a number of options for the building grounding electrode. It is important that all of the different grounding electrodes used in a building are connected together at the service entrance. The following are permissible for grounding electrodes:
Throughout the system, a safety ground must be maintained to ensure that all exposed conductors that may be touched are kept at an equal potential. This safety ground also provides a ground fault return path to the point where the power source neutral conductor is grounded. The safety ground can consist of the conduit itself or the conduit and a separate conductor (ground conductor or green wire) in the conduit. This safety ground originates at the service entrance and is carried throughout the building.
Panel Board
The panel board is the point in the system where the various branch circuits are supplied by a feeder from the service entrance. The panel board provides breakers in series with the phase conductors, connects the grounded conductor (neutral) of the branch circuit to that of the feeder circuit, and connects the ground conductor (green wire) to the feeder ground conductor, conduit, and enclosure. It is important to note that there should not be a neutral to ground connection at the panel board. This neutral-to-ground connection is prohibited in the National Electric Code, as it would result in load return currents flowing the ground path between the panel board and the service entrance. In order to maintain an equipotential grounding system, the ground path should not contain any load return current. In addition, fault currents would split between the neutral conductor and the ground return path. Protection is based on the fault current flowing in the ground path.
Isolated Ground
The noise performance of the supply to sensitive loads can sometimes be improved by providing an isolated ground to the load. This is done using isolated ground receptacles, which are orange in color. If an isolated ground receptacle is being used downline from the panel board, the isolated ground conductor is not connected to the conduit or enclosure in the panel board, but only to the ground conductor of the supply feeder (see Figure 4). The conduit is the safety ground in this case and is connected to the enclosure. A separate conductor can also be used for the safety ground in addition to the conduit. This technique is described in the NEC, Article 274, Exception 4 on receptacles. It is not described as a grounding technique.
The isolated ground receptacle is orange in color for identification purposes. This receptacle does not have the ground conductor connected to the receptacle enclosure or conduit. The isolated ground conductor may pass back through several panel boards without being connected to local ground until grounded at the service entrance or other separately derived ground. The use of isolated ground receptacles requires careful wiring practices to avoid unintentional connections between the isolated ground and the safety ground. In general, dedicated branch circuits accomplish the same objective as isolated ground receptacles without the concern for complicated wiring.
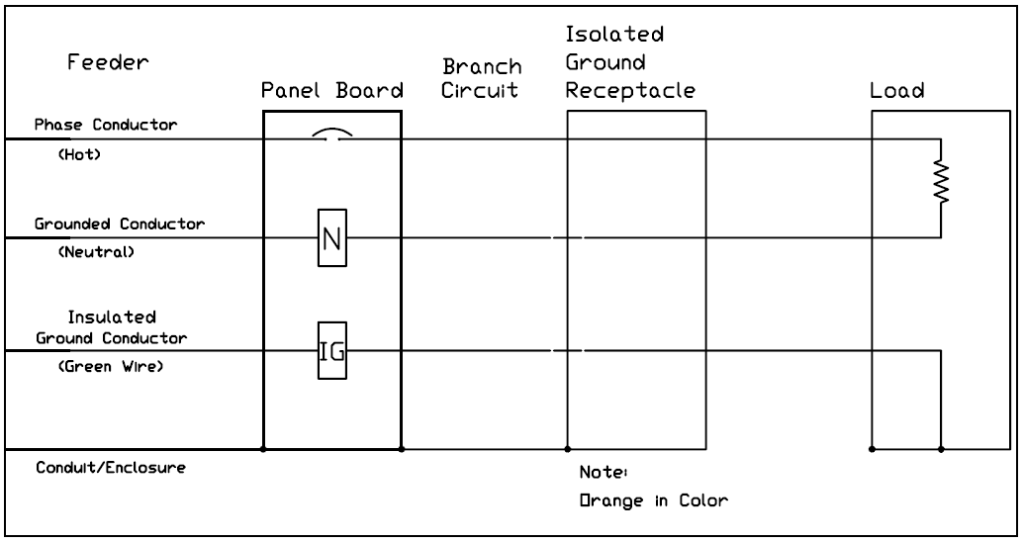
Separately Derived Systems
A separately derived system has a ground reference that is independent from other systems. A common example of this is a delta-wye grounded transformer (see Figure 5). The wye connected secondary neutral is connected to local building ground (not a separate ground rod) to provide a new ground reference independent from the rest of the system. The point in the system where this new ground reference is defined is like a service entrance in that the system neutral is connected to the grounded conductor (neutral wire) that is connected to the ground conductor with a bonding jumper.
Separately derived systems are used to provide a local ground reference for sensitive loads. The local ground reference can have significantly reduced noise levels as compared to the system ground if an isolation transformer is used to supply the separately derived system. An additional benefit is that neutral currents are localized to the load side of the separately derived system. This can help reduce neutral current magnitudes in the overall system when there are large numbers of single-phase nonlinear loads.
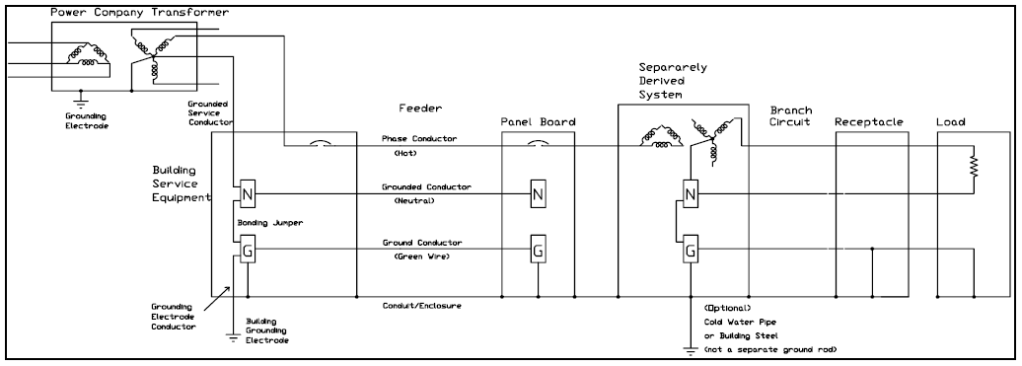
Grounding Techniques for Signal Reference
Most of the grounding requirements previously described deal with the concerns for safety and proper operation of protective devices. Grounding is also used to provide a signal reference point for equipment exchanging signals over communication or control circuits within a facility. The requirements for a signal reference ground are often significantly different from the requirements for a safety ground. However, the safety ground requirements must always be considered first whenever designing a grounding scheme.
The most important characteristic of a signal reference ground is that it must have low impedance. One way to accomplish this (at least for low frequencies) is to use an adequately sized ground conductor. Conduit is particularly bad for a signal reference ground because it relies on continuity of connections and the impedance is high relative to the phase and neutral conductors. Undersized ground conductors have the same problem of high impedance.
For reducing power quality problems, the ground conductor should be at least the same size as the phase conductors and the neutral conductor (the neutral conductor may need to be larger than the phase conductors in some special cases involving nonlinear single phase loads).
The signal reference ground must look like a ground over a wide range of frequencies. The safety ground requirements are based only on 60 Hz. As frequency increases, the wavelength becomes short enough to cause resonances for relatively short lengths of wire. A good rule of thumb is that when the length of the ground conductor is greater than 1/20th of the signal wavelength, the ground conductor is no longer effective at that frequency. Since the grounding system is more complicated than a simple conductor, there is actually a complicated impedance vs. frequency characteristic involved.
One way to provide a signal reference ground to sensitive equipment that is effective over a wide range of frequencies (0-30 MHz) is to use a signal reference grid or zero reference grid. This technique uses a rectangular mesh of copper wire with about two-foot spacing. Even if a portion of the conductor system is in resonance at a particular frequency, there will always be other paths of the grid that are not in resonance due to the multiple paths available for current to flow. When using a signal reference grid, the enclosure of each piece of equipment must still be connected to a single common ground via the ground conductor (NEC requirement). The enclosures may also be connected to the closest interconnection of the grid to provide a high frequency, low impedance signal reference.
Additional Practices for Sensitive Equipment
The following practices are appropriate for any installation with equipment that may be sensitive to noise or disturbances introduced due to coupling in the ground system:
The previous sections described proper procedures for grounding of electrical systems. The following sections outline some typical problems that can be experienced with the wiring and grounding of electrical systems. It is useful to be aware of these typical problems when performing site surveys. Many of the problems can be detected through simple observations. Other problems require measurements of voltages, currents, or impedances in the circuits.
Problems with Conductors and Connectors
The first things to look for when inspecting the service entrance, panel boards, and equipment wiring during a site survey are problems with conductors or connections. A bad connection (faulty, loose, or resistive connection) will result in heating, possible arcing, and burning of insulation. Table 1 summarizes some of the wiring problems that can be uncovered during a site survey.
Table 1 – Problems with Conductors and Connectors
| Noted Problem | Possible Cause |
|---|---|
| Burnt smell at the panel, junction box, or load equipment | Faulted conductor, bad connection, arcing, or overloaded wiring |
| Panel or junction box is warm to the touch | Faulty circuit breaker or bad connection |
| Buzzing (corona effect) | Arcing |
| Scorched insulation | Overloaded wiring, faulted conductor, or bad connection |
| No voltage at load equipment | Tripped breaker, bad connection, or faulted conductor |
| Intermittent voltage at the load equipment | Bad connection or arcing |
| Scorched panel or junction box | Bad connection, faulted conductor |
Missing Safety Ground
If the safety ground is missing, a fault in the equipment from the phase conductor to the enclosure results in line potential on the exposed surfaces of the equipment. No breakers will trip and a hazardous situation results.
Multiple Neutral to Ground Connections
Unless there is a separately derived system, the only neutral to ground bond should be at the service entrance. The neutral and ground should be kept separate at all panel boards and junction boxes. Down neutral-to-ground bonds result in parallel paths for the load return current where one of the paths becomes the ground circuit. This can cause misoperation of protective devices. In addition, during a fault condition, the fault current will split between the ground and the neutral that could prevent proper operation of protective devices (a serious safety concern). This is a direct violation of the NEC.
Ungrounded Equipment
Isolated grounds are sometimes used due to the perceived notion of obtaining a “clean” ground. Procedures which involve an illegal insulating bushing in the power source conduit and replacing the prescribed equipment grounding conductor with one to an “Isolated Dedicated Computer Ground” are dangerous, violate code, and are unlikely to solve noise problems.
Additional Ground Rods
Ground rods for a facility should be part of a grounding system, connected where all the building grounding electrodes (building steel, metal water pipe, etc.) are bonded together. Multiple ground rods can be bused together at the service entrance to reduce the overall ground resistance. Isolated grounds can be used for sensitive equipment, as described previously. However, these should not include isolated ground rods to establish a new ground reference for the equipment. The most important problem with additional ground rods is that they create additional paths for lightning stroke currents to flow. With the ground rod at the service entrance, any lightning stroke current reaching the facility goes to ground at the service entrance and the ground potential of the whole facility rises together. With additional ground rods, a portion of the lightning stroke current will flow on the building wiring (green ground conductor and/or conduit) to reach the additional ground rods. This creates a possible transient voltage problem for equipment and a possible overload problem for the conductors.
Ground Loops
Ground loops are one of the most important grounding problems in many commercial and industrial environments that include data processing and communication equipment. If two devices are grounded via different paths and a communication cable between the devices provides another ground connection between them, a ground loop results. Slightly different potentials in the two power system grounds can cause circulating currents in this ground loop. Because the communication signal levels can be quite low (e.g., five volts), very low magnitudes of circulating current can cause serious noise problems. The best solution to this problem is to use optical couplers in the communication lines, thereby eliminating the ground loop.
Insufficient Neutral Conductor
An example current waveform for a switched-mode power supply was provided in the harmonics section. This type of load, as well as fluorescent lighting with electronic ballasts is becoming increasingly prevalent in commercial environments. The high harmonic contents present in these load currents can have a very important impact on the required neutral conductor rating for the supply circuits.
The most important harmonic component in these load currents is the third. Third harmonic currents in a balanced system appear in the zero sequence circuit. This means that third harmonic currents from three single phase loads will add in the neutral, rather than cancel as is the case for the 60 Hz current. For the current waveform shown in Figure 6, this means that the neutral current could be as high as 240% (80% third harmonic current on each phase) of the fundamental frequency phase current magnitude. In typical commercial buildings with a diversity of switch mode power supply loads, the neutral current is typically in the range 140%-170% of the fundamental frequency phase current magnitude. CBEMA has recognized this concern and has prepared a brief to alert the industry to problems caused by harmonics from computer power supplies.
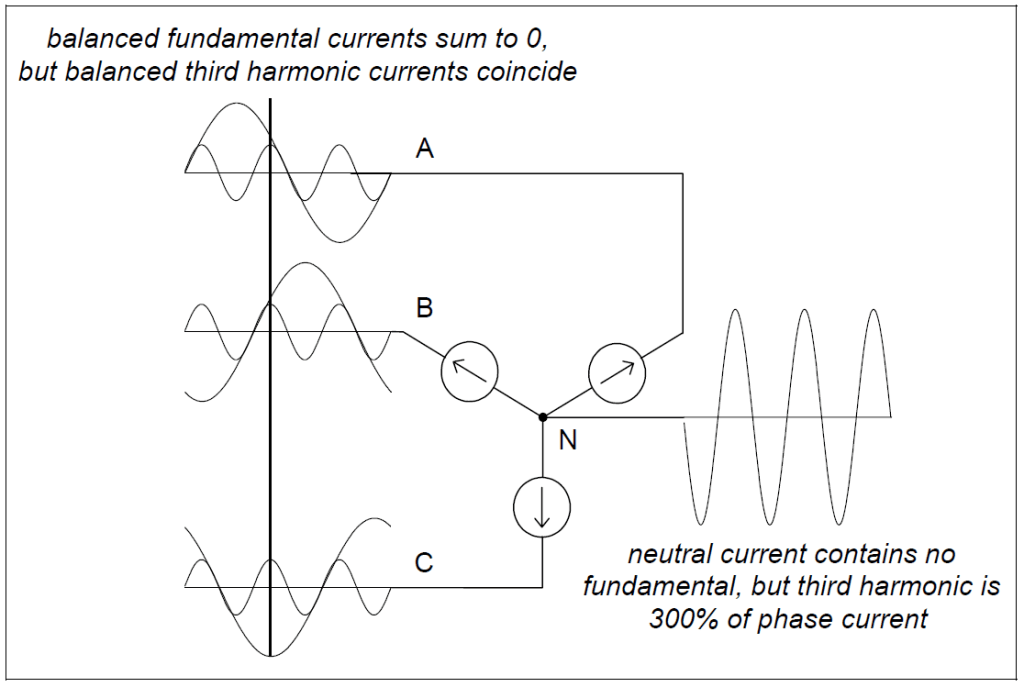
The possible solutions to neutral conductor overloading include the following:
The grounding system should be designed to accomplish these minimum objectives:
The most important implications resulting from these objectives are:
Finally, consideration should be given to how various loads are grouped in the distribution panel as shown in Figure 7. Electronic tills, computers, lab equipment, and other loads should be powered from a dedicated circuit with separate conductors.
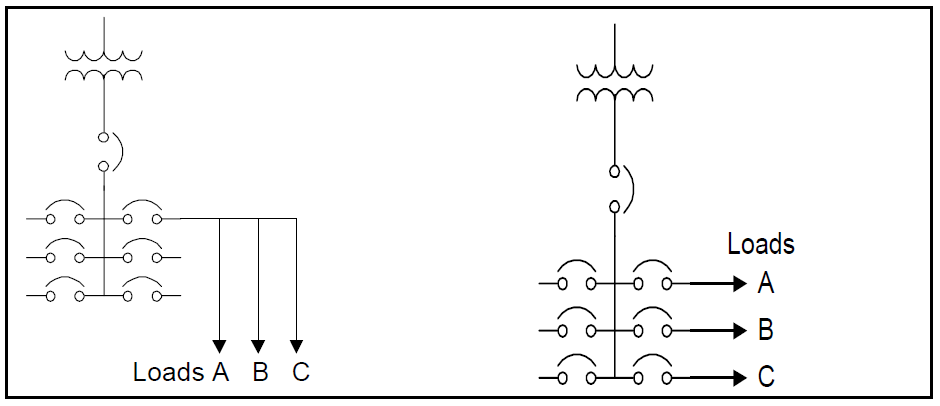
Wiring and grounding problems are responsible for many power quality variations within customer facilities. Some electric utility engineers have estimated that 80% of all the power quality problems reported by customers are found to be due to their own wiring and grounding problems. While end-users may have a different opinion, it is commonplace for many power quality problems to be resolved by simply tightening a loose connection, removing an unnecessary ground connection, bonding ground conductors, or replacing a corroded conductor. Therefore, the first step in any power quality investigation is to evaluate the wiring and grounding practices of the facility.
This case provided general information on proper grounding practices and outlines common problems that are encountered.
REFERENCES
IEEE Standard 100. Terms and Definitions
IEEE Standard 1100. IEEE Recommended Practice for Powering and Grounding Sensitive Equipment (The Emerald Book).
Grounding and Shielding in Facilities, R. Morrison and W. H. Lewis, John Wiley and Sons, Inc., 1990.
RELATED STANDARDS
IEEE Std. 1100-1999
IEEE Std. 142-1991
National Electric Code (NEC)
GLOSSARY AND ACRONYMS
ADP: Automated Data Processing
CBEMA: Computer and Business Equipment Manufacturers Association
NEC: National Electric Code
Published by Horia Andrei1, Costin Cepisca2 and Sorin Grigorescu2
1Valahia University of Targoviste, 2Politehnica University of Bucharest, Romania
The chapter covers general issues related to power quality in Electric Arc Furnaces. The use of electric arc furnaces (EAF) for steelmaking has grown dramatically in the last decade. Of the steel made today 36% is produced by the electric arc furnace route and this share will increase to 50 by 2030.
The electric arc furnaces are used for melting and refining metals, mainly iron in the steel production. AC and DC arc furnaces represent one of the most intensive disturbing loads in the sub-transmission or transmission electric power systems; they are characterized by rapid changes in absorbed powers that occur especially in the initial stage of melting, during which the critical condition of a broken arc may become a short circuit or an open circuit. In the particular case of the DC arc furnaces, the presence of the AC/DC static converters and the random motion of the electric arc, whose nonlinear and time-varying nature is well known, are responsible for dangerous perturbations such as waveform distortions and voltage fluctuations.
Nowadays, arc furnaces are designed for very large power input ratings and due to the nature of both, the electrical arc and the melt down process, these devices can cause large power quality problems on the electrical net, mainly harmonics, inter-harmonics, flicker and voltage imbalances.
The Voltage-Current characteristic of the arc is non-linear, what can cause harmonic currents. These currents, when circulating by the electric net can produce harmonic voltages, which can affect to other users.
In evaluation and limitation, there are some definitions and standards to quantify the disturbance levels, such as (IEC, 1999), (IEEE 1995), and (***IEEE, 1996). and. The total harmonic distortion (THD), short-term voltage flicker severity (Pst), and long-term voltage flicker severity (Plt) are used. However, sometimes it is desired to record voltage and current waveforms in the specified duration to track the disturbance levels.
2.1 Construction and typical steelmaking cycle
An electric arc furnace (EAF) transfers electrical energy to thermal energy in the form of an electric arc to melt the raw materials held by the furnace. The arc is established between an electrode and the melting bath and is characterized by a low voltage and a high current. Arc furnaces differ from induction furnaces in that the charge material is directly exposed to an electric arc, and the current in the furnace terminals passes through the charged material. Sir Humphrey Davy conducted an experimental demonstration in 1810 and welding was investigated by Pepys in 1815. Pinchon attempted to create an electrothermic furnace in 1853 and, in 1878 – 79, William Siemens took out patents for an electric arc furnaces. The first electric arc furnaces were developed by Paul Héroult, with a commercial plant established in the United States in 1907. While EAFs were widely used in World War II for production of alloy steels, it was only later that electric steelmaking began to expand. Of the steel made today 36% is produced by the electric arc furnace route and this share will increase to 50 by 2030.
A schematic cross-section through an EAF is presented in figure 1: three electrodes (black), molten bath (red), tapping spout at left, refractory brick movable roof, brick shell, and a refractory-lined bowl-shaped hearth.
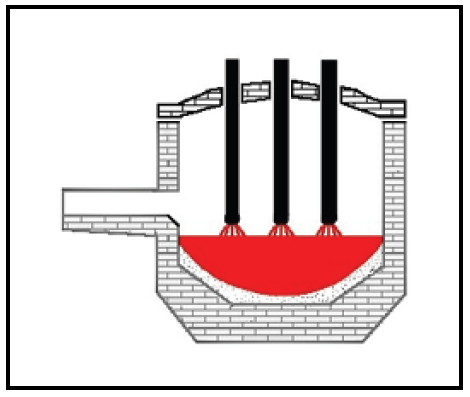
The furnace is primarily split into three sections:
Separate from the furnace structure is the electrode support and electrical system, and the tilting platform on which the furnace rests. Possible configurations: the electrode supports and the roof tilt with the furnace, or are fixed to the raised platform.
A typical alternating current furnace has three electrodes (Hernandez et al., 2007). The arc forms between the charged material and the electrode, the charge is heated both by current passing through the charge and by the radiant energy evolved by the arc. The electrodes are automatically raised and lowered by a positioning system and a regulating system maintains approximately constant current and power input during the melting of the charge, even though scrap may move under the electrodes as it melts. Since the electrodes move up and down automatically, heavy water-cooled cables connect the bus tubes/arms with the transformer located adjacent to the furnace.
The energy diagram shown in Figure 2 indicates that 70% of the total energy is electrical, the remainder being chemical energy arising from the oxidation elements such as carbon, iron, and silicon and the burning of natural gas with oxy-fuel burners. About 53 % of the total energy leaves the furnace in the liquid steel, while the remainder is lost to slag, waste gas, or cooling.
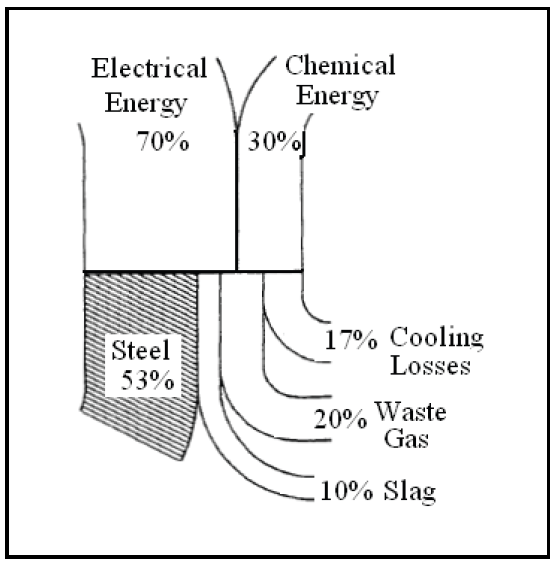
A mid-sized modern steelmaking furnace would have a transformer rated about 60 MVA, with a secondary voltage between 400 and 900 volts and a secondary current in excess of 44,000 amperes. To produce a ton of steel in an EAF requires approximately 440 kWh per metric tone; the theoretical minimum amount of energy required to melt a tone of scrap steel is 300 kWh (melting point 1520°C).
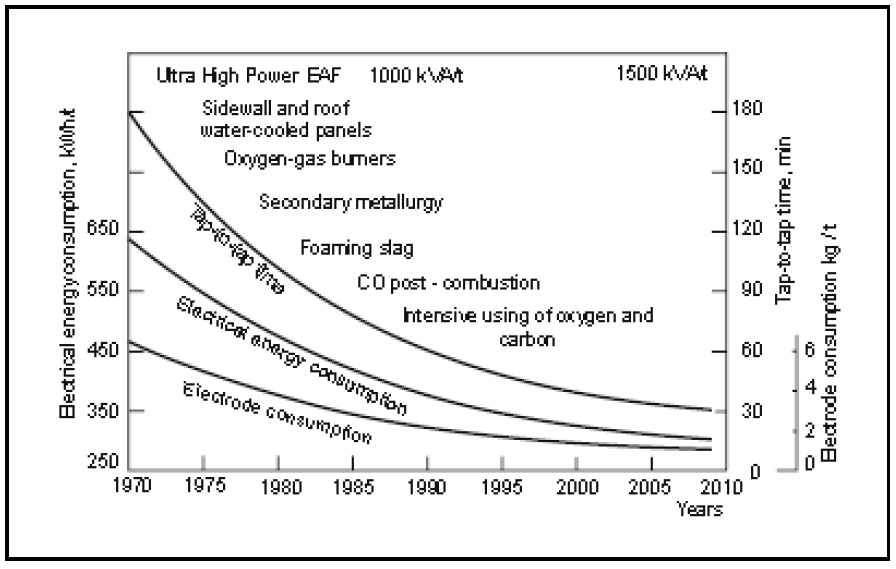
Electric Arc Furnaces (EAF) are being greatly improved at a fast pace. Only 20–30 years ago today’s EAF performance would be impossible to imagine (Hurst, 1994). Owing to the impressive number of innovations the tap-to-tap time has been shortened to 30–40 min. for the best 100–130 ton furnaces operating with scrap. Accordingly, their hourly and annual productivity increased. Electrical energy consumption got reduced approximately in half, from 580–650 to 320–350 kWh/ton. Electrical energy share in overall energy consumption per heat dropped to 50%. Electrode consumption was reduced 4–5 times – Figure 3. Typical steelmaking cycles are:
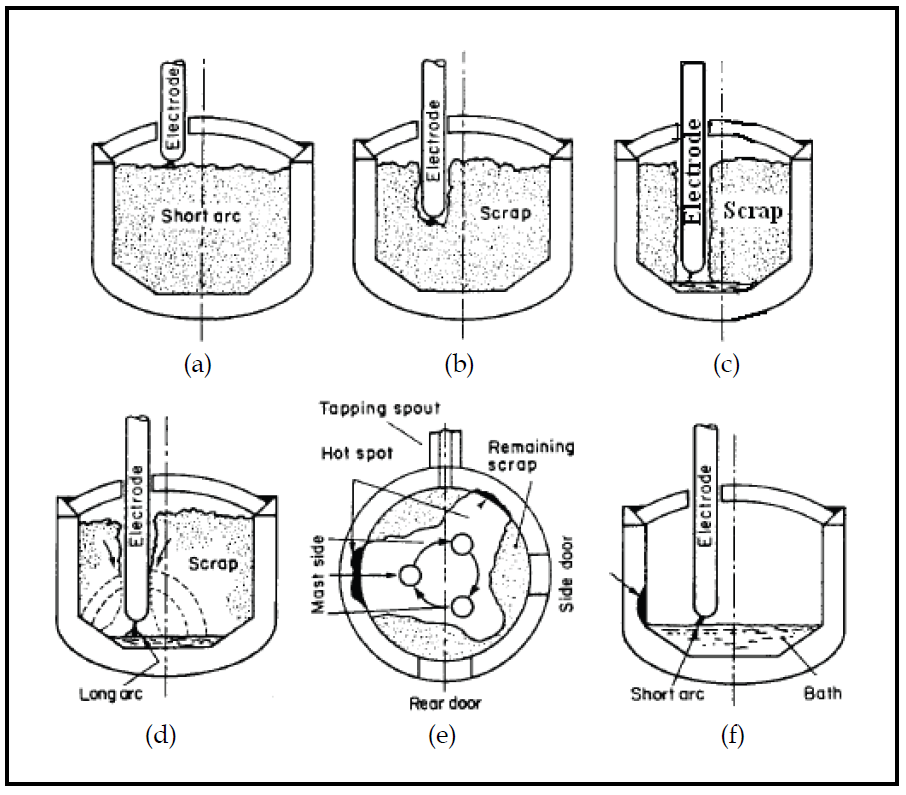
Electrodes are initially lowered to a point above the material, the current is initiated, and the electrodes bore through the scrap to form a pool of liquid metal. The scrap itself protects the furnace lining from the high intensity arc. Subsequently, the arc is lengthened by increasing the voltage to maximum power. In the final stage, when there is a nearly complete metal pool, the arc is shortened to reduce radiation heat losses and to avoid refractory damage and hot spots.
After melt dawn, oxygen usually is injected to oxidize the carbon in the steel or the charged carbon. This process is an important source of energy; the carbon monoxide that evolves helps minimize the absorption of nitrogen and flushes hydrogen out of the metal. It also foams the slag, which helps minimize heat loss.
The random movement of the melting material has as consequence that no two cycles of the arc voltage and current waveforms are identical. The impact of these large, highly varying loads has a direct impact on the power quality of the interconnected power system. The abrupt initiation and interruption of current flow provides a source of harmonic currents and causes considerable disturbance to high-impedance circuits. Voltage and current waves deviate considerably from symmetrical sinusoidal patterns. Disturbances are worst during early meltdown, and they occur at varying frequencies.
Generation of harmonics may result in further flicker problems, and equipment on the power system may also be damaged. If static capacitors are to be used to improve the power factor, an analysis to ensure that resonance does not exist at any of the harmonic frequencies should be made. Harmonics contribute to wave distortion and to the increase in effective inductive reactance. This increase is often in the 10 to 15% range and has been reported as high as 25%. Current into the furnace is therefore less than what would be expected from calculations based on sinusoidal wave shapes, and losses in frequency sensitive equipment such as transformers are higher than the sinusoidal wave shape would produce. Generally, the initial period of melting causes the most electrical disturbances. As the scrap temperature begins to rise, a liquid pool forms, and disturbances begin to diminish. This is generally about 10 minutes or so after power-on and can vary depending on power levels and practices.
After about 20 minutes, most electric furnaces will have begun converting scrap to liquid metal. Hence, wide swings in disturbances will diminish considerably. When sufficient molten metal exists the arc is shortened by an adjustment to the electrode regulators. The current will rise since overall resistance is reduced, and the power factor and arc power will decline.
2.2 Perturbations
The majority of electric and electronic circuits (arc welders and furnaces, variable speed controllers, PC’s, medical equipment, etc) use switch mode techniques which act as a non linear load or disturbance generator which degrades the quality of the electricity supply.
In these electro energetic steady state circuits, the importance of the inconvenience caused by the non sinusoidal system of running is directly correlated to the amplitude of the harmonics. Also, it is of utmost importance to determine the variation of the apparent power at non defined node, in accordance with the presence of the current and voltage harmonics. Understanding the current harmonics and voltage harmonics is of utmost scientific importance both to the beneficiaries, who thus can prevent the undesirable effects of non sinusoidal steady state in a given network, and to the possible consumers as for as the corresponding measurement and pricing are concerned. Hence the elaboration of certain rules and prescription as regards the influence of the harmonics upon the fundamental component (first harmonic).
Such combinations of traditional and non-traditional loads, coupled with fluctuating loads, causes problems often classified as “random” or “sporadic” (problems with sensitive devices), annoying (light flickering) or as “strange” or “without apparent reason” (problems with cabling, capacitor banks, tripping, signaling etc.). The electric arc furnace produces strong disturbing effects featured by non-symmetries of currents and voltages, harmonics, flickers, voltage drops and over-voltages, characteristic parameters of power quality.
Many ways exist to reduce the effects of the arc disturbances. These are determined by the utility system to which the furnace or furnaces are to be connected, and they are influenced mainly by the size and stability of the power grid. Some sizable shops require no particular flicker control equipment. It is quite possible that, if a furnace shop is fed from a 220 kV or higher system with a short-circuit capacity of 6500 MVA or more, the utility will experience very little load disturbance, and the steelmaker can have considerable flexibility in configuring his internal plant power system.
Most utilities require power factor correction. Shops with large electric furnaces would more than likely use static capacitors; synchronous condensers of sufficient capacity would be prohibitively expensive for a multi-furnace shop. Before such systems are installed, transient analysis is required to determine:
If additional regulation is needed, VAR control equipment would probably be required. However, if plans have already been made for power factor capacitors, including tuning reactors, then the thyristors and main reactor are the only further additions required. The perturbations caused by electric arc furnaces are of random nature and encompass a frequency range from DC to a few hundreds of Hz. Depending on whether AC of DC is used to supply the electric arc furnace there are unbalances, harmonics, inter-harmonics or voltage flicker.
2.3 Arc furnace models
For the design of EAF is necessary to utilize a suitable model. In this regard, numerous models have been presented to describe the electric arc (Lazaroiu & Zaninelli, 2010); (Math et al., 2006); (Hooshmand & Esfahani, 2009); (Sankaran, 2008). In general the models can be classified into:
a. Time domain analysis methods:
b. Frequency domain analysis methods represent the arc voltage and current by their harmonic components (Key & Lai, 1997). The Harmonic Voltage Source Model first applies the Fourier transform to the arc voltage to obtain its harmonic components. Then the current harmonic components are calculated through the arc voltage harmonic components. Calculations provide an equivalent circuit for the fundamental frequency component consisting of an equivalent arc resistance and a reactance. The equivalent circuit for the calculation of the different order harmonics consists of a harmonic voltage source and the system impedance for that harmonic frequency. The model is simple, but suitable for steady-state iterative harmonic analysis.
c. Power balance method.
This model provides a harmonic domain solution method of nonlinear differential equation. The arc furnace load model is developed from the energy balance equation, which is actually a nonlinear differential equation of arc radius and arc current. This model uses some experimental parameters to reflect the arc furnace operation, but it neglects the influence of its supply system.
3.1 Power quality and harmonic distortion
One of the most important problems in nowadays consumers power supply is to ensure the power quality. Together with the power suppliers, the consumers are interested to use, to produce and to transport the electrical power as clean as possible. Any perturbation produced in the power system by any of its elements (components) may seriously affect the power quality consumed by the other elements especially those closely situated to the perturbing component (Filipski, et al., 1994).
The Power Quality has concerned the experts from power engineering area as far back as first years of using the energy, in a large amount of applications, the alternating current; during the last decade, we can observe several ascertainments to the involvement for this domain, owing to development based on power electronics.
Institute of Electrical and Electronic Engineers (IEEE) Standard IEEE 1100 define power quality as “a concept of powering and grounding sensitive electronic equipment in a manner suitable for the equipment”. But this is not the only interpretation. Another simple and more concise definition might state: “Power quality is a set of electrical boundaries that allows equipment to function in its intended manner without significant loss of performance or life expectancy”, definition that embraces two things that we demand from electrical equipment: performance and life expectancy. Another definition of power quality, based on the principle of EMC, is as follows: power quality refers to a wide variety of electromagnetic phenomena that characterize voltage and current at a given time and at a given location on the power system. IEC 61000-4-30 defines power quality as ”the characteristics of the electricity at a given point on an electrical system, evaluated against a set of reference technical parameters” (Toulouevski & Zinurov, 2010); (***IEEE, 1995). Power quality can be interpreted by the existence of two components:
The main Power quality disturbances are:
Among the greatest electrical perturbations in a power system is the electrical arc furnace. Its perturbations are visible upon the reactive power flow, the load unbalance and the harmonics injected in the supply network. Also the random variation of the EAF electrical load, leads to the “flicker” phenomena characterized by variation in the field of 0.3-0.5% of the rated voltage and frequencies variations of 6 up to 10 Hz. Physically, the flicker phenomena is visible for the electrical bulbs that are rapidly changing the light intensity. Also, the side effects of the flicker are visible for the modern computation technique that could be damaged by the voltage variations.
At this moment we cannot talk about a united standardization of electrical energy quality on an international level and sometimes on national one. Currently, several engineering organizations and standard bearers in several parts of the world (IEEE, IEC, ANSI,…) are spending a large amount of resources to generate power quality standards. Some of them classify the events as steady-state and non-steady-state phenomena, in some regulations the most important factor is the duration of the event, other guidelines use the wave shape (duration and magnitude) of each event to classify problems and other standards (e.g., IEC) use the frequency range of the event for the classification. These documents come in three levels of applicability and validity: guidelines, recommendations and standards. In almost all the countries, the directives system of electrical energy quality is composed by several quantitative characteristics of slow or rapid variations of effective voltage value, the shape or symmetry as well as characteristics of slow or rapid frequency variations (IEEE-WG, 1996); (PE, 2004) (SREN, 1998); (CMP, 1987).
As it can be seen in Figure 5 there are presented the main causes of an improper electrical energy quality.
For the measurements of disturbances, IEC 61000-4-7 describes testing and measurement techniques for harmonics and inter-harmonics measurements and instrumentation, for power supply systems and equipment connected thereto.
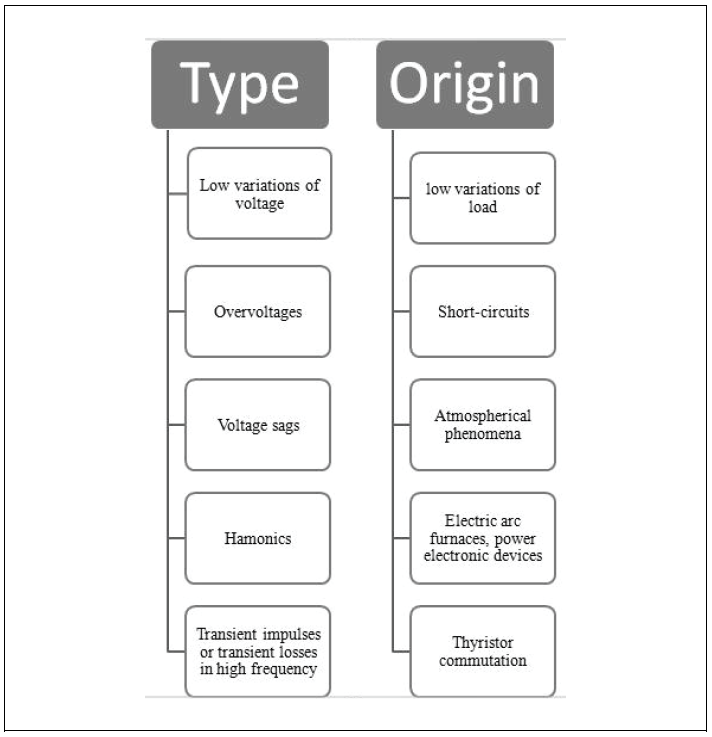
3.2 The prominent power quality aspects
The prominent power quality aspects considered are the following:
a. Voltages and currents are non sinusoidal quantities, and can be expressed by relations:
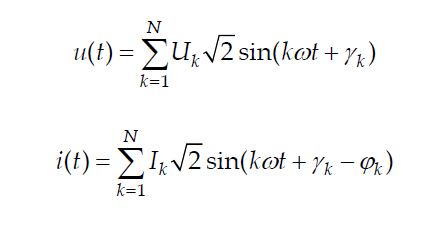
where Uk , Ik are the RMS of each k-harmonic of voltage, respectively current, ω is the angular frequency, γk is the phase angle or each k-harmonic of voltage, k-harmonic of voltage, ϕk is difference of each phase angle of k-harmonic of voltage and current, t is the time.
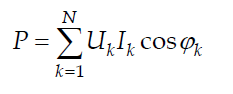
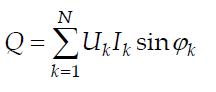
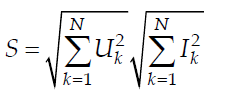
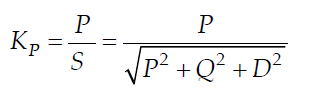

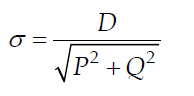
where D = √S2 − P2 −Q2 is the Budeanu distortion (deforming) power.
b. The presence of voltage and current harmonics is evaluated through a relative quantity, the total harmonic distortion (THD). Voltage harmonics are asserted with THDU, the ratio of the RMS value of the harmonic voltage to the RMS value of the fundamental, calculated by relation:
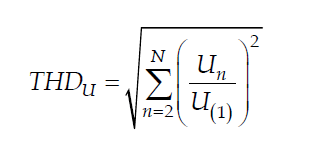
Everything presented for voltage harmonics is also valid for current harmonics and THDI, the ratio of the RMS value of the harmonic current to the RMS value of the fundamental, calculated by relation:
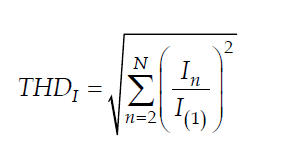
Total harmonic distortion is the ratio between deforming residue and effective value of fundamental waveform:
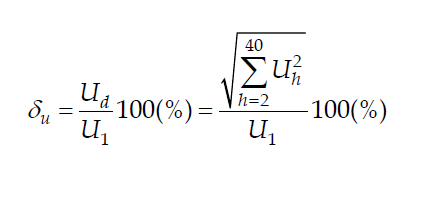
Harmonic level is the ratio between effective value of the considered harmonic and the effective value of the fundamental:
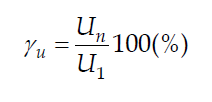
c. Voltage imbalance. Applying the theory of symmetrical components, an unbalanced three-phase sinusoidal voltage system [Va, Vb, Vc] can be decomposed into a positive-sequence three-phase balanced system V+, a negative-sequence system V-, and a zero sequence system V0
d. Disturbance transiting among voltage levels: Rapid voltage changes, Transient overvoltages and voltage fluctuation and flicker.
3.3 Power quality measurements
A simple way for a technician to determine power quality in their system without sophisticated equipment is to compare voltage readings between two accurate voltmeters measuring the same system voltage: one meter being an “averaging” type of unit (such as an electromechanical movement meter) and the other being a “true-RMS (rms)” type of unit (such as a high-quality digital meter). Remember that “averaging” type meters are calibrated so that their scales indicate volts RMS, based on the assumption that the AC voltage being measured is sinusoidal. If the voltage is anything but sine wave-shaped, the averaging meter will not register the proper value, whereas the true-RMS meter always will, regardless of wave-shape.
The rule of thumb here is this: the greater the disparity between the two meters, the worse the power quality is, and the greater its harmonic content. A power system with good quality power should generate equal voltage readings between the two meters, to within the rated error tolerance of the two instruments.
Measurement and testing of supply voltage quality, according to EN 50160, requires specialized apparatus and measuring methods. This arrangement enables continuous monitoring, short time and long time, over 7 days, of the following parameters:
This type of equipment, named digital power analyzer also enables measurement of voltage dips and outages, its frequency and duration.
The RMS values of voltages and currents can be determined correctly by digital methods in any harmonic content of waveforms. Also, with the results of RMS voltage and current can calculate the apparent power. The active power may be calculated and accurately measured in any circumstances of harmonic pollution. Unfortunately this is not the case for reactive power. For reactive power can be used different definitions and methods (Arrillage et. al., 2001); (Czarnecki, 1987); (Emmanuel, 1995); (Emmanuel, 1999); (Katic, 1994):
Table 1 presents the test conditions, voltage and current, used to test the measurement performances of the reactive power measurement solutions. Table 2 presents the errors obtained for different tests using notations: H- for Hilbert transform, LPF- for low pass filter, PT-power triangle, CTD- compensated time delay.
The traditional measurement methods, like Power triangle and the Time delay, comply with international standards but show limitations in the presence of harmonics or line frequency variation.
One can observe that Hilbert method give the best results, followed by the low pass filter method and then power triangle method. So, different analyzers implemented with different formulas can give discrepancies measuring the same loads.
Table 1.
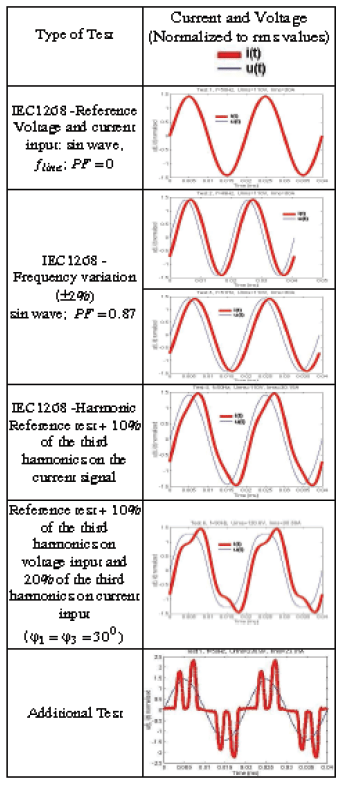
Table 2.
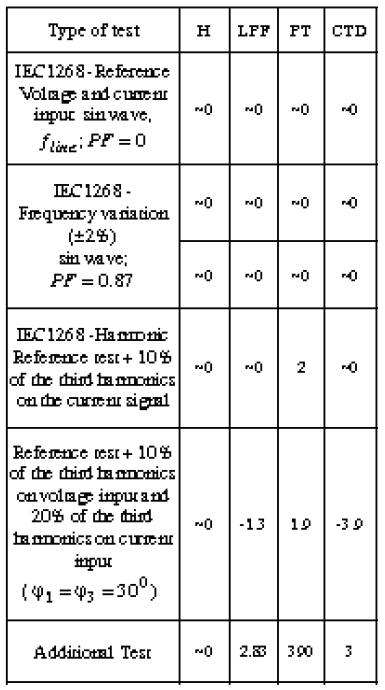
The model presented in (Vervenne et. al., 2007) is based on exponential-hyperbolic form which causes many problems in the power system quality. Also the model can describe different operations of the EAF and it does not need specific initial conditions.
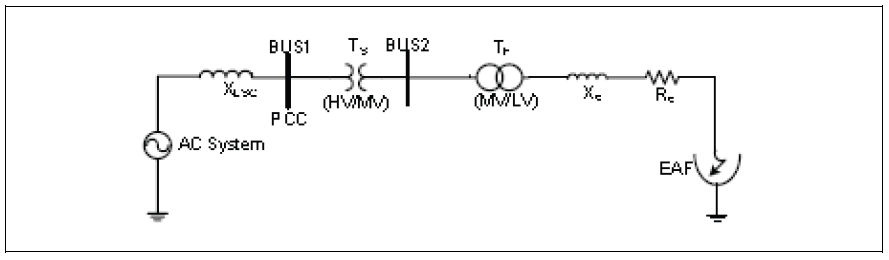
The electric diagram of a electrical circuit supplying an EAF is illustrated in Figure 6. In this figure, bus 1 is the point of common coupling (PCC) which is the supplying bus of the EAF transformer. The arc furnace is also connected to the PCC through the transformer TS, (HV/MV). In this figure, XC and RC are the reactance and resistance of the connecting cable line to the furnace electrodes, respectively. Also, XLsc is the short circuit reactance at bus PCC.
The electric arc is modeled by the following equations:
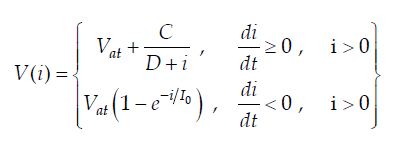
where V and i are arc voltage and current of the EAF, respectively. Also Vat is the voltage
threshold magnitude to which voltage approaches as current increases. Furthermore, I0 is
the current time constant in kA. It should be noted that the voltage Vat depends on the arc
length.
The constants C and D are corresponding to the arc power and arc current, respectively. These constants can take different values which depend on the sign of the derivative of the arc current.
As it can be seen in electric arc modeled equation, for the positive current and regarding the hysterias property of the arc, there are two cases. In the increasing current case, the hyperbolic equation and in the decreasing current case exponential equation is used. Hence, this model is called exponential-hyperbolic model. The proposed method has the capability of describing the EAF behavior in time domain using differential equation. In addition, it is able to analyze the behaviors in the frequency domain without solving the sophisticated differential equations.
Moreover, the proposed model can describe different operating conditions of the EAF such as initial melting (scrap stage), mild melting (platting stage) and refinement of the EAF. With the parameters of the system:
XLsc = 9.4245Ω, Xc = 2.356 mΩ, Rc = 0.4 mΩ, fsys = 50 Hz
and:
Vat = 200 V, Ca = 190 kW, Cb = 39 kW, Da = Db = 5 kA, Io = 10 kA
the voltage-current characteristic of the arc is obtained and shown in Figure 7. The voltage and the current of the arc are illustrated in Figure 8.
The characterization of flicker produced by an arc furnace is an extremely difficult operation (Alonso & Donsion, 2004); (Beites et. al., 2001); (Webster, 2004). The flicker is variable from one cycle to another and during melting stage very high peaks are produced. It depends on following parameters: quality and quantity of used scrap, reference operating points, quantity of injected oxygen, unpredictable consequences due to crumbling of the scrap during melting.
Consequently it is recommended to evaluate the level of flicker produced during at least one week of operation, representing several tens of operation cycles. LabVIEW and MATLAB software are used for simulation on EAF (Andrei et. al., 2006); (Andrei et. al., 2006); (Andrei et. al., 2006); (Beites et. al., 2001); (Bracale et. al., 2005); (Buzac & Cepisca, 2008).
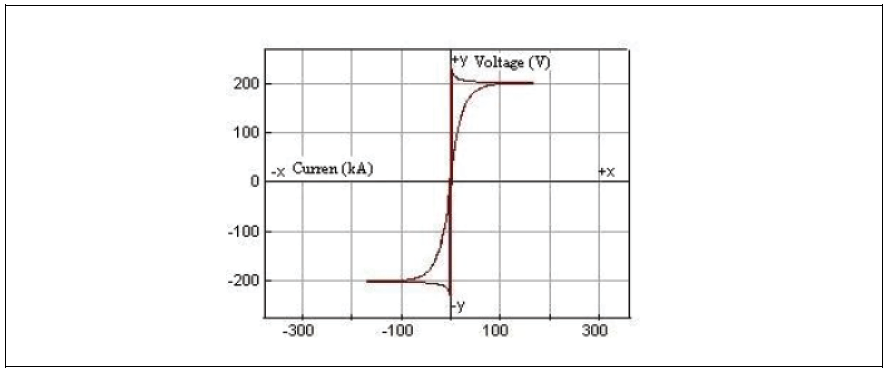
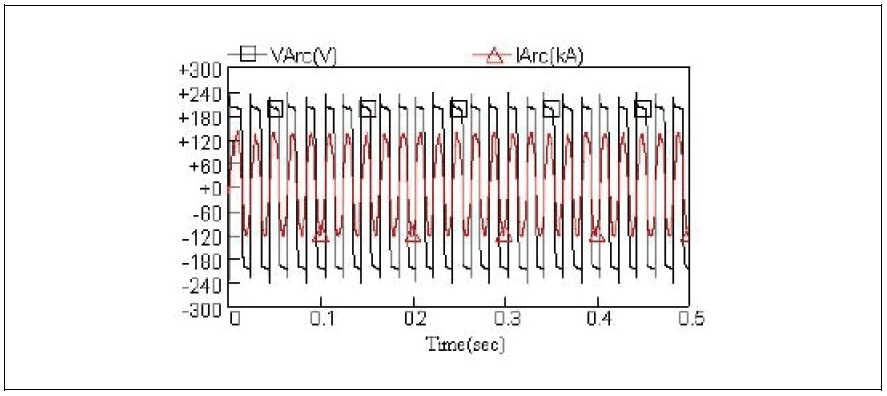
5.1 Measurement method and equipment
The three-phase power analyzer is used for the analysis of power quality with compatible software analysis. The following quantities are necessary to be measured: voltage, current, flicker (IEC 68, IEC 61000-4-15-PST and PLT), THD, waveform snapshots and harmonics up to the minimum order of 64, frequency, transient events (Chi-Jui Wu & Tsu-Hsun Fu, 2003); (Pretorius et al., 1998).
The strategy of measurements was to carry out recordings on EAF with all electrical quantities: RMS voltage, RMS current, flicker, frequency, THD voltage, THD current, current and voltage waveforms, powers kW, kVAR, kVA, power factor, voltage and current vectors for the short and long time (Cepisca et al., 2004); (Cepisca et al., 2006).
One example of measurement equipment is a multifunctional Power Quality Analyzer METREL, shown in Figure 9, one advanced instrument for measuring quality of electrical power in compliance with the EN60150. It incorporates a number of different measurement instruments for calculating various electrical parameters which is based on current and voltage measurements.

5.2 Results of the measurements in a real electric installation of EAF
The electrical power networks of arc furnaces are presented in Figure 10 (Cepisca et al., 2008).
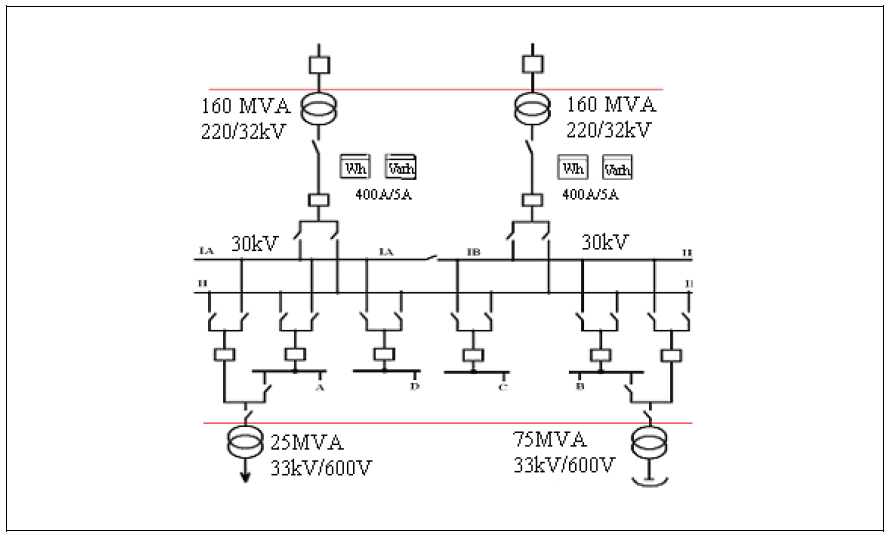
5.2.1 The real measurements of voltage and current harmonics, and of the powers
Figure 11 presents the current (a), the voltage (b) and Figure 12 presents the powers for a technological cycle of arc furnace. This cycle presents two phases: melting phase (6-8 minutes) and phase of stable arc burning (12-15 minutes). The electrical quantities are strong variation in the melting phase, with an important voltage fall. In the phase of stable arc burning the variation of electrical quantities are more reduced (Cepisca et. al., (2007); (Grigorescu et al., 2006); (Grigorescu et al., 2009); (***PE, 2004).
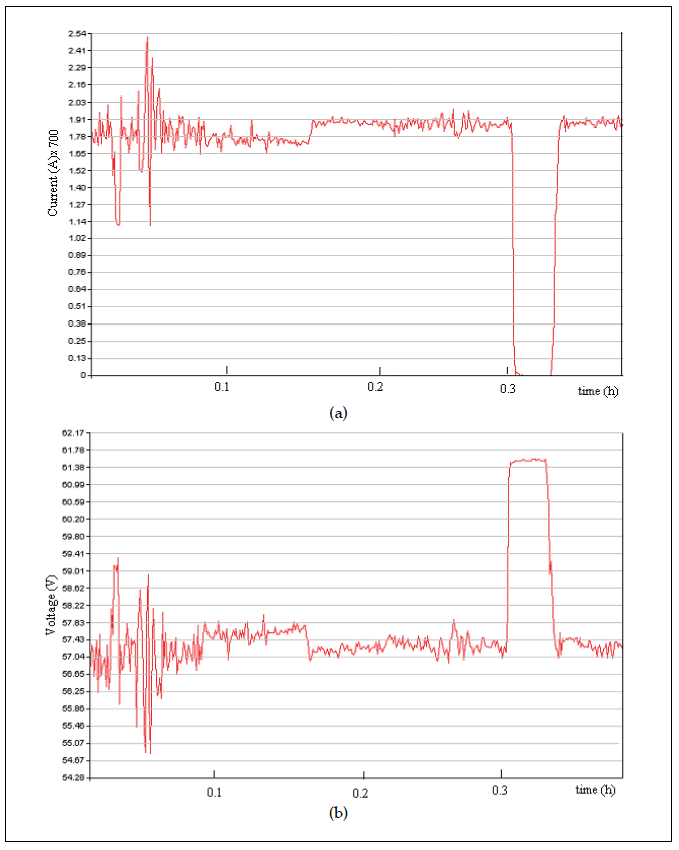
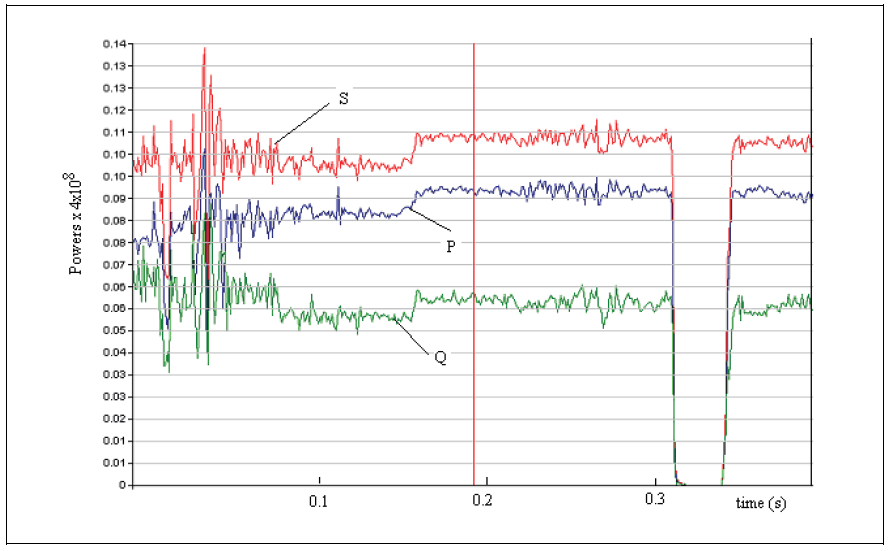
5.2.2 The real measurements of wave forms of voltage and current, and of the THDU and THDI for melting phase of the technological cycle of arc furnace
As regard to the wave forms of the voltages, shown in Figure 13, a, and, respectively the wave forms of the currents shown in Figure 13, b, on the 30 kV voltage supply line in the melting phase is found a strong distortion of currents.
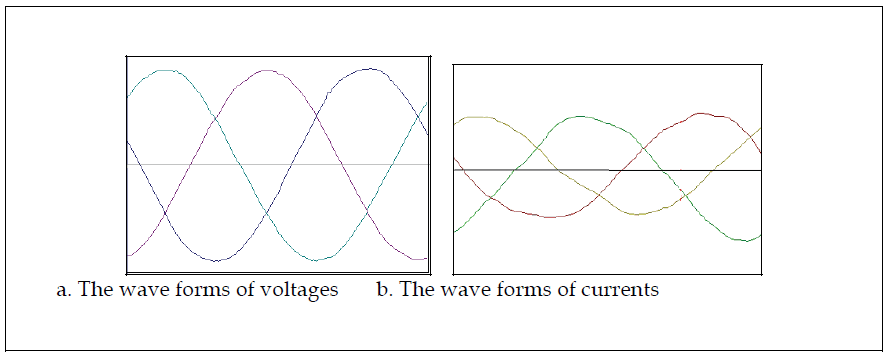
The Figure 14 presents: (a) the total harmonic distortion calculated for voltages (THDU, 2,8…3%), and (b) the total harmonic distortion calculated for the currents (THDI, 10….11%).
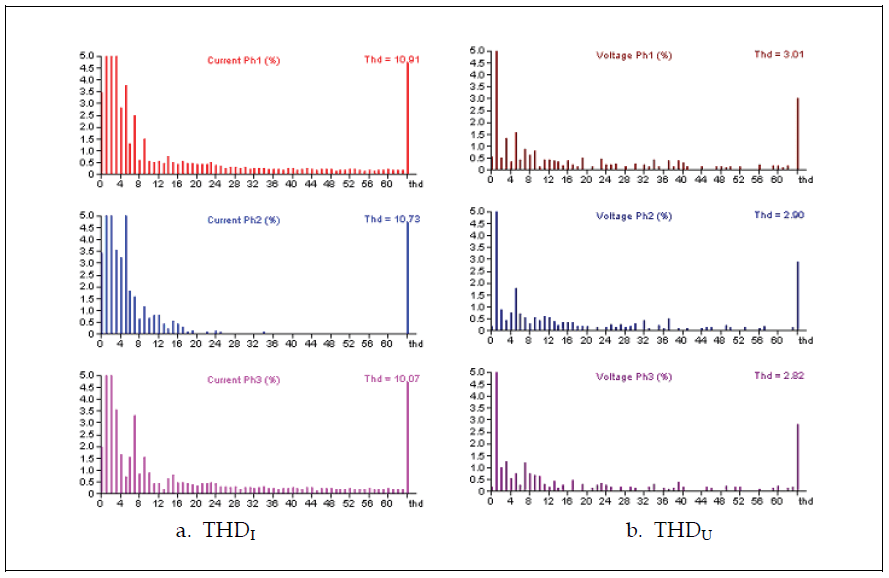
5.2.3 The real measurements of wave forms of voltage and current, and of the THDU and THDI in the phase of arc burning of the technological cycle of arc furnace
In the phase of the electric arc stable burning (Figure 15, a, and b), that appears towards the final of the heat’s making, is found that the distortion that appear in the currents and voltages wave forms are more reduced. In this phase, the amplitude of the three phase currents and voltages are closer as value, fact which shows that the load impedance is more balanced.
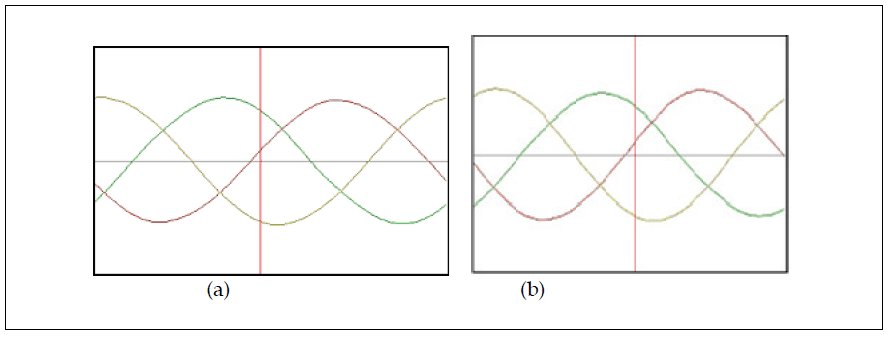
The TDH for voltages and for currents in the arc stable phase are presented in Figure 16, a, and b. We observe that in the arc stable phase the THDU is reduced (1…2%) and THDU are an acceptable value (4…5%). One can reach to the conclusion that the deformation of the current and voltage waves is smaller in the stable burning phase also by the fact that the distorting power is smaller in this phase, in conditions where the apparent, active and reactive power is higher.
As regard the voltage on the 30 kV line, in the melting phase one can observe the presence of the important harmonics while in the oxidation phase is found practically only the presence of the fundamental. In the current’s case, the important values of harmonics demonstrate that in this phase the current is strongly deformed.
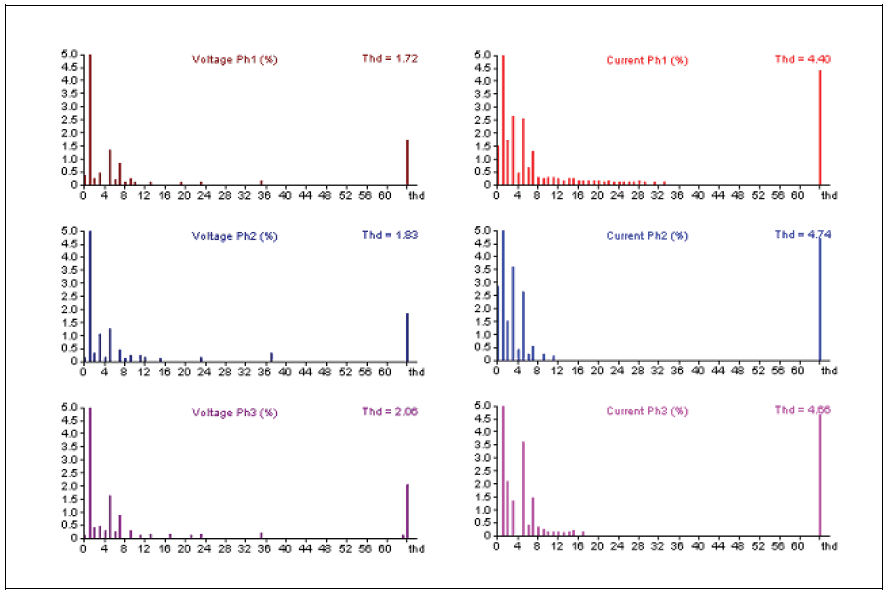
The variation form of powers measured values presented on the heat time presents in the first period, corresponding to the melting phase, a smaller apparent power. The electrodes are more lifted-up, in order to ensure protection against breaking and this determining a smaller value current. In the stable phase the apparent power is approximately constant and higher than in the melting phase. The variation of the voltage, as well as of the arc current, is reflected partially in the variation of active and reactive powers during the heat.
5.2.4 The variation of the THDU and THDI, and the variation of the power factor
The THDU and THDI (Figure 17) are higher in the melting phase than in the stable burning phase, bat the reactive power is higher in the stable phase than in the melting phase.
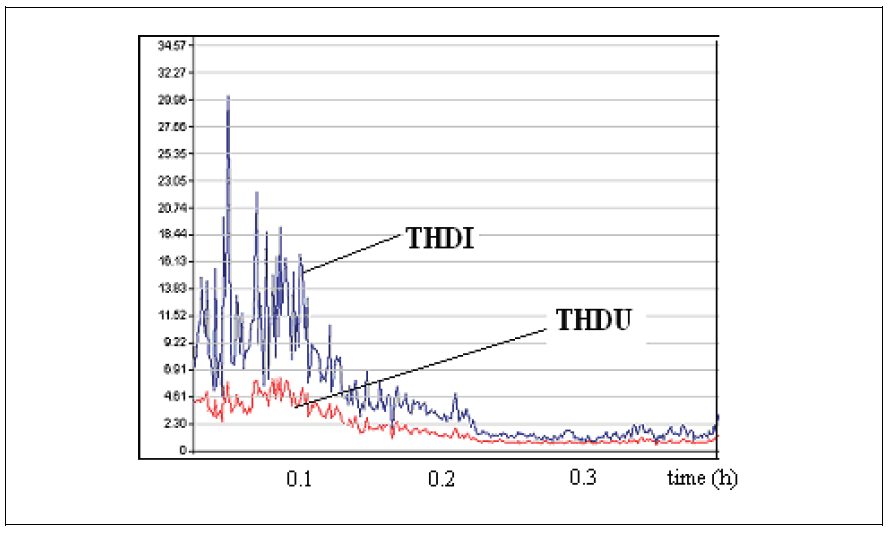
The power factor value (Figure 18) is higher in the stable arc phase and lower during the melting phase. For this reason results that on the 30 kV line the currents wave is more distorted than the voltages wave.
In different moments of technological process, following the measurements, were obtained values for THDI within 1-21% for current and 1-6% for voltage. Comparing these values with the standard results that the furnace is not matched in the national and international standards.
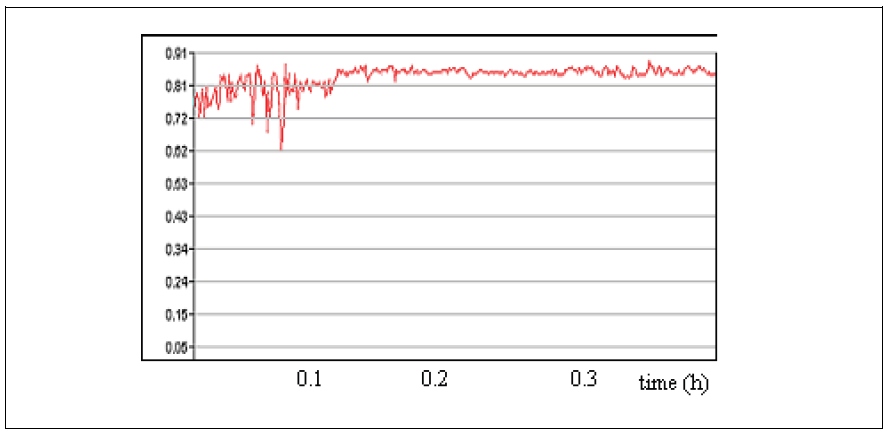
Alonso, M. & Donsion, M. (2004). An Improved Time Domain Arc Furnace Model for Harmonic Analysis, IEEE Transaction on Power Delivery, 19(1), 2004, 367-373
Arrillage, J.; Watson, N. & Chen, S. (2001). Power System Quality Assessment, John Wiley & Sons, New York
Andrei, H.; Spinei, F.; Cepisca, C. & Caciula, I. (2006). 3-D mathematical model of the power factor in electro-energetical systems, Proceedings of VI World Energy System Conference, pp. 257-261, Torino, Italy, July 10-12, 2006
Andrei, H.; Cepisca, C.; Chicco, G.; Dascalescu, L.; Dogaru, V. & Spinei, F. (2006). LabVIEW measurements in steady state nonsinusoidal regime, WSEAS Transactions on Circuits and Systems, 11 (5), 2006, 1682-1687
Andrei, H.; Cepisca, C. & Spinei, F. (2006). The modelling of the power factor in steady state non sinusoidal regime with Mathcad techniques, Proceedings of IEEE-TTTC International Conference on Automation, Quality and Testing, Robotics AQTR THETA 15- Tome I, pp. 58-62, Cluj Napoca, Romania, May 25-28, 2006
Beites, L. F.; Mayordomo, J. G.; Hernandes, A. & Asensi, R. (2001). Harmonics, Inter harmonic, unbalances of arc furnaces: a new frequency domain approach, IEEE Transactions on Power Delivery, 16(4), 2001, 661-668
Bracale, A.; Carpinelli, G.; Leonowicz, Z.; Lobos, T. & Rezmer, J. (2005). Waveform distortions due to AC/DC converters feeding, Proceedings of International Conference Electrical Power Quality and Utilization, pp. 130-136, Cracow, Poland, June, 1-2, 2005
Buzac, E. & Cepisca, C. (2008). The importance of accurate measurement of electrical energy and the performance of modern electricity meters, OIML Bulletin, vol. XLIX, no.1, 2008, Paris, 5
Cepisca, C; Andrei, H.; Ganatsios, S. & Grigorescu, S. (2008). Power quality and experimental determinations of electrical arc furnaces, Proceedings the 14th IEEE Mediterranean Electrotechnical Conference – MELECON, vol. 1 and 2, pp. 546-551, Ajaccio France, May 5-7, 2008
Cepisca, C.; Ganatsios, S.; Andrei, H.; Cepisca, C. I.; Dogaru, V. & Lefter, E. (2004). The measurements of electrical nonsinusoidal signals, The Scientific Bulletin of University of Pitesti, Romania, Metrology, Measurements system and quality, 1, 2004, 22 -26
Cepisca, C.; Grigorescu, S. D.; Seritan, G.; Banica, C. & Argatu, F. (2006). Experimental results of harmonic pollution in the electric networks by the electric arc furnaces, Proceedings of the 5th International Symposium Advanced Topics in Electrical Engineering-ATEE, pp. 34 40, Bucharest, Romania, November 14-16, 2006
Cepisca, C.; Covrig, M.; Grigorescu, S. D.; Predescu, C.; Banica, C. & Argatu, F. (2007). Harmonic pollution in the electric networks by the electric arc furnaces. Experimental results, Proceedings of 7th WSEAS/IASME International Conference on Electric, Power Systems, High Voltage, Electric Machine – POWER’07, pp.233-238, Venice, Italy, April 20-22, 2007
Chi-Jui Wu & Tsu-Hsun Fu (2003). Data compression applied to electric power quality tracking of arc furnace load, Journal of Marine Science and Technology, vol.11, no.1, 2003, 39-47.
Czarnecki L. S. (1987). What is wrong with Budeanu’s concept of reactive and distortion power and why it should be abandoned. IEEE Transaction on Instrumentation and Measurement, IM-36 (3), 1987, 345-352 Emmanuel, A.E. (1995). On the assessment of harmonic pollution, IEEE Transaction on Power Delivery , vol. 10 (3), 1995, 1693-1698
Emmanuel, A. E. (1999). Apparent power definition for three-phase systems. IEEE Transactions on Power Delivery, 14 (3), 1999, 762-772
Filipski, P.S.; Baghzouz, Y. & Cox, M.D. (1994). Discussion of power definitions contained in the IEEE dictionary, IEEE Transaction on Power Delivery, vol. 9 (3), 1994, 1237-1244
Fuchs, E. F. & Masoum, M.A.S. (2008). Power Quality in Power Systems and Electrical Machines, Elsevier Academic Press, Amsterdam
Grigorescu, S. D.; Cepisca, C.; Potirniche, I.; Ghita, O. & Covrig, M. (2009). Numerical simulations for energy calculation in power measurements, Proceedings of the European Computing Conference (ECC09) and Proceedings of the 3rd International Conference on Computational Intelligence (CI09), pp.152-158, Tbilisi, Georgia, June, 20-22, 2009
Grigorescu, S.D.; Cepisca, C. & Ghita O. (2009). Strategies for energy quality monitoring in decision-making networks nodes, Proceedings of 5th International Conference Metrology&Measurement Systems – METSIM, pp. 174-178, Bucharest, Romania, 14-15 November, 2009
Hernandez, A.; Mayordomo, J.G.; Asensi, R. & Beites, L.F. (2005). A Method Based on Interharmonics for Flicker Propagation Applied to Arc Furnaces, IEEE Transactions on Power Delivery, 20(3), 2005, 2334-2342
Hurst, R. (1994). Power Quality and Grounding Handbook, The Electricity Forum, Toronto, Canada
Katic, V. (1994). Network harmonic pollution – A review and discussion of international and national standards and recommendations, Proceedings of Power Electronic Congress- CIEP, pp. 145-151, Paris, France, October 24-26, 1994
Key, T.S. & Lai, J.S. (1997). IEEE and international harmonic standard impact on power electronic equipment design, Proceedings of International Conference Industrial Electronics, Control and Instrumentation -IECON, pp. 430-436, London, England, May, 25-27, 1997
Lazaroiu, C. & Zaninelli, D. (2010). DC arc furnace modeling for power quality analysis, Scientific Bulletin of Politehnica University of Bucharest, Serie C, vol.72, Issue 1, 2010, 56-62
Math, H. J.; Bollen, Irene. & Yu-Hua Gu. (2006). Signal Processing of Power Quality Disturbances, Wiley-Interscience, New York
Pretorius, J.H.C.; Van Wyk, J. D. & Swart, P.H. (1998). An evaluation of some Alternative Methods of Power Resolution in a Large Industrial Plant, Proceedings of the Eights International Conference on Harmonics and Quality of Power-ICHQP-VIII, pp. 331-336, Athens, Greece, vol. I, October, 7-8, 1998
Hooshmand, R.A. & Esfahani, M.T. (2009). Optimal Design of TCR/FC in Electric Arc Furnaces for Power Quality Improvement in Power Systems, Leonardo Electronic Journal of Practices and Technologies, Issue 15, 2009, 31-50
Sankaran, C. (2008). Power Quality, CRC Press, London
Toulouevski, Y.N. & Zinurov, I.Y. (2010). Innovation in Electric Arc Furnaces, Springer- Verlag, Berlin, Heidelberg
Vervenne I.; Van Reuse K. & Belmans R. (2007). Electric Arc Furnace Modeling from a Power Quality Point of View, pp. 1-6, Proceedings of IEEE Conference on Electrical Power Quality and Utilisation, Lisbon, Portugal, September, 21-23, 2007
Webster, J. G. (2004). Electrical measurement, Signal processing and Displays, CRC Press, New York
***IEC. (1999). IEC 61000-4-30, Testing and measurement techniques-power quality measurement method
***IEEE. (1995). IEEE 1159:1995, IEEE recommended practice for monitoring electric power quality
***IEEE-WG. (1996). IEEE Working Group on Nonsinusoidal Situations. (1996). Practical Definitions for Powers in Systems with Nonsinusoidal Waveforms and Unbalanced Loads, IEEE Transactions On Power Delivery, vol. II, no. 1, 1996, 79-101
***IEEE. (1996). IEEE 100-1996 The IEEE Standard Dictionary of Electrical and Electronics Terms, Sixth Edition
***PE. (2004). PE 143/2004, Romanian norm for limitation of harmonic pollution and unbalance in electrical networks
***SREN. (1998). SREN 50160, Characteristics of supplied voltage in public distribution networks, October, 1998
***EN. (2004). Standard EN50160-Power Quality Application Guide, Voltage Disturbance, July 2004.
***CMP. (1987). Understanding electric arc furnace operations for steel production, Center for Metals Production-CMP, vol.3, no.2, 1987
