Published by Electrotek Concepts, Inc., PQSoft Case Study: General Reference Common Power Quality Problems and Solutions, Document ID: PQS0315, Date: July 18, 2003.
Abstract: Power quality is a frequently used term that means different things to different people. Common power quality problems include all of the issues that arise from the incompatibility between a utility’s power and the customer’s energy-using equipment that result in impaired operation. These include transients, sags and swells, harmonics, and short- and long-term voltage variations and outages. Also included under this broad area are issues of power reliability.
This document provides a brief summary of common power quality problems and solutions.
COMMON POWER QUALITY PROBLEMS AND SOLUTIONS
Power quality is a frequently used term that means different things to different people. Common power quality problems include all of the issues that arise from the incompatibility between a utility’s power and the customer’s energy-using equipment that result in impaired operation. These include transients, sags and swells, harmonics, and short- and long-term voltage variations and outages. Also included under this broad area are issues of power reliability.
Power quality variations occur when the voltage waveform supplied to the customer deviates from normal. These deviations may involve changes in the voltage level (rms variations), changes in the voltage sinusoidal shape (harmonics, notching, and transients), or loss of power altogether (interruptions and outages). To some extent, the power system is constantly experiencing power quality variations because the supplied voltage is never a perfect sinusoid. When these variations are so significant, however, that customer equipment is adversely affected; the quality of service supplied becomes an issue that should be investigated. In addition, the current trend toward more energy efficient electronic devices has greatly increased the sensitivity of customer load equipment. As a result, power variations that once went unnoticed now result in mis-operation of customer devices. The impact of these power quality related problems can vary significantly. For example, a VCR could miss recording a program or a semiconductor manufacturer could lose product worth hundreds of thousands of dollars during the same momentary interruption event. Events such as these adversely affect all involved parties. The customer must absorb the initial economic impact of the power quality disturbance, but the electricity supplier and the public are affected economically in the long run as well.
Characterizing the Power Quality Environment
The relative importance of a particular category of power quality phenomena for a specific customer will depend on the type of installed electrical equipment. The type of interaction between customer equipment and the power quality phenomena – equipment damage, equipment/process trip, compromised product quality, etc. – and the frequency at which it occurs or could be expected to occur are also critical factors in the evaluation process once the cause has been identified. The range of power quality phenomena is defined by IEEE Std. 1159, Recommended Practice for Monitoring Electric Power Quality.
Approaches for resolving equipment or process problems related to each category of phenomena vary widely. Causes, impacts, and appropriate solutions for this range of electrical phenomena have been analyzed in numerous research and study efforts, resulting in the development of proven solution techniques for many common power quality problems. These efforts have also contributed to a prioritization of the power quality phenomena categories. From the customer’s point of view, the problem categories that are most important are those that:
have the highest negative impact on productivity, or
are difficult to diagnose and characterize, or
are more difficult and/or expensive to resolve.
Using these criteria, research and case study investigations have identified the following categories of power quality phenomena to be of highest importance to customers:
rms voltage variations, especially sags and interruptions
transients, especially utility capacitor switching transients
harmonic distortion , especially resonance conditions
This does not mean that there are never problems associated with other categories of power quality phenomena. Experience does indicate, however, that the majority of problems (especially from the custom’s perspective) are those listed above.
RMS Voltage Variations
Most customers recognize that electric power outages can never be cost-effectively eliminated. Distribution system reliability in the United States is very high, reflecting the fact that actual electric service interruptions are very infrequent, perhaps just once or twice per year. Voltage variations of short duration are not as well understood and do occur with a much higher frequency that actual service interruptions. Sometimes the duration is so short as to be almost imperceptible to the naked eye. However, modern process equipment and processes are more discerning than the naked eye, and will misoperate or even shut down in response to such voltage variations. This reaction, coupled with the relatively high rate of occurrence and the general high cost and complexity of typical solutions, make short term voltage variations one of the most, if not the most, important categories of power quality phenomena from the customer’s point of view.
IEEE Std. 1346, IEEE Recommended Practice for Evaluating Electric Power System Compatibility with Electronic Process Equipment, and IEEE Std. 1250, IEEE Guide for Service to Equipment Sensitive to Momentary Voltage Disturbances provide guidance for evaluating the impact of rms variation events on customer systems.
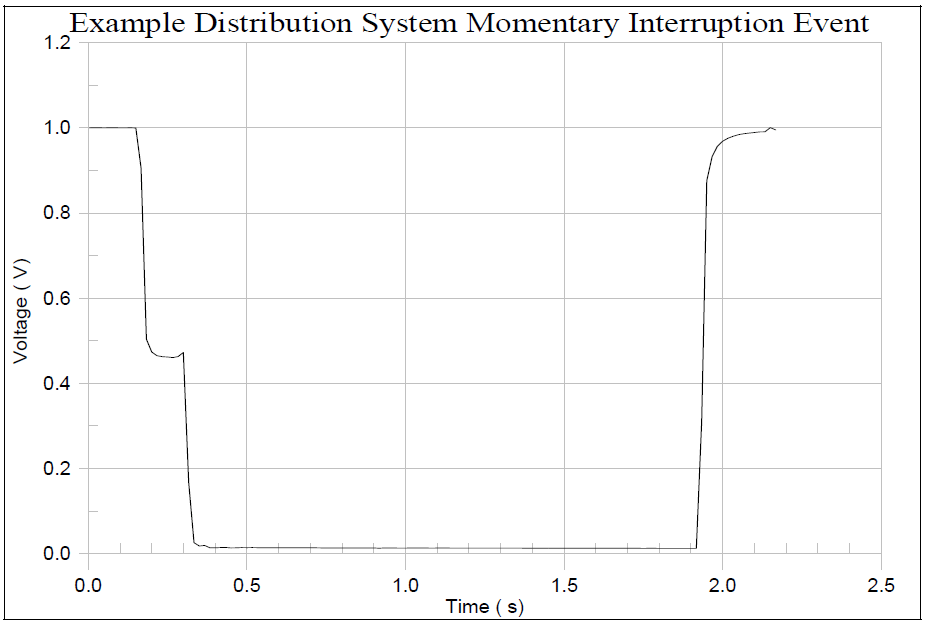
Figure 1 illustrates an example of a distribution system momentary interruption event. This waveform was recorded with a power quality disturbance analyzer.
Figure 1 – Example Distribution System Momentary Interruption Event
Transients
Transient overvoltages caused by switching operations or lightning strikes to electric facilities have significant potential to damage electric power equipment or disrupt operation. High-frequency transients (most impulsive transients and low- and medium-frequency oscillatory transients) have been recognized from some time as a threat to electronic equipment, and have been blamed for a wide range of failures and misoperations. Fortunately, these transients are relatively easy to protect against, and a wide range of off-the-shelf and inexpensive transient voltage surge suppressor (TVSS) products can be applied by either the customer or equipment manufacturer.
Low frequency oscillatory transients, on the other hand, are more difficult to treat. Switching (energizing) of utility shunt capacitor banks is the most common source of low-to-medium frequency transients on the electric power system. Unlike the other subcategories of transient phenomena, these are usually of modest magnitudes but contain substantial energy, so their effects can be felt quite far electrically from the point of origin. Low frequency transients have been strongly correlated with nuisance tripping of power electronic equipment, especially common types of adjustable-speed drives.
IEEE Std. 1036, Guide for the Application of Shunt Power Capacitors, provides a helpful overview to utility capacitor switching.
Figure 2 illustrates an example of a distribution bus voltage during a utility capacitor energizing event. The resulting overvoltage is approximately 1.35 per-unit (135%). Typical magnitudes for this type of event range from 1.2 to 1.8 per-unit and the resulting energizing frequencies generally fall in the range from 300 to 1000 Hz. This transient waveform was recorded with a power quality disturbance analyzer.
Figure 2 – Example Utility Capacitor Energizing Event
Harmonic Distortion
Harmonics are probably more strongly associated with power quality than any other category. It is somewhat surprising to those only casually involved in power quality that harmonics are not a chronic problem that the typical customer must deal with. Harmonics can cause equipment to misoperate, capacitor banks to fail, breakers to trip mysteriously, but in general, the electric power system has the ability to absorb substantial amounts of harmonic current with surprisingly little or no impact on connected equipment. Real problems from harmonics are usually confined to locations with high amounts of nonlinear, harmonic current-producing loads. Examples of this include a wastewater treatment plant where the entire load may be comprised of adjustable-speed motor drives powering pumps, or situations where power factor correction capacitors on the customer system or at the utility distribution level create resonances that amplify the effects of nonlinear loads. The fraction of electric power system load that produces harmonics currents has steadily increased over the past two decades.
IEEE Std. 519, IEEE Recommended Practice and Requirements for Harmonic Control in Electric Power Systems includes guidelines on establishing and using harmonic voltage and current limits on the power system. The basic philosophy of the standard is that the customer is responsible for limiting the amount of harmonic currents injected onto the overall power system and the utility is responsible for avoiding conditions on the power system that could create unacceptable voltage distortion levels (e.g., resonance).
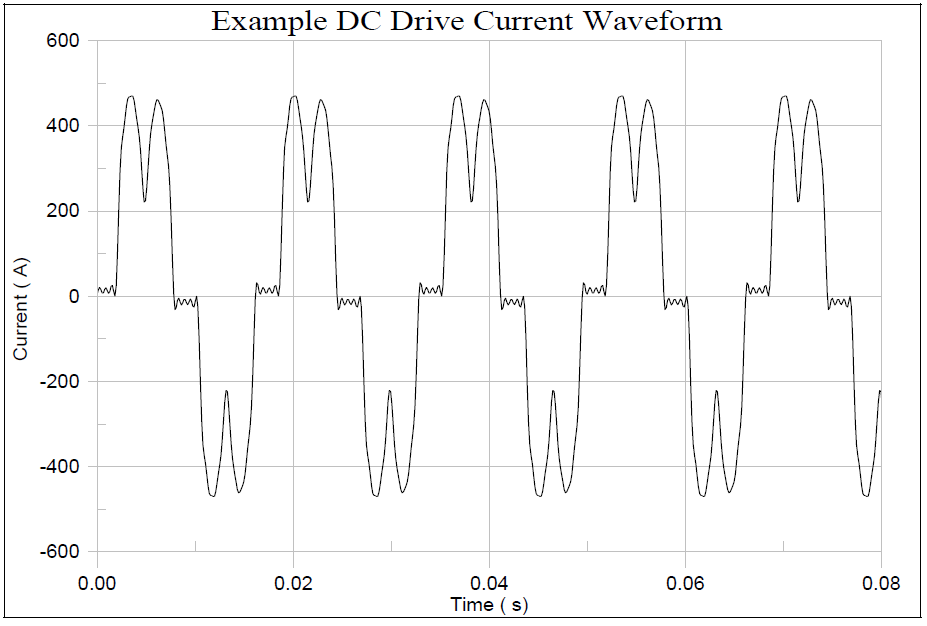
Figure 3 illustrates an example of a dc drive current waveform. This waveform was simulated using Electrotek’s SuperHarmTM program.
Figure 3 – Example DC Drive Current Waveform
Economic Impacts of Power Quality
The ultimate reason that we are interested in power quality is economic value. There are economic impacts on utilities, their customers, and suppliers of load equipment. The quality of power can have a direct economic impact on many industrial consumers. There has recently been a great emphasis on revitalizing industry with more automation. This usually means electronically controlled, energy-efficient equipment which is often much more sensitive to deviations in the supply voltage than its electromechanical predecessors (e.g., adjustable-speed drives vs. induction motors). Thus, like the blinking clock in residences, industrial customers are now more acutely aware of minor disturbances on the power system. There can be significant costs associated with these disturbances. For example, it is conceivable for a single, commonplace, momentary utility breaker operation to result in a $10,000 loss to an average-sized industrial customer by shutting down a production line that requires four hours to restart.
The electric utility is concerned about power quality issues as well. Meeting customer expectations and maintaining customer confidence is a strong motivator. With today’s movement toward competition between utilities, it is more important than ever. The loss of a dissatisfied customer to a competing power supplier can have a very significant impact financially on a utility. Load equipment suppliers generally find themselves in a very competitive market with most customers buying on lowest cost. Thus, there is a general disincentive to add features to the equipment to withstand common disturbances unless the customer specifies otherwise. Many manufacturers are also unaware of the types of disturbances that can occur on power system.
The primary responsibility for correcting inadequacies in load equipment ultimately lies with the customers that must purchase and operate it. Specifications must include power performance criteria. Since many customers are also unaware of the pitfalls, one useful service that utilities can provide is dissemination of information on power quality and the requirements of load equipment to properly operate in the real world.
Factors that Influence Costs
Besides the obvious financial impacts on both utilities and industrial customers, there are numerous indirect and intangible costs associated with power quality problems. Residential customers typically do not suffer direct financial loss or the inability to earn income because of most power quality problems, but they can be a potent force when they perceive that the utility is providing poor service. The sheer number of complaints requires utilities to provide staffing to handle them. In addition, public interest groups frequently intervene with public service commissions, requiring the utilities to expend financial resources on lawyers, consultants, studies and the like to counter the intervention. While all of this is certainly not the result of power quality problems, a reputation for providing poor quality service does not help matters.
As with many power quality problems, an economic evaluation is often difficult to complete since it is often very difficult to determine the cost of a particular event for an individual customer. In addition, these costs may vary drastically from customer to customer. There are a number of aspects of customer production that can be affected by a power quality event, including:
Lost Production – factory costs associated with the production process being disrupted.
Scrap – costs associated with product that must be scrapped and cannot be recovered by recycling the raw materials.
Restart – costs associated with restarting the production process.
Labor – extra labor costs associated with restarting the product line, reloading machines, cleaning up scrap, etc.
Repair – costs for repair of machines and equipment damaged during the transient event.
Replacement – costs for the replacement of machinery damaged during the transient event.
Process Inefficiency – costs due to the process not begin able to run to its optimal efficiency.
Demand Charges – increased utility charges because the customer is unable to operate equipment such as capacitors and adjustable-speed drives that might reduce demand charges.
Each event that impacts a customer’s production will include a number of these costs. Predicting the exact economic impact is nearly impossible due to the large number of system parameters that can affect the characteristics of the event. It is entirely possible, however, that a single event could generate losses sufficient to justify the additional mitigation equipment expenditure.
Common Power Quality Problems and Solutions
Customers often blame utilities for most power quality problems, but the fact is that problems may originate on either side of the meter. There are four sources for most customer-encountered problems:
Natural phenomena (e.g., inclement weather)
Normal utility operations (e.g., automatic protection system operations)
Neighboring customers (e.g., welding equipment adjacent to an office)
Customer’s own equipment and facilities (e.g., motor starting).
Within a customer’s facility, poor power quality can result from incompatible equipment interactions or from poor wiring and grounding practices. In fact, many power quality problems are associated with customers’ wiring and grounding practices. Problems such as voltage sags, however, generally originate on the utility’s side of the meter. In addition, the proliferation of harmonic (nonlinear) producing loads is resulting in power quality problems for both customers and the utilities that serve them. These loads include adjustable-speed drives, electronic ballasts for fluorescent lighting, electric arc furnaces, computers distributed throughout commercial and industrial facilities, and other electronic technologies.
Identifying Power Quality Problems
The first step is to understand how customers perceive power quality problems. Customers rarely see or understand these problems. They see symptoms of them and the resulting difficulties in their businesses and homes. Some of the more common symptoms include:
Equipment damage
Blinking digital displays
Data or information loss / software glitches
Loss of instructional programming and controller timing
An abnormal number of service calls on sensitive equipment
Disk drive problems / computers re-booting
Static shock
In addition to the observed symptoms, it is important to determine the customer equipment that is affected by the power quality event. Some of the most important equipment categories to consider include:
Adjustable-speed drives – sensitivity to transient voltages
Electronic controls, adjustable-speed drives, robotics, and programmable logic controllers – sensitivity to voltage sags
Switch-mode power supplies – harmonic current generation and neutral current concerns
Fluorescent lighting (especially with electronic ballasts) – harmonic generation
Power factor correction capacitors – switching transients and magnification
Power factor correction capacitors – harmonic distortion concerns (resonance)
Motor contactors – sensitivity to voltage sags
Power conditioning equipment selection – matching to requirements of protected equipment
Data processing equipment – UPS system specification
Electronic equipment – sensitivity to high frequency transients
Transformers – harmonic heating
Motors – voltage imbalances and harmonic heating
Once information regarding the symptoms and affected equipment is collected, the power quality event causing the problem can be determined. A number of common power quality issues include:
Voltage sags due to faults on parallel circuits on the same distribution system or faults on the transmission system.
Voltage sags due to motor starting.
Momentary interruptions at industrial and commercial installations due to recloser operations on feeder circuit breakers.
Voltage flicker from arc furnace and arc welding loads.
Voltage transients caused by circuit switching and load switching within the customer facility.
Transient voltage magnification at low voltage capacitor banks.
Sensitivity of adjustable-speed drives and control systems to utility capacitor switching transients.
Transients and notching associated with power electronics equipment operation.
Coupled voltages at customer facilities due to lightning transients on the primary distribution systems.
Harmonic distortion from adjustable-speed drives or other nonlinear loads.
Transformer heating caused by harmonic current levels.
Neutral conductor overloading due to harmonic producing loads in commercial installations.
Determining Power Quality Solutions
Lessons learned from numerous research and case study projects have revealed the following fundamental steps for optimized, cost-effective solutions to power quality problems:
Identify affected equipment/process.
Identify nature of electrical disturbance affecting equipment.
Calculate or project economic impact.
Select mitigation technologies based on nature of electrical disturbance.
Determine benefit/cost ratio for solution alternatives.
Select appropriate solution based on technical and economic evaluation.
Design solution application.
Specify and procure selected solution product.
Install and commission solution equipment.
Evaluate/validate performance.
Not every step is necessarily mandatory or even applicable to every case. Sometimes the correct solution is more obvious, possibly even based on previous experience, and much of the problem identification/characterization effort can be bypassed. The procedure outlined does, however, illustrate the breadth and depth of knowledge required to maximize the chances of a cost-effective solution.
Challenges for the Customer
Unfortunately, the range of required expertise and background knowledge is almost never immediately available to a customer unless there has been a previous and substantial internal investment in building such capability. Outside organizations with the requisite experience and skill must often be enlisted.
When a problem is encountered, customers have an immediate feel for the impact on the bottom line, and sometimes may be able to trace the problem down to specific equipment components of the overall affected process. The urgency associated with resolving the problem and restoring production can lead to band-aid solutions, or worse, actions that result only in wasted effort and expense and do not improve the situation at all.
The solution process previously outlined is designed to prevent band-aids. Many of the steps and interim questions to answer can be beyond the skills and expertise of the customer. Examples of this include:
In some cases, the customer may not be able to identify affected equipment; a single observation or problem may reveal only the most sensitive link in the process chain, where a solution specific to that component would only expose other parts of the production chain when more severe disturbances occur.
While the customer most likely knows or could calculate the cost of a single event, they may not be able to project impact over time since this will relate to frequency and characteristics of electrical disturbance, for which they have no information.
A customer may not have detailed specifications or electrical requirements for components or equipment that make up their process. Respective vendors may have such information, but seeking out each of them can be a daunting task.
Customers may not be aware of the appropriate solution technologies, making them more susceptible to marketing claims from solution vendors.
Customers may not have the necessary technical and/or engineering expertise to select, design, and specify a solution.
With limited technical resources and staff that is often over utilized, there is often no evaluation or validation of a solution once commissioned.
Power quality problems may not be isolated or stand-alone. For example, combinations of problems or careful analysis of equipment/process requirements versus electric supply characteristics sometimes points to a solution different than what might be indicated for a single observed occurrence.
When a customer experiences production problems that are suspected to be related to power quality, the electric service provider (utility) and the manufacturer(s) of the affected equipment are many times the first contacts made for assistance.
Common Power Quality Solutions
The best power quality solutions are in general site-specific and potentially unique to the affected plant or process. Most problems involving one of the aforementioned power quality phenomena are difficult to resolve with off-the-shelf solution products, except for instances where the load is small in size and has no or limited interaction with other process equipment. This is, however, a trivial case, and most real problems involve a range of equipment interconnected in some fashion to constitute the process.
In applying a solution product, is it necessary to not only determine what type of technology, but also where it should be applied, in what size, and to what portions of the overall process. Sometimes determining what needs to be protected is a difficult challenge. Once determined, how and where the solution should best be applied can be a difficult proposition. The financial objective in solving power quality problems is to earn an acceptable return on investment or meet certain payback criteria.
A number of common power quality solutions include:
RMS Voltage Variations
Faults on the power system are the ultimate cause of both momentary interruptions and voltage sags. Any measures taken to reduce the likelihood of a fault will help reduce the incidence of sags and interruptions to customers. These measures can include using underground circuits, tree trimming, insulator washing, and increased application of surge arresters for lightning protection on distribution circuits.
It is possible to make the equipment being used in customer facilities less sensitive to voltage sags and momentary interruptions. Clocks and controls with low power requirements can be protected with a small battery or large capacitor to provide ride-through capability. Motor control relays and contactors can be selected with less sensitive voltage sag thresholds. Controls can be set less sensitive to voltage sags unless the actual process requires an extremely tight voltage tolerance. This solution requires coordination with equipment manufacturers but the trend seems to be in the direction of increased ride-through capability. For instance, most programmable logic controllers use switched-mode power supplies that have a ride through capability of about four cycles. Therefore, it should not be necessary to trip these controllers under short voltage sag conditions.
Power conditioning equipment can be applied at the individual loads that are sensitive to voltage sags and/or interruptions. The power conditioning requirements depend on the types of voltage sags that can be expected and the possible durations of interruptions:
Voltage sags down to approximately 60% of nominal voltage can be handled with constant voltage transformers (CVTs – also known as ferroresonant transformers).
For voltage sag protection of larger loads, magnetic synthesizers or motor-generators can be used. Magnetic synthesizers can ride through voltage sags down to about 60% of nominal and provide voltage regulation.
Motor-generator sets also help ride through voltage sag conditions due to the inertia of the motor and generator. However, standard motor-generators can only ride through a couple cycles of a complete interruption. The addition of a flywheel (increased inertia) can increase the ride through capability to 1-2 seconds. This may be sufficient to handle many momentary interruption problems.
For the most part, uninterruptible power supply (UPS) systems are required if equipment must be completely protected from interruptions. If momentary interruptions are the only problem (as opposed to long duration outages), the UPS system can be designed with minimum battery backup. Larger battery systems (to provide backup for interruptions lasting up to 15 minutes) can be designed if longer duration interruptions are anticipated.
For short duration interruptions and voltage sags (less than 2 seconds), superconducting storage devices and other power-electronic-based devices (Custom Power) are being developed to protect entire plants or portions of larger plants at the service entrance.
Starting motors can cause voltage sags and other voltage variation problems such as flicker if the motor is started frequently. Alternative starting techniques, such as autotransformer starters, resistance and reactance starters, part-winding starters, and delta-wye starters may be applied if the voltage sag during starting impacts the system or adjacent equipment
Transients
Utility capacitor switching can be a particular problem for customers that have low voltage power factor correction capacitors. These low voltage capacitors can magnify the switching transients, causing failure of arresters and electronic equipment within the facility. Using a tuned filter for shunt compensation can solve this problem.
Utility capacitor switching can also cause nuisance tripping of small adjustable-speed drives. These drives have dc capacitors that allow a current surge and resulting increase in the dc link voltage during the capacitor switching transient. The drive protection circuit trips on dc overvoltage. A series choke (or reactor or isolation transformer) can be used to solve this problem.
Most high frequency transients occurring within customer facilities do not have significant energy associated with them (e.g., less than 1 Joule). This means that equipment can be protected with simple surge protection devices (varistors, silicon avalanche diodes, etc.). It is important that the transient voltage withstand capabilities of the equipment be coordinated with the protective levels of the devices used for protection.
Power electronic devices and other electronic equipment can be sensitive to the transient voltage rate-of-rise as well as the magnitude. These devices can be protected with a series filter (choke) in addition to standard surge protectors. Many hybrid types of surge protectors include a series choke for this purpose.
Lightning transients can be a particular problem for customer equipment. Lightning surge currents being conducted to ground create a ground potential rise (GPR) that can cause significant ground potential differences between different locations within a facility. When proper grounding practices are followed, this should not be a safety hazard. However, the ground potential differences can cause problems with communications and data processing equipment that has multiple ground references. Sometimes, only optical isolation can prevent these problems.
Low voltage side current surge phenomena is a particular concern for residential customers. Currents in the transformer secondary winding during lightning surges also flow through the customer loads. Efforts to protect the transformer can make the surge at the customer service more severe. A coordinated approach involving secondary arresters at the pole and the service entrance is required to solve this problem.
Harmonic Distortion
Almost all harmonic distortion problems occur when a resonant frequency exists near the 5th or 7th harmonic (11th or 13th harmonics can also be a problem if a large percentage of the load is nonlinear). Simple calculations can often be used to determine the system resonant frequencies. Existence of resonances near characteristic harmonic frequencies of loads that have been identified as harmonic sources is an early indication of potential trouble. If a harmonic resonance is discovered, possible solutions include
Ungrounding wye-connected capacitor banks (this is often used to solve telephone interference problems).
Changing capacitor bank sizes and/or locations (this is often one the least expensive options for both utilities and industrial customers).
Adding a reactor to an existing capacitor bank (has the effect of detuning the system).
Adding a harmonic filter bank – The most common filter is a single-tuned passive filter. The passive shunt filter works by short-circuiting the harmonic currents as close to the source of distortion as practical. This keeps the currents out of the supply system and alters the resonant frequency of the system.
Controlling the capacitor switching scheme to avoid the resonance.
Harmonic distortion can also be reduced with the application of active filters. Active filters work by electronically supplying the harmonic component of the current into a nonlinear load.
Harmonic currents magnitudes for a number of nonlinear customer loads can be reduced with the addition of a series choke.
Transformer connections can be used to reduce harmonic currents in three-phase systems. Phase-shifting half of the 6-pulse power converters in a plant load by 30 degrees can approximate the benefits 12-pulse loads by reducing the 5th and 7th harmonic currents. Delta-connected transformers can block the flow of zero-sequence harmonics (typically triplens) from the line. Zigzag and grounding transformers can shunt the triplens off the line.
Harmonic control on distribution feeders can often be achieved with the installation of a number of distributed harmonic filters near the end of the feeders.
REFERENCES
IEEE Standard 100. Terms and Definitions IEEE Standard 1100. IEEE Recommended Practice for Powering and Grounding Sensitive Equipment (The Emerald Book). IEEE Standard 1159. IEEE Recommended Practice on Monitoring Electric Power Quality.
RELATED STANDARDS IEEE Standard 1159 IEEE Standard 1346 IEEE Standard 1250 IEEE Standard 1036 IEEE Standard 519
GLOSSARY AND ACRONYMS ASD: Adjustable-Speed Drive CVT: Constant Voltage Transformer GPR: Ground Potential Rise IEEE: Institute of Electrical and Electronics Engineers MOV: Metal Oxide Varistor PWM: Pulse Width Modulation TVSS: Transient Voltage Surge Suppressors UPS: Uninterruptible Power Supply VCR: Video Cassette Recorder
Published by Mirus International Inc., [2010-01-08] MIRUS-FAQ001-B2, FAQ’s Harmonic Mitigating Transformers, 31 Sun Pac Blvd., Brampton, Ontario, Canada. L6S 5P6.
K-Rated transformers made their appearance several years ago as a means of preventing transformers from failing when subjected to heavy non-linear loading. They are essentially ‘beefed up’ transformers with extra steel in their cores and copper in their windings to allow for better dissipation of the excessive losses produced by harmonic currents. They are not designed to cancel harmonics or their fluxes and therefore, do nothing but protect themselves from overheating. Harmonic losses are normally not significantly reduced and voltage distortion will typically remain quite high under more heavily loaded conditions. To improve power quality in the form of reduced voltage distortion and to save energy costs, the use of a transformer designed to cancel harmonics is necessary.
Over-sizing neutrals, on the other hand, can be a reasonably low cost method for the prevention of neutral conductor overheating. It is important to remember that the non-linear loads are the source of the harmonic currents. They must flow from the loads back to the transformer. Because the 3rd and 9th current harmonics created by the 120 VAC switch-mode power supplies are flowing back on the neutral, the neutral current is usually larger than the phase currents (learn more). This is of minimal consequence provided the neutral has suitable ampacity to carry the extra current and the 120/208V 4-wire run length is not too long.
A point of caution. When selecting phase and neutral conductor sizes in a non-linear load application, the electrical code requires that an ampacity adjustment or correction factor be applied. This is because the neutral conductor is considered to be a current carrying conductor along with PhA, PhB and PhC. With more than 3 current carrying conductors in a conduit or raceway, a 0.8 factor must be applied.
To minimize harmonic problems in new installations, avoid the old approach of using a large central transformer with a 120/208V secondary and long 4-wire risers or radial runs through the building. The impedances of these long runs are high so that harmonic currents flowing through these impedances will create high levels of voltage distortion and neutral-to-ground voltage. To prevent these problems, an effective rule of thumb is to limit each 120/208V run length to that which would produce a 60Hz voltage drop not greater than 1/2% to 3/4%. For a typical 200 amp feeder this would be < 50 ft.
Combining the use of Harmonic Mitigating Transformers with short 120/208V feeder runs and double ampacity neutrals will ensure compatibility between the distribution system and the non-linear loads. Generally this will keep voltage distortion safely below the maximum of 5% as recommended for sensitive loads in IEEE Std 519-1992.
Harmonics and Harmonic Mitigating Transformers (HMT’s) Questions and Answers
This document has been written to provide answers to the more frequently asked questions we have received regarding harmonics and the Harmonic Mitigating Transformer technology used to address them. This information will be of interest to both those experienced in harmonic mitigation techniques and those new to the problem of harmonics. For additional information visit our Website at www.mirusinternational.com.
Power quality is commonly defined as the power grid’s ability to supply a clean and stable power flow as a constantly available power supply. The power flow should have a pure sinusoidal wave form and it should remain within specified voltage and frequency tolerances. Why is good power quality necessary?
Power quality is commonly defined as the power grid’s ability to supply a clean and stable power flow as a constantly available power supply. The power flow should have a pure sinusoidal wave form and it should remain within specified voltage and frequency tolerances. No real-life power source is ideal.
In today’s electrical networks, deviations from these ideal conditions are frequent due to increasing non-linear and other loads disturbing the grid. Power generation is also becoming more complex with new players and technologies entering the business, which used to be a fairly stable operating environment. All this adds new challenges to power grid operators.
The consequences of insufficient power quality can inflict serious losses on business and economy. In the worst-case scenario, it may pose a threat to human life in mission critical applications and highly sensitive environments, such as hospitals.
Good power quality saves money and energy. Direct savings to consumers come from lower energy cost and reactive power tariffs. Indirect savings are gained by avoiding circumstances such as damage and premature aging of equipment, loss of production or loss of data and work. Power quality can affect the overall company performance, which is a fact easily overlooked by the management.
Published by Electrotek Concepts, Inc., PQSoft Case Study: General Reference – Power Quality Glossary, Document ID: PQS0305, Date: January 27, 2003.
Abstract: The document provides a glossary of terms related to power quality analysis and measurements.
POWER QUALITY GLOSSARY
Glossary
Active Filter: A power electronics-based device configured with controls to provide cancellation of harmonic current components created by nonlinear loads.
Area of Vulnerability: Defined with respect to the voltage sag sensitivity of a particular end user or equipment, this is the area of the power system where a fault can cause misoperation of the end user equipment.
Average Maximum Demand Load Current (IL): Maximum load current expected for an end user at the point of common coupling. IEEE Standard 519-1992 recommends that this current be calculated as the average of the maximum demand currents for a twelve-month period.
Capacitor Switching Voltage Magnification: The phenomena where the transient voltage during energizing of a capacitor bank is magnified at a lower voltage capacitor bank due to system resonance conditions.
Common Mode Voltage: The noise voltage that appears equally and in phase from each current-carrying conductor to ground.
Commercial Power: Electrical power furnished by the electric power utility company.
Constant Voltage Transformer (CVT): A ferroresonant transformer used for voltage regulation in single-phase applications.
Coupling: Circuit element or elements, or network, that may be considered common to the input mesh and the output mesh and through which energy may be transferred from one to the other.
Current Transformer (CT): An instrument transformer intended to have its primary winding connected in series with the conductor carrying the current to be measured or controlled.
Dip: Another term for Sag, commonly used in Europe.
Distortion Factor (DF): The ratio of the root-mean-square of the harmonic content to the root-mean-square value of the fundamental quantity, expressed as a percent of the fundamental. Also known as Total Harmonic Distortion (THD).
Dropout: A loss of equipment operation (discrete data signals) due to noise, sag, or interruption.
Dropout Voltage: The voltage at which a device will release to its de-energized position (for this document, the voltage at which a device fails to operate).
Eddy Current Loss Factor (PEC-R): The portion of a transformer’s total losses that can be attributed to eddy currents, expressed in per unit or percent of the total transformer losses at full load conditions.
Electromagnetic Compatibility: The ability of a device, equipment or system to function satisfactorily in its electromagnetic environment without introducing intolerable electromagnetic disturbances to anything in that environment.
Electromagnetic Disturbance: Any electromagnetic phenomena which may degrade the performance of a device, equipment or system, or adversely affect living or inert matter.
Electromagnetic Environment: The totality of electromagnetic phenomena existing at a given location.
Electromagnetic Susceptibility: The inability of a device, equipment or system to perform without degradation in the presence of an electromagnetic disturbance. Note: Susceptibility is a lack of immunity.
Equipment Grounding Conductor: The conductor used to connect the non-current carrying parts of conduits, raceways, and equipment enclosures to the grounded conductor (neutral) and the grounding electrode at the service equipment (main panel) or secondary of a separately derived system (e.g., isolation transformer). See NFPA 70-1990, Section 100 [B12].
Flicker: Impression of unsteadiness of visual sensation induced by a light stimulus whose luminance or spectral distribution fluctuates with time.
Frequency Deviation: An increase or decrease in the power frequency. The duration of a frequency deviation can be from several cycles to several hours.
Fundamental (Component): The component of an order 1 (50 Hz or 60 Hz) of the Fourier series of a periodic quantity.
Ground: A conducting connection, whether intentional or accidental, by which an electric circuit or equipment is connected to the ground, or to some conducting body of relatively large extent that serves in place of the ground. Note: It is used for establishing and maintaining the potential of the ground (or of the conducting body) or approximately that potential, on conductors connected to it, and for conducting ground currents to and from ground (or the conducting body).
Ground Loop: In a radial grounding system, an undesired conducting path between two conductive bodies that are already connected to a common (single-point) ground.
Harmonic (component): A component of order greater than one of the Fourier series of a periodic quantity.
Harmonic Content: The quantity obtained by subtracting the fundamental component from an alternating quantity.
Immunity (to a disturbance): The ability of a device, equipment or system to perform without degradation in the presence of an electromagnetic disturbance.
Impulse: A pulse that, for a given application, approximates a unit pulse. When used in relation to the monitoring of power quality, it is preferred to use the term impulsive transient in place of impulse.
Impulsive transient: A sudden non-power frequency change in the steady state condition of voltage or current that is unidirectional in polarity (primarily either positive or negative).
Instantaneous: When used to quantify the duration of a short duration variation as a modifier, refers to a time range from 0.5 cycles to 30 cycles of the power frequency.
Interharmonic (component): A frequency component of a periodic quantity that is not an integer multiple of the frequency at which the supply system is operating (e.g., 50 Hz or 60 Hz).
Interruption, Momentary: A type of short duration variation. The complete loss of voltage (<0.1 pu) on one or more phase conductors for a time period between 0.5 cycles and 3 seconds.
Interruption, Sustained: A type of long duration variation. The complete loss of voltage (<0.1 pu) on one of more phase conductors for a time greater than 1 minute.
Interruption, Temporary: A type of short duration variation. The complete loss of voltage (<0.1 pu) on one or more phase conductors for a time period between 3 seconds and 1 minute.
Isolation: Separation of one section of a system from undesired influences of other sections.
K-Factor (K): A characteristic of a current waveform that weights harmonic components according to the square of the harmonic number.
Long Duration Variation: See Variation, Long Duration.
Magnetic Synthesizer: A transformer-based voltage regulator for three-phase loads.
Momentary: When used to quantify the duration of a short duration variation as a modifier, refers to a time range at the power frequency from 30 cycles to 3 seconds.
Noise: Unwanted electrical signals in the circuits of the control systems in which they occur.
Nominal Voltage. (Vn): A nominal value assigned to a circuit or system for the purpose of conveniently designating its voltage class (as 208/120, 480/277, 600).
Nonlinear Load: Steady state electrical load which draws current discontinuously or whose impedance varies throughout the cycle of the input ac voltage waveform.
Normal Mode Voltage: A voltage that appears between or among active circuit conductors.
Notch: A switching (or other) disturbance of the normal power voltage waveform, lasting less than 0.5 cycles, which is initially of opposite polarity than the waveform and is thus subtracted from the normal waveform in terms of the peak value of the disturbance voltage. This includes complete loss of voltage for up to 0.5 cycles.
Oscillatory Transient: A sudden, non-power frequency change in the steady state condition of voltage or current that includes both positive or negative polarity value.
Overvoltage: When used to describe a specific type of long duration variation, refers to a measured voltage having a value greater than the nominal voltage for a period of time greater than 1 minute. Typical values are 1.1 to 1.2 pu.
Phase Shift: The displacement in time of one waveform relative to another of the same frequency and harmonic content.
Point of Common Coupling (PCC): The point of interface between two different parts of the power system where the propagation and characteristics of a power quality variation can be evaluated. With respect to evaluation of harmonic voltage and current limits at the supply to an end user, this is the point on the system where another end user can be supplied.
Potential Transformer (PT); also, voltage transformer: An instrument transformer intended to have its primary winding connected in shunt with a power-supply circuit, the voltage of which is to be measured or controlled.
Power Disturbance: Any deviation from the nominal value (or from some selected thresholds) of the input ac power characteristics.
Power Quality: The concept of powering and grounding sensitive equipment in a manner that is suitable to the operation of that equipment.
Sag: A decrease in rms voltage or current at the power frequency for durations of 0.5 cycles to 1 minute. Typical values are 0.1 to 0.9 pu.
Service Voltage: Voltage at the end user service entrance location.
Shield: As normally applied to instrumentation cables, refers to a conductive sheath (usually metallic) applied, over the insulation of a conductor or conductors, for the purpose of providing means to reduce coupling between the conductors so shielded and other conductors which may be susceptible to, or which may be generating unwanted electrostatic or electromagnetic fields (noise).
Shielding: Shielding is the use of a conducting and/or ferromagnetic barrier between a potentially disturbing noise source and sensitive circuitry. Shields are used to protect cables (data and power) and electronic circuits. They may be in the form of metal barriers, enclosures, or wrappings around source circuits and receiving circuits.
Short Duration Variation: See Variation, Short Duration.
Slew Rate: Rate of change of a quantity such as volts, frequency or temperature.
Static Var Compensator (SVC): Configuration of reactive power compensation equipment (reactors and capacitors) with power electronics switching to achieve continuous control of the reactive compensation provided to the power system.
Sustained: When used to quantify the duration of a voltage interruption, refers to the time frame associated with a long duration variation (i.e., greater than 1 minute).
Swell: An increase in rms voltage or current at the power frequency for durations from 0.5 cycles to 1 minute. Typical values are 1.1 to 1.8 pu.
Temporary: When used to quantify the duration of a short duration variation as a modifier, refers to a time range from 3 seconds to 1 minute.
Tolerance: The allowable variation from a nominal value.
Total Demand Distortion (TDD): The total (RSS) harmonic current distortion in % of the average maximum demand load current (15 or 30 minute demand).
Total Harmonic Distortion (THD): The ratio of the root-mean-square of the harmonic content to the root-mean-square value of the fundamental quantity, expressed as a percent of the fundamental. Also referred to as Distortion Factor.
Transient: Pertaining to or designating a phenomenon or a quantity which varies between two consecutive steady states during a time interval that is short compared to the time scale of interest. A transient can be a unidirectional impulse of either polarity or a damped oscillatory wave with the first peak occurring in either polarity.
Transmission Line Fault Performance: The expected or actual number of faults per year (defined for each type of fault separately) on a transmission line.
Undervoltage: When used to describe a specific type of long duration variation, refers to a measured voltage having a value less than the nominal voltage for a period of time greater than one minute. Typical values are 0.8 – 0.9 pu.
Utilization Voltage: Voltage at end use equipment location.
Variation, Long Duration: A variation of the rms value of the voltage from nominal voltage for a time greater than 1 minute. Usually further described using a modifier indicating the magnitude of a voltage variation (e.g., Undervoltage, Overvoltage, or Voltage Interruption).
Variation, Short Duration: A variation of the rms value of the voltage from nominal voltage for a time greater than 0.5 cycles of the power frequency but less than or equal to 1 minute. Usually further described using a modifier indicating the magnitude of a voltage variation (e.g. Sag, Swell, or Interruption) and possibly a modifier indicating the duration of the variation (e.g., Instantaneous, Momentary or Temporary).
Voltage Change: A variation of the rms or peak value of a voltage between two consecutive levels sustained for definite but unspecified durations.
Voltage Dip: See Sag.
Voltage Distortion: Any deviation from the nominal sine wave form of the ac line voltage.
Voltage Fluctuation: A series of voltage changes or a cyclical variation of the voltage envelope. Voltage Imbalance (Unbalance), Polyphase Systems: The ratio of the negative or zero sequence
Voltage Imbalance (Unbalance), Polyphase Systems: The ratio of the negative or zero sequence component to the positive sequence component, usually expressed as a percentage.
Voltage Interruption: Disappearance of the supply voltage on one or more phases. Usually qualified by an additional term indicating the duration of the interruption (e.g., Momentary, Temporary, or Sustained).
Voltage Regulation: The degree of control or stability of the rms voltage at the load. Often specified in relation to other parameters, such as input-voltage changes, load changes, or temperature changes.
Waveform Distortion: A steady state deviation from an ideal sine wave of power frequency principally characterized by the spectral content of the deviation.
Terminology to Avoid
The following words have a varied history of usage, and some may have specific definitions for other applications.
blackout frequency shift blink glitch brownout outage clean ground power surge clean power raw power computer grade ground raw utility power counterpoise ground shared ground dedicated ground spike dirty ground subcycle outages dirty power surge wink
REFERENCES
IEEE Standard 100. Terms and Definitions IEEE Standard 1100. IEEE Recommended Practice for Powering and Grounding Sensitive Equipment (The Emerald Book). IEEE Standard 1159. IEEE Recommended Practice on Monitoring Electric Power Quality. IEEE Standard 142. IEEE Recommended Practice for Grounding of Industrial and Commercial Power Systems. (The Green Book) Many of these definitions are also included in Appendix A.
Published by Chih-Che Sun 1, Chen-Ching Liu 1,2 and Jing Xie 1,*
1 School of Electrical Engineering and Computer Science, Washington State University, Pullman, WA 99164, USA; csun@eecs.wsu.edu (C.-C.S.); liu@eecs.wsu.edu (C.-C.L.) 2 Visiting Professor, School of Mechanical and Materials Engineering, University College Dublin, Belfield, Dublin 4, Ireland *Correspondence: jxie@eecs.wsu.edu; Tel.: +1-509-339-4246 Academic Editors: Alfredo Vaccaro and Jin (Wei) Kocsis
Abstract
As part of the smart grid development, more and more technologies are developed and deployed on the power grid to enhance the system reliability. A primary purpose of the smart grid is to significantly increase the capability of computer-based remote control and automation. As a result, the level of connectivity has become much higher, and cyber security also becomes a potential threat to the cyber-physical systems (CPSs). In this paper, a survey of the state-of-the-art is conducted on the cyber security of the power grid concerning issues of: (1) the structure of CPSs in a smart grid; (2) cyber vulnerability assessment; (3) cyber protection systems; and (4) testbeds of a CPS. At Washington State University (WSU), the Smart City Testbed (SCT) has been developed to provide a platform to test, analyze and validate defense mechanisms against potential cyber intrusions. A test case is provided in this paper to demonstrate how a testbed helps the study of cyber security and the anomaly detection system (ADS) for substations.
A primary purpose of the smart grid is to deploy digital communication networks (e.g., Ethernet, cellular service and satellite signal) to enable data acquisition and remote control between control centers and the large number of power grid facilities (e.g., substations and power plants). Due to the installation of intelligent electronic devices (IEDs) on power grids, power system operators are able to monitor and control a power system from a remote control center. These remote control and monitoring technologies are based on information and communications technology (ICT). As a result, vulnerabilities with respect to cyber intrusions also become a serious concern.
A massive cyber attack occurred on Ukraine’s power system in December 2015. More than ten thousand homes and facilities experienced a power outage for hours, even days. This attack was enabled by a malware called BlackEnergy installed on the control center computers [1]. This cyber intrusion event shows that attackers can damage a large-scale ICT network in a short time. In addition, cyber intruders, compared to physical intrusion events, are hard to locate. Cyber attackers can be anywhere with network access. Several Internet Protocol (IP) trace back technologies can be used to find the attack source by analyzing the packet information [2,3]. However, the techniques of modifying network packets and hijacking a victim’s computer can be achieved from many websites. Therefore, rather than the detection of the attack source, the main focus of cyber protection systems is on blocking the unknown connections from the wide area network (WAN), e.g., Internet, radio, cellular and mobile worldwide interoperability for microwave access (WiMAX). Nevertheless, cyber security leakages are usually related to the configuration settings of a communication system in a power grid.
In order to identify cyber security problems in power grids, research on vulnerability assessment is proposed to discover the weaknesses. The studies of protection systems, such as intrusion detection system (IDS) and ADS, are constructed to detect abnormal activities by capturing the signatures of cyber attacks. The sensitivity of protection systems is the key factor of false alarms. Both false positive and false negative alarms reduce the system’s performance. Thus, different kinds of testbeds for smart grids have been developed for several purposes, including testing and analyzing the impact of potential or existing cyber attacks, identifying a smart grid’s or a subsystems’ (e.g., substations and control centers) vulnerabilities and validating the capability of protection systems.
The remainder of this paper is organized as follows: Physical and cyber structures and devices of smart grids are introduced in Section 2. Recent research on vulnerability assessment is presented. Various types of cyber protection systems, including ADSs and IDSs, and the false alarm issues are discussed in Section 3. Section 4 presents the cyber-physical system (CPS) testbeds for testing and validating cyber security-related research. The conclusion is provided in Section 5.
2. Cyber Security Vulnerabilities and Communication Technologies in Power Grids
Measurements are collected by the control center for power system monitoring and control. In recent years, electronic devices and digital communication systems have been deployed on power grids. As a result, measurements and control commands can be delivered within a second or even milliseconds. The efficiency and reliability of power systems have been enhanced significantly with respect to the deployment of ICT. For example, phasor measurement units (PMUs) have been integrated and deployed for wide area measurement systems (WAMSs). In addition, advanced metering infrastructures (AMIs) have been installed on distribution systems [4].
In CPSs, the cyber and physical systems are coupled to provide critical services. As an example of CPSs, the smart grid utilizes massive information acquired from the physical system. Measurements are collected and analyzed by the cyber system and, in turn, affect the operation of the physical system by economic and remedial actions. Although the integration of cyber and physical systems is critical, new types of risks emerge from the tight coupling between the physical and cyber systems. On the one hand, the cyber system may adversely influence the physical system when cyber attacks are involved. For example, untimely and/or fake commands may damage the facilities or even initiate a sequence of cascading events. On the other hand, a large number of critical functionalities of the CPS require accurate information and measurements from the physical system. Failures of sensors, devices and communication lines lead to incomplete data, delays in computing and failures to deliver important commands. Consequently, the reliability of the physical system is compromised.
2.1. Supervisory Control and Data Acquisition System
For on-line operation and monitoring of the critical infrastructures, SCADA systems have been deployed in various industries, such as power, oil and gas, transportation and manufacturing. Abnormal operating conditions of a power system can be detected from a remote location through a SCADA system. Thus, the response time to correct an abnormal condition is reduced. In addition, utilities can reduce routine and emergency visits of field crews to remote sites. Figure 1 shows the major parts of a SCADA system: (1) sensors and control devices; (2) the digital communication system; (3) human machine interface (HMI); and (4) software (e.g., EMS/DMS). In the power industry, SCADA systems are used for collecting measurements by current transformers (CTs) and voltage transformers (VTs) and sending control commands to switching devices (e.g., circuit breakers).
Figure 1. Architecture of a SCADA system.
The set of SCADA data at remote sites is sent to the control center via WAN (e.g., radio, satellite and Internet). As a result, the data will be delivered through the LAN in a control center. Devices connected to the LAN in a control center can access the data. In remote sites, sensors (e.g., current and voltage sensors) are connected to PLCs or RTUs via copper wires directly. If the substation uses an RTU or PLC as a gateway, there is no LAN at remote sites. Thus, the SCADA network indicates that the LAN is utilized for passing SCADA data. Remote terminal units (RTUs) and programmable logic controllers (PLCs) serve as a gateway to provide the connection between electronic devices at remote sites and an IP-based SCADA system. Although RTU and PLC have overlapping functions on remote control and monitoring, RTUs are usually deployed for wide geographic telemetry, whereas PLCs are used for local area control [5].
EMS and DMS are the software systems in control centers at the transmission and distribution level, respectively. Both of them are used to perform the monitoring, control and analysis functions in a power system. EMS provides functionalities, such as: (1) contingency analysis; (2) state estimation; and (3) optimal power flow. The primary functionalities of DMS include: (1) acquiring customer data (e.g., power consumption and personal data) through smart meters and/or SCADA (only measurements); and (2) outage management.
Cyber vulnerabilities that exist in the SCADA systems are discussed in [6]. Through remote access points of a communication system, attackers may be able to disrupt communications, monitor system status, access critical data (e.g., operating plan, the topology of installed protection systems, passwords and measurement records), inject malicious control commands and inject falsified data into a control center. These actions can mislead system operators into taking inappropriate operations. Specific vulnerabilities in SCADA networks and EMS have been reported in [7,8]. Utilities should conduct vulnerability assessments regularly for securing their system. Specific approaches to the identification of vulnerabilities are reported in [9,10]. To assess the vulnerability in communication systems, an integrated risk assessment method is proposed for both physical and cyber systems [11]. Every security event is assigned with a probability value. A vulnerability index is calculated based on the cause-effect relationship between a cyber intrusion event and the power grid. It is used to quantify the degree of cyber security risk in an SCADA system. The probability of each security event affects the value of the vulnerability index. Another study of the vulnerability is performed by utilizing detailed models of the SCADA system [12]. Vulnerabilities are investigated at three levels: (1) systems; (2) scenarios; and (3) access points. In this research, the physical and cyber system models, as well as the model of intrusion behavior (i.e., scenario level) and access points (e.g., firewall, virtual private network, dial-up connection, wireless and other remote logon applications) are included. The result of the evaluation is the total loss of load that can be caused by a cyber attack in a power system and the power system’s proximity to a collapse point, leading to a major outage.
2.2. PMU
The data scanning rate of an EMS is 2 to 5 s with unsynchronized measurement signals. Voltage angles of each bus cannot be measured directly by the current SCADA systems; they are obtained by power flow calculation or state estimation. To enable direct measurements of the voltage angles, the first set of experimental PMUs was developed at Virginia Tech in 1988, and the commercial PMU products were initially built by Macrodyne in 1992. PMUs have an extremely high sampling rate from 30 to 120 samples per second [13]. With the high accuracy of the timing pulse (less than one microsecond) of the global positioning system (GPS), the data can be aligned on each time frame. The large amount of synchronized data can be used to improve the on-line monitoring of power system dynamics, including voltage stability, small signal ability and transient stability [14-16].A phasor data concentrator (PDC) serves as a gateway in the phasor network. Local PDCs are installed in substations for collecting the PMU information and forwarding the data to the PDC in a control center. The data are used for further static and dynamic analysis. Similar to cyber vulnerabilities in SCADA systems, attackers may hack into the phasor network to monitor or inject false data. In addition, PMUs use the GPS signal from satellites. Attackers may create abnormal operating conditions on a power grid by jamming or spoofing GPS signals [17,18].
2.3. Substation Automation System
Traditional electronic devices at substations have been upgraded to IEDs, such as protective IEDs, merging units (MUs) and intelligent controllers. In addition to the functions of conventional electronic devices (e.g., protective relays, CTs and VTs), IEDs provide the digital communication with a remote control center. The Working Group (WG) 10 of the International Electrotechnical Commission (IEC) Technical Committee (TC) 57 proposed the concept of SASs. As a result, utilities gradually adopted the IEC 61850 standard for the design of SASs [19]. The characteristics of IEC 61850 are summarized:
(1)Reducing the cost of installation and engineering:
IEDs are connected to a local area network (LAN) in a substation via Ethernet-based communication. Hence, copper cables are replaced by communication lines (e.g., optical fibers and Ethernet cables) that offer higher transmission rates. All data and control commands can be transmitted using a single communication line, leading to a reduced cost.
(2)Enhancing interoperability of IEDs:
All IEC 61850-based devices (e.g., IEDs) are able to import/export the substation configuration language (SCL) file, which contains device information from/to a server via the ICT network. With the auto-configured feature, IEDs of different vendors can be adopted in the same substation without a compatibility issue.
(3)Minimizing the impact of a change in topology:
Substation engineers can connect/disconnect IEDs into the existing SAS. Through the ICT network, engineers can send the SCL files to all on-line IEDs for reconfiguration at the same time.
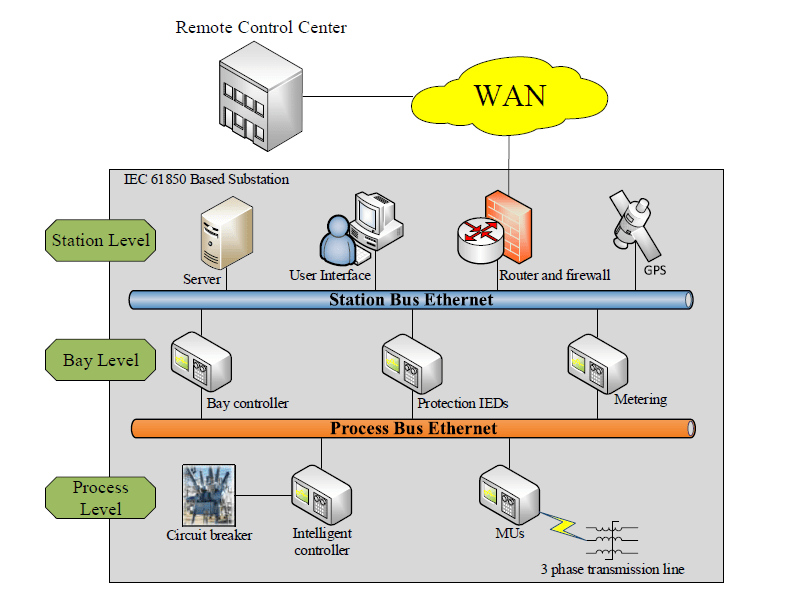
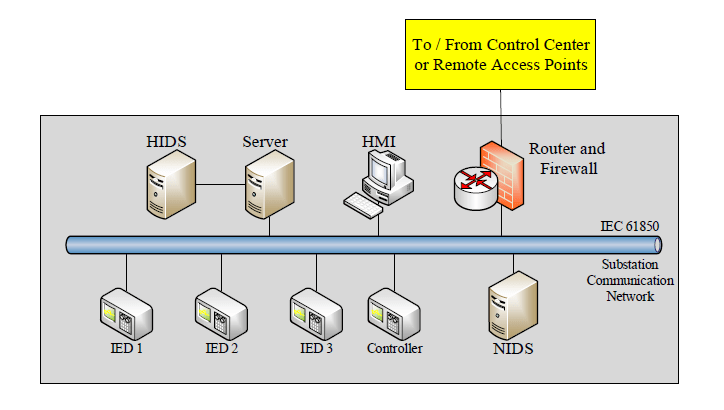
Since most power substations are unmanned, operators use remote control technologies to access the substation communication network (SCN). The architecture of an SCN is illustrated in Figure 2. Once an attacker explores approaches (e.g., cracking the password) to access a SCN, (s)he gains access to the critical data (e.g., system topology and operating plans, measurements, maintenance records and the status of circuit breakers) and is able to send control commands (e.g., opening circuit breakers). Attackers can access multiple substations at the same time if the communication system is vulnerable. The worst case is that an attacker triggers a sequence of cascading events on a power system causing a wide area blackout.
Figure 2. Architecture of an IEC 61850 based substation.
For the purpose of a secure SAS network, several guidelines have been published. The North American Electric Reliability Corporation (NERC) developed critical infrastructure protection (CIP) standards CIP-002 through CIP-009 for “providing a cyber security framework for the identification and protection of critical cyber assets to support reliable operation of the bulk electric system” [20]. NISTIR 7628, guidelines for smart grid cyber security, was proposed by NIST [4,21]. In addition, the Energy Sector Control Systems Working Group (ESCSWG) published the document, “Roadmap to Achieve Energy Delivery System Cyber Security” for improving the cyber security of energy delivery systems [22].
2.4. AMI
An advanced metering system is a customer-side technology for smart grids. Smart meters lead to a new relationship between power consumers and providers. Conventional meters (i.e., mechanical meters and digital meters) are used to record the power usage for billing purposes. Smart meters are able to record both energy flows in and out of a house. With smart meters, consumers can also become producers by installing roof-top solar panels and/or small wind generators. Moreover, electric vehicles can be an energy resource by restoring energy when electricity prices are low and injecting power back to the grid when electricity prices go up. The digital communication system opens the door to make load demand more flexible.
A smart meter has several components, i.e., current and voltage sensors, digital communication module, data storage unit, microprocessor and RAM. Smart meters are installed on the customer side. Thus, the device can be more vulnerable than other utility side facilities in a power grid. Since smart meters record detailed usage information of the clients, attackers may be able to access users’ private information in addition to stealing electricity [23-25].
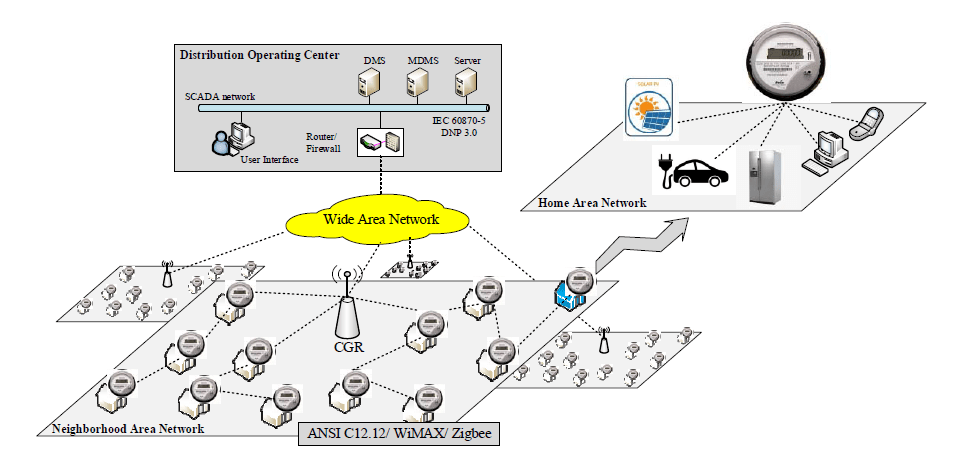
A smart meter also serves as a controller and a router in a home area network (HAN). Based on the vision of the Internet of Things (IoT), home appliances can be connected to the Internet and controlled by smart phones via the Internet. Smart meters are ideal devices as a controller because they support wireless communication [26]. In a wireless communication environment, appliances can be added/removed in a HAN without wiring and configuring issues. Currently, most smart meters are designed to use the ZigBee communication protocol defined in the IEEE 802.15.4 standard [27]. ZigBee has a communication distance limit because the technology is designed for electronic devices with low power consumption. Unlike Wi-Fi technology using a star topology, ZigBee support devices are connected in a meshed network where data can be exchanged between end-devices. Therefore, the transmission distance can be extended by hopping among devices in the same LAN. The communication structure of an AMI network is shown in Figure 3. A connected grid router (CGR) collects meter data in a neighborhood. Several communication links pass the data from end points to the CGR. Commands from a control center propagate in reserve direction from the CGR to the control target. If any of the meters in the middle of a linkage go off-line, the link topology will be automatically reconfigured by a preset plan. However, computer viruses or malicious application programs can also be spread in an AMI network in a short time, since meters can communicate with each other. Thus, many cyber security studies on AMI focus on the security of communication protocols and secured communication structures [28-30]. NIST and user groups, such as the Open Smart Grid, have produced reports and enacted requirements to ensure that manufacturers and policy makers incorporate cyber security from the beginning of the development process. These documents range from risk assessment [31,32] to security requirements [4].
Figure 3. Architecture of an AMI system.
2.5. Overview
Except for the SCADA system, PMU, SAS and AMI belong to the smart grid. “Smart” means that the data can be sent/received through the digital communication system. In the SCADA system, measurements collected by gateways (e.g., PLCs or RTUs) are provided by sensors and transmitted via copper wires. Although the digital communication system is utilized by PLCs or RTUs for transmitting data to the control center, the communication between sensors and gateways remains traditional. Therefore, SCADA does not belong to smart grid technologies.
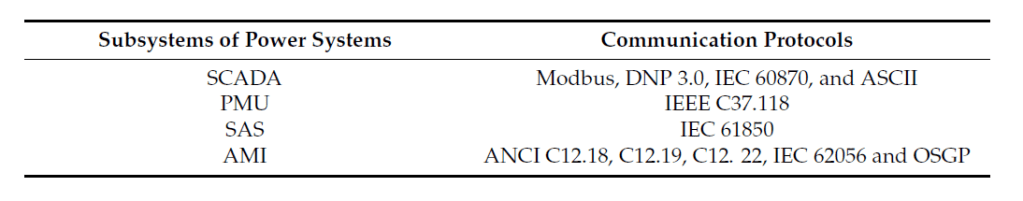
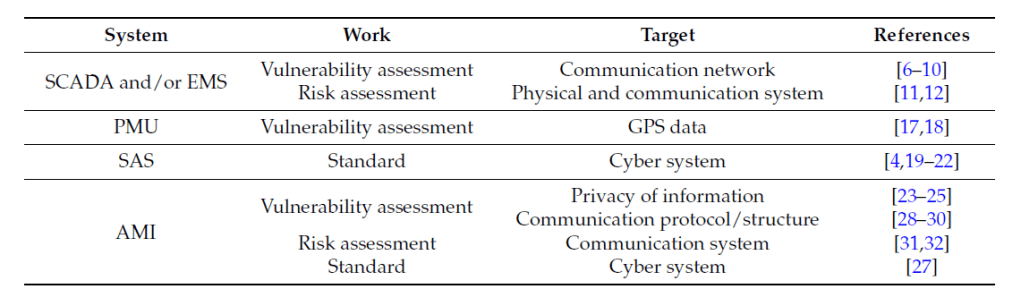
Communication protocols define the digital data formats and rules for telecommunication. With respect to different requirements (e.g., latency, security and packet size) of communication systems, different communication protocols are utilized. The latest version of the communication protocols in power systems is listed in Table 1. In addition, vulnerability assessment approaches of the subsystems (i.e., SCADA, PMU, SAS and AMI) of power grids are provided. The information of vulnerability studies has been tabulated in Table 2.
Table 1. Latest version of communication protocols.
Table 2. Overview of SCADA, PMU, SAS and AMI.
3. Cyber Intrusion Protection Systems
As a packet filter, the firewall serves as the front-line defense for a protection system. Packets that fulfil the user-defined rules can pass firewalls. Anomaly events (e.g., unknown IP connection, IP scanning and port scanning) are recorded in a log file. However, firewalls only examine the lower layer communication information (i.e., network layer). Therefore, malicious code cannot be detected in the higher layer of the communication structure (i.e., application layer). Thus, except for firewalls, various types of IDSs and ADSs have been proposed to capture abnormal behaviors towards the communication system.
IDSs are used to detect intrusion behaviors in power systems. After receiving an intrusion alarm from IDSs, operators can take a control strategy to mitigate the impact of cyber attacks. In addition to the functions of IDSs, intrusion detection and prevention systems (IDPSs) can apply a control strategy to the cyber attack with an appropriate mitigation method directly. Therefore, IDPSs respond to cyber attacks (before/after) faster than IDSs. The impact on a power system is reduced further.
3.1. Types of IDSs
A smart grid is an integration of both physical and cyber systems. The physical system consists of power generation units, substations and transmission and distribution systems, while the cyber system represents the digital communication system (e.g., ICT network) and SCADA system. The principles behind the design of IDSs for cyber and physical systems are very different.
3.1.1. Network-Based IDSs
A network-based IDS (NIDS) monitors the network traffic in a LAN. Through a physical network interface card connected to the LAN, an NIDS gains access to all network flows in a network segment. NIDS checks for anomalies by inspecting the contents and header information of all packets passing through the network segment. Each communication protocol has a uniquely-defined format and structure of network packets. As a result, anomalies can be recognized by comparing predefined rules with abnormal packets [33,34].
3.1.2. Host-Based IDSs
A host-based IDS (HIDS) is installed in one or more data servers individually. The primary task of an HIDS is to identify anomalies among measurements and the status of physical devices. A HIDS also has a set of user-defined rules that describe the normal behavior among the devices. For example, if a circuit breaker is opened without a detected fault signal, the HIDS will consider this event as an anomaly. Thus, a HIDS utilizes log files recorded by physical equipment, such as IEDs, PMUs and firewalls [35]. The architecture of NIDS and HIDS in a substation is shown in Figure 4.
Figure 4. Architecture of an SCN with network-based IDS (NIDS) and host-based IDS (HIDS) installed.
3.2. Detection Systems and Mitigation Techniques in Smart Grids
3.2.1. Detection Systems
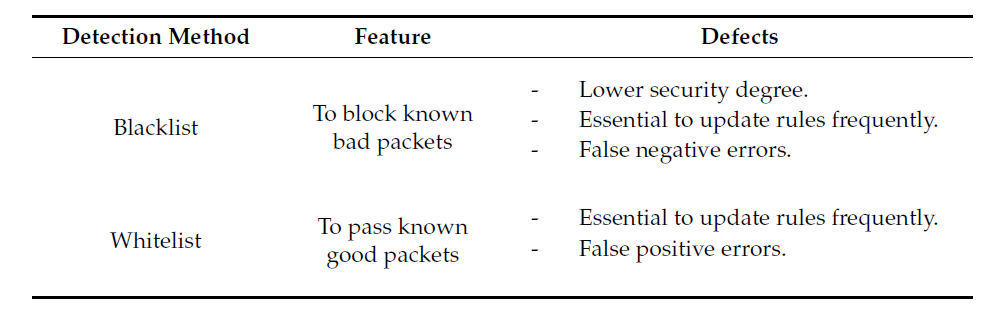
Blacklists and whitelists are two typical detection approaches. A comparison is shown in Table 3. Anti-virus applications for personal computers are good examples that use the blacklist. A virus can be recognized by comparing its signature with records in a database. If the signature is matched, the virus will be quarantined or deleted. In contrast, an example of the whitelist detection system is the access to a control system, which utilizes a database to record the information of authorized users. Database rules must be updated frequently for both whitelist and blacklist detection systems. Otherwise, the latest anomalies would not be recognized by the detection system. Similarly, the whitelist detection system needs to be updated so that it allows the newly-authenticated operations to be conducted.
Table 3. A comparison of the detection methods.
Intrusion detection technologies have been explored in the ICT environment. However, attack vectors, vulnerability, availability requirements and interactions between physical and cyber domains are new challenges to power systems. Several studies of IDSs for the power grid have been reported. A list of IDSs is shown in Table 4.
Table 4. IDSs for the smart grid.
Most IDSs are either host-based or network-based. However, a hybrid IDS has a higher performance in a CPS. For this purpose, an integrated ADS for substation cyber security is proposed [45]. The host-based anomaly detection inspects temporal anomalies in the substation facilities. Meanwhile, multicast messages (e.g., GOOSE and SMV) are monitored by the network-based anomaly detection. Cyber attacks can be identified by correlating the information from both parts of anomaly detection systems (ADSs). In Section 4 of this paper, a test example of the integrated ADS in the Smart City Testbed (SCT) is presented.
3.2.2. Mitigation Techniques
The primary task of mitigation actions is to ensure the reliability and stability of a power system. Mitigation actions are activated as soon as IDSs or IDPSs report an attack event. In general, mitigation methods include two parts, cyber and physical systems. For the cyber system, the mitigation techniques are aimed at verifying the legitimacy of on-line users and network packets. For the physical system, the mitigation control strategies are applied to maintain the stability of power systems. If attacks affect the stability of power systems, control strategies must be applied. A mitigation framework and control strategies of generators are proposed in [46] to maintain system stability with respect to switching attacks. In the study of [47], both cyber and physical mitigation steps are included. Unknown on-line users will either be suspended or have very limited manipulation privileges. Another mitigation technique reported in [48] is used against the man-in-the-middle (MITM) attack. DNP 3.0 is a common communication protocol for SCADA systems. By utilizing a packet retransmission strategy [49], the authors suggested that the MITM can be prevented.
3.3. Detection Systems of AMI Network
In [50], it is reported that the number of installed smart meters in the U.S. has reached 65 million by 2015. The deployment of smart meters is a continuing trend in the power industry. A cyber security issue for smart meters is energy theft, e.g., an attacker modifies the values of energy consumption readings. Several detection systems have been developed against energy theft [51-54]. Through monitoring load profiles, detection systems are able to recognize anomalies, such as the drastic change of power usage at a specific time instant and unusual power usage patterns. Another purpose of detection systems [55-57] is to secure the communication and avoid information leakage. Authorization, authentication and encryption technologies are applied to enhance the security of private information. Most research on the AMI cyber security is focused on: (1) energy theft; and (2) information security (i.e., power usage and false data injection). As smart meters have limited computational capability, detection systems should be designed with a low computational burden [55]. The practical implementation of smart meters with the capability of IDSs is still limited.
4. CPS Testbeds
Researchers investigate potential cyber vulnerabilities in the smart grid. In doing so, it is risky to perform cyber security studies on a real power system. Therefore, a real-time CPS testbed serves as a feasible alternative since it can capture interactions among cyber-control-physical subsystems. A CPS testbed has several advantages: (1) power system simulation tools (e.g., Real-Time Digital Simulator (RTDS), DIgSILENT, PowerWorld, TSAT and PSS®E) can simulate the response of a large-scale power system with a reasonable level of accuracy; (2) a testbed can be focused on a specific security study area (e.g., distribution system, transmission system, SCADA system and AMI network); and (3) a testbed can be extended through connecting multiple testbeds via communications (e.g., Internet and LAN). Testbed-based research is important for areas such as: (1) vulnerability assessment; (2) impact analysis; and (3) attack-defense evaluation and validation.
4.1. National Level Testbed
The DOE Office of Electricity Delivery and Energy Reliability (OE) created a testbed program in 2008. A National SCADA Test Bed (NSTB) has been established by collaboration among National Labs (i.e., Argonne, Idaho, Lawrence, Berkeley, Los Alamos, Oak Ridge, Pacific Northwest and Sandia) for identifying and reducing existing cyber vulnerabilities in energy sectors (i.e., electric, oil and gas) and testing new and existing electronic devices that are used in energy industries [58-60]. To meet the objectives, the NSTB program invests in R&D for next-generation control systems, vulnerability assessment and risk analysis to enhance cyber security in energy systems, as well as physical grid components, including generation units and transmission systems to build a realistic testing environment. However, the substantial cost of physical infrastructures places limits on the development of these testbeds.
4.2. Testbed at Research Institutes
The cost of a national-level testbed is high. Several research centers have developed a smaller scale of CPS testbeds for different CPS security studies. A CPS testbed, Virtual Power System Testbed (VPST) [61], at the University of Illinois has the ability to simulate both cyber and physical systems by using a network integration tool based on the Illinois-developed Real-Time Immersive Network Simulation Environment (RINSE) and a power system simulator (i.e., PowerWorld and RTDS). Except for performing cyber-physical security studies, this testbed also shows the interconnectivity between multiple testbeds. The framework of inter-testbed connector (ITC) was proposed for reducing the complexity of the testbed configuration.
The Cyber Security testbed at University College Dublin (UCD) is intended for the cyber security study of the SCADA system. The testbed consists of four parts: (1) a commercial EMS is used in the SCADA system network; (2) IEC 61850 communication formed the SCN in simulated substations; (3) a power system simulation tool (i.e., DIgSILENT) is used to simulate a power system; and (4) the Object Linking and Embedding for Process Control (OPC) communication protocol bridges the physical and cyber domains [62].
With the effort of previous research project (i.e., Internet-Scale Event and Attack Generation Environment (ISEAGE)) at Iowa State University (ISU) [63], the PowerCyber Security testbed is able to perform the wide area network emulation and advanced attack simulation. Both hardware-based (RTDS) and software-based (DIgSILENT) power system simulation tools support the real-time and off-line system simulation. With respect to advanced virtualization technologies, the cost of development can be reduced and the scalability of testbeds can be addressed.
A number of CPS testbeds have been developed for the study of cyber security issues of power systems. However, most of them are not public. Researchers from the University of Southern California and University of California, Berkeley, emphasize the existence of a significant gap between defense mechanisms and attack techniques. In order to accelerate the development of cyber protection systems, a plan is proposed to involve more researchers to work together. The defense technology experimental research (DETER) project [64-66] started in March 2004. It provides a public platform that allows researchers to share data, tools, configurations of the testbed and applications. In addition, it helps researchers start new projects with the results of completed experiments and test cases.
4.3. SCT at Washington State University
4.3.1. Configuration of the SCT
A comprehensive testbed for the simulation of cyber-power systems has been developed at Washington State University [67]. The architecture of SCT is shown in Figure 5. Unlike other testbeds that focus on some subsystems, SCT is a hardware-in-the-loop testbed that covers from the control center level all the way to smart meters at the customer level. The transmission system, distribution system, DER and AMI are also included. The physical system components of the SCT include protective IEDs, feeder protection relays, smart meters and data collectors. DNP 3.0, IEC 61850, ANSI C12.19 and IEEE C37.118 formed the communication network protocols. EMS and DMS are available to simulate the operations at a transmission control center and a distribution operation center, respectively. The functions of EMS (such as contingency analysis, state estimation and optimal power flow) are used to study the impact of cyber intrusion on a power system. The DMS can import the real-time customer data (e.g., power usage) collected by smart meters installed on the WSU campus. Other smart meters are installed in the lab for research purpose. These meters will be used to study cyber intrusions into the AMI network with the meter data management system. As several power system physical devices are deployed, the SCT is a realistic model of the real-world environment. Compared to the national level testbed, SCT uses software models for transmission lines, circuit breakers, substations and generators. The characteristics of the SCT includes: (1) a realistic software-hardware simulation environment; (2) several communication and control devices are implemented; (3) different combinations of physical configuration can be tested for identifying cyber security leakages; and (4) the impact of cyber attacks on the entire power system can be investigated from transmission, distribution to the customer level.
Figure 5. SCT at WSU.
4.3.2. Test Case
A cyber attack scenario is demonstrated on the SCT using the IEEE 39-bus system. The integrated ADS proposed in [45] is applied to and validated by the same scenario. For the cyber attack, it is assumed that attackers have full knowledge to access the communication systems in multiple substations. Attackers are able to send modified GOOSE packets to trip all circuit breakers on targeted substations.
In the first scenario, the targets are selected as Substations 38, 32, 35 and 33. Note that the most valuable targets are the buses connected to generators directly. The attack starts at t = 3 s. One substation is compromised every 3 s. The last target (i.e., Substation 33) is compromised at t = 12 s. The attack sequence and the target information are listed in Table 5. During the attack, over-current relays report that circuit breakers are opened without sensing an over-current condition. In Figure 6, the targeted substations are depicted in the one-line diagram of the IEEE 39-bus system. After four generators connected to the targeted substations are disconnected, a cascading sequence of events is triggered, since the power system loses a significant portion of generation capability. A wide area outage occurs at the last stage. The load and generation levels of the IEEE 39-bus system are shown in Table 6. Generators cannot provide sufficient MW power to serve the load after the cyber attack. Dynamic simulation results of the cyber attack are shown in Figure 7.
Figure 6. One-line diagram of IEEE 39-bus system. The targeted substations and generators are marked in blue.
Figure 7. Dynamic simulation results.
Table 5. Attack sequence and the information of targets.
Table 6. Load and generation data of the IEEE 39-bus system.
In the second scenario, the proposed integrated ADS [45] is deployed with the same cyber attack scenario. The HMI of ADS that shows the number of detected anomaly packets is shown in Figure 8. Note that a small number of modified packets is not detected due to the extremely high packet rate. In the meantime, protection IEDs await the confirmation signal from ADS when falsified packets are received. Since an abnormal behavior has been detected, ADS sends a signal to lockout the circuit breaker. Thus, all circuit breakers remain closed during the cyber attack. The proposed ADS has been validated by the SCT.
Figure 8. Implementation of the proposed ADS in a substation.
5. Conclusions
The extensive deployment of ICT systems transforms traditional power grids into smart grids. The increasing connectivity also creates cyber security vulnerabilities. As a result, CPS security has become a critical issue for the smart grid. In this paper, the state-of-the-art of vulnerability assessment for CPSs is conducted with a focus on the impact of cyber intrusion. New vulnerabilities may be derived from the system reconfiguration and/or upgrade. Therefore, vulnerability assessment should be conducted on a regular basis, particularly after a system reconfiguration. As an alternative to testing on the actual cyber-power system, a testbed provides a substitute for the impact analysis of cyber attacks. A testbed should have the capability to mimic the behaviors of real systems. Reliable and accurate simulation tools (software and hardware) of the power and communication systems are needed to provide a realistic cyber-power system environment.
Various types of ADSs and IDSs have been proposed to monitor the cyber-power system behaviors. The design of detection systems should meet the requirements of power systems, such as transmission delay and system performance. An over-designed detection system that bears a high computational burden may reduce the performance of both power system and detection system.
In December 2015, cyber attackers compromised multiple substations likely by utilizing the malware “BlackEnergy” installed in computers of the control center. During the attack, attackers launched the flooding attack on the telephone system and, as a result, customers were not able to report the event to the utility. This fact allowed attackers to compromise a larger number of substations. The falsified SCADA dataset was injected into the control center. Therefore, the operators were not aware that the system was de-energized. Due to this cyber attack, over 80,000 customers experienced power outage. This incident is a cyber attack that caused a direct impact on a power system. IDSs and IDPSs are used to analyze abnormal events in both cyber and physical systems. Even if attackers pass the identity check, alarms will be triggered once abnormal behaviors are detected in the physical system. It is shown that a cyber system’s breach of the substation security can open a pathway to allow cyber attackers to access the substation communication network and impact physical systems.
Acknowledgments
This material is based on work supported by the Department of Energy under Award Number DE-OE0000780. The views and opinions of the authors expressed herein do not necessarily state or reflect those of the United States Government or any agency thereof.
Conflicts of Interest
The authors declare no conflict of interest.
Abbreviations
The following abbreviations are used in this manuscript:
ADS
Anomaly detection system
AGC
Automatic generator control
AMI
Advanced metering infrastructure
AT&T
American Telephone and Telegraph Company
CGR
Connected grid router
CIP
Critical infrastructure protection
CPS
Cyber-physical system
CT
Current transformer
DER
Distributed energy resources
DETER
Defense technology experimental research
DMS
Distribution management system
DNP
Distributed network protocol
EMS
Energy management system
ESCSWG
Energy Sector Control Systems Working Group
GOOSE
Generic object-oriented substation event
GPS
Global positioning system
HAN
Home area network
HMI
Human machine interface
ICT
Information and communications technology
IDPS
Intrusion detection and prevention system
IDS
Intrusion detection system
IEC
International Electrotechnical Commission
IED
Intelligent electronic device
INL
Idaho National Laboratory
IoT
Internet of things
IP
Internet Protocol
ISEAGE
Internet-scale event and attack generation environment
Cronin, J. Automated IP Tracking System and Method. U.S. Patent Application No. 09/781,362, 12 February 2001. [Google Scholar]
Robert, S. CenterTrack: An IP Overlay Network for Tracking DoS Floods. In Proceedings of the USENIX Security Symposium, Denver, CO, USA, 14–17 October 2000; Volume 21.
Keith, S.; Falco, J.; Scarfone, K. Guide to Industrial Control Systems (ICS) Security. NIST Special Publ.2011, 1, 16. [Google Scholar]
Creery, A.; Byres, E.J. Industrial Cybersecurity for Power System and SCADA Networks. In Proceedings of the Annual Petroleum and Chemical Industry Conference, Hoboken, NJ, USA, 12–14 September 2005.
Amanullah, M.T.O.; Kalam, A.; Zayegh, A. Network Security Vulnerabilities in SCADA and EMS. In Proceedings of the 2005 IEEE/PES Transmission & Distribution Conference & Exposition: Asia and Pacific, Dalian, China, 15–17 August 2005.
Li, G.W.; Ju, W.Y.; Shi, D.Y. Functional Vulnerability Assessment of SCADA Network. In Proceedings of the 2012 Asia-Pacific Power and Energy Engineering Conference, Shanghai, China, 27–29 March 2012.
Rosato, V.; Issacharoff, L.; Meloni, S.; Tiriticco, F. Is the Topology of the Internet Network Really Fit to Sustain its Function. Phys. Astat. Mech. Appl.2008, 387, 1689–1704. [Google Scholar] [CrossRef]
Ohira, T.; Sawatari, R. Phase Transition in a Computer Network Traffic Model. Phys. Rev. E1998, 58, 193–195. [Google Scholar] [CrossRef]
Yu, J.; Mao, A.; Guo, Z. Cyber Security Vulnerability Assessment of Power Industry. In Proceedings of the TENCON 2006 IEEE Region 10 Conference, Hong Kong, China, 14–17 November 2006.
Ten, C.W.; Liu, C.-C.; Govindarasu, M. Vulnerability Assessment of Cybersecurity for SCADA Systems. IEEE Trans. Power Syst.2008, 23, 1836–1846. [Google Scholar] [CrossRef]
Phadke, A.G.; Moraes, R.M. The Wide World of Wide-Area Measurement. IEEE Power Energy Mag.2008, 6, 52–65. [Google Scholar] [CrossRef]
Du, P.; Makarov, Y.V. PMU-Based Wide-Area Security Assessment: Concept, Method, and Implementation. IEEE Trans. Smart Grid2012, 3, 1325–1332. [Google Scholar]
Yousefian, R.; Kamalasadan, S. A Lyapunov Function Based Optimal Hybrid Power System Controller for Improved Transient Stability. Electr. Power Syst. Res.2016, 137, 6–15. [Google Scholar] [CrossRef]
Corsi, S.; Taranto, G.N. A Real-Time Voltage Instability Identification Algorithm Based on Local Phasor Measurements. IEEE Trans. Power Syst.2008, 23, 1271–1279. [Google Scholar] [CrossRef]
Fan, Y.; Zhang, Z.; Trinkle, M.; Dimitrovski, A.D.; Song, J.B.; Li, H. A Cross-Layer Defense Mechanism Against GPS Spoofing Attacks on PMUs in Smart Grids. IEEE Trans. Smart Grid2015, 6, 2659–2668. [Google Scholar] [CrossRef]
Jiang, X.; Zhang, J.; Harding, B.J.; Makela, J.J.; Domınguez-Garcıa, A.D. Spoofing GPS Receiver Clock Offset of Phasor Measurement Units. IEEE Trans. Power Syst.2013, 28, 3253–3262. [Google Scholar] [CrossRef]
Clavel, F.; Savary, E.; Angays, P.; Vieux-Melchior, A. Integration of a New Standard: A Network Simulator of IEC 61850 Architectures for Electrical Substations. IEEE Ind. Appl. Mag.2015, 21, 41–48. [Google Scholar] [CrossRef]
Liu, Y.; Hu, S.; Ho, T.Y. Vulnerability Assessment and Defense Technology for Smart Home Cybersecurity Considering Pricing Cyberattacks. In Proceedings of the 2014 IEEE/ACM ICCAD, San Jose, CA, USA, 3–6 November 2014.
McLaughlin, S.; Podkuiko, D.; McDaniel, P. Energy Theft in the Advanced Metering Infrastructure. In Critical Information Infrastructures Security; Springer Berlin HeidelbergCY: Berlin/Heidelberg, Germany, 2010; pp. 176–187. [Google Scholar]
Aravinthan, V.; Namboodiri, V.; Sunku, S.; Jewell, W. Wireless AMI Application and Security for Controlled Home Area Networks. In Proceedings of the IEEE PES GM, San Diego, CA, USA, 24–28 July 2011.
Rana, S.; Zhu, H.; Lee, C.W.; Nicol, D.M.; Shin, I. The Not-So-Smart Grid: Preliminary Work on Identifying Vulnerabilities in ANSI C12.22. In Proceedings of the IEEE Globecom Workshops, Anaheim, CA, USA, 3–7 December 2012.
Ye, F.; Qian, Y.; Hu, R.Q. A Security Protocol for Advanced Metering Infrastructure in Smart Grid. In Proceedings of the IEEE Global Communications Conference, Austin, TX, USA, 8–12 December 2014.
Yan, Y.; Qian, Y.; Sharif, H. A Secure and Reliable In-Network Collaborative Communication Scheme for Advanced Metering Infrastructure in Smart Grid. In Proceedings of the IEEE Wireless Communications and Networking Conference, Cancun, Quintana Too, Maxco, 28–31 March 2011.
Kenchington, H.S. Deputy Assistant Secretary, Office of Electricity Delivery and Energy Reliability, Department of Energy, Smart Grid Cybersecurity Lessons Learned From More Than 11 Million Smart Meters Deployed. TCIPG Seminar, 2013. Available online: http://tcipg.org/sites/tcipg.org/files/slides/2013_03-01_Kench ington-TCIPG-FINAL-Revised.pdf (accessed on 16 June 2014).
Vigna, G.; Kemmerer, R.A. NetSTAT: A Network-Based Intrusion Detection Approach. In Proceedings of the Computer Security Applications Conference, Phoenix, AZ, USA, 3–7 December 1998.
Yeung, D.-Y.; Ding, Y. Host-Based Intrusion Detection Using Dynamic and Static Behavioral Models. Elsevier Pattern Recognit.2003, 36, 229–243. [Google Scholar] [CrossRef]
Hahn, A.; Govindarasu, M. Model-based Intrustion Detection for the Smart Grid (MINDS). In Proceedings of the ACM Proceedings of the Eighth Annual CSIIRW, New York, NY, USA, 4–7 June 2013.
Ten, C.W.; Hong, J.; Liu, C.-C. Anomaly Detection for Cybersecurity of the Substations. IEEE Trans. Smart Grid2011, 2, 865–873. [Google Scholar] [CrossRef]
Cheung, S.; Dutertre, B.; Fong, M.; Lindqvist, U.; Skinner, K.; Valdes, A. Using Model-based Intrusion Detection for SCADA Networks. In Proceedings of the SCADA Security Scientific Symposium, 14–17 January 2007.
Zhang, Y.; Wang, L.; Sun, W.; Green, R.C., II; Alam, M. Distributed Intrusion Detection System in a Multi-Layer Network Architecture of Smart Grids. IEEE Trans. Smart Grid2011, 2, 796–808. [Google Scholar] [CrossRef]
Yang, Y.; McLaughlin, K.; Littler, T.; Sezer, S.; Pranggono, B.; Wang, H.F. Intrusion Detection System for IEC 60870–5-104 based SCADA Networks. In Proceedings of the IEEE PES GM, Vancouver, BC, Canada, 21–25 July 2013.
Sridhar, S.; Govindarasu, M. Model-Based Attack Detection and Mitigation for Automatic Generation Control. IEEE Trans. Smart Grid2014, 5, 580–591. [Google Scholar] [CrossRef]
Linda, O.; Manic, M.; Vollmer, T. Improving Cyber-Security of Smart Grid Systems via Anomaly Detection and Linguistic Domain Knowledge. In Proceedings of the 5th International Symposium ISRCS, Salt Lake City, UT, USA, 14–16 August 2012.
Wu, J.; Xiong, J.; Shil, P.; Shi, Y. Real Time Anomaly Detection in Wide Area Monitoring of Smart Grids. In Proceedings of the IEEE/ACM ICCAD, San Jose, CA, USA, 3–6 November 2014.
Mitchell, R.; Chen, I.R. Behavior-Rule Based Intrusion Detection Systems for Safety Critical Smart Grid Applications. IEEE Trans. Smart Grid2013, 4, 1254–1263. [Google Scholar] [CrossRef]
Hong, J.; Liu, C.-C.; Govindarasu, M. Integrated Anomaly Detection for Cyber Security of the Substations. IEEE Trans. Smart Grid2014, 5, 1643–1653. [Google Scholar] [CrossRef]
Farraj, A.; Hammad, E.; Daoud, A.A.; Kundur, D. A Game-Theoretic Analysis of Cyber Switching Attacks and Mitigation in Smart Grid Systems. IEEE Trans. Smart Grid2016, 7, 1846–1855. [Google Scholar] [CrossRef]
Ten, C.W.; Manimarn, G.; Liu, C.-C. Cybersecurity for Critical Infrastructures: Attack and Defense Modeling. IEEE Trans. Syst. Man Cyber. Part A Syst. Hum.2010, 40, 853–865. [Google Scholar] [CrossRef]
Darwish, I.; Igbe, O.; Saadawi, T. Experimental and Theoretical Modeling of DNP3 Attacks in Smart Grids. In Proceedings of the IEEE Sarnoff Symposium 2015, Newwark, NJ, USA, 20–22 September 2015.
Stallings, W. High-Speed Network and Internets, 2nd ed.; Prentice Hall PTR: Upper Saddle River, NJ, USA, 2001. [Google Scholar]
Jokar, P.; Arianpoo, N.; Leung, V.C.M. Electricity Theft Detection in AMI Using Customers’ Consumption Patterns. IEEE Trans. Smart Grid2016, 7, 216–226. [Google Scholar] [CrossRef]
Amin, S.; Schwartz, G.A.; Cardenas, A.A.; Sastry, S.S. Game-Theoretic Models of Electricity Theft Detection in Smart Utility Networks: Providing New Capabilities with Advanced Metering Infrastructure. IEEE Trans. Smart Grid2015, 35, 66–81. [Google Scholar] [CrossRef]
Liu, Y.; Hu, S. Cyberthreat Analysis and Detection for Energy Theft in Social Networking of Smart Homes. IEEE Trans. Smart Grid2015, 2, 148–158. [Google Scholar] [CrossRef]
McLaughlin, S.; Holbert, B.; Fawaz, A.; Berthier, R.; Zonouz, S. A Multi-Sensor Energy Theft Detection Framework for Advanced Metering Infrastructures. IEEE J. Sel. Areas Commun.2013, 31, 1319–1330. [Google Scholar] [CrossRef]
Faisal, M.A.; Aung, Z.J.; Williams, R.; Sanchez, A. Data-Stream-Based Intrusion Detection System for Advanced Metering Infrastructure in Smart Grid: A Feasibility Study. IEEE Syst. J.2015, 9, 31–44. [Google Scholar] [CrossRef]
Bergman, D.C.; Dong, J.; Nicol, D.M.; Yardley, T. The Virtual Power System Testbed and Inter-Testbed Integration. In Proceedings of the 2nd Conference on Cyber Security Experimentation and Test, CSET 2009, Berkeley, CA, USA, 10–14 August 2009.
Hong, J.; Wu, S.-S.; Stefanov, A.; Fshosha, A.; Liu, C.-C.; Gladyshev, P.; Govindarasu, M. An Intrusion and Defense Testbed in a Cyber-Power System Environment. In Proceedings of the IEEE PES GM, San Diego, CA, USA, 24–28 July 2011.
Hahn, A.; Ashok, A.; Sridhar, S.; Govindarasu, M. Cyber-Physical Security Testbeds: Architecture, Application, and Evaluation for Smart Grid. IEEE Trans. Smart Grid2013, 4, 847–855. [Google Scholar] [CrossRef]
Benzel, T.; Braden, R.; Kim, D.; Neuman, C.; Joseph, A.; Sklower, K.; Ostrenga, R.; Schwab, S. Experience with DETER: A Testbed for Security Research. In Proceedings of the TRIDENTCOM 2006, Barcelona, Spain, 1–3 March 2006.
Benzel, T.; Braden, B.; Faber, T.; Mirkovic, J.; Schwab, S.; Sollins, K.; Wroclawski, J. Current Developments in DETER Cybersecurity Testbed Technology. In Proceedings of the Cybersecurity Applications and Technology Conference for Homeland Security, CATCH 2009, Washington, DC, USA, 3–4 March 2009.
Sun, C.-C.; Hong, J.; Liu, C.-C. A Co-Simulation Environment for Integrated Cyber and Power Systems. In Proceedings of the IEEE International Conference SmartGridComm, Miami, FL, USA, 2–5 November 2015.
Published by Mirus International Inc., [2010-01-08] MIRUS-FAQ001-B2, FAQ’s Harmonic Mitigating Transformers, 31 Sun Pac Blvd., Brampton, Ontario, Canada. L6S 5P6.
It is much more difficult to accurately determine the energy efficiency of a transformer under non-linear loading than it is under linear loading. The industry accepted technique for measuring transformer efficiency under linear load involves measuring losses using Open Circuit and Short Circuit Tests. The Open Circuit or No-load Test measures core losses (iron losses). The Short Circuit Test or Load Test measures load losses which are also called I2R losses or copper losses. This allows for calculation of Transformer Efficiency = Output Power / (Output Power + Total Losses). This calculation is equivalent to Efficiency = Output Power / Input Power but produces more accurate and repeatable results.
The example below shows how very accurate efficiency calculations can be achieved by measuring losses directly even with a relatively inaccurate power meter (+/- 1.0%).
True Output Power = 97 kW True Input Power = 100 kW, Losses = 3 kW True Efficiency = 97 / 100 or 97%.
Measuring losses directly with a +/- 1.0% power meter yields a measurement error of only +/- 0.03% as follows:
Unfortunately this method of directly measuring the losses themselves inherently applies only to transformer operation with a linear load. For non-linear load we must revert to a much less accurate method of calculating efficiency based upon direct measurements of Output and Input Power. This method will only produce acceptable results if measurements are taken simultaneously by two highly accurate power meters.
An example of how output power vs input power measurements using meters of average measurement accuracy (ie. +/- 0.5%) can produce misleading results is shown below. The earlier example is used but this time measuring input and output power with a meter of +/- 0.5% accuracy (better than previous +/- 1.0%).
Measured Output Power = 97kW + 0.5kW = 97.5 kW Measured Input Power = 100kW – 0.5kW = 99.5kW Calculated Efficiency = 97.5 / 99.5 = 98%, a full 1% error despite measurement accuracy within +/- 0.5%.
This results in a reported 98% efficiency for a transformer that is truly only 97%. Similarly, the calculated result could have been 96% if the errors were reversed. To emphasis the significance of this error, reporting 98% on a transformer that is actually 97% means losses are under reported by a full 1/3 (ie. 2% losses instead of 3%). The measurements are essentially useless. This inaccuracy is magnified further if only one meter is used because even a very small change in the load power between measurements will very dramatically affect the results.
To provide truly accurate and reliable transformer efficiency measurements under non-linear loading, Mirus has built a Non-linear Load Test facility, known as the Harmonics & Energy or H&E Lab, at its manufacturing facility near Toronto (see Figure 16-1).
Figure 16-1: H&E Lab showing Non-linear Load Bank
The H&E Non-linear Load Bank has the capability of loading transformers up to 225 kVA to their full load rating. Larger transformers can be loaded proportionately (ie. 500 kVA to 45% load). This is believed to be the largest 120V phase-to-neutral non-linear load bank of any transformer manufacturer, including all other HMT manufacturers.
In order to achieve the most accurate measurements possible, the H&E Lab is equipped with two revenue class digital power meters with an accuracy of 0.1% and current transformers with 0.3% accuracy. The meters can measure up to the 63rd harmonic. One meter is used to connect to the transformer primary while the second meter is connected to the transformer secondary. To further improve measurement accuracy, efficiency calculations are based on kW-sec totalization rather than on instantaneous kW readings in order to minimize any sample timing error.
Figure 16-2: Metering Console equipped with 2 x PML ION 7500 Digital Meters
The Non-linear Load Bank in the H&E Lab consists of several Variable Frequency Drives fed with 1-phase power. When supplied with 1-phase power, the 3-phase diode bridge rectifier of a VFD draws current which has a waveform and harmonic spectrum that is representative of a very high K-factor, 1-phase non-linear load similar to that of computer power supplies and other power electronic equipment connected phase-to-neutral.
Figure 16-3: Sample of H&E Lab Non-linear Load Bank current profile on testing of a 45kVA transformer at 100% and 50% loading.
A sample of the typical load profile of the Non-linear Load Bank is shown in Figure 16-3. In this example, a 45 kVA transformer was operated at both 100% and 50% loading. At full load, secondary current was 129A with a K-factor of just over 9 and current total harmonic distortion (Ithd) of 81%. At 50% load, the K-factor increased to over 13 with Ithd > 90%.
In summary, claims of highly accurate transformer testing under non-linear loading by any party should not be accepted without reviewing their complete test procedure and full test report including documentation on measurement techniques and certified instrumentation accuracy. This is particularly important if testing was performed with a single power meter because it would be impossible to take measurements simultaneously..
Harmonics and Harmonic Mitigating Transformers (HMT’s) Questions and Answers
This document has been written to provide answers to the more frequently asked questions we have received regarding harmonics and the Harmonic Mitigating Transformer technology used to address them. This information will be of interest to both those experienced in harmonic mitigation techniques and those new to the problem of harmonics. For additional information visit our Website at www.mirusinternational.com.
Published by Pavan Babu Bandla 1, Indragandhi Vairavasundaram 1, Yuvaraja Teekaraman 2, Ramya Kuppusamy 3 and Srete Nikolovski 4,*
1School of Electrical Engineering, Vellore Institute of Technology, Vellore 632014, India 2MOBI-Mobility, Logistics and Automotive Technology Research Centre, Vrije Universiteit Brussel, 1050 Brussels, Belgium 3Department of Electrical and Electronics Engineering, Sri Sairam College of Engineering, Bangalore 562106, India 4Power Engineering Department, Faculty of Electrical Engineering, Computer Science and Information Technology, University of Osijek, 31000 Osijek, Croatia *Author to whom correspondence should be addressed.
Abstract
Voltage sag is one of the most significant power quality problems in the industry and has a significant impact on induction motor safety and stability. This paper analyzes the characteristics of voltage dips in power systems and induction motors with a special emphasis on balanced dips with the help of virtual grids (regenerative grid simulator), as per IEC 61000-4-11. Three phase induction motors with 3.3 kW, 16 A coupled to a DC generator with 3.7 kW, and 7.8 A rated are considered for the test analysis. This paper aids in the development of an induction motor to achieve improved precision by taking different voltage sags into account. The experimental results benefit the design modifications of induction motors at industrial and other commercial levels of consumers regarding major power quality issues and the behavior of the induction motors. A proposed modification employing ANSYS is provided to further examine the precise performance of induction motors during sag events.
Keywords: power quality; voltage sag; induction motor; grid emulator; ANSYS
1. Introduction
Voltage sags are thought to be responsible for between 92–98 percent of all outages caused by power supply problems [1]. As a result, it’s critical to precisely analyze the impact of voltage sags. In the conventional sag characterization technique, voltage sags are characterized by their magnitude and duration. During the sag, the magnitude is defined as a percentage of the remaining voltage (as shown in Figure 1). The duration of the sag in this example is the time between the start and end of the sag. In recent years, one of the most critical concerns that electrical engineers have been aware of is power quality. Various power quality issues, such as voltage sags, voltage distortions, voltage imbalances, and voltage fluctuations, are frequent in power systems, wreaking havoc on generators, transformers, and industrial and home loads [2,3]. The induction motor is one of the most common industrial loads that are affected by power quality issues. Using low-quality voltage to power induction motors results in additional losses, overheating, and a drop in efficiency.
Figure 1. Voltage sag.
Voltage sag is a common occurrence in transmission and distribution systems [4]. Short circuits, overloads, or the starting of powerful motors cause voltage sag, which is a short-term drop in the root mean square (RMS) voltage. Voltage sags are gaining popularity as a result of their negative impact on sensitive equipment. Even if the voltage dips below 90% of the specified voltage for more than a few cycles, such equipment can trip. Furthermore, voltage sags are caused by faults that occur hundreds of kilometers away [5-8]. Even if the voltage sag is not as severe as an interruption, the overall damage caused by sags is larger than that caused by interruptions since there are much more voltage sags than interruptions.
2. Methodology to Test the Sag Conditions Analysis of Sag Conditions
2.1. Regenerative Grid Simulator
A regenerative grid simulator may be used to modify essential parameters in order to replicate a reliable distribution grid/network conditions and settings, as illustrated in Figure 2. In single and three phase modes, variations in voltage amplitude, frequency, voltage dips, and phase angle are all maintained [9-12]. Simulating balanced and unbalanced situations (three phases) is simple. This simulator also satisfies IEC regulatory requirements 61000-4-11, which is a requirement for the AC supply [13-15]. The measurement accuracy of the Regenerative Grid Simulator are: Voltage—0.2% + 0.2% F.S, Current (RMS)—0.4% + 0.3% F, Current (Peak)—0.4% + 0.6% F.S, and Power—0.4% + 0.4% F.S.
Figure 2. Voltage sag testing setup.
2.2. Computer Control
The graphical user interface (GUI) was created with the goal of making the regenerative grid simulator setup as easy as possible. The soft panel (GUI) is installed in a computer that also has data recording functions, allowing many measurements to be reported and saved at the same time.
2.3. Load
For the distribution network, there are three phases—3.3 kW, 16 A with a DC generator as a load with 3.7 kW, and a 7.8 A induction motor are connected. There is also a power analyzer/fluke, since electronic power conversion designs should have high accuracy measurements to analyze and explain the incremental efficiency gains in devices.
2.4. Measurement
A power analyzer or fluke was formerly used to take accurate measurements and display repeated oscilloscope and particular shot events, like turn on and transients. The Oscilloscope utilized was different. The measurement setup’s complexity and configuration time are both decreased. The measurement accuracy for the power analyzer are: basic accuracy (50/60 Hz)—0.05% of reading and best power accuracy (50/60 Hz)—0.1% of reading.
2.5. Test Process
One of four types of communication interfaces (GPIB, RS232, USB, and LAN) is chosen initially for communication between the PC and the AC source. The communication protocol is entered into the main window after it is set. The voltage and frequency parameters, as well as the sinusoidal output waveform, should all be set to the proper values. Phase edit selection can be used to adjust the output voltage in three phases for ease of usage. Various power quality tests may be performed in the PC window, with the results being recorded using the power analyzer.
3. Analysis of Sag Conditions
Figure 3 represents the hardware experimental setup for analyzing the single-phase sag in one of three phases, and symmetrical voltage sags in an induction motor at different stages.
Figure 3. Experimental setup.
3.1. Regenerative Grid Supply with Voltage Sag
In order to meet the Micro Grid test standards, the 61,800 Regenerative Grid Simulator can simulate various test scenarios such as voltage distortion, frequency fluctuations, and so on. Most crucially, the 61,800 series product’s regenerative functionality allows it to absorb power generated by the Discrete Generator (DG) on the micro grid and feed it back to the main grid as shown in Figure 4.
Figure 4. Voltage sag conditions in grid.
Figure 5 represents the voltage sag created in the regenerative simulator as per the IEC-61000 std through the soft panel. These sags are tested under 40%, 70%, and 80% dips, which are created and repeated a number of times in order to assess the behavior.
Figure 5. Voltage sag of (a) 40%, (b) 70%, and (c) 80%.
3.2. Induction Motor under Voltage Sag
Figure 6 represents the test setup of the DC generator-coupled induction motor when subjected to a single-phase sag in one of the three phases of the AC supply, which was created in the regenerative grid simulator. The tested results under loaded conditions with and without neutral connection are tabulated in Table 1 and Table 2.
Figure 6. Voltage sag conditions in grid connected to induction motor under no load.
Table 1. Induction motor under loaded conditions [neutral connected].
Table 2. Induction motor under loaded conditions [neutral not connected].
Figure 7 and Figure 8 represent the THD values of the current and voltage of the induction motor, respectively, during the single-phase sag conditions (neutrally connected) under no load conditions. Figure 9 and Figure 10 represent the same motor under the same conditions, but under loaded conditions.
Figure 7. Current THD of induction motor under no load conditions [neutral connected].
Figure 8. Voltage THD of induction motor under no load conditions [neutral connected].
Figure 9. Current THD of induction motor under loaded conditions [neutral connected].
Figure 10. Voltage THD of induction motor under loaded conditions [neutral connected].
3.3. Three Phase Sag
Generally balanced (symmetrical) voltage sags are caused by three-phase faults anywhere in the system for any short duration [16-19], as shown in Figure 11. In this approach, with the regenerative grid simulator, the three-phase sag is created and fed to the DC generator-coupled induction motor and is shown in Figure 12, Figure 13, Figure 14 and Figure 15. As discussed in Section 4, the test is carried out with neutral and without neutral connections under no load and full load conditions. The results obtained are tabulated in Table 3 and Table 4.
Figure 11. Voltage sag conditions in grid connected to induction motor under loaded conditions.
Figure 12. Voltage sag conditions in grid connected to induction motor under loaded conditions.
Figure 13. Voltage sag conditions in grid connected to induction motor under loaded conditions.
Figure 14. Voltage sag conditions in grid connected to induction motor under loaded conditions.
Figure 15. Voltage sag conditions in grid connected to induction motor under loaded conditions.
Table 3. Induction motor under loaded conditions [neutral not connected].
Table 4. IM-DC generator set under loaded conditions [neutral not connected].
Figure 16 represents the three-phase symmetrical voltage sag at 40%, 70%, and 80% when fed to a three phase—3.3 kW and 16 A with a DC generator as a load via a regenerative grid simulator. The measurement summaries are given below:
Figure 16. Grid connected to induction motor under loaded conditions with a sag of (a) 40%, (b) 70%, and (c) 80%
Voltage (Nominal): 239 V Current (Nominal): 40 A Frequency (Nominal): 50 Hz Number of events: Normal: 2, Detailed: 12 Power measurement method: Unified Type of cable: Copper Harmonic scale: %H1 Mode of THD: THD 40 DPF mode/Cos φ: Cos φ
Table 5 represents the symmetrical sag test on a three phase, 415 V, 5 Hp, 7.8 A induction motor when delta connected under loaded conditions, and star connected under loaded conditions with and without neutral connections, respectively.
Table 5. Delta connected three-phase induction motor under loaded conditions.
Table 6 represents the results of star connected(non-neutral) three phase—7 kW, 7.8 A induction motor under loaded conditions, which are tested with a 40%, 70%, and 80% sag. Under 40% sag, the load can be maintained up to 2.8 kg, which leads to a huge rise of the line current. Under 70% sag, the load can be maintained up to 3 kg, which leads to a huge rise of the line current. Under 80% sag, the load can be maintained up to 3.2 kg, which leads to a huge rise of the line current.
Table 6. Star connected (non-neutral) three-phase induction motor under loaded conditions.
Table 7 represents the results of star connected (neutral) three phase—3.7 kW, 7.8 A induction motor under loaded conditions, which are tested with a 40%, 70%, and 80% sag. Under 40% sag, the load can be maintained up to 2.1 kg, which leads to a huge rise of the line current. Under 70% sag, the load can be maintained up to 2 kg, which leads to a huge rise of the line current. Under 80% sag, the load can be maintained up to 2.4 kg, which leads to a huge rise of the line current.
Table 7. Star connected (neutral) three-phase induction motor under loaded conditions.
4. Design Modifications of the Induction Motor Using ANSYS
The ANSYS is the most widely used tool in the industry for developing and analyzing electric motors. It enables for rapid and exact electromagnetic, thermal, and mechanical analysis of an electric machine over its complete operating range (Figure 17). This product was designed and manufactured in close collaboration with competent electric machine designers. This design carried out in the ANSYS simulation on the basis of the standard parameters of the induction motor and the properties of the modelled induction machine are mentioned below:
Figure 17. 3-D design of Stator and Rotor.
(a) Machine Geometry
Stator parameters Slot Number: 18 Stator Lamination Diameter: 130 Stator Bore: 80 Width of Tooth: 7 Depth of Slot: 18 Tip depth of Tooth: 1 Slot opening: 3 Tip angle of Tooth: 30 Rotor Parameters Rotor Bars: 26 Pole Number: 4 Bar opening and Depth [T]: 1.5 Bar Tip angle [T]: 20 Rotor Tooth Width [T]: 4 Bar Depth [T]: 10 Bar Connections Radius [T]:1.33 Air gap: 1 Shaft Dia: 25
(b) Input Data (Materials)
Figure 18 represents the database of the materials, which are mostly chosen, and an update of this database is also available. Below are the properties of the materials and the weights on which the cost estimates can be based if the price per unit is known.
Figure 18. Different material database for design.
(c) Machine Winding
Figure 19 represents the winding of the induction motor, and the properties are mentioned below:
Figure 19. Induction Motor Winding.
Lap winding: 50 turns Throw: 4 Parallel paths: 1 Winding Layers: 2 Path type: Central
5. Simulation Results
For any motor type, the analytic single load point and no-load point tests are automatically computed. Torque speed/breakdown torque/locked rotor only AC mains (voltage driven) situations have characteristics/acceleration. Figure 20 represents the (a) speed vs. RMS current, (b) speed vs. torque, (c) speed vs. losses, and (d) speed vs. power characteristics of the induction motor with the suggested design modifications.
Figure 20. (a) Speed vs. RMS Current, (b) Speed vs. Torque, (c) Speed vs. Losses, and (d) Speed vs. Power.
6. Conclusions and Future Scope
This paper aids in the development of an induction motor to achieve improved precision by taking different voltage sags into account. Suggested modifications in the design parameters using ANSYS are provided to further examine the precise performance of induction motors during voltage sag events. Since balanced voltage sag is the major sag event, this study focuses solely on this mechanism. The experimental results benefit the design modifications of induction motors at industrial and other commercial levels of consumers regarding major power quality issues and behavior of the induction motors. This paper analyzes the characteristics of voltage dips in power systems and induction motors with a special emphasis on balanced dips, with the help of the virtual grid (regenerative grid simulator) as per IEC 61000-4-11. With regards to future study, the design modifications corresponding to each voltage sag process supports the industrial and other commercial levels of consumers.
Author Contributions: For the authors confirm contribution to the paper as follows: P.B.B.; study con conceptualization, design, and validation. I.V.; formal analysis, investigation, resources, and data curation. P.B.B.; writing—original draft and Simulation preparation. Y.T.; writing—review and editing. R.K. and S.N.; visualization and Supervision. All authors have read and agreed to the published version of the manuscript. Funding: This research received no external funding. Institutional Review Board Statement: Not applicable. Informed Consent Statement: Not applicable. Conflicts of Interest: The authors declare no conflict of interest.
References
Huang, A.; Xiao, X.; Wang, Y. Evaluation Scheme of Voltage Sag Immunity in Sensitive Industrial Process. IEEE Access2021, 9, 66398–66407. [Google Scholar] [CrossRef]
Hasan, S.; Muttaqi, K.M.; Sutanto, D. Application of the Automatic Segmented Hilbert Huang Transform Method for the Evaluation of the Single-Event Characteristics of Voltage Sags in Power Systems. IEEE Trans. Ind. Appl.2021, 57, 1882–1891. [Google Scholar] [CrossRef]
Cunha, M.F.; Jacobina, C.B.; de Freitas, N.B. Grid-Connected Induction Motor Using a Floating DC-Link Converter under Unbalanced Voltage Sag. IEEE Trans. Ind. Appl.2021, 57, 1609–1618. [Google Scholar] [CrossRef]
Liu, J.; Zhao, C.; Xie, Z. Power and Current Limiting Control of Wind Turbines Based on PMSG under Unbalanced Grid Voltage. IEEE Access2021, 9, 9873–9883. [Google Scholar] [CrossRef]
Cheerangal, M.J.; Jain, A.K.; Das, A. Control of Rotor Field-Oriented Induction Motor Drive during Input Supply Voltage Sag. IEEE J. Emerg. Sel. Top. Power Electron.2021, 9, 2789–2796. [Google Scholar] [CrossRef]
Paul, D.; Goswami, A.K.; Kumar, S.; Jain, S.; Pandey, A. Propagation of Voltage Sag Considering Different Winding Connections: Impact on the Healthiness of Transformers. IEEE Trans. Ind. Appl.2020, 56, 6186–6196. [Google Scholar] [CrossRef]
Han, Y.; Feng, Y.; Yang, P.; Xu, L.; Xu, Y.; Blaabjerg, F. Cause, Classification of Voltage Sag, and Voltage Sag Emulators and Applications: A Comprehensive Overview. IEEE Access2020, 8, 1922–1934. [Google Scholar] [CrossRef]
Serrano-Fontova, A.; Torrens, P.C.; Bosch, R. Power Quality Disturbances Assessment during Unintentional Islanding Scenarios. A Contribution to Voltage Sag Studies. Energies2019, 12, 3198. [Google Scholar] [CrossRef]
Ma, L.; Tian, D.; Liu, T.; Gao, S.; Dong, P. An Evaluation Method for Bus and Grid Structure Based on Voltage Sags/Swells Using Voltage Ellipse Parameters. IEEE Access2021, 9, 101959–101971. [Google Scholar] [CrossRef]
Zhang, L.; Bollen, M.H.J. Characteristic of voltage dips (sags) in power systems. IEEE Trans. Power Deliv.2002, 15, 827–832. [Google Scholar]
Alipoor, J.; Doroudi, A.; Ghaseminezhad, M. Detection of the Critical Duration of Different Types of Voltage Sags for Synchronous Machine Torque Oscillation. Energy Power Eng.2012, 04, 117–124. [Google Scholar] [CrossRef]
Mendes, A.; Cardoso, A.J.M. Performance analysis of three-phase induction motor drives under inverter fault conditions. In Proceedings of the 4th IEEE International Symposium on Diagnostics for Electric Machines, Power Electronics and Drives, 2003, SDEMPED 2003, Atlanta, GA, USA, 24–26 August 2003; pp. 205–210. [Google Scholar]
Programmable Automated Test Equipment. Available online: https://www.chromausa.com (accessed on 1 January 2021).
Electronic Design, Test Automation and Measurement Equipment. Available online: https://www.keysight.com (accessed on 1 January 2021).
Gallo, D.; Landi, C.; Luiso, M.; Fiorucci, E. Survey on Voltage Dip Measurements in Standard Framework. IEEE Trans. Instrum. Meas.2013, 63, 374–387. [Google Scholar] [CrossRef]
Thakur, P.; Singh, A.K. Unbalance Voltage Sag Fault-Type Characterization Algorithm for Recorded Waveform. IEEE Trans. Power Deliv.2013, 28, 1007–1014. [Google Scholar] [CrossRef]
Li, Y.; Mao, C.; Zhang, B.; Zeng, J. Voltage Sag Study for a Practical Industrial Distribution Network. In Proceedings of the 2006 International Conference on Power System Technology, Chongqing, China, 22–26 October 2006; pp. 1–4. [Google Scholar]
Janda, M.; Makki, Z.; Konicek, P. Calculation of the vibration induction motor using the finite element method. In Proceedings of the 16th International Conference on Mechatronics—Mechatronika 2014, Brno, Czech Republic, 3–5 December 2014; pp. 526–529. [Google Scholar]
Electromagnetic Compatibility (EMC)Part 4–11: Testing and Measurement Electromagnetic Compatibility (EMC)Part 4–11: Testing and Measurement Techniques Voltage Dips, Short Interruptions and Voltage Variations Immunity Tests; IEC Standard 61000-4-11; International Electrotechnical Commission: London, UK, 2004.
Published by Mirus International Inc., [2010-01-08] MIRUS-FAQ001-B2, FAQ’s Harmonic Mitigating Transformers, 31 Sun Pac Blvd., Brampton, Ontario, Canada. L6S 5P6.
The Energy Star program is sponsored by the US Environmental Protection Agency (EPA) and is designed to encourage the use of energy efficient products. The Energy Star logo is found on many household appliances and other products identifying that they’ve been designed to specific energy efficiency standards.
For transformers, the Energy Star program is based upon the NEMA TP-1 ‘Guide for Determining Energy Efficiency for Distribution Transformers’. NEMA TP-1 defines minimum efficiency levels for transformers with linear loads at 35% loading. This criteria was chosen based on surveys which indicated that the average loading on distribution transformers in North America is about 35%. The efficiency limits vary by transformer size but are generally in the 98% range. In choosing 35% loading, NEMA TP-1 puts extra emphasis on no-load (core) losses rather than load (copper) losses. Because of its emphasis on no-load losses, NEMA TP-1 specifically exempts transformers which service non-linear loads. The following are taken from its exemption list:
Drives transformers, both AC and DC
All rectifier transformers and transformers designed for high harmonics
Special impedance, regulation and harmonic transformers
The reason that transformers designed for high harmonics are exempted is that harmonics will dramatically increase load losses (I2R and eddy current) and have very little effect on no-load losses. Therefore, NEMA TP-1’s emphasis on no-load losses can be counter productive when supplying non-linear loads. To meet the efficiency limits, a manufacturer must optimize for lower no-load losses, sometimes at the expense of higher load losses. For example, one common way of reducing no-load losses is to add more steel to the transformer’s core. With a larger core, each turn of the transformer’s windings must cover a larger circumference. The extra length of copper winding adds resistance which increases I2R load losses. This can significantly INCREASE losses and REDUCE efficiencies when supplying non-linear loads at load levels above 50%.
For an optimal HMT energy efficiency design, Mirus’ Harmony-1E™ HMT not only meets NEMA TP-1 minimum efficiencies at 35% load but also in the entire operating range from 35% to 65%. In this manner, we can assure energy savings not only at lightly loaded conditions but also at more heavily loaded conditions when harmonics have their most significant influence on losses. (See Figures 14-1 and 14-2 in Question 14 for comparison of energy savings).
Harmonics and Harmonic Mitigating Transformers (HMT’s) Questions and Answers
This document has been written to provide answers to the more frequently asked questions we have received regarding harmonics and the Harmonic Mitigating Transformer technology used to address them. This information will be of interest to both those experienced in harmonic mitigation techniques and those new to the problem of harmonics. For additional information visit our Website at www.mirusinternational.com.
Published by Morsy Nour 1,2,*, José Pablo Chaves-Ávila 1 , Gaber Magdy 2 and Álvaro Sánchez-Miralles1
1Institute for Research in Technology (IIT), ICAI School of Engineering, Comillas Pontifical University,28015 Madrid, Spain; jose.chaves@iit.comillas.edu (J.P.C.-Á.); alvaro.sanchez@iit.comillas.edu (Á.S.-M.) 2Department of Electrical Engineering, Faculty of Energy Engineering, Aswan University, Aswan 81528, Egypt; gabermagdy@aswu.edu.eg, *Correspondence: morsy.mohammed@iit.comillas.edu
Abstract: There is a continuous and fast increase in electric vehicles (EVs) adoption in many countries due to the reduction of EVs prices, governments’ incentives and subsidies on EVs, the need for energy independence, and environmental issues. It is expected that EVs will dominate the private cars market in the coming years. These EVs charge their batteries from the power grid and may cause severe effects if not managed properly. On the other hand, they can provide many benefits to the power grid and get revenues for EV owners if managed properly. The main contribution of the article is to provide a review of potential negative impacts of EVs charging on electric power systems mainly due to uncontrolled charging and how through controlled charging and discharging those impacts can be reduced and become even positive impacts. The impacts of uncontrolled EVs charging on the increase of peak demand, voltage deviation from the acceptable limits, phase unbalance due to the single-phase chargers, harmonics distortion, overloading of the power system equipment, and increase of power losses are presented. Furthermore, a review of the positive impacts of controlled EVs charging and discharging, and the electrical services that it can provide like frequency regulation, voltage regulation and reactive power compensation, congestion management, and improving power quality are presented. Moreover, a few promising research topics that need more investigation in future research are briefly discussed. Furthermore, the concepts and general background of EVs, EVs market, EV charging technology, the charging methods are presented.
Keywords: electric vehicles; uncontrolled charging; delayed charging; controlled charging; V2G; V2B; V2H; peak shaving; valley filling; congestion management; renewable energy sources
1. Introduction
Greenhouse gases (GHGs) emissions, global warming, and climate change are getting significant attention worldwide [1]. Countries aim to diminish the use of fossil fuel which is the main reason behind these issues. Most of fossil fuel consumption is in electricity generation and transportation sectors [2]. In 2014, 35% of the total energy consumption was by the transportation sector [3]. Electricity generation can cut fossil fuel usage by moving to renewable energy sources (RESs) instead of traditional nonrenewable generation and transportation sector can cut fossil fuel usage by moving to electrified transportation. With this transformation in the transportation sector, carbon dioxide (CO2) emissions can be reduced [4,5]. The advancement in EV technology can lower the reliance on fossil fuels and leads to emission reduction [5]. Charging the EVs from a power grid with high share of RESs generation contributes more to decreasing pollutant emissions [6].
Electrified transportation like metros, electric trains, trolleybuses, trams, etc., are widely used in many countries public transportation and is considered a mature technology, but private electrified transportation like private EVs have not had large adoption in the past due to limitations in battery technology in terms of heavy weight, high price, short life, and long charging duration. Due to the breakthroughs and recent developments in battery technology, EVs are proposed as a competitor to traditional vehicles driven by gasoline due to the fast decline of EV prices [7]. Moreover, EVs produce no pollution (locally) and have a very high energy conversion efficiency compared to traditional vehicles because the internal combustion engine (ICE) is less efficient than the electric motor (EM). Furthermore, several countries already initiated governmental programs to increase EVs market share by financial subsidies and tax exemptions to motivate people to buy EVs. Additionally, many car manufacturers produce various types of EVs that have different specifications and prices. This gives the buyer a lot of options to choose from depending on his budget and car usage (i.e., long distance or short distance).
These EVs can be charged from large charging stations, street chargers, workplace chargers, and private home chargers [8], which will be supplied from the distribution network. It is expected that this new load which draws a large amount of electric energy from the power system in a short time will have harmful effects on the distribution network if not managed optimally and will foster the need for large infrastructure upgrades, which are an economic burden for utility companies. Therefore, comprehensive studies should be executed to understand and assess the characteristics of EVs load and probable effects they may have on the electric power system, especially the distribution networks [9], and consider this new load in the design, operation, and planning processes. Additionally, techniques to minimize and alleviate these negative effects and for optimal integration of EVs into the power grid should be developed [10].
A large number of research studies have investigated and assessed the impacts of uncontrolled EV charging on distribution networks due to uncertainties related to these studies. Many uncertainties should be considered like charging start time, the charger power rating, the charging location, EVs battery capacity, EVs battery state of charge (SoC) [11] when started charging, penetration level, and distribution network status. The studies assessed the impacts of uncontrolled EVs charging on distribution networks total power demand [12], transformer loading and life [13], cable loading [14], voltage profile [15], power losses [16], voltage and current unbalance [17], and harmonics distortion [18]. Moreover, various studies proposed solutions for optimal integration of EVs by delayed charging, smart charging, vehicle to grid (V2G) technology, vehicle to building (V2B) technology, and vehicle to home (V2H) technology, and how it can provide electrical services like frequency regulation, voltage regulation and reactive power compensation, peak shaving and valley filling, integration of RESs, spinning reserves, and improving power quality [19,20].
This paper is organized as follows: Section 2 presents a general background of EVs, EVs market, EVs types, the benefits and challenges of EVs, and EV charging technology. Section 3 presents the charging and discharging methods; for instance, uncontrolled charging, delayed charging, controlled charging, V2G technology, V2B technology, and V2H technology. Section 4 presents the negative impacts of uncontrolled EVs charging on electric power systems. Section 5 presents the positive impacts of controlled charging and discharging of EVs on electric power systems. Section 6 presents a few promising research topics that need more investigation in future research. Finally, conclusions are presented in Section 7.
2. Electric Vehicles Technology
An EV is a vehicle that is powered or driven, at least in part by electricity such as trams, metros, electric cars, electric trains, trolleybuses, etc. Most of the mentioned technologies are mature and widely used, except the private EVs (i.e., electric cars), but they are getting huge attention in the last years. EV technology is not new as it appeared in the 19th century powered by lead–acid batteries and it was not used a lot because the fuel-powered cars, i.e., internal combustion engine vehicles (ICEVs), showed better performance at that time because the energy density of fuel was better than lead–acid batteries. Usually, EV terminology is widely used to refer to private electric cars and not to other electrified transportation methods like trams, metros, etc.
2.1. Electric Vehicles Market
Based on the 2019 global EV outlook report of the International Energy Agency (IEA) [7], there is a very rapid growth of EVs market. The report shows that the EVs stock crossed 3 million in 2017 and exceeded 5 million in 2018. China represents the largest EVs market, then Europe and the United States after that. Norway achieved the highest deployment of EVs with a market share of 46% followed by Iceland 17% and Sweden 8%. It is expected that the number of EVs will increase significantly in the coming years. The forecasts for EVs number at 2030 between 130 and 250 million. There are many EVs in the market now from several manufacturers (BMW, Chevrolet, Ford, Hyundai, Kia, Mercedes-Benz, Mitsubishi, Nissan, Tesla, Renault, Volkswagen, etc.) with different specifications (battery technology, battery capacity, electric motor power, electric range, and onboard charger power rating,) which gives a wide range of options for people interested in buying an EV. Although the fast increase in the EV market, it still represents a small percentage of the global passenger light-duty vehicles market currently. This means that EVs have a long way until they become capable of making a significance in GHGs emissions and oil demands.
It should be mentioned that large scale adoption of EVs will have economic impacts and they should be viewed from two points of view, the EV owners’ point of view and the power grid point of view [21]. From the power grid point of view, a high-power load represented in EVs will be introduced, which means additional expenses in fuel and generation capacity [22]. The grid power losses will rise, although they can be reduced by the use of controlled charging approaches [23]. Several studies showed that the electric power system will have a significant power loss due to EVs charging with different penetration levels. The lifespan of transformers and cables in the distribution grid may decrease due to excessive uncontrolled charging. A study in [24] showed that controlled charging of EVs results in reducing the peak demand and 60% saving in the system cost. Therefore, the improvement in EVs charging infrastructure and charging strategies need attention to enhance the power grid economic aspects. From EV owners’ point of view, various benefits can be achieved like reducing the operating costs due to lower electricity prices compared with fuel and higher efficiency of EMs used in EVs compared with ICEs used in ICEVs [25]. On the other hand, the high initial cost of EVs due to the expensive batteries used compared with ICEVs represents a considerable challenge. Mass production of EVs, advancement in battery technology, new charging infrastructure and smart charging strategies, and providing rewards and incentives to EVs owners may control the high initial cost of EVs [26-28].
2.2. Types of Electric Vehicles
There are many types of EVs categorized according to the energy converter (i.e., ICE or EM) used to propel the vehicle, the power source (i.e., battery, fuel cell, or gasoline), and if it charges from an external source (i.e., charging station or home charger) [4]. A brief explanation of those types is presented in the following subsections. The basic structure of different EVs types is shown in Figure 1.
Figure 1. Basic structure of different electric vehicles (EVs) types. (a) Hybrid Electric Vehicle (HEV); (b) Plug-in Hybrid Electric Vehicle (PHEV); (c) Battery Electric Vehicle (BEV); and (d) Fuel Cell Electric Vehicle (FCEV).
2.2.1. Hybrid Electric Vehicle (HEV)
HEV is similar to ICEV but with oversized EM and battery. The battery can be charged by regenerative braking and by the ICE at light loads. Usually, battery and EM drive the vehicle at lower speeds and the ICE drives the vehicle at higher speeds. Furthermore, EM can assist the ICE at high load and enhance vehicle performance and efficiency. HEV has lower GHGs emissions and fuel consumption than ICEVs. In this type, no charging from distribution network by EV charger is used [29,30]. Therefore, it does not result any negative impacts on the power system due to battery charging and cannot provide any electrical services. There are different structures of this type [29]: series, parallel, series/parallel, mild, and complex HEVs, in addition to series/parallel plug-in hybrid electric vehicle (PHEV) which is explained in the next subsection. The basic configuration for parallel HEV is shown in Figure 1a.
2.2.2. Plug-in Hybrid Electric Vehicle (PHEV)
This is a HEV, but its battery can be charged by regenerative braking, by ICE, and EV charger supplied from distribution network as well. It is characterized by larger EM power, smaller ICE, and larger battery capacity compared with HEV in order to extend the electric range. It can operate in all-electric mode and use EM only which results in zero GHGs emissions. The capacity of the battery specifies the range of electric operation [29,30]. This type usually has a small battery capacity. Therefore, it is expected that it has a limited negative impact on electric power system. Moreover, its ability to provide electrical services is limited. PHEV can be in any hybrid configuration. The basic configuration for parallel PHEV is shown in Figure 1b.
2.2.3. Battery Electric Vehicle (BEV)
BEV is expected to dominate the EVs market with future advancements in battery technology and price reduction. BEV contains only EM which is powered by a battery and does not contain ICE. The electric driving range depends on battery capacity. The main advantage of this type is that it produces no emissions locally, which is very crucial in big cities. There are many configurations of this type [29] depending on different companies’ designs but the basic configuration and principal components are shown in Figure 1c. The battery is charged from the distribution network by different kinds of EV chargers. Moreover, during deceleration and braking of EV the motor operates as a generator and produces electric energy that charges the battery. This is called regenerative braking which is used in other public electrified transportation like metros and trams too. To enable regenerative braking bidirectional DC/AC converter is used. It allows electric energy to flow from battery to AC motor in the driving mode and from the AC motor to the battery in braking mode [29,30]. The main challenge for BEV is the long charging period and limitation of public charging infrastructure. This issue will be tackled in the near future with the advancement in battery technology which will extend the electric range that the EV can drive before the need to be recharged. Furthermore, the large-scale deployment of public fast charging stations will reduce EV owners range anxiety. Moreover, in the future, BEV manufacturers may enable battery swapping. This means replacing the empty battery with a fully charged one in battery swapping station which needs a very short time. More details about battery swapping are given in Section 2.4.3. This type of EVs has the largest battery capacity and its charging can result in a severe negative impact on the power system if not managed properly. Additionally, its ability to provide electrical services is higher than other EV types.
2.2.4. Fuel Cell Electric Vehicle (FCEV)
FCEV is powered by EM like BEV, but it uses a fuel cell instead of a battery. The vehicle is refueled with hydrogen and the fuel cell converts hydrogen gas chemical energy to electric energy which powers EV motor. Hydrogen can be produced from fossil fuels like natural gas or water electrolysis. FCEV has short refueling time like ICEVs [29,30]. The basic configuration of FCEV is shown in Figure 1d. It can also work with a combination of battery and supercapacitors. If no battery is used, this vehicle type will have no impact on the power system because it does not need electric charging from distribution system.
2.3. Benefits and Challenges of Electric Vehicles
It is essential to introduce the advantages and disadvantages of conventional vehicles which are dominant in the market now. Table 1 shows the advantages and disadvantages of ICEVs. The disadvantages of ICEVs might be a big problem in the future of the transportation sector. This was the reason to look for some alternatives. EVs appeared as a promising solution to some of these disadvantages.
Table 1. Advantages and disadvantages of internal combustion engine vehicles (ICEVs).
EVs show many benefits compared with ICEVs but few challenges must be faced to increase EVs adoption. Table 2 shows both the benefits and challenges of EVs [29,31]. Because both traditional vehicles and EVs have their strengths and weaknesses, hybrid vehicles (i.e., HEVs and PHEVs) with several configurations appeared, which try to combine the strengths of both types and avoid weaknesses.
Table 2. Benefits and challenges of EVs.
2.4. Electric Vehicles Charging Technologies
EVs charging can be classified into three main technologies: conductive charging, wireless (i.e., contactless) charging (WC), and battery swapping. Conductive charging is the simplest and the currently used charging method. For conductive charging, there is physical contact (i.e., cable) between the power supply and battery but for WC there is no physical contact. WC and battery swapping are not widely used like conductive charging and still under study and development. The following subsections will provide more details about these technologies. Figure 2 presents classification of different charging technologies.
Figure 2. Classification of EVs charging technologies.
2.4.1. Conductive Charging
EV battery chargers have a significant responsibility in the advancement of EVs because the EVs adoption and social acceptance depends on the effortless access to charging stations or street chargers. Several topologies were presented for single phase and three phase EV chargers [32,33]. It consists of AC/DC converter, power factor correction elements, and DC/DC converter as shown in Figure 3. Charger systems are classified to on-board (i.e., inside vehicle for slow charging) and off-board (i.e., outside vehicle for fast charging). Moreover, they can be classified to unidirectional or bidirectional chargers [34]. Unidirectional charging has simple charging hardware and allows power flow from grid to EV only. Bidirectional charging allows power flow from the grid to EV and can inject power from the EV battery to the grid, building, or home.
Figure 3. Onboard EV charger components.
Availability and advancement of EV charging infrastructure can decrease the required onboard energy storage and decrease the range anxiety of EV owners. According to the Society of Automotive Engineers (SAE) Standard J1772 [35], there are three charging levels. Most of the EV owners are expected to charge at home overnight according to the Electric Power Research Institute (EPRI) so Level 1 and Level 2 chargers will be the primary option [36], while level 3 will be used for commercial charging stations.
Level 1 Charging
This is the slowest charging way and the simplest because no additional infrastructure is needed, and any wall outlet can be used. In the US, a standard 120 V/15 A wall outlet is used for Level 1. It is available only as an on-board charger. Although its cost is less than other charging levels, the EV needs a long time to be fully charged. Due to its low power rating, this charging level has the lowest impacts on distribution systems.
Level 2 Charging
Level 2 charging uses 208 V or 240 V at currents up to 80 A, and 19.2 kW charging power. EV owners prefer Level 2 compared with Level 1 because of its shorter charging time. It may need dedicated electric vehicle supply equipment (EVSE) installation for public or home charging. Some EVs like Nissan Leaf have an on-board charger of this charging level.
Level 3 Charging
Level 3 is for fast charging and it operates as a commercial refueling station (i.e., less than 1-h charging time) similar to the conventional gas station which can be installed at city main roads and highways. It is supplied from a three phase circuit with 480V or higher voltages. It is available only as an off-board charger because the charging power is high and may exceed 100 kW. It is clear that level 3 charging is not suitable for home charging. It has a high installation cost, and this represents a potential issue. It is expected that public chargers will use Level 2 or Level 3 for fast charging in shopping centers, parking lots, restaurants, hotels, theaters, etc. High charging power represents an advantage from charging time point of view, but it may generate a peak demand and overload the distribution network equipment in addition high installation cost.
2.4.2. Wireless Charging (WC)
WC enables EVs charging without physical contact or cable between the power supply and battery. Advancement of WC will reduce the required onboard battery capacity which will decrease EVs price and mass, which will result in reduction of EVs energy consumption. WC may become a future alternative for traditional conductive charging. WC has a potential to be used for charging electric bus batteries [37]. It can operate at different voltages (level 1, 2, and 3). The highest efficiency recorded for WC is 90% [38]. There are three main technologies of WCS: inductive, resonant inductive, and capacitive WC [39,40].
Inductive wireless charging (IWC) will be explained to provide the basic idea of this technology. The IWC contains AC/DC converter that converts AC power supplied from electricity grid to DC. Then, it is converted again to AC power with high frequency fed to transmitting (i.e., primary) coil. All these components are in the street underground. The EV contains receiving (i.e., secondary) coil that receives power from transmitting coil by electromagnetic induction through the air gap. Then the AC power is converted to DC by AC/DC converter and charge the battery [41]. A simplified diagram of IWC that explains the main concept is shown in Figure 4. IWC can be classified into static inductive charging and dynamic inductive charging. For static inductive charging, EV must be stationary during charging. However, dynamic inductive charging allows WC while EV is moving [42].
Figure 4. A simplified diagram of inductive charging.
Current WC is designed for unidirectional power flow from grid to vehicle, but future development of this technology is to enable EVs to discharge power to the grid wirelessly to provide electrical services. The advantages of this technology are electrical safety, no cables needed, and user convenience. The challenges of this technology are the high infrastructure cost compared to conductive charging, and low power transfer efficiency between coils [40].
2.4.3. Battery Swapping
Battery swapping station (BSS) is a charging station at which the empty EV battery will be replaced by a fully charged battery in few minutes [43]. Battery swapping may be used with electric buses that have a high capacity battery which will take a long time to be charged by traditional conductive charging. This technology requires a large stock of batteries owned by the BSS or a third party and rented to EV owner. BSS contains a distribution transformer, AC/DC converters to charge the batteries, batteries, and battery swapping equipment [44,45]. Some studies considered that BSS can use bidirectional chargers to provide electrical services by V2G mode [46,47]. The challenges of this technology are battery standardization, high infrastructure cost, and large space for BSS. In 2013, Tesla company revealed a battery swapping system that can swap the battery in 90 s [48].
3. Charging and Discharging Methods
Charging methods can be classified into two main categories, unidirectional and bidirectional charging. In unidirectional charging the energy flow is only from the grid to EV (i.e., uncontrolled charging, delayed charging, and controlled charging). In bidirectional charging, energy can flow from the grid to EV and from EV to the grid or loads as buildings, or homes (i.e., V2G, V2B, and V2H). Figure 5 presents the classification of different charging and discharging methods. Figure 6 shows how the total power demand profile of distribution system will change with different EV charging or discharging methods [10].
Figure 5. Classification of different charging and discharging methods.
Figure 6. Total power demand profile with different charging and discharging methods. (a) Uncontrolled charging; (b) Delayed Charging; (c) Controlled Charging; and (d) V2G, V2B, and V2H.
3.1. Uncontrolled Charging
This is the simplest method to charge EVs and the current used way. The EV is plugged in for charging at the maximum power rating of EV charger until the EV battery is fully charged (i.e., state of charge (SoC) is 100%), similar to any electric device with a battery (i.e., laptop, smart phone, etc.). Several studies concluded that uncontrolled charging of EVs may result in severe negative impacts on distribution networks such as increase in peak load demand, overloading of transformers and cables and shorten their life, increase voltage drop, increase system unbalance due to single phase chargers, increase power losses, and increase harmonic distortion [49,50]. Moreover, this type of charging limits the EVs acceptable penetration level, because EV owners charge their vehicles when arriving home from work, which usually coincides with peak hours as shown in Figure 6a. The figure shows the total power demand of residential consumers during the day [51] before connecting EVs (in grey) and how the total power demand will change when EVs are connected to the distribution network for charging. Furthermore, it will accelerate the need for infrastructure upgrade. This charging method is also known as dumb charging, uncoordinated charging, and unregulated charging.
3.2. Delayed Charging
The severe impacts of uncontrolled charging can be alleviated with the use of delayed charging. In this case, the utility has different electricity prices during the day with low price at off peak time (i.e., time utility wants EV owners to charge at) and high price at peak time (i.e., time utility does not want EV owners to charge at). This method controls the charging time and not the charging power (i.e., EV charge at charger maximum power rating). With the optimal design of electricity tariff prices during the day, it can work as an incentive for EV owners to charge their vehicles on low price times which maximize both utility (i.e., distribution system operator (DSO) or distribution company) and EV owners benefit and result in valley filling as shown in Figure 6b. Although this method is a very simple technique to flatten the load profile and shift the load to off peak time, non-optimal design of electricity price, can incentivize a large number of EV owners to charge at off peak times, which may result in a second peak especially at the beginning of off peak time. Moreover, this method ignores EV owners’ preferences and needs to charge their EVs at different times during the day. This charging method is also known as off peak charging, and indirect controlled charging with time of use pricing [52,53].
3.3. Controlled Charging
Although delayed charging has less impacts on distribution networks than uncontrolled charging, it has limitations. These limitations can be surpassed using controlled charging. This method controls the charging time and charging power of EV depending on some distribution network parameters like total power demand, transformer loading, voltage stability, power losses, etc., or to minimize the charging cost. In this technique, EV acts as a controllable load. Various studies proposed controlled charging algorithms for maximizing EV owner benefit by charging cost reduction and maximize utility benefit by distribution network stress and losses reduction, enhancement of power quality, and shifting the EV load to off peak hours which result in valley filling [54,55] as shown in Figure 6c. This charging method is also known as coordinated charging and smart charging.
Controlled charging can be classified as centralized, decentralized, and autonomous control architecture [56]. In centralized control, a central controller collects data such as electricity prices, system loading condition, EVs status, and owner preferences; based on this data the controller determines the set points of controlled EVs. Although centralized charging control usually results in optimal use of the system and enables EVs to participate in many electrical services, it has few disadvantages. There are privacy issues because all users data can be accessed by the central controller, the need for expensive two way communication infrastructure, large data amount must be processed, which is a high computational burden, any problem in the central controller or loss of communication can lead to severe consequences, and a large number of messages should be communicated in a short period which can result in communication issues. Moreover, most of the utility companies do not use real time pricing, which makes this method inapplicable currently [56].
In decentralized charging control, the control entity (i.e., DSO or aggregator) sends signals to EVs like electricity prices to incentivize them to take a specific action such as reducing their charging power or stop charging at peak hours. In this case no need to send EVs private information to the control entity. Although decentralized control methods need a cheaper processing and communication infrastructure compared with centralized control methods, they have few disadvantages. The optimal utilization of the system is not ensured, their ability to participate in ancillary service markets is limited and they are vulnerable to variations in customers behavior [56].
In autonomous charging control, the charging power is regulated based on local inputs such as voltage and battery SoC without any communication between EVs and control entity [57,58]. Usually, autonomous charging control is classified as decentralized control with no communication. Although this control architecture is the single option for distribution systems with no communication facilities and it can enable the integration of a larger number of EVs to the power grid in its current status, it has few disadvantages. Their ability to participate in ancillary service markets is limited, they are vulnerable to variations in customers behavior and the system cannot be operated optimally [56].
3.4. Vehicle to Grid (V2G)
This refers to the capability of EVs to supply power to the distribution network and operate as distributed energy storage devices. Bidirectional EV chargers are used to enable the electric power to flow in both directions from grid to vehicle (i.e., charging) and from vehicle to grid (i.e., discharging). When there is surplus electric energy (off-peak times) EVs will charge, which is called grid to vehicle (G2V) mode, and when there is a deficit in electric energy and consumption is higher than generation, EVs will supply power to the distribution network and this enhances the system reliability and efficiency [59]. So EVs can be seen by utilities as load and source. Because EV power and energy are limited and approximately have no effect on the power system, usually an aggregator is the responsible for aggregating EVs power or energy, which are located in geographical area to participate in electrical services.
The interaction in this case is between EV and power system management organization like DSO, which has to operate the power system in a reliable way. V2G can provide many grid services such as frequency regulation, spinning reserve, enabling the integration of more RESs, and peak load shaving and valley filling [60] as shown in Figure 6d. Other benefits of V2G is generating revenues for EV owners, and decrease emission and operating cost if grid services were provided by traditional nonrenewable generation [60]. Although this is a very promising technology regarding providing electrical services to the power system, it has many challenges and barriers. This technology is very complex and needs many infrastructure changes because it needs bidirectional chargers and continuous two-way communication between EVs and system operator or aggregator. Moreover, it is expected that continuous charge and discharge of EV battery may lead to battery degradation and shortening its life. In contrast, new studies concluded that EV can participate in V2G without battery degradation [61].
3.5. Vehicle to Building (V2B)
V2B is similar to V2G but in V2B there is no communication between the vehicle and the grid, and it only communicates with the building so the energy stored in the EV battery can be used to supply the building loads only. The use of V2B mode can be very effective during peak load times and outage conditions. EVs are used as an energy storage device and operates in two modes: G2V and V2B. It operates in a G2V mode to charge the battery at low cost when the grid is lightly loaded and there is surplus electric power generation. It operates in a V2B mode to supply the building loads when the electricity price is high at peak hours [62]. By doing this V2B is providing peak shaving and valley filling which is utility benefit and reduce building expenses by discharge at periods with high electricity prices and reduce building demand from the grid. This method is simpler than V2G as it operates behind the building meter, but it provides less electrical services to the power system. V2B involves one building (i.e., many homes) and many EVs.
3.6. Vehicle to Home (V2H)
This is very similar to V2B but in this case, only one home is involved and not a whole building as in V2B and only one EV. Normally EV absorbs power from home and can supply power to home when needed. It needs a simple architecture compared to V2G and V2B and can provide less electrical services to the power system compared to them. It can flatten the house daily load profile and reduce house consumption during peak hours with high electricity prices. Local energy production from photovoltaic (PV) or small wind generation can be effectively used by storing the excess generation in EV battery and use it when needed [63,64].
4. Negative Impacts of Electric Vehicles on Electric Power Systems
Uncontrolled charging of EVs with high penetration levels is expected to introduce unwanted negative impacts on the power system. The possible negative impacts are the impact due to increase of peak demand, voltage deviation from the acceptable limits, phase unbalance due to the single-phase chargers, harmonics injection, overloading of the power system equipment, and increase of power system power losses [65]. A large number of studies have investigated these impacts because the estimation of EVs charging impacts is based on several conditions [65] and have many uncertainties that must be considered and modeled properly in the study to accurately estimate the impact of EVs charging on the power systems, the main key variables are [66,67]:
EV battery charger
Depending on the charging infrastructure and the EV model single phase or three phase chargers may be used for charging. Moreover, there are many power ratings for EVs chargers operating at different voltage levels. So, the fast chargers are expected to increase the peak demand in a larger value compared with slow chargers.
Time
The time of connecting the EVs for charging is not certain so it is unknown how many EVs may be charging at the same time and the probability that the EV charging time interferes with the peak demand time of the distribution networks. Some studies assume the charging start time of EVs, and other studies make surveys in a geographical area or a city to know the home arriving time of vehicles and model it as probability distribution.
Location
The place at which an EV charge is random. EV owner may charge at home, friend’s home, street charger, or charging station. It may be different from distribution network to another where are the charging locations and what are the EV charger type (i.e., private or commercial chargers).
Battery capacity
There are a wide range of EV batteries capacity. PHEV usually contains a small battery capacity while BEV contains higher battery capacity. EVs with high battery capacity will draw a larger amount of energy from the power grid.
Battery SoC
The battery SoC at the plug-in instant is stochastic. Many studies assume the SoC and others consider it as a probability distribution.
Penetration level
EVs still have a very small market share which will increase quickly for few countries like Norway and slowly for many other countries. Therefore, many studies considered different EVs penetration levels ranging from 10% to 100%.
Distribution system status
There are many differences between distribution systems in terms of structure (i.e., radial or ring), equipment loading condition before connecting EVs, voltage level (i.e., medium voltage or low voltage), voltage profile, daily load profile of loads, etc.
Therefore, numerous studies were executed to assess the impacts of EVs charging on the power system. Most of the studies focus on the distribution network at which EVs charging occurs, because the most severe impacts are expected to occur at the distribution level. Classification of positive and negative impacts of EVs charging/discharging on electric power system can be seen in Figure 7 and they are explained in the following sections.
Figure 7. Classification of EVs charging impacts on electric power systems.
4.1. Impacts Due to Increase in Peak Demand
Various studies have been performed for assessment of EVs charging impact on the peak demand and load profile on distribution systems. Many distribution networks in different countries and with different topologies and characteristics were chosen to conduct these studies. In [68], the peak demand increased by 53% when uncontrolled EVs charging was used with 30% penetration level. In another study [69], with only 10% penetration level of uncontrolled EVs charging in residential network, the peak demand increased significantly. In [70], the effect of charging light duty vehicles up to 100% penetration level on system peak demand was investigated. For 100% penetration level, uncontrolled charging resulted in a high increase in peak demand, which must be minimized by delayed charging. In [71], it was found that EV rapid charging at peak hours will result in a significant rise in peak demand and equipment limits were exceeded even with very small penetration levels. However, by the use of slow charging at off peak hours, distribution network could integrate up to 50% penetration level without violating equipment limits.
In [72], the impact of uncontrolled charging of EVs on total power demand for three distribution networks (i.e., urban, suburban, and rural) with different capacities were evaluated. The study considered penetration levels up to 25%. For the highest penetration level, the peak demand increased by 9% for both urban and rural networks and 11% for suburban network. This increase made the rural network exceed the maximum capacity limit while urban and suburban did not exceed the capacity limit. In [73], it was found that uncontrolled charging increased the peak demand. The study proposed a demand response method to control EVs demand and other flexible home devices. This method enabled the integration of EVs without increase in peak demand from the base case (i.e., without EVs).In a recent study [74], the impacts of uncontrolled EVs charging on Great Britain power system was investigated. The study also considered how controlled charging can mitigate these impacts. For a 100% penetration level, it was found that the peak demand will increase by 8 GW at generation and transmission level. Moreover, the results showed that controlled charging can significantly reduce the increase in peak demand and eliminate the need for new generation infrastructure. At the distribution level 100% penetration level will require 28% upgrades at distribution network. Controlled charging can reduce the distribution network upgrade requirements to only 9%. Another interesting conclusion in this study is that load profile at distribution level and load profile at transmission level cannot be flattened at the same time using controlled charging. For instance, flattening the load at transmission level (i.e., national demand) will require 19% upgrades at the distribution level. Moreover, flattening the load at distribution level will result in 6 GW increase in national demand.
In [75,76], it was concluded that the increase in peak demand can be crucially mitigated by the use of optimized charging and time of use (ToU) charging. A study on the Estonian grid [77] with 30% penetration level of the passenger’ cars available was conducted and the results showed an increase in the peak load with 5% for uncontrolled charging and 4% increase for controlled charging. Section 5.3 gives more details on how controlled charging can flatten the load profile and how controlled charging/discharging can cut the peak demand (i.e., peak shaving).
From the previous studies, it is clear that large integration of EVs charging in uncontrolled manner may lead to a significant increase in peak demand. This increase in peak demand will result in higher operation costs because expensive generation must be operated at peak hours for short duration to supply peak load. In addition, infrastructure upgrade is required if the peak demand is higher than components capacity at generation, transmission, or distribution levels. Moreover, the use of delayed charging and controlled charging is effective in minimizing peak demand increase due to EVs demand and the accompanied negative impacts; this can enable higher EVs penetration.
4.2. Voltage Instability and Phase Unbalance
Voltage instability represents a challenging issue and can result in system disruptions [78]. The reason for that is the operation at high load demand and near the stability limit. The grid voltage stability is crucially affected by the characteristics of the load. EVs load characteristics are different from the conventional loads (i.e., residential, industrial, and commercial) characteristics and the earlier estimation of its power and energy demands are difficult. In addition, the EVs consume more power in a short time to fully charge the battery. Furthermore, single phase EVs chargers may increase phase unbalance at distribution network. Phase unbalance results in unwanted negative effects at distribution network operation and connected loads and should remain in the acceptable limits.
Numerous studies have been executed to evaluate the impacts of EVs charging on voltage instability, voltage deviation, and phase unbalance. In [79], the voltage stability was investigated in a study implemented in the Institute of Electrical and Electronics Engineers (IEEE) 43 bus distribution system. The results showed that voltage stability of distribution network is highly reduced by EVs fast charging. The impact of uncontrolled charging on voltage deviation at different daily durations was assessed in [80]. Obtained results showed a large increase in voltage deviation which was close to exceeding the acceptable limits especially if EVs were charging at peak period. The study proposed stochastic programming strategies to minimize voltage deviation. In [72], the impact of uncontrolled charging of EVs on voltage drop for three distribution networks (i.e., urban, suburban, and rural) was estimated. The study considered penetration levels up to 25%. For rural network which has long feeders, higher voltage drop was recorded due to EVs charging which fosters the need for voltage regulation devices. The impact of uncontrolled charging of EVs on voltage deviation in primary and secondary distribution systems was examined in [81]. The study considered different penetration levels (i.e., 30% and 50%), different EVs types (i.e., BEV and PHEV), and different charging levels (i.e., level 1 and level 2). Results showed no voltage limits violation at any node of primary distribution system. However, voltage limits violations were recorded in the secondary system. Moreover, it showed that BEV caused more voltage drop than PHEV due to its higher battery capacity and level 2 charging caused more voltage drop than level 1. In another work [82], the effect of large-scale integration of EVs with high power charging in IEEE 39 bus distribution system and how the distribution network reliability was improved by optimal charging of EVs was investigated. Another method for reducing the voltage instability was proposed in [83]; the method is based on voltage control by the tap-changing transformer.
In [84], the impact on voltage unbalance due to uneven EVs distribution on the three phases was investigated. The study considered two scenarios for EVs distribution on phases. For scenario A, 50% of EVs are connected to phase a, 30% to phase b, and 20% to phase c. For scenario B, 80% of EVs were connected to phase a, 20% to phase b, and 0% to phase c. For scenario A, the voltage unbalance factor (VUF) did not violate the limits until 50% penetration level. However, for scenario B, the VUF reached the limits at 25% penetration level. Another study [85] investigated the impact of single phase EVs charging (i.e., G2V) and discharging (i.e., V2G) on voltage unbalance of low voltage distribution network. The study considered many cases and results showed that in some cases VUF exceeded the limit for both charging and discharging modes. In [86] a significant phase unbalance occurs due to the EVs charging with single phase chargers at level 1 at the residential network which results from the unequal distribution of EVs chargers in the three phases. However, a small impact on voltage and current unbalance was observed due to EVs charging in [87]. It should be mentioned that by using controlled charging and discharging of EVs with considering VUF minimization, the voltage unbalance at distribution network can be minimized. More details are provided in Section 5.4.
Previous studies showed that usually low EVs penetration levels can have a small impact on voltage values even if uncontrolled charging was used. However, high EVs penetration levels can cause high voltage drop, and voltage value may exceed the acceptable limits especially at the end of long feeders (i.e., rural network), which will require the installation of voltage regulation devices. Studies showed that secondary distribution networks have a higher probability of exceeding voltage limits than primary distribution networks. Moreover, phase unbalance represents a challenging issue since most EVs are expected to be charged by single phase private chargers. Very small EVs penetration levels can cause small phase unbalance. However, high EVs penetration levels and high uneven distribution of chargers on the three phases may result in VUF higher than acceptable limits.
4.3. Harmonics Distortion
Power quality problems may arise due to EVs charging. Because power electronic devices are used in EV chargers, so high EVs integration can affect the power network’s power quality. Harmonics injected by EV chargers into the power grid will lead to negative effects on electric power system components which are designed to be supplied by pure sinusoidal waveform and increase system losses. Few studies found that EV chargers had a non-significant effect on harmonic distortion. For instance, in [88], a comprehensive harmonic study was implemented using the Monte Carlo method and the results showed a minor impact of harmonics in the distribution network. Another study [89], found that commercial EV chargers resulted in a small increase in the total harmonic distortion of voltage (THDv), and it was less than 0.8%.
In contrast, many studies concluded that EVs charging had a large impact on the distribution system. In [90], the THDv increased to 11.4% due to uncontrolled rapid charging and this value exceeded the limit of 8% based on EN 50,160 standard and a solution to the harmonic problem was proposed by using the control of PV inverter as an active filter. In [91], the impact of EVs charging with slow and fast charger on total harmonic distortion (THD) was assessed for different EVs models. A high total harmonic distortion of current (THDi) was recorded for fast charging between 12% to 24%. In [92], the impact of traditional EV charger on the quality of system voltage and drawn current was evaluated. Traditional charger caused very high THD. The authors proposed a smart charger that draws sinusoidal current and has a unity power factor. The smart charger significantly reduced THD compared with traditional charger. The negative effects of EV home chargers on distribution network power quality and transformer life were studied in [93]. The study found a quadratic relation between THDi and life consumption of the transformer. Moreover, the study concluded that THDi should not be more than 25 to 30% to have acceptable increase in life consumption of the transformer. In [94], the impact of EV chargers’ current harmonics on distribution system capacity was studied. Results showed that the 10 kV cable was overloaded at 27.25% penetration level when current harmonics due to EV chargers was considered. However, the cable was overloaded at 30.74% penetration level when current harmonics due to EV chargers was neglected. For harmonics reduction from EVs integration, filters must be added to the EV chargers.
Only a few studies found that EV chargers harmonics result in a minor impact in the distribution network. Most of the studies showed that traditional EV chargers can cause unacceptable harmonics values. These high harmonics will result in decreasing the life cycle of distribution network components (i.e., transformers and cables). However, by proper design of EV charger circuits, control strategy, and filters integrated into the charger circuit, the charger harmonics can be alleviated significantly. More details can be found in Section 5.4.
4.4. Overloading of Distribution Network Components
The high EVs energy demand requires a large amount of electric energy to be transmitted from the generation stations to the distribution networks. The distribution networks’ equipment such as transformers and cables may get overloaded due to the new EVs load and this will lead to stress these components and reduce their lifespan and foster the need for infrastructure upgrade. Several researches were executed to analyze the impacts of EVs charging on distribution system components. In [95], the distribution transformer aging due to uncontrolled charging of EVs with level 1 and 2 charging power was investigated. The results showed that level 2 charging has a higher aging impact on the transformer in comparison with level 1 charging. The impacts of EVs charging on transformer and underground cable were assessed in [96] for low and high penetration levels (i.e., 12.5% and 70%). The transformer and cable were overloaded in both penetration levels. The impact of uncontrolled charging of EVs on distribution transformers with 25 kVA and 50 kVA power rating was examined in [81]. The study considered different penetration levels (i.e., 30% and 50%), different EVs types (i.e., BEV and PHEV), and different charging levels (i.e., level 1 and level 2). Results showed that 50% penetration level resulted in overloading 50% of the 25 kVA transformers and 35% of the 50 kVA transformers. Furthermore, BEV with level 2 charging caused 10% increase in the number of overloaded transformers compared with PHEV with level 1 charging.
In [72], the impact of uncontrolled charging of EVs on the loading of secondary transformers installed in three distribution networks (i.e., urban, suburban, and rural) with different capacities was executed. The study considered penetration levels up to 25%. The study counted the number of transformers overloaded above 20%. EVs charging resulted in increasing the number of transformers overloaded above 20% for suburban area, while urban and rural areas did not have high overloading percentages. The impact of uncontrolled charging on distribution networks transformers and cables was investigated in [97]. Results showed a large increase in the number of overloaded transformers and cables. The number of overloaded transformers and cables decreased by 25% and 8%, respectively, when controlled charging was used. In [98], it was found that the presence of EVs will lead to reducing life duration of distribution transformer. In [99], it was concluded that the uncontrolled charging of EVs will lead to aging of 25 kVA distribution transformer. Moreover, it was found that transformer aging can be reduced using controlled charging strategies.
Another study [100], concluded that uncontrolled level 1 EVs charging has insignificant impact on transformer life but the massive penetration of EVs may have a severe effect on transformer lifespan. The transformer lifespan can be enhanced by using off-peak EV charging and load management [95,100,101]. In [102] the cable loading was examined for EVs peak charging hours. The results demonstrate that the cable can handle up to 25% penetration level for slow charging and up to 15% penetration level for fast charging and cannot handle massive EVs penetration easily.
The high energy demand of EVs will increase the loading at different parts of the power system (i.e., generation, transmission, and distribution). Distribution level is highly affected by EVs charging compared to transmission and generation levels, and most of the studies focused on the impacts of EVs charging on distribution network components. The studies showed that the acceptable EVs penetration level before overloading of network components varies depending on the network components’ capacity and their loading condition before connecting EVs. Studies concluded that the uncontrolled charging of EVs result in overloading of many transformers and cables at the distribution network and can result in reducing their lifespan and requires components upgrade which represents economical challenge to electric utilities. Results showed that many distribution networks can only allow 10% penetration level before overloading if level 2 charging was used. The network can handle higher penetration levels if level 1 slow charging was used. Using proper charging and discharging methods (i.e., delayed charging, controlled charging, V2G, V2B, and V2H), distribution networks can integrate higher EVs penetration levels before they reach their capacity limits. More details can be found in Section 5.3.
4.5. Increase in Power Losses
Extra power demand represented in EVs charging will lead to higher currents flowing and extra power losses in different system components, such as generators, transformers, and cables, which is the main concern for utilities. Various studies were performed to examine the EVs charging impact on system losses. In [103], the impact of uncontrolled charging of EVs on two large scale distribution system was executed under three penetration levels (i.e., 35%, 51%, and 62%). Uncontrolled charging resulted in a large increase in energy losses and required investment cost. Losses and investment costs reduced when delayed charging or controlled charging were used. The impact of uncontrolled charging on power losses at different daily durations was assessed in [80]. Obtained results showed a large increase in power losses especially if EVs were charging at peak period. The study proposed stochastic programming strategies to minimize power losses. In [104], a study examined the EV charging impact on a Danish distribution network. The obtained results showed that for uncontrolled charging with 50% penetration level the grid losses increased by 40% and increased only 10% for controlled charging.
In [105], the impact of EVs charging on distribution transformer power losses was investigated. It was found that for penetration levels ranging from 2% to 40%, the transformer losses increased to more than 300% mainly due to windings copper losses increase. The increase in power losses at the IEEE 33 bus distribution system due to EVs fast charging station was evaluated in [106]. The study investigated many cases by changing the charging station bus and the charging station power consumption. It was found that installing charging stations at weak buses (i.e., far from the main transformer) increased system power losses. Moreover, the power losses could be reduced by distributing charging station load at two buses instead of one bus. In [107], the increase in energy losses of a distribution network due to EVs charging was examined. The distribution network supplies residential and commercial loads and located on a Korean island. The results showed that daily energy losses increased by 66% for 40% penetration level.
Previous studies focused on assessing the impact of uncontrolled EVs charging on the power losses at distribution networks. The studies concluded that uncontrolled EVs charging resulted in a high increase in distribution network power losses. Using proper charging and discharging methods (i.e., delayed charging, controlled charging, V2G, V2B, and V2H), power losses due to EVs charging can be reduced significantly. Additionally, the installation of distributed generation (DG) near the charging location can decrease the energy supplied from the grid, and hence reduce the power losses.
5. Positive Impacts of Electric Vehicles on Electric Power Systems
EVs are parked for most of the daytime [108], and they are connected to the charger for a longer duration than required recharging duration. Therefore, EV battery can be used to provide grid services and gain revenues for EV owners by injecting power to the grid to keep demand–supply balance or by controlling the charging time and power to reduce the charging cost and electricity bill. Many studies showed that controlled EVs charging can improve power system efficiency, reduce operation cost, and minimize RESs curtailment. Moreover, EVs controlled discharging can provide additional benefits and electrical services [109]. EVs can provide short time scale electrical services due to the fast response of battery chargers such as primary frequency control (PFC), medium time scale electrical services, such as secondary frequency control and long time scale electrical services, such as congestion management and minimization of power losses due to the high battery capacity [110]. The focus in reviewing the literature will be in operational aspects and services provided by EVs and not in the optimization algorithms and control methods used due to the broad spectrum of approaches used in these studies [111].
5.1. Frequency Regulation
Power system frequency should be maintained at nominal value (i.e., 50 or 60 Hz) for normal operation. It is considered an important indicator of active power supply–demand balance. In normal operation, the power imbalance occurs due to continuous load variation or fluctuation of RESs generation that depend on weather conditions. In emergency conditions, the power imbalance occurs due to sudden outages of loads, transmission lines, or generating units. Failing to maintain frequency in the specified limits will result in load shedding in case of under frequency or disconnection of generating units in case of over frequency. In traditional power system, frequency regulation is achieved by synchronous generators in large power plants (e.g., hydro and thermal power plants) [112]. In future power systems, controllable loads like heat pumps and EVs will have a significant role in frequency control [113]. EV batteries have a faster response compared to traditional generation units due to the fast response of EV power electronic interface (i.e., EV charger). Therefore, controlled charging and discharging of EVs can be an effective option for frequency regulation. Moreover, frequency regulation is becoming more challenging due to the reduction of system inertia and increase of fluctuation due to the increasing share of RESs with power electronic interface [114-116].
The ability of available commercial EVs (i.e., Nissan Leaf) to provide PFC by only changing the charging power and with no V2G capability was tested experimentally in [117]. A small isolated power system with renewable generation was used as a test system. The results proved the technical feasibility of EVs to provide PFC with fast response time. In [118], the authors studied how EVs can participate in PFC in two ways. The first is to switch off EVs charging and the second way is to inject power to the grid in V2G mode. Another study [119] proposed a control method to provide PFC in three area power system by coordinating EVs charging and discharging while minimizing battery degradation cost. The effectiveness of EVs to provide primary frequency regulation was tested in [120] for a small isolated power system containing wind turbines, diesel generators, and hydro generators. The study verified that EVs were very effective in reducing frequency oscillation with a small change of EVs consumed energy and negligible variation of the required charging time. It also showed that EVs can enable more wind energy share while keeping normal operation.
In [121], the authors studied two modes of EVs charging control for frequency regulation while considering EV owner diving behavior. The first mode only controls the charging power and the second mode controls charging and discharging power. Results showed that EVs were effective in reducing frequency fluctuation. A coordinated control strategy between EV operating in V2G mode and traditional generation for load frequency control (LFC) was proposed in [122]. The proposed control strategy was tested on the Great Britain power system. The results showed the effectiveness of the proposed strategy in improving frequency regulation and reduction of power mismatch. Moreover, due to EV participation, the traditional power generation output variations were reduced. The EVs ability to participate in LFC in a microgrid operating in isolated mode was investigated in [123]. The microgrid contains both renewable and nonrenewable generation. The studies proved that EVs can enhance frequency stability in addition to reducing emissions from nonrenewable generation and increase microgrid operator profit. In [124], EVs operating at V2G mode were used to provide LFC in a multi-area power system containing traditional nonrenewable generation (i.e., thermal, hydro, and gas turbines).
Previous studies results proved the feasibility of using EVs to provide frequency regulation due to its fast response. Results showed that the use of EVs can achieve rapid control action in balancing the generated power and the power demand during load and source variations and the system frequency perturbation controlled by EVs is much lower than the other generation units. EVs can provide frequency control either by regulating charging power with no V2G capability or by regulating charging and discharging power (i.e., V2G capability). In the first approach, frequency regulation can be achieved by only change the EVs charging power. This approach is simple, requires simple infrastructure, and have a limited effect on battery degradation. In the second approach, frequency regulation is provided by controlling both charging and discharging power. This approach is more effective than the first approach. However, this approach is more complex, requires infrastructure upgrade (i.e., ICT and bidirectional chargers), and affect battery life cycle due to continuous charging and discharging. The studies showed that EVs are effective in providing frequency regulation at traditional power systems containing only nonrenewable generation. It resulted in reducing frequency fluctuation and reducing the variation of generation units output power. Furthermore, it is effective when there is a renewable generation installed in traditional power systems. It can reduce fluctuations due to intermittent renewable generation, enable the integration of more renewable generation, and reduce curtailment of renewable generation production. Moreover, EVs proved their effectiveness in providing frequency regulation in microgrids with a high share of renewable generation. It can reduce frequency fluctuation, increase microgrid profit, reduce curtailment from renewable generation, and enable integrating high share of intermittent renewable generation while operating in acceptable limits.
5.2. Voltage Regulation and Reactive Power Compensation
The voltage at any point of the power system must be maintained within acceptable limits. Voltage is an indicator of the loading status of distribution system. Voltage is high if the network is lightly loaded and low if the network is highly loaded. Although the common problem in distribution system is exceeding the lower limit, excessive DG may cause voltage rise and exceeding the voltage upper limit. Keeping the voltage within normal values at distribution level, which usually has a radial structure, is a challenge especially for long feeders and may require voltage regulation devices. Violation of these limits will result in improper operation or damage to the connected loads and may lead to voltage instability. Voltage control can be achieved by active or reactive power control. Active power can be controlled by DGs, energy storage technologies, and controllable devices like EVs and heat pumps. Likewise, reactive power can be controlled by transformers on-load tap changer (OLTC), capacitors, and static var compensators.
Many researchers studied voltage regulation by EVs active power control. An online controlled charging method was tested in [125]. The objective was to maximize EV owners satisfaction while considering distribution network limits. The algorithm minimized voltage deviation, transformer loading, and power losses. In [126], a decentralized/autonomous controlled charging method was proposed. It regulates the charging power based on the local voltage and battery SoC. It charges at a high charging power if the voltage is normal and decrease the charging power or stop charging if the voltage is low. EVs with low SoC have a charging priority. The proposed method reduced the voltage drop and improved the voltage profile compared to uncontrolled charging. In [127], an optimization algorithm was developed to provide peak shaving and valley filling in addition to improving voltage profile by controlling the charging and discharging of EVs. In [128], a controlled EVs charging technique was used to solve the voltage rise issue resulted from excessive PV generation at distribution system.
Another option for EVs based voltage regulation is by using capacitors in the DC link of the EV bidirectional chargers to supply reactive power. EV charger can do this even if the EV is not connected for charging. The ability of level 1 EV bidirectional charger to provide reactive power support was tested in [129]. The study showed that the DC link capacitor can provide reactive power support with no effect on battery degradation. In [130] a direct voltage control method was used to enable EV charger at DC fast charging station to inject reactive power to the grid to regulate bus voltage and reduce system power losses. In [131], a strategy for voltage regulation at distribution network was proposed. It is based on the coordination of DG, OLTC, and EVs providing reactive power support by operating at V2G mode. The proposed algorithm was effective in voltage regulation, minimizing OLTC operation times, and reduce the active power curtailment of DG. A limited number of studies investigated the use of EV chargers for reactive power compensation, which makes it a promising research area to be investigated in future research studies.
From studies results, it can be concluded that uncontrolled charging of EVs can result in a higher voltage drop at distribution networks and voltage values exceeding the acceptable limits, especially in long feeders, and will require infrastructure upgrade by installing voltage regulation devices. However, using controlled charging and discharging methods the voltage at all parts of the distribution network can be kept within acceptable limits and daily voltage profile can be improved without voltage regulation devices. Moreover, studies showed that the EV charger DC link capacitor is effective in providing reactive power support and voltage regulation.
5.3. Congestion Management
Load demand varies during the day and usually have peak hours in the evening. During peak hours expensive generators should be turned on for few hours for supply–demand balance. Uncontrolled charging of EVs will result in enlarging the peak power demand, which results in operating expensive power generation in addition to transmission and distribution networks stress. If the installed generation capacity is less than the required demand at peak period, new power plants must be constructed. This issue can be eliminated or alleviated by using delayed charging, controlled charging, V2G, V2B, and V2H. Using delayed charging and controlled charging can shift EV charging to off peak hours, which results in valley filling as shown in Figure 6b,c. Using V2G, V2B, and V2H technology enables injecting power to the grid, building, or home at peak hours which results in peak shaving and charge at off peak hours which results in valley filling as shown in Figure 6d. The process of peak shaving and valley filling is called load flattening or load leveling, which means reducing the difference between the maximum demand and the minimum demand during the day. By doing this congestion at the power system can be handled (i.e., congestion management).
Delayed charging was proposed in [132], and compared to uncontrolled charging. The results indicated that delayed charging is effective in reducing the stress of distribution system components, reducing voltage drop and power losses compared to uncontrolled charging. A decentralized controlled charging method for valley filling was proposed in [133]. This method needs simple unidirectional communication between the system operator and EV to broadcast day-ahead electricity prices. Based on the price, EV can autonomously control the charging behavior and charge at off peak period to reduce charging costs. This resulted in valley filling and reduction in generation cost by 28% compared to uncontrolled charging. The impact of uncontrolled EVs charging on total power demand was investigated in [134]. Results showed that uncontrolled charging will increase peak demand. Delayed charging and controlled charging were proposed for alleviating the impact of uncontrolled charging. The results showed that the proposed methods were very efficient in shifting the EVs charging from peak period and postponing any network upgrade.
Another study showed that the German transmission system cannot handle large scale uncontrolled EV charging even with future expansion plans [135]. It also showed that V2G technology is effective in reducing transmission system congestion and enhance grid stability. The effectiveness of V2G in providing peak shaving and valley filling was proved in [136]. By allowing some of the EVs to inject power back to the grid at peak period resulted in reducing the original peak demand (i.e., peak shaving). By allowing EVs to charge at off peak period only resulted in valley filling. In [137], the integration of EVs in a weak isolated grid in a Spanish island was studied. The study proposed a strategy for coordinated charging and discharging of EVs. Results proved the effectiveness of EVs in the efficient management of the grid, in addition to filling the valley and shaving the peak demand.
In [138], V2B was used in a building-integrated microgrid which contains EVs, battery storage, and PV. The objective was to reduce the peak load, which will decrease subscribed power rating and reducing the building electricity bill. The study showed that V2B can enable peak load shaving. By encouraging more buildings to have a similar management system it can reduce the peak load demand in the distribution system or even the whole grid. The effectiveness of V2H in reducing home peak demand was tested in [64]. Results showed that V2H was very effective in minimizing home peak demand and home electricity bills.
Previous studies’ results showed that uncontrolled charging of EVs will result in an increase of peak demand at different levels of the power system (i.e., generation, transmission, and distribution) and can overload many network components and will require components upgrade which represents high investment costs for system operators. A more cost-effective solution to these issues is using proper charging methods. The studies proved that simple charging method like delayed charging, which only depends on variable electricity prices during the day, can shift most of the EVs load to off-peak hours by motivating EV owners to decrease the charging costs. Delayed charging can lead to reducing the increase in peak demand, reduce the number of overloaded components, postpone infrastructure upgrades, and valley filling. A more advanced charging method is controlled charging, where EVs can change their charging time and power depending on many variables such as electricity prices, load demand, components loading, grid constraints, etc., depending on the proposed control strategy. Controlled charging can lead to reduced charging costs, reduced increase in peak demand, reduction in the number of overloaded components, delay in network components upgrade, and valley filling. Moreover, the use of V2G, V2B, and V2B can provide more benefits to the grid and EV owners. By injecting stored energy in EV batteries to the grid, the peak demand can be shaved (i.e., peak shaving) and reduce power system operation costs by shutting down generation units with high operating costs. Furthermore, they can defer the need for infrastructure upgrades, gain revenue for EV owners by charging when the electricity price is low and discharge when the electricity price is high (i.e., energy arbitrage), and reduce home or building electricity bills.
5.4. Improving Power Quality
Although single phase uncontrolled charging of EVs may cause a severe effect on system unbalance, controlled charging methods can decrease system unbalance. In [139], the reduction of voltage unbalance by controlling EVs charging current was tested experimentally. The proposed control method is autonomous and depends only on local voltage measurement without the need for infrastructure upgrade and expensive communication infrastructure. The results proved that the proposed EVs controlled charging method can reduce voltage unbalance and minimize voltage drop. In another study, a method based on PV and EVs interaction for voltage unbalance minimization was tested in [140]. In [141], an optimization algorithm was used to control the charging and discharging of EVs to minimize VUF. An unbalanced distribution network with 1.93% VUF was used to test the proposed strategy. Uncontrolled charging of EVs increased the VUF significantly to 7.7%. The controlled charging of EVs declined the VUF to 0.71%. Controlled charging and discharging of EVs dropped the VUF to 0.5%. To control the voltage unbalance, the number of EVs connected at each phase was optimized using a genetic algorithm in [142]. The authors of [143] proposed a hybrid method combining centralized controlled charging of EVs and decentralized controlled discharging of reactive power for voltage unbalance minimization. The proposed strategy was effective in reducing VUF compared to uncontrolled charging case.
It was presented in Section 4.3 that EV chargers can result in significant harmonic distortion. However, the proper design of charger power electronics circuits and control methods can minimize or eliminate this issue. Few studies proposed EV chargers that cause no harmonic distortion or can provide harmonic filtering. A novel control strategy applied to onboard bidirectional three phase EV charger was proposed in [144]. The proposed method enabled the charger to draw or inject sinusoidal current with no harmonics regardless of the power quality of the grid. Another study [144] proposed EV charger that can operate as active filter and eliminate the harmonics caused by other loads at the charger connection point in addition to providing reactive power compensation. In [145], the EV charging station was used to eliminate the harmonics in distribution network by acting as active filter.
The high penetration of PV generation at distribution network can cause power quality issues due to its intermittent nature and dependence on weather conditions. The variation of weather conditions (i.e., clouds) results in fluctuation of PV power output which can cause voltage fluctuation and light flicker. Therefore, DSOs need to develop mechanisms to mitigate power quality issues caused by the fluctuation of PV output. Several studies proposed controlled charging of EVs as a possible solution to alleviate the fluctuations caused by PV generation [146-148]. For instance, reference [148] assessed the impacts of rapid variation of PV output on voltage fluctuation at low voltage distribution network for three scenarios. The study proposed a controlled charging of EVs to mitigate voltage fluctuations. The results proved the effectiveness of the proposed strategy in reducing voltage fluctuations and accompanied light flicker.
The previous sections demonstrated that EVs can provide many benefits and services to electric power systems. A very important secondary benefit that EVs can provide is helping the integration of RESs. It is well known that to face environmental challenges and depletion of fossil fuel, large capacities of RESs are being installed worldwide. Most of RESs installations are PV and wind due to the technology advancement and fast drop in their prices. Electricity generation from RESs like PV and wind are variable and intermittent depending on environmental conditions (i.e., sun and wind) and hard to predict or forecast. This increases fluctuation and uncertainty in power system besides load fluctuation [149]. Moreover, they are non-dispatchable generation and they cannot change the generated power following demand variations like traditional power plants, which increase the need for more flexibility in the power system which cannot be provided by central power plants only. More flexibility in the power system can be achieved from distribution systems by demand response (i.e., controllable or dispatchable loads) and energy storage.
Till now there is no economical utility-scale energy storage technology. EVs can act as controllable loads by controlled charging and as energy storage by V2G, V2B, and V2H. Several studies investigated how EVs can enable integrating more RESs [150]. EVs can absorb excess RESs generation and deliver it to the grid when needed. In [151], it was concluded that EVs and heat pumps can reduce the cost of integrating RESs, such as required balancing cost and required back-up generation cost. In [152], based on the German 2030 scenario of RESs penetration, it was found that by controlling EVs charging more RESs can be integrated into the power system. In [153], two case studies were considered for Germany and California 2030 scenario with a high share of EVs and RESs. It concluded that the smart charging of EVs can mitigate RESs fluctuation.
Reference [154], investigated the impact of V2G on two power systems and with different penetration of wind generation, from 0% to 100%. It was found that V2G can enable a higher share of wind power generation in the power system. An optimization strategy was tested in [155] to schedule the charging of EVs which were connected to microgrid with PV and wind generation. The proposed strategy achieved load leveling in addition to reducing microgrid operating costs and EVs charging costs. The impact of EVs operating at controlled charging mode or V2G mode on the operation of a power system with high share of RESs was examined in [156]. Results showed that controlled EVs charging and discharging reduced deployed reserves usage, better usage of renewable generation by reducing wind spillage, and reduced operation cost. In [157], it was found that controlled charging and discharging of EVs can reduce operation costs and reduce emissions, besides maximizing RESs utilization. In [158], an optimization algorithm was used to manage EVs charging and discharging to increase the penetration of RESs. The proposed strategy was able to increase PV penetration up to 50%.
6. Discussions and Future Research Directions
The main contribution of this article is to provide a review of potential negative impacts of EVs charging on electric power systems mainly due to uncontrolled charging, and how through proper charging and discharging methods, those impacts can be reduced and become even positive impacts as discussed in Section 4 and Section 5. For each potential negative impact or positive impact of EVs, the findings and conclusions of a few research papers were discussed as examples of the research done at each point to clarify it. Figure 8 provides a summary of the negative impacts of uncontrolled EVs charging on the electric power system and how these impacts can be mitigated or even become positive impacts using suitable charging and discharging methods.
Figure 8. Uncontrolled charging negative impacts on the power system and how it can be mitigated and become positive impact using the proper charging/discharging method.
As described in previous sections, there is a lot of ongoing research on the integration of EVs to electric power system, focusing on accurate evaluation of the negative impacts of uncontrolled EV charging or the services and benefits EVs may provide if other smart charging and discharging methods are used. Other research areas that are being investigated by researchers are:
Cost–benefit analysis of different charging and discharging methods
Most of the studies that investigate the benefits that smart charging and discharging methods can provide focus on the technical feasibility and charging cost. However, there is a need to assess the cost of providing these services on EV batteries degradation, because EV battery is a very expensive component in EVs. After that, the economic feasibility of different charging and discharging methods can be accurately estimated. Reference [159] executed a cost–benefit analysis of controlled charging and V2G implementation considering EV batteries degradation cost. The results showed that controlled charging is economical. Moreover, the study concluded that V2G implementation is not economical without wind generation presence, while it is economical in the presence of wind generation. This area requires more studies to evaluate the economic feasibility of different EV smart charging and discharging methods on different case studies and different scenarios. The different scenarios can consider the economic feasibility of using EVs to provide various services (i.e., frequency regulation, voltage regulation, congestion management, etc.; or consider different power systems with different characteristics (i.e., presence of different types of RESs, different penetration levels of RESs, types of power plants, etc.).
Coordination between transmission system operator (TSO) and distribution system operator (DSO) for providing EV services
As explained in previous sections, EVs can provide many local and system-wide power and energy services. Figure 9 summarizes the services provided to different power system parties (i.e., transmission system operator (TSO), DSO, and loads such as buildings or homes) [160]. It is worth mentioning that the provision of system-wide services by EVs may result in issues at distribution system at which EVs are connected which may result in conflict of interests between TSO and DSO. For instance, the use of EVs to provide a TSO service such as frequency regulation which requires continuous change at charging and discharging power may cause negative impacts at the distribution system managed by DSO such as overloading of distribution network components, phase unbalance, etc. Therefore, there is a need for coordination between TSO and DSO to guarantee reliable and cost-efficient EVs based services [161,162]. This topic is rarely investigated in the literature and there many open questions that require study. Therefore, it requires more attention in future research.
Figure 9. EV services provided to different power system parties.
Planning of public charging Infrastructure
With the large-scale adoption of EVs in the near future, many public EV charging stations will be deployed in streets, highways, workplaces, shopping centers, etc. One of the main challenges for EVs acceptance is its limited range compared to ICEVs and driver range anxiety. Therefore, the EV chargers deployment must be planned accurately and efficiently to achieve both transportation and power system objectives and needs. Many studies investigated the planning of future EV charging infrastructure. The studies considered the optimal location and capacity of EV chargers [163]. Some studies considered the transportation network only without considering power system conditions. Other studies considered the power system only without considering transportation networks. These studies consider power system economic and operation constraints while reducing investments required for power system infrastructure upgrade. It is worth mentioning that EV charging stations couple both transportation network and power system; therefore, both must be taken into account at EV charging infrastructure planning. Few studies considered both transportation network and power system at the planning of EV chargers [164], because EV infrastructure planning studies require real data for both the transportation sector and power system, which varies between countries. There is a room for more research in this area considering different case studies.
7. Conclusions
The paper presented EVs technology and the current need for it as well as its benefits compared to traditional vehicles in addition to challenges it must tackle to achieve high adoption and social acceptance. Furthermore, it presented the current EVs market and future predictions. Different charging technologies were presented such as conductive charging, which is the current charging method and other charging methods such as wireless charging and battery swapping which may have future potential. A review of the negative impacts that EV may cause on electric power systems if uncontrolled EV charging is used was presented. Conclusions of many studies that assessed these impacts were discussed. All the studies showed that uncontrolled EV charging will result in unwanted negative impacts on the power system especially the distribution networks and it will foster the need for infrastructure upgrade. The severity of these impacts varies between different studies due to many uncertainties in EV charging impacts studies (e.g., distribution system status, EV battery capacity, EV battery SoC, time and location of charging, EV charger power rating, and EV penetration level).
The paper also showed that these impacts can be mitigated using delayed charging and controlled charging methods, which can benefit both the power system and EV owner. More benefits and electrical services can be obtained from EVs with advanced charging control methods like V2G, V2B, and V2H. Different electrical services that can be provided with controlled charging/discharging of EVs were presented and discussed. This review article briefly discussed the main research areas that are being investigated for the integration of EVs to sustainable future power system, which can be helpful for engineers and researchers. It further discussed a few interesting research topics that need more study in future research.
Author Contributions: M.N. wrote the manuscript first draft. J.P.C.-Á., G.M., and Á.S.-M. reviewed, edited, and suggested modifications to the manuscript. All authors have read and agreed to the published version of the manuscript. Funding: This research received no external funding. Conflicts of Interest: The authors declare no conflict of interest.
Abbreviations
List of abbreviations used in this paper.
AC
Alternating Current
BEV
Battery Electric Vehicles
BSS
Battery Swapping Stations
CO2
Carbon Dioxide
DC
Direct Current
DG
Distributed Generation
DSO
Distribution System Operator
EM
Electric Motor
EV
Electric Vehicle
EVSE
Electric Vehicle Supply Equipment
FCEV
Fuel Cell Electric Vehicle
G2V
Grid to Vehicle
GHGs
Greenhouse gases
h
Hour
HEV
Hybrid Electric Vehicles
ICE
Internal Combustion Engine
ICEV
Internal Combustion Engine Vehicle
IEA
International Energy Agency
IEEE
Institute of Electrical and Electronics Engineers
IWC
Inductive Wireless Charging
km
Kilometer
kVA
Kilo volt ampere
kW
Kilowatt
kWh
Kilowatt hour
LFC
Load Frequency Control
Li-ion
Lithium-ion
OLTC
On-Load Tap Changer
PFC
Primary Frequency Control
PHEV
Plug-in Hybrid Electric Vehicles
PLDV
passenger light-duty vehicles
PV
Photovoltaic
RES
Renewable Energy Source
SoC
State of Charge
THD
Total Harmonic Distortion
THDi
Total Harmonic Distortion of current
THDv
Total Harmonic Distortion of Voltage
ToU
Time of Use
TSO
Transmission System Operator
V2B
Vehicle to Building
V2G
Vehicle to Grid
V2H
Vehicle to Home
VUF
Voltage Unbalance Factor
WC
Wireless Charging
References
UNFCCC; Conference of the Parties (COP). Adoption of the Paris Agreement Proposal by the President. In Proceedings of the Paris Climate Change Conference, Paris, France, 30 November–12 December 2015. [Google Scholar]
Labatt, S.; White, R.R. Carbon Finance: The Financial Implications of Climate Change; John Wiley & Sons: Hoboken, NJ, USA, 2007. [Google Scholar]
OECD. World Energy Statistics 2017; OECD: Paris, France, 2017. [Google Scholar]
Shaukat, N.; Khan, B.; Ali, S.; Mehmood, C.; Khan, J.; Farid, U.; Majid, M.; Anwar, S.M.; Jawad, M.; Ullah, Z. A survey on electric vehicle transportation within smart grid system. Renew. Sustain. Energy Rev.2018, 81, 1329–1349. [Google Scholar] [CrossRef]
Hedegaard, K.; Ravn, H.; Juul, N.; Meibom, P. Effects of electric vehicles on power systems in Northern Europe. Energy2012, 48, 356–368. [Google Scholar] [CrossRef]
Nanaki, E.A.; Koroneos, C.J. Comparative economic and environmental analysis of conventional, hybrid and electric vehicles—The case study of Greece. J. Clean. Prod.2013, 53, 261–266. [Google Scholar] [CrossRef]
Agency, I.E. Global EV Outlook 2019 to electric mobility. IEA Publ.2019. [Google Scholar]
Knez, M.; Zevnik, G.K.; Obrecht, M. A review of available chargers for electric vehicles: United States of America, European Union, and Asia. Renew. Sustain. Energy Rev.2019, 109, 284–293. [Google Scholar] [CrossRef]
Dubey, A.; Santoso, S. Electric Vehicle Charging on Residential Distribution Systems: Impacts and Mitigations. IEEE Access2015, 3, 1871–1893. [Google Scholar] [CrossRef]
García-Villalobos, J.; Zamora, I.; Martin, J.S.; Asensio, F.J.; Aperribay, V. Plug-in electric vehicles in electric distribution networks: A review of smart charging approaches. Renew. Sustain. Energy Rev.2014, 38, 717–731. [Google Scholar] [CrossRef]
Haus, B.; Mercorelli, P. Polynomial Augmented Extended Kalman Filter to Estimate the State of Charge of Lithium-Ion Batteries. IEEE Trans. Veh. Technol.2020, 69, 1452–1463. [Google Scholar] [CrossRef]
Nour, M.; Said, S.M.; Ali, A.; Farkas, C. Smart Charging of Electric Vehicles According to Electricity Price. In Proceedings of the 2019 International Conference on Innovative Trends in Computer Engineering ITCE, Aswan, Egypt, 2–4 February 2019; pp. 432–437. [Google Scholar] [CrossRef]
Nafisi, H. Investigation on distribution transformer loss-of-life due to plug-in hybrid electric vehicles charging. Int. J. Ambient. Energy2019, 1–7. [Google Scholar] [CrossRef]
Nour, M.; Ramadan, H.; Ali, A.; Farkas, C. Impacts of plug-in electric vehicles charging on low voltage distribution network. In Proceedings of the 2018 International Conference on Innovative Trends in Computer Engineering (ITCE), Aswan, Egypt, 19–21 February 2018; pp. 357–362. [Google Scholar]
Tong, X.; Ma, Q.; Tang, K.; Liu, H.; Li, C. Influence of electric vehicle access mode on the static voltage stability margin and accommodated capacity of the distribution network. J. Eng.2019, 2019, 2658–2662. [Google Scholar] [CrossRef]
Nour, M.; Ali, A.; Farkas, C. Mitigation of Electric Vehicles Charging Impacts on Distribution Network with Photovoltaic Generation. In Proceedings of the 2019 International Conference on Innovative Trends in Computer Engineering (ITCE), Aswan, Egypt, 19–21 February 2018; pp. 384–388. [Google Scholar]
Ul-Haq, A.; Azhar, M.; Mahmoud, Y.; Perwaiz, A.; Al-Ammar, E.A. Probabilistic Modeling of Electric Vehicle Charging Pattern Associated with Residential Load for Voltage Unbalance Assessment. Energies2017, 10, 1351. [Google Scholar] [CrossRef]
Leou, R.-C.; Teng, J.-H.; Lu, H.-J.; Lan, B.-R.; Chen, H.-T.; Hsieh, T.-Y.; Su, C.-L. Stochastic analysis of electric transportation charging impacts on power quality of distribution systems. IET Gener. Transm. Distrib.2018, 12, 2725–2734. [Google Scholar] [CrossRef]
Yong, J.Y.; Ramachandaramurthy, V.K.; Tan, K.M.; Mithulananthan, N. A review on the state-of-the-art technologies of electric vehicle, its impacts and prospects. Renew. Sustain. Energy Rev.2015, 49, 365–385. [Google Scholar] [CrossRef]
Hota, A.R.; Juvvanapudi, M.; Bajpai, P. Issues and solution approaches in PHEV integration to the smart grid. Renew. Sustain. Energy Rev.2014, 30, 217–229. [Google Scholar] [CrossRef]
Richardson, D.B. Electric vehicles and the electric grid: A review of modeling approaches, Impacts, and renewable energy integration. Renew. Sustain. Energy Rev.2013, 19, 247–254. [Google Scholar] [CrossRef]
Talebizadeh, E.; Rashidinejad, M.; Abdollahi, A. Evaluation of plug-in electric vehicles impact on cost-based unit commitment. J. Power Sources2014, 248, 545–552. [Google Scholar] [CrossRef]
Lyon, T.P.; Michelin, M.; Jongejan, A.; Leahy, T. Is “smart charging” policy for electric vehicles worthwhile? Energy Policy2012, 41, 259–268. [Google Scholar] [CrossRef]
Weis, A.; Jaramillo, P.; Michalek, J.J. Estimating the potential of controlled plug-in hybrid electric vehicle charging to reduce operational and capacity expansion costs for electric power systems with high wind penetration. Appl. Energy2014, 115, 190–204. [Google Scholar] [CrossRef]
Windecker, A.; Ruder, A. Fuel economy, cost, and greenhouse gas results for alternative fuel vehicles in 2011. Transp. Res. Part. D Transp. Environ.2013, 23, 34–40. [Google Scholar] [CrossRef]
Karabasoglu, O.; Michalek, J.J. Influence of driving patterns on life cycle cost and emissions of hybrid and plug-in electric vehicle powertrains. Energy Policy2013, 60, 445–461. [Google Scholar] [CrossRef]
Lunz, B.; Yan, Z.; Gerschler, J.B.; Sauer, D.U. Influence of plug-in hybrid electric vehicle charging strategies on charging and battery degradation costs. Energy Policy2012, 46, 511–519. [Google Scholar] [CrossRef]
Gass, V.; Schmidt, J.; Schmid, E. Analysis of alternative policy instruments to promote electric vehicles in Austria. Renew. Energy2014, 61, 96–101. [Google Scholar] [CrossRef]
Tie, S.F.; Tan, C.W. A review of energy sources and energy management system in electric vehicles. Renew. Sustain. Energy Rev.2013, 20, 82–102. [Google Scholar] [CrossRef]
Un-Noor, F.; Padmanaban, S.; Mihet-Popa, L.; Mollah, M.N.; Hossain, E. A Comprehensive Study of Key Electric Vehicle (EV) Components, Technologies, Challenges, Impacts, and Future Direction of Development. Energies2017, 10, 1217. [Google Scholar] [CrossRef]
Andwari, A.M.; Pesiridis, A.; Rajoo, S.; Martinez-Botas, R.; Esfahanian, V. A review of Battery Electric Vehicle technology and readiness levels. Renew. Sustain. Energy Rev.2017, 78, 414–430. [Google Scholar] [CrossRef]
Singh, B.; Chandra, A.; Al-Haddad, K.; Pandey, A.; Kothari, D.P. A review of single-phase improved power quality ac~dc converters. IEEE Trans. Ind. Electron.2003, 50, 962–981. [Google Scholar] [CrossRef]
Singh, B.; Singh, B.; Chandra, A.; Al-Haddad, K.; Pandey, A.; Kothari, D. A Review of Three-Phase Improved Power Quality AC–DC Converters. IEEE Trans. Ind. Electron.2004, 51, 641–660. [Google Scholar] [CrossRef]
Yılmaz, M.; Krein, P.T.; Yilmaz, M. Review of charging power levels and infrastructure for plug-in electric and hybrid vehicles. In Proceedings of the 2012 IEEE International Electric Vehicle Conference (IEVC), Greenville, SC, USA, 4–8 March 2012; pp. 1–8. [Google Scholar] [CrossRef]
Young, K.; Wang, C.; Wang, L.Y.; Strunz, K. Electric Vehicle Integration into Modern Power Networks; Springer: Berlin/Heidelberg, Germany, 2013. [Google Scholar]
Botsford, C.; Szczepanek, A. Fast Charging vs. Slow Charging: Pros and cons for the New Age of Electric Vehicles. Int. Battery Hybrid Fuel Cell Electr. Veh. Symp.2009. [Google Scholar]
Yang, Y.; El Baghdadi, M.; Lan, Y.; Benomar, Y.; Van Mierlo, J.; Hegazy, O. Design Methodology, Modeling, and Comparative Study of Wireless Power Transfer Systems for Electric Vehicles. Energies2018, 11, 1716. [Google Scholar] [CrossRef]
Cao, Y.; Ahmad, N.; Kaiwartya, O.; Puturs, G.; Khalid, M. Intelligent Transportation Systems Enabled ICT Framework for Electric Vehicle Charging in Smart City. In Handbook of Smart Cities; Springer Science and Business Media LLC: Berlin, Germany, 2018; pp. 311–330. [Google Scholar]
Wang, Z.; Wei, X.; Dai, H. Design and Control of a 3 kW Wireless Power Transfer System for Electric Vehicles. Energies2015, 9, 10. [Google Scholar] [CrossRef]
Musavi, F.; Eberle, W. Overview of wireless power transfer technologies for electric vehicle battery charging. IET Power Electron.2014, 7, 60–66. [Google Scholar] [CrossRef]
Li, S.; Mi, C.C. Wireless power transfer for electric vehicle applications. IEEE J. Emerg. Sel. Top. Power Electron.2015, 3, 4–17. [Google Scholar]
Ahmad, A.; Khan, Z.A.; Alam, M.S.; Khateeb, S. A Review of the Electric Vehicle Charging Techniques, Standards, Progression and Evolution of EV Technologies in Germany. Smart Sci.2017, 6, 36–53. [Google Scholar] [CrossRef]
Sarker, M.; Pandžić, H.; Ortega-Vazquez, M. Optimal operation and services scheduling for an electric vehicle battery swapping station. In Proceedings of the 2015 IEEE Power & Energy Society General Meeting, Denver, CO, USA, 26–30 July 2015. [Google Scholar]
Zheng, Y.; Dong, Z.; Xu, Y.; Meng, K.; Zhao, J.H.; Qiu, J. Electric Vehicle Battery Charging/Swap Stations in Distribution Systems: Comparison Study and Optimal Planning. IEEE Trans. Power Syst.2013, 29, 221–229. [Google Scholar] [CrossRef]
Sarker, M.R.; Pandžić, H.; Ortega-Vazquez, M. Electric vehicle battery swapping station: Business case and optimization model. In Proceedings of the 2013 International Conference on Connected Vehicles and Expo (ICCVE), Las Vegas, NV, USA, 2–6 December 2013; pp. 289–294. [Google Scholar] [CrossRef]
Rao, R.; Zhang, X.; Xie, J.; Ju, L. Optimizing electric vehicle users’ charging behavior in battery swapping mode. Appl. Energy2015, 155, 547–559. [Google Scholar] [CrossRef]
Yang, S.; Yao, J.; Kang, T.; Zhu, X. Dynamic operation model of the battery swapping station for EV (electric vehicle) in electricity market. Energy2014, 65, 544–549. [Google Scholar] [CrossRef]
Shareef, H.; Islam, M.; Mohamed, A. A review of the stage-of-the-art charging technologies, placement methodologies, and impacts of electric vehicles. Renew. Sustain. Energy Rev.2016, 64, 403–420. [Google Scholar] [CrossRef]
Alshahrani, S.; Khalid, M.; AlMuhaini, M.M. Electric Vehicles Beyond Energy Storage and Modern Power Networks: Challenges and Applications. IEEE Access2019, 7, 99031–99064. [Google Scholar] [CrossRef]
Papathanassiou, S.; Nikos, H.; Kai, S. A benchmark low voltage microgrid network. In Proceedings of the CIGRE Symposium: Power Systems with Dispersed Generation, Athens, Greece, 13–16 April 2005; pp. 1–8. [Google Scholar]
Shao, S.; Zhang, T.; Pipattanasomporn, M.; Rahman, S. Impact of TOU rates on distribution load shapes in a smart grid with PHEV penetration. IEEE PES T&D 20102010, 1–6. [Google Scholar] [CrossRef]
Gao, Y.; Wang, C.; Wang, Z.; Liang, H. Research on time-of-use price applying to electric vehicles charging. In Proceedings of the IEEE PES Innovative Smart Grid Technologies, Berlin, Germany, 14–17 October 2012; pp. 1–6. [Google Scholar]
Tan, K.M.; Ramachandaramurthy, V.K.; Yong, J.Y. Integration of electric vehicles in smart grid: A review on vehicle to grid technologies and optimization techniques. Renew. Sustain. Energy Rev.2016, 53, 720–732. [Google Scholar] [CrossRef]
Rahman, I.; Vasant, P.M.; Singh, M.S.B.; Abdullah-Al-Wadud, M.; Adnan, N. Review of recent trends in optimization techniques for plug-in hybrid, and electric vehicle charging infrastructures. Renew. Sustain. Energy Rev.2016, 58, 1039–1047. [Google Scholar] [CrossRef]
Faddel, S.; Al-Awami, A.T.; Mohammed, O.A. Charge Control and Operation of Electric Vehicles in Power Grids: A Review. Energies2018, 11, 701. [Google Scholar] [CrossRef]
Faddel, S.; Mohamed, A.A.S.; Mohammed, O.A. Fuzzy logic-based autonomous controller for electric vehicles charging under different conditions in residential distribution systems. Electr. Power Syst. Res.2017, 148, 48–58. [Google Scholar] [CrossRef]
Al-Awami, A.T.; Sortomme, E.; Akhtar, G.M.A.; Faddel, S. A Voltage-Based Controller for an Electric-Vehicle Charger. IEEE Trans. Veh. Technol.2015, 65, 4185–4196. [Google Scholar] [CrossRef]
Saldaña, G.; Martin, J.S.; Zamora, I.; Asensio, F.J.; Oñederra, O. Electric Vehicle into the Grid: Charging Methodologies Aimed at Providing Ancillary Services Considering Battery Degradation. Energies2019, 12, 2443. [Google Scholar] [CrossRef]
Habib, S.; Kamran, M.; Rashid, U. Impact analysis of vehicle-to-grid technology and charging strategies of electric vehicles on distribution networks—A review. J. Power Sources2015, 277, 205–214. [Google Scholar] [CrossRef]
Thompson, A. Economic implications of lithium ion battery degradation for Vehicle-to-Grid (V2X) services. J. Power Sources2018, 396, 691–709. [Google Scholar] [CrossRef]
Pang, C.; Dutta, P.; Kezunovic, M. BEVs/PHEVs as Dispersed Energy Storage for V2B Uses in the Smart Grid. IEEE Trans. Smart Grid2011, 3, 473–482. [Google Scholar] [CrossRef]
Shin, H.; Baldick, R. Plug-In Electric Vehicle to Home (V2H) Operation Under a Grid Outage. IEEE Trans. Smart Grid2017, 8, 2032–2041. [Google Scholar] [CrossRef]
Alahyari, A.; Fotuhi-Firuzabad, M.; Rastegar, M. Incorporating Customer Reliability Cost in PEV Charge Scheduling Schemes Considering Vehicle to Home Capability. IEEE Trans. Veh. Technol.2014, 64, 1. [Google Scholar] [CrossRef]
Habib, S.; Khan, M.M.; Abbas, F.; Sang, L.; Shahid, M.U.; Tang, H. A Comprehensive Study of Implemented International Standards, Technical Challenges, Impacts and Prospects for Electric Vehicles. IEEE Access2018, 6, 13866–13890. [Google Scholar] [CrossRef]
Bohn, S.; Feustel, R.; Agsten, M. MC-based Risk Analysis on the Capacity of Distribution Grids to Charge PEVs on 3-ph 0.4-kV Distribution Grids Considering Time and Location Uncertainties. SAE Int. J. Passeng. Cars Electron. Electr. Syst.2015, 8, 394–400. [Google Scholar] [CrossRef]
Ahmadian, A.; Mohammadi-Ivatloo, B.; Elkamel, A. A Review on Plug-in Electric Vehicles: Introduction, Current Status, and Load Modeling Techniques. J. Mod. Power Syst. Clean Energy2020, 8, 412–425. [Google Scholar] [CrossRef]
Wang, Z.; Paranjape, R. An Evaluation of Electric Vehicle Penetration under Demand Response in a Multi-Agent Based Simulation. In Proceedings of the 2014 IEEE Electrical Power and Energy Conference, Calgary, AB, Canada, 12–14 November 2014; pp. 220–225. [Google Scholar]
Putrus, G.A.; Suwanapingkarl, P.; Johnston, D.; Bentley, E.C.; Narayana, M. Impact of electric vehicles on power distribution networks. In Proceedings of the 2009 IEEE Vehicle Power and Propulsion Conference, Dearborn, MI, USA, 7–10 September 2009; pp. 827–831. [Google Scholar]
McCarthy, D.; Wolfs, P. The HV system impacts of large scale electric vehicle deployments in a metropolitan area. In Proceedings of the AUPEC 2010—20th Australasian Universities Power Engineering Conference 2010, Christchurch, New Zealand, 5 December 2010. [Google Scholar]
Schneider, K.P.; Gerkensmeyer, C.; Kintner-Meyer, M.; Fletcher, R. Impact assessment of plug-in hybrid vehicles on pacific northwest distribution systems. In Proceedings of the 2008 IEEE Power and Energy Society General Meeting—Conversion and Delivery of Electrical Energy in the 21st Century, Pittsburgh, PA, USA, 20–24 July 2008; pp. 1–6. [Google Scholar] [CrossRef]
Kelly, L.; Rowe, A.; Wild, P. Analyzing the impacts of plug-in electric vehicles on distribution networks in British Columbia. In Proceedings of the 2011 IEEE Electrical Power and Energy Conference, Montreal, QC, Canada, 22–23 October 2009; Institute of Electrical and Electronics Engineers (IEEE); pp. 1–6. [Google Scholar]
Shao, S.; Pipattanasomporn, M.; Rahman, S. Grid Integration of Electric Vehicles and Demand Response with Customer Choice. IEEE Trans. Smart Grid2012, 3, 543–550. [Google Scholar] [CrossRef]
Crozier, C.; Morstyn, T.; McCulloch, M. The opportunity for smart charging to mitigate the impact of electric vehicles on transmission and distribution systems. Appl. Energy2020, 268, 114973. [Google Scholar] [CrossRef]
Kristoffersen, T.K.; Capion, K.; Meibom, P. Optimal charging of electric drive vehicles in a market environment. Appl. Energy2011, 88, 1940–1948. [Google Scholar] [CrossRef]
Denholm, P.; Short, W. Evaluation of Utility System Impacts and Benefits of Optimally Dispatched Plug-In Hybrid Electric Vehicles; NREL: Golden, CO, USA, 2006.
Drovtar, I.; Rosin, A.; Landsberg, M.; Kilter, J. Large scale electric vehicle integration and its impact on the Estonian power system. In Proceedings of the 2013 IEEE Grenoble Conference, Grenoble, France, 16–20 June 2013; Institute of Electrical and Electronics Engineers (IEEE); pp. 1–6. [Google Scholar]
Van Cutsem, T. Voltage instability: Phenomena, countermeasures, and analysis methods. Proc. IEEE2000, 88, 208–227. [Google Scholar] [CrossRef]
Dharmakeerthi, C.; Mithulananthan, N.; Saha, T.K. Impact of electric vehicle fast charging on power system voltage stability. Int. J. Electr. Power Energy Syst.2014, 57, 241–249. [Google Scholar] [CrossRef]
Clement-Nyns, K.; Haesen, E.; Driesen, J. The Impact of Charging Plug-In Hybrid Electric Vehicles on a Residential Distribution Grid. IEEE Trans. Power Syst.2009, 25, 371–380. [Google Scholar] [CrossRef]
Gray, M.K.; Morsi, W.G. Power Quality Assessment in Distribution Systems Embedded With Plug-In Hybrid and Battery Electric Vehicles. IEEE Trans. Power Syst.2014, 30, 663–671. [Google Scholar] [CrossRef]
Xiong, J.; Zhang, K.; Liu, X.; Su, W. Investigating the impact of plug-in electric vehicle charging on power distribution systems with the integrated modeling and simulation of transportation network. In Proceedings of the ITEC Asia-Pacific 2014—IEEE Transportation Electrification Conference & Expo 2014, Beijing, China, 31 August–3 September 2014; pp. 1–5. [Google Scholar] [CrossRef]
Soroudi, A.; Keane, A. Plug in Electric Vehicles in Smart Grids; Springer: Berlin/Heidelberg, Germany, 2015; p. 89. [Google Scholar]
Ul-Haq, A.; Cecati, C.; Strunz, K.; Abbasi, E. Impact of Electric Vehicle Charging on Voltage Unbalance in an Urban Distribution Network. Intell. Ind. Syst.2015, 1, 51–60. [Google Scholar] [CrossRef]
Shahnia, F.; Ghosh, A.; Ledwich, G.; Zare, F. Predicting Voltage Unbalance Impacts of Plug-in Electric Vehicles Penetration in Residential Low-voltage Distribution Networks. Electr. Power Compon. Syst.2013, 41, 1594–1616. [Google Scholar] [CrossRef]
Richardson, P.; Flynn, D.; Keane, A. Impact assessment of varying penetrations of electric vehicles on low voltage distribution systems. In Proceedings of the 2008 IEEE Power and Energy Society General Meeting—Conversion and Delivery of Electrical Energy in the 21st Century, Providence, RI, USA, 25–29 July 2010; pp. 1–6. [Google Scholar] [CrossRef]
Liu, R.; Dow, L.; Liu, E. A survey of PEV impacts on electric utilities. In Proceedings of the Innovative Smart Grid Technologies (ISGT), 2011 IEEE PES, Perth, Australia, 13–16 November 2011. [Google Scholar]
Jiang, C.; Torquato, R.; Salles, D.; Xu, W. Method to assess the power quality impact of plug-in electric vehicles. In Proceedings of the 2014 16th International Conference on Harmonics and Quality of Power, Bucharest, Romania, 25–28 May 2014; pp. 177–180. [Google Scholar] [CrossRef]
Bass, R.; Harley, R.; Lambert, F.; Rajasekaran, V.; Pierce, J. Residential harmonic loads and EV charging. In Proceedings of the 2001 IEEE Power Engineering Society Winter Meeting Conference Proceedings (Cat No 01CH37194), Columbus, OH, USA, 28 January–1 February 2001; pp. 803–808. [Google Scholar] [CrossRef]
Nguyen, V.-L.; Tran-Quoc, T.; Bacha, S. Harmonic distortion mitigation for electric vehicle fast charging systems. In Proceedings of the 2013 IEEE Grenoble Conference, Grenoble, France, 16–20 June 2013; pp. 1–6. [Google Scholar]
Melo, N.; Mira, F.; De Almeida, A.; Delgado, J. Integration of PEV in Portuguese distribution grid: Analysis of harmonic current emissions in charging points. In Proceedings of the 11th International Conference on Electrical Power Quality and Utilisation, Lisbon, Portugal, 17–19 October 2011; pp. 1–6. [Google Scholar] [CrossRef]
Monteiro, V.; Gonçalves, H.; Afonso, J.L. Impact of Electric Vehicles on power quality in a Smart Grid context. In Proceedings of the 11th International Conference on Electrical Power Quality and Utilisation, Lisbon, Portugal, 17–19 October 2011; pp. 1–6. [Google Scholar] [CrossRef]
Gomez, J.; Morcos, M. Impact of EV battery chargers on the power quality of distribution systems. IEEE Trans. Power Deliv.2003, 18, 975–981. [Google Scholar] [CrossRef]
Zhou, C.; Wang, H.; Zhou, W.; Qian, K.; Meng, S. Determination of maximum level of EV penetration with consideration of EV charging load and harmonic currents. IOP Conf. Ser. Earth Environ. Sci.2019, 342, 012010. [Google Scholar] [CrossRef]
Hilshey, A.D.; Rezaei, P.; Hines, P.D.H.; Frolik, J. Electric vehicle charging: Transformer impacts and smart, decentralized solutions. In Proceedings of the 2012 IEEE Power Energy Society General Meeting, San Diego, CA, USA, 22–26 July 2012; pp. 1–8. [Google Scholar] [CrossRef]
Papadopoulos, P.; Skarvelis-Kazakos, S.; Grau, I.; Awad, B.; Cipcigan, L.M.; Jenkins, N. Impact of residential charging of electric vehicles on distribution networks, a probabilistic approach. In Proceedings of the 45th International Universities Power Engineering Conference, Cardiff, UK, 31 August–3 September 2010; pp. 1–5. [Google Scholar]
Verzijlbergh, R.A.; Lukszo, Z.; Slootweg, J.G.; Ilic, M.D. The impact of controlled electric vehicle charging on residential low voltage networks. In Proceedings of the 2011 International Conference on Networking, Sensing and Control, Delft, The Netherlands, 11–13 April 2011; pp. 14–19. [Google Scholar] [CrossRef]
Turker, H.; Chatroux, D.; Hably, A.; Bacha, S. Low-Voltage Transformer Loss-of-Life Assessments for a High Penetration of Plug-In Hybrid Electric Vehicles (PHEVs). IEEE Trans. Power Deliv.2012, 27, 1323–1331. [Google Scholar] [CrossRef]
Hilshey, A.; Hines, P.; Rezai, P.; Dowds, J. Estimating the impact of electric vehicle smart charging on distribution transformer aging. In Proceedings of the 2013 IEEE Power Energy Society General Meeting, Vancouver, BC, Canada, 21–25 July 2013; p. 1. [Google Scholar] [CrossRef]
Razeghi, G.; Zhang, L.; Brown, T.; Samuelsen, S. Impacts of plug-in hybrid electric vehicles on a residential transformer using stochastic and empirical analysis. J. Power Sources2014, 252, 277–285. [Google Scholar] [CrossRef]
Yan, Q.; Kezunovic, M. Impact analysis of Electric Vehicle charging on distribution system. In Proceedings of the 2012 North American Power Symposium (NAPS), Champaign, IL, USA, 9-11 September 2012; pp. 1–6. [Google Scholar]
Akhavan-Rezai, E.; Shaaban, M.F.; El-Saadany, E.F.; Zidan, A. Uncoordinated charging impacts of electric vehicles on electric distribution grids: Normal and fast charging comparison. In Proceedings of the 2012 IEEE Power and Energy Society General Meeting, San Diego, CA, USA, 22–26 July 2012; pp. 1–7. [Google Scholar]
Fernandez, L.P.; GomezSanRoman, T.; Cossent, R.; Domingo, C.M.; Frias, P. Assessment of the Impact of Plug-in Electric Vehicles on Distribution Networks. IEEE Trans. Power Syst.2010, 26, 206–213. [Google Scholar] [CrossRef]
Pillai, J.R.; Bak-Jensen, B. Impacts of electric vehicle loads on power distribution systems. In Proceedings of the 2010 IEEE Vehicle Power and Propulsion Conference, Lille, France, 1–3 September 2010; pp. 1–6. [Google Scholar]
Masoum, M.A.; Moses, P.S.; Smedley, K.M. Distribution transformer losses and performance in smart grids with residential Plug-In Electric Vehicles. In Proceedings of the ISGT 2011, Anaheim, CA, USA, 17–19 January 2011. [Google Scholar]
Deb, S.; Tammi, K.; Kalita, K.; Mahanta, P. Impact of Electric Vehicle Charging Station Load on Distribution Network. Energies2018, 11, 178. [Google Scholar] [CrossRef]
Chang, M.; Bae, S.; Yoon, G.-G.; Park, S.-H.; Choy, Y. Impact of Electric Vehicle Charging Demand on a Jeju Island Radial Distribution Network. In Proceedings of the 2019 IEEE Power & Energy Society Innovative Smart Grid Technologies Conference (ISGT), Bucharest, Romania, 29 September–2 October 2019; pp. 1–5. [Google Scholar]
Tomić, J.; Kempton, W. Using fleets of electric-drive vehicles for grid support. J. Power Sources2007, 168, 459–468. [Google Scholar] [CrossRef]
Pavić, I.; Capuder, T.; Kuzle, I. Value of flexible electric vehicles in providing spinning reserve services. Appl. Energy2015, 157, 60–74. [Google Scholar] [CrossRef]
Izadkhast, S.D. Aggregation of Plug-in Electric Vehicles in Power Systems for Primary Frequency Control. Delft Univ. Technol. Comillas Pontif. Univ. KTH R. Inst.2017, 240. [Google Scholar] [CrossRef]
Yang, Z.; Li, K.; Foley, A.; Guo, Y. Computational scheduling methods for integrating plug-in electric vehicles with power systems: A review. Renew. Sustain. Energy Rev.2015, 51, 396–416. [Google Scholar] [CrossRef]
Prabha, K. Power System Stability and Control; McGraw-Hill Education: New York, NY, USA, 1994; p. 1176. [Google Scholar]
Babahajiani, P.; Shafiee, Q.; Bevrani, H. Intelligent Demand Response Contribution in Frequency Control of Multi-Area Power Systems. IEEE Trans. Smart Grid2016, 9, 1282–1291. [Google Scholar] [CrossRef]
Ulbig, A.; Borsche, T.; Andersson, G. Impact of Low Rotational Inertia on Power System Stability and Operation; Elsevier: Amsterdam, The Netherlands, 2014; Volume 47, pp. 7290–7297. [Google Scholar]
Rodrigues, E.M.G.; Osório, G.; Godina, R.; Bizuayehu, A.; Lujano-Rojas, J.; Catalão, J. Grid code reinforcements for deeper renewable generation in insular energy systems. Renew. Sustain. Energy Rev.2016, 53, 163–177. [Google Scholar] [CrossRef]
Cabrera-Tobar, A.; Bullich-Massagué, E.; Aragues-Penalba, M.; Gomis-Bellmunt, O. Review of advanced grid requirements for the integration of large scale photovoltaic power plants in the transmission system. Renew. Sustain. Energy Rev.2016, 62, 971–987. [Google Scholar] [CrossRef]
Marinelli, M.; Martinenas, S.; Knezović, K.; Andersen, P.B. Validating a centralized approach to primary frequency control with series-produced electric vehicles. J. Energy Storage2016, 7, 63–73. [Google Scholar] [CrossRef]
Mu, Y.; Wu, J.; Ekanayake, J.; Jenkins, N.; Jia, H. Primary Frequency Response From Electric Vehicles in the Great Britain Power System. IEEE Trans. Smart Grid2012, 4, 1142–1150. [Google Scholar] [CrossRef]
Wang, L.; Chen, B. Dual-level consensus-based frequency regulation using vehicle-to-grid service. Electr. Power Syst. Res.2019, 167, 261–276. [Google Scholar] [CrossRef]
Almeida, P.R.; Soares, F.J.; Lopes, J.P. Electric vehicles contribution for frequency control with inertial emulation. Electr. Power Syst. Res.2015, 127, 141–150. [Google Scholar] [CrossRef]
Meng, J.; Mu, Y.; Jia, H.; Wu, J.; Yu, X.; Qu, B. Dynamic frequency response from electric vehicles considering travelling behavior in the Great Britain power system. Appl. Energy2016, 162, 966–979. [Google Scholar] [CrossRef]
Jia, H.; Li, X.; Mu, Y.; Xu, C.; Jiang, Y.; Yu, X.; Wu, J.; Dong, C. Coordinated control for EV aggregators and power plants in frequency regulation considering time-varying delays. Appl. Energy2018, 210, 1363–1376. [Google Scholar] [CrossRef]
Vahedipour-Dahraie, M.; Rashidizadeh-Kermani, H.; Ghamsari-Yazdel, M.; Khaloie, H.; Guerrero, J.M. Coordination of EVs Participation for Load Frequency Control in Isolated Microgrids. Appl. Sci.2017, 7, 539. [Google Scholar] [CrossRef]
Debbarma, S.; Dutta, A. Utilizing Electric Vehicles for LFC in Restructured Power Systems Using Fractional Order Controller. IEEE Trans. Smart Grid2016, 8, 2554–2564. [Google Scholar] [CrossRef]
Hajforoosh, S.; Masoum, M.A.; Islam, S. Online optimal variable charge-rate coordination of plug-in electric vehicles to maximize customer satisfaction and improve grid performance. Electr. Power Syst. Res.2016, 141, 407–420. [Google Scholar] [CrossRef]
Nour, M.; Said, S.M.; Ramadan, H.; Ali, A.; Farkas, C. Control of Electric Vehicles Charging Without Communication Infrastructure. In Proceedings of the 2018 Twentieth International Middle East Power Systems Conference (MEPCON), Cairo, Egypt, 18–20 December 2018; pp. 773–778. [Google Scholar]
Ramadan, H.; Ali, A.; Nour, M.; Farkas, C. Smart Charging and Discharging of Plug-in Electric Vehicles for Peak Shaving and Valley Filling of the Grid Power. In Proceedings of the 2018 Twentieth International Middle East Power Systems Conference (MEPCON), Cairo, Egypt, 18–20 December 2018; pp. 735–739. [Google Scholar]
Marra, F.; Yang, G.Y.; Fawzy, Y.T.; Traeholt, C.; Larsen, E.; Garcia-Valle, R.; Jensen, M.M. Improvement of Local Voltage in Feeders with Photovoltaic Using Electric Vehicles. IEEE Trans. Power Syst.2013, 28, 3515–3516. [Google Scholar] [CrossRef]
Kisacikoglu, M.C.; Ozpineci, B.; Tolbert, L.M. Examination of a PHEV bidirectional charger system for V2G reactive power compensation. In Proceedings of the 2010 Twenty-Fifth Annual IEEE Applied Power Electronics Conference and Exposition (APEC) 2010, Palm Springs, CA, USA, 21–25 February 2010; pp. 458–465. [Google Scholar] [CrossRef]
Yong, J.Y.; Ramachandaramurthy, V.K.; Tan, K.M.; Mithulananthan, N. Bi-directional electric vehicle fast charging station with novel reactive power compensation for voltage regulation. Int. J. Electr. Power Energy Syst.2015, 64, 300–310. [Google Scholar] [CrossRef]
Azzouz, M.A.; Shaaban, M.F.; El-Saadany, E.F. Real-Time Optimal Voltage Regulation for Distribution Networks Incorporating High Penetration of PEVs. IEEE Trans. Power Syst.2015, 30, 1–12. [Google Scholar] [CrossRef]
Nour, M.; Ali, A.; Farkas, C. Evaluation of Electric Vehicles Charging Impacts on A Real Low Voltage Grid. Int. J. Power Eng. Energy2018, 1–6. [Google Scholar]
Zhang, K.; Xu, L.; Ouyang, M.; Wang, H.; Lu, L.; Li, J.; Li, Z. Optimal decentralized valley-filling charging strategy for electric vehicles. Energy Convers. Manag.2014, 78, 537–550. [Google Scholar] [CrossRef]
Su, J.; Lie, T.; Zamora, R. Modelling of large-scale electric vehicles charging demand: A New Zealand case study. Electr. Power Syst. Res.2019, 167, 171–182. [Google Scholar] [CrossRef]
Staudt, P.; Schmidt, M.; Gärttner, J.; Weinhardt, C. A decentralized approach towards resolving transmission grid congestion in Germany using vehicle-to-grid technology. Appl. Energy2018, 230, 1435–1446. [Google Scholar] [CrossRef]
Wang, Z. Grid Power Peak Shaving and Valley Filling Using Vehicle-to-Grid Systems. IEEE Trans. Power Deliv.2013, 28, 1822–1829. [Google Scholar] [CrossRef]
Colmenar-Santos, A.; Linares-Mena, A.-R.; Borge-Diez, D.; Quinto-Alemany, C.-D. Impact assessment of electric vehicles on islands grids: A case study for Tenerife (Spain). Energy2017, 120, 385–396. [Google Scholar] [CrossRef]
Dagdougui, H.; Ouammi, A.; Dessaint, L.A. Peak Load Reduction in a Smart Building Integrating Microgrid and V2B-Based Demand Response Scheme. IEEE Syst. J.2019, 13, 3274–3282. [Google Scholar] [CrossRef]
Martinenas, S.; Knezović, K.; Marinelli, M. Management of Power Quality Issues in Low Voltage Networks using Electric Vehicles: Experimental Validation. IEEE Trans. Power Deliv.2016, 32, 1. [Google Scholar] [CrossRef]
Akhavan-Rezai, E.; Shaaban, M.F.; El-Saadany, E.F.; Karray, F. Managing Demand for Plug-in Electric Vehicles in Unbalanced LV Systems with Photovoltaics. IEEE Trans. Ind. Inform.2017, 13, 1057–1067. [Google Scholar] [CrossRef]
Farahani, H.F. Improving voltage unbalance of low-voltage distribution networks using plug-in electric vehicles. J. Clean. Prod.2017, 148, 336–346. [Google Scholar] [CrossRef]
Jiménez, A.; García, N. Voltage unbalance analysis of distribution systems using a three-phase power flow ans a Genetic Algorithm for PEV fleets scheduling. In Proceedings of the 2012 IEEE Power Energy Society General Meeting 2012, San Diego, CA, USA, 22–26 July 2012; pp. 1–8. [Google Scholar] [CrossRef]
Jabalameli, N.; Su, X.; Ghosh, A. Online Centralized Charging Coordination of PEVs With Decentralized Var Discharging for Mitigation of Voltage Unbalance. IEEE Power Energy Technol. Syst. J.2019, 6, 152–161. [Google Scholar] [CrossRef]
Gallardo-Lozano, J.; Milanés-Montero, M.I.; Guerrero-Martínez, M.A.; Romero-Cadaval, E. Electric vehicle battery charger for smart grids. Electr. Power Syst. Res.2012, 90, 18–29. [Google Scholar] [CrossRef]
Rauchfuss, L.; Foulquier, J.; Werner, R. Charging station as an active filter for harmonics compensation of smart grid. In Proceedings of the 2014 16th International Conference on Harmonics and Quality of Power (ICHQP), Bucharest, Romania, 5–28 May 2014; Institute of Electrical and Electronics Engineers (IEEE); pp. 181–184. [Google Scholar]
Ali, A.; Raisz, D.; Mahmoud, K. Voltage fluctuation smoothing in distribution systems with RES considering degradation and charging plan of EV batteries. Electr. Power Syst. Res.2019, 176, 105933. [Google Scholar] [CrossRef]
García-Villalobos, J.; Zamora, I.; Knezović, K.; Marinelli, M. Multi-objective optimization control of plug-in electric vehicles in low voltage distribution networks. Appl. Energy2016, 180, 155–168. [Google Scholar] [CrossRef]
Brinkel, N.B.G.; Gerritsma, M.K.; AlSkaif, T.A.; Lampropoulos, I.; van Voorden, A.M.; Fidder, H.A.; van Sark, W.G.J.H.M. Impact of rapid PV fluctuations on power quality in the low-voltage grid and mitigation strategies using electric vehicles. Int. J. Electr. Power Energy Syst.2020, 118, 105741. [Google Scholar] [CrossRef]
Magdy, G.; Nour, M.; Shabib, G.; Elbaset, A.A.; Mitani, Y. Supplementary Frequency Control in a High-penetration Real Power System by Renewables Using SMES Application. J. Electr. Syst.2019, 15, 526–538. [Google Scholar]
Liu, L.; Kong, F.; Liu, X.; Peng, Y.; Wang, Q. A review on electric vehicles interacting with renewable energy in smart grid. Renew. Sustain. Energy Rev.2015, 51, 648–661. [Google Scholar] [CrossRef]
Teng, F.; Aunedi, M.; Strbac, G. Benefits of flexibility from smart electrified transportation and heating in the future UK electricity system. Appl. Energy2016, 167, 420–431. [Google Scholar] [CrossRef]
Dallinger, D.; Wietschel, M. Grid integration of intermittent renewable energy sources using price-responsive plug-in electric vehicles. Renew. Sustain. Energy Rev.2012, 16, 3370–3382. [Google Scholar] [CrossRef]
Dallinger, D.; Gerda, S.; Wietschel, M. Integration of intermittent renewable power supply using grid-connected vehicles—A 2030 case study for California and Germany. Appl. Energy2013, 104, 666–682. [Google Scholar] [CrossRef]
Lund, H.; Kempton, W. Integration of renewable energy into the transport and electricity sectors through V2G. Energy Policy2008, 36, 3578–3587. [Google Scholar] [CrossRef]
Li, Y.; Li, K. Incorporating Demand Response of Electric Vehicles in Scheduling of Isolated Microgrids With Renewables Using a Bi-Level Programming Approach. IEEE Access2019, 7, 116256–116266. [Google Scholar] [CrossRef]
Carrión, M.; Zárate-Miñano, R. Operation of renewable-dominated power systems with a significant penetration of plug-in electric vehicles. Energy2015, 90, 827–835. [Google Scholar] [CrossRef]
Saber, A.Y.; Venayagamoorthy, G.K.; Member, S. Plug-in Vehicles and Renewable Energy Sources for Cost and Emission Reductions Plug-in Vehicles and Renewable Energy Sources for Cost and Emission Reductions. IEEE Trans. Ind. Electron.2016, 58, 1229–1238. [Google Scholar] [CrossRef]
Kordkheili, R.A.; Pourmousavi, S.A.; Savaghebi, M.; Guerrero, J.M.; Nehrir, M.H. Assessing the Potential of Plug-in Electric Vehicles in Active Distribution Networks. Energies2016, 9, 34. [Google Scholar] [CrossRef]
Ahmadian, A.; Sedghi, M.; Mohammadi-Ivatloo, B.; Elkamel, A.; Golkar, M.A.; Fowler, M. Cost-Benefit Analysis of V2G Implementation in Distribution Networks Considering PEVs Battery Degradation. IEEE Trans. Sustain. Energy2017, 9, 961–970. [Google Scholar] [CrossRef]
Arias, N.B.; Hashemi, S.; Andersen, P.B.; Traeholt, C.; Romero, R. Distribution System Services Provided by Electric Vehicles: Recent Status, Challenges, and Future Prospects. IEEE Trans. Intell. Transp. Syst.2019, 20, 4277–4296. [Google Scholar] [CrossRef]
Zecchino, A.; Knezović, K.; Marinelli, M. Identification of conflicts between transmission and distribution system operators when acquiring ancillary services from electric vehicles. In Proceedings of the 2017 IEEE PES Innovative Smart Grid Technologies Conference Europe (ISGT-Europe), Torino, Italy, 26–29 September 2017. [Google Scholar]
Gerard, H.; Puente, E.I.R.; Six, D. Coordination between transmission and distribution system operators in the electricity sector: A conceptual framework. Util. Policy2018, 50, 40–48. [Google Scholar] [CrossRef]
Zeb, M.Z.; Imran, K.; Khattak, A.; Janjua, A.K.; Pal, A.; Nadeem, M.; Zhang, J.; Khan, S. Optimal Placement of Electric Vehicle Charging Stations in the Active Distribution Network. IEEE Access2020, 8, 68124–68134. [Google Scholar] [CrossRef]
Zhang, H.; Moura, S.J.; Hu, Z.; Song, Y. PEV Fast-Charging Station Siting and Sizing on Coupled Transportation and Power Networks. IEEE Trans. Smart Grid2018, 9, 2595–2605. [Google Scholar] [CrossRef]
Published by Natthanon Phannil, Chaiyan Jettanasen and Atthapol Ngaopitakkul * Faculty of Engineering, King Mongkut’s Institute of Technology Ladkrabang, Bangkok 10520, Thailand; Emails: aun_2535_006@hotmail.com (N.P.); chaiyan.je@kmitl.ac.th (C.J.) *Correspondence: atthapol.ng@kmitl.ac.th; Tel.: +66-(0)2-329-8330
Abstract
This paper proposes the study and analysis of harmonics, energy consumption and power quality of light emitting diode (LED) lamps equipped in building lighting systems. LED lamps with external (LED MR16) and internal (LED light bulb) drivers are investigated using an experimental setup to compare the results. The power quality of both LED lamps is studied by using a power quality meter to measure the generated harmonic currents from various case studies. The case study is divided into four major cases: one LED lamp is turned on with one driver, two LED lamps are turned on using the two drivers, eight LED lamps are turned on with one driver, and eight LED lamps are turned on with the eight drivers. As harmonics are related to total power factor (PF), which affects the energy savings of the building, hence, a filtering circuit to reduce harmonic current has been designed and implemented to improve power quality and/or power factor of the system. The different cases of harmonic filter insertion at the input of an LED lamp’s driver are discussed and then compared with a lighting standard to show the effectiveness of the passive filtering technique used in the studied system. In addition, the obtained result can be applied to both newly built and retrofitted buildings that aim to use LED technology to increase energy efficiency and decrease energy costs, and could be a helpful guide for end-users and manufacturers in addressing and developing LED issues.
Keywords:energy consumption; harmonic; light emitting diode; lighting system; power quality
1. Introduction
The world is facing significant energy challenges due to the rapid increase in energy demand stemming from the constantly growing world economy and population. With the rapid increase in energy consumption rates, limited fossil fuel resources and associated environmental issue, many countries are pushing energy policies with the objective of supporting renewable energy and increasing energy efficiency in every sector, in particular in urban buildings [1,2]. According to data from Energy Policy & Planning Office (EPPO) of the Ministry of Energy [3], Thailand’s total energy consumption in 2014 has been steadily increasing at a rate of 2.6% over the previous year. Considering the share of electricity consumption by sector in Thailand, based on historical energy data and statistical review [3-5], the growth of energy consumption in the business and residential sectors considerably surpassed economic growth. With this energy trend, the near future power generation capacity may not be able to keep up with electricity demand. It is worldwide accepted that energy conservation and energy efficiency improvement are essential issues to address the aforementioned challenges.
One of the methodologies to improve energy situation is increasing energy conservation and energy efficiency in building. The efficient use of lighting in buildings is another effective method for improving energy efficiency since lighting electricity systems account for so much energy use, typically approximately 20% to 30% of the electricity consumption in the building [6]. Thus, lighting is an important concern for building owners, and therefore to the entire economy. In general, the residential use of fluorescent lighting is varied, depending on many factors, such as the price of energy, financial and environmental concerns of the local people, and light output acceptability. In Thailand, Electricity Generating Authority of Thailand (EGAT) successfully persuaded consumers and/or users to use various kinds of high-efficiency lamps to achieve the energy efficiency of lighting system. The light emitting diode (LED) is the most popular energy-efficient source of lighting that used in many application areas. The LED lamps have recently come into the lighting market as an energy efficient alternative compared to traditional light sources such as incandescent and fluorescent bulbs. In recent years, along with the upward economic development trend of the emerging economy, the LED lighting market in Thailand has become a significant one that is drawing global attention. Nonetheless, the present energy savings will ultimately depend on the commitment of both industry and government.
However, power quality issue caused by increasing power electronic equipment such as LED lamps must be also taken into consideration. Since the LED lamp has a driver, which is a switching device that can generate harmonics and electromagnetic interference (EMI), so it is important to control the volume and noise reduction to avoid negative impacts on the building’s electrical system. In business, many dealers are not always aware of or even ignore the fact that these products should fulfil electromagnetic compatibility (EMC) requirements or electromagnetic interference (EMI) in the system due to the functioning of the switching devices of the LED driver. The measured results were compared directly with the limits in the harmonic standard without taking into account the measurement uncertainty. By considering the EMC for the lighting system, generally, the standard for lighting equipment is International Electrotechnical Commission (IEC) 61000-3-2:2018 which is the standard for harmonic current emissions limits (equipment with a rated input current ≤16 A). The considered IEC 61000-3-2:2018 standard is the update version; it concerns for example lighting equipment with a rated power ≤25 W taken into account for new type of lighting equipment, the modification of the requirements applied to the dimmers when operating non-incandescent lamps, and a clarification for lighting equipment including a control module with an active input power ≤2 W, and etc. [7]. For the lighting equipment, IEC 61000-3-2:2018 classifies lighting in class C and class D permitted value has been using for lighting equipment with rated power less than 25 W. Limit of harmonic current of lighting equipment for class C and D is described in Table 1.
Table 1. Limit of harmonic current of lighting equipment (class C and D equipment) [8].
Despite some advantages of LED lamps, many power quality issues resulting from the switching devices inside LED drivers must be taken into consideration, so this paper proposes an analysis of power quality from LED lamps in terms of generated harmonics in the lighting system. LED lamps with both external drivers (LED MR16 type) and internal drivers (LED light bulb type) that are commercially available in Thailand have been used and an experimental setup has been built. Section 2 presents the experimental setup used in this research and measures different parameters of power quality in terms of generated harmonic current from LED lamps in various case studies. The methodology in paper consists of building an experimental setup for LED lamps. Power quality meters and an oscilloscope have been used to obtain electrical parameters, the harmonic current in each order, voltage and current waveforms. Harmonic filter design is then carried out to overcome the harmonic problem. Section 3 proposes a filtering circuit to reduce harmonic current and improve total harmonic distortion (THD). The obtained harmonic currents before and after adding the filtering circuit are compared to the standard value set by the International Electrotechnical Commission (IEC). Conclusions and the discussion appear in Section 4. The obtained results from this research can be applied to buildings that are considering the replacement of conventional luminaires by LED luminaires, or newer buildings that are taking energy savings into account.
2. Literature Review
Research and studies from Thailand and various other countries in the field of energy efficiency technology and measurement implemented to reduce energy consumption have been reviewed [9-25]. To achieve their targets, energy consumption and various related factors such as climate must be considered and discussed to evaluate energy usage and energy saving potential [9-11]. A methodology for estimating building energy consumption and energy cost was presented by Gruber et al. [6]. The impact of climate change on energy demand and electric consumption in urban heat islands have been discussed in research by Santamouris et al. [10]. The results indicated that the increase of ambient temperature can increase electric demand by 0.5–8.5% per degree of temperature. Parkpoom and Harrison’s research [11] has evaluated the effect of temperature rising on electricity demand in Thailand. Their research forecasted that electrical peak demand will be increased 1.5–3.1% in 2020. In [12], an assessment of energy-saving solutions in high-rise office building in The Netherlands was presented. The results indicated that high-performance envelope design could contribute to energy savings of up to 42%. A new scheme for real time home power management (RTHPM) has been proposed by Hanife [13]. The proposed system produced a real-time solution for smart homes to avoid the high peak demand problem and save energy costs. Study on smart home energy management have been presented by many researchers with different kinds of control strategies to reduce energy consumption and energy cost while increasing comfort in the household [14-16]. In [19], a study by Sun et al. proposed an energy management system in buildings that integrated heating, cooling, shading and ventilation. The results showed that the proposed strategy could effectively reduce energy consumption in buildings. For energy usage in the lighting system in residential sector, Popoola et al.’s research has presented a methodology for estimating lighting usage patterns with considerations of natural light and occupancy using the Adaptive Neuro-Fuzzy Inference System model [22]. Another study estimating energy use in lighting systems was presented in Parise et al.’s research [23]. The suggested procedure has taken lighting control and behavior of the occupants into consideration. From the literature discussed above, it can be seen that researchers from various countries are constantly studying and developing newer methodologies and technologies that can be implemented in the buildings to increase energy efficiency and reduce energy consumption.
In fact, researchers have continually investigated LED for energy efficiency improvement and energy conservation in developing countries [26-35]. In [26,27], energy saving calculations were done for LED technology alone. Solid-state lighting, especially LEDs, is one of the promising and quickly developing lighting technologies for replacing old technologies. Even though the LED’s development leads to increase lighting consumption, energy savings are still important when considering the situation of using current technology. The results showed the potential of using LEDs by reducing household lighting energy use and corresponding CO2 emissions in Finland. The energy savings estimations in this paper, however, were based on the current level of household lighting energy use. In [28,29], the study has focused on the change of the lighting set, especially LEDs, at home. The proposed LED lighting system used multi-sensors and wireless communication technology for controlling an LED luminaire in accordance with the user’s state and the surroundings were presented in [28]. A smart LED lighting system for industrial and domestic use was implemented, and taken into account for visual comfort and energy savings of interior lighting were discussed in [29]. Another analysis of LED lamps concentrate on life cycle assessment showing that with current technology, LEDs have few advantages over compact fluorescent lamps (CFLs) [30]. A LED driver is an important component of a LED lamp, so the high efficiency driver affects to smooth lighting and energy saving in lighting application [31]. As a result, todays, although LED lamps have many advantages and their performance greatly improved, LEDs also have some disadvantages or side effects [20-29]. Without standards, customers have difficulty when purchasing LED-based products and the market can easily become full of confusion and disorder. Most LED lighting equipment is manufactured in China, with only a few sets of equipment being manufactured in Europe. Many lighting products in the market have been imported by dealers or retailers from third countries and sold under their own brand name. Sometimes, these dealers are not aware of or even ignore the fact that these products should follow or meet EMC requirements or EMI in the system due to the functioning of the switching devices in the LED driver. The measured results were compared directly with the limits in the harmonic standard without taking into account the measurement uncertainty.
A light emitting diode (LED) lamp is a harmonic source because it consists of an AC to DC rectifier and a current source converter to regulate the current that supplies LED arrays. Thus, the topic of the harmonic emission of LED lamps is studied in many research articles. In [30], incandescent lamps, fluorescent lamps, CFLs, and LEDs, which are the general lamps for the residential sector, are compared. The results showed that the fluorescent lamp, CFL, and LED are the source of harmonics, with CFLs and LEDs being the major sources. The existing electronic ballast has some major power quality problems: poor power factor (PF), high crest factor (CF) and high total harmonic distortion (%THD), which do not together meet the IEC61000-3-2 standard for class C lighting equipment. Saxena et al. [32] investigated the power quality of different household light sources: an incandescent lamp, fluorescent lamps with magnetic and electronic ballast, CFL, and LED. The measurement of power quality i.e., total harmonic distortion (THD), power consumption, luminous performance and power factors, were discussed. The results revealed that LED has the worst power quality, which provides the greatest THD and the lowest power factors, damaging sensitive electronic devices and utility assets. Experimental results comparing measurements with the standards are still lacking. Gil-de-Castro et al. [33] presented measurements of harmonic emissions from household appliances when conventional lighting is replaced with CFL and LED lamps. The results were compared with the IEC 61000-3-12 and IEEE 519 standards. It can be concluded that the use of CFL and LED lamps will cause an increase or decrease of harmonic emission. In addition, large-scale installation of the CFL and LED lamps might increase harmonics at higher frequencies. However, the total emission of study cases is satisfied for the limits set of the standards. Khan and Abas [34] compared the power quality parameters of different light sources. Although LED lamps provide great energy efficiency, they causes poor power quality due to their high current harmonic distortion and low power factors.
Rönnberg et al. [35-37] presented the impact of power quality when incandescent lamps are changed to LED lamps in order to achieve more energy savings. The power quality measurements based on laboratory tests were implemented for a domestic customer [35], a hotel [36], and an urban area [37]. The use of LED lamps leads to an increase in current harmonic distortion of 3rd, 5th, 7th orders. However, the amplitude of the harmonics is somewhat small due to their low power rating, and it is found to be below the IEC61000-3-12 standard. Hence, the harmonic effect on the electrical grid does not noticeably increase when a large number of LED lamps are employed. However, LED lamps are widespread not only in households due to the important role they play in saving energy. As a result, a decrease in the power quality of power distribution as a large number of LED lamps are usually connected to the same bus, resulting in high current harmonic distortion fed into the power system. For this reason, the power quality resulting from using LED lamps in power distribution systems needs to be studied and analyzed [38-45]. In Molina et al.’s work [38], a frequency-domain low-watt LED lamp model for current harmonic distortion calculation, which is applied for large-scale harmonic penetration, is discussed. Blanco and Parra [39] analyzed the voltage and current harmonic distortion of distribution systems when supplying energy to LED lamps.
Verma et al. [41] investigated the effect of harmonic generated from LED’s driver. Various LED brands were selected and compared. Additionally, the combination of different LED brands aimed to reduce the harmonic distortion is proposed. The results show that each brand of LED lamp gives a great variety of harmonic distortion values compared to the standard IEC 61000-3-2 class C, and the combination method can reduce the harmonic emission. Gil-de-Castro et al. [43] studied the power quality results of 24 different LED lamps in terms of harmonics and flicker. The LED lamps were measured and compared based on the harmonic current spectrum and light intensity variations at the same voltage magnitude. The results revealed that the harmonic emission of the LED lamps depends considerably on technology, i.e., power electronics, used within the LED lamps. Thus, the active power and the prices of LED lamps have no connection with the harmonic distortion they produce. Dolara and Leva [44] conducted measurements of power quality in indoor lighting systems using several types of LED and CFL lamps. The results showed that the use of drivers and ballasts in LED and CFL lamps, respectively, caused harmonic generation. Different lamp manufacturers use many driver technologies, leading to various current harmonic distortion values generated from the lamps. Many researches which have studied the harmonic emissions of LED lamps and drivers show that LED lamps can generate a lot of harmonic emissions. The IEC 61000-3-2 class C is used to compare with the harmonic emission of LED lamps, but some studies use lower 25-watt LED lamps which are not consistent with the IEC 61000-3-2 class C. Therefore, this paper employs the IEC 61000-3-2 class C and D to consider the harmonic emission. Additionally, many studies use different brands of LED lamps, but all of them use the E-27 lamp socket and internal LED driver. In this research, internal and external drivers are studied using two brands of LED lamps with each driver and varying the number of lamps and drivers.
There are numerous traditional and innovative techniques [45-52] that can be used to reduce or suppress harmonics unintentionally produced in any electrical/electronic system. Harmonics generated by lighting equipment and reduction methods have been presented in Chiradeja et al.’s research [5]. The study used fluorescent lamps with both magnetic and electronic ballasts to evaluate the harmonic issues in each type of luminaire. A study by Karim and et al. [45] proposed a low pass filter which could be used for LED harmonic attenuation. The experiment used an 18 W LED lamp with the external driver as the harmonic source. The harmonic emission is compared with the IEC 61000-3-2 class C and the total harmonic distortion (THDI) was 176.6% and 25.3% without and with the low pass filter, respectively. Shi’s research [46] presented a method to mitigate this harmonic distortion. The grid system is divided into three positions for placing the harmonic filter, including installing a three-phase filter at the substation, installing a single-phase filter at the secondary side of the transformer and installing a single-phase filter at the house. The set of combined single-tuned passive filters is employed to reduce the 3rd, 5th, 7th characteristic harmonics in a residence. It can reduce the harmonic voltage by 16–34% and the harmonic current by around 30%. Harmonic attenuation can be achieved by using different techniques. One of the most popular ways is the use of a passive low-pass filter which is presented in this research. This method is capable of reducing the harmonic emission from the lighting system in a satisfactory, effective, inexpensive, and easy to use way, so it is suitable for use in harmonic attenuation of indoor lighting systems where the user does not need to have extensive knowledge of electrical systems. In this research, the attenuation performance of the low-pass filter, which affects internal and external drivers, is compared.
3. Experimental Setup and Harmonic Results
In this section, an experimental setup with two types of LED lamp has been employed to evaluate their impact on power quality in terms of generated harmonics. LED lamps with an external driver (LED MR16 type) and with an internal driver (LED light bulb type) presently available on the market in Thailand were investigated. The objective was to discover the effect of the number of drivers and type of drivers on harmonic generation.
3.1. The LED Lamp with External Driver
The experimental setup for the LED lamp with an external driver is shown in Figure 1, while the detailed schematic layout of equipment in this setup is presented in Table 2. As shown in Figure 1, the experimental setup is a rack consisting of three layers. A layout diagram of the LED lamp and driver in each layer of experimental setup are illustrated in Figure 2. Each layer consists of nine LED lamps, nine LED drivers, and nine ON/OFF switches to operate each LED lamp and LED driver individually, as shown in Figure 1 and Figure 2. For the driver, two brands are used to evaluate the power quality and the quality of different commercial brands. Considering Figure 2b, the LED driver needs alternative current (AC) from the laboratory, line (L) and neutral (N), and its output is direct current (DC) supplied to the LED lamp through connection points (V+), and (V−). The LED lamp receives DC current from the LED driver at connection points (R), and (B) and the switches S1–S9 are used for ON/OFF operation for each LED lamp and driver, as depicted in Figure 2a.
Figure 1. Experimental setup of light emitting diode (LED) lamps and drivers.
Figure 2. Schematic diagram layout of equipment in experimental setup. (a) Layout of the LED lamp of each layer; (b) Layout of LED Driver in each layer.
Table 2. List of lighting equipment for experimental setup.
The case study is divided into two major cases. The first case examines only brand A; this case is also divided into four subcases cases: one LED lamp is turned on with the one driver (in the case of one LED lamp and one driver), two LED lamps are turned on using the two drivers (in the case of two LED lamps and two drivers), eight LED lamps are turned on with one driver (in the case of eight LED lamps and one driver), and eight LED lamps are turned on with the eight drivers (in the case of eight LED lamps and eight drivers). The objective is to discover the effect of the number of drivers and type of drivers for generating harmonics. The next major case study concerns only brand B, and is carried out in the same way as for brand A: one LED lamp and one driver, two LED lamps and two drivers, eight LED lamps and one driver, and eight LED lamps and eight drivers. The wiring diagram of LED lamp and driver for each case study is illustrated in Figure 3.
Figure 3. Layout circuit wiring diagram of the LED equipment of each layer. (a) Wiring diagram of LED lamp in case of one LED lamp; (b) Wiring diagram of LED driver in case of one LED lamp and one LED driver; (c) Wiring diagram of LED lamp in case of two LED lamps and two LED drivers; (d) Wiring diagram of LED driver in case of two LED lamps and two LED drivers.
Figure 3. Layout circuit wiring diagram of the LED equipment of each layer. (e) Wiring diagram of LED lamp in case of eight LED lamps and one LED driver; (f) Wiring diagram of LED driver in case of eight LED lamps and one LED driver; (g) Wiring diagram of LED lamp in case of eight LED lamps and eight LED drivers; (h) Wiring diagram of LED driver in case of eight LED lamps and eight LED drivers.
From the wiring diagram of the LED driver, it can be seen that the driver can separately control each LED lamp using SB1 through SB9 switches, while one switch can control the multi-LED lamp using the one driver that can operate by connecting the V+ terminal in driver to the R in the LED lamp, as depicted in Figure 3. However, in case of eight LED lamps and one LED driver as shown in Figure 3e,f, only one switch is operating for one LED drivers and other LED lamps has been connected in parallel from connecting terminal R, and B.
The single line diagram of the overall experimental setup is presented in Figure 4. The experimental setup is carried out at a voltage level of 230 V that is the single-phase power supply from laboratory (number 1 in Figure 4). In addition, the 30 A circuit breaker from the test bench and 5 A fuse (number 2 in Figure 4), which are the protective devices for the experimental setup (number 5 in Figure 4), are used.
Figure 4. Overall diagram of LED lighting experimental setup.
A power quality meter (435-II, Fluke, Everett, Washington, United States) is used to measure the electrical parameters and harmonics, while the current waveform of each case study can be captured from oscilloscope (WaveSurfer 3000 Series Oscilloscopes, Teledyne LeCroy, Chestnut Ridge, New York, United States).
After performing the various case studies, the obtained results can be summarized as shown in Table 3, while the current waveforms and harmonic current spectra are illustrated in Figure 5, Figure 6, Figure 7 and Figure 8. By considering the data of brand A driver in Table 3, one LED lamp with one driver (in the case of one LED lamp and one driver) is considered as the base case for brand A. It can be observed that the real power is approximately 5 W at a current of 0.049 A, while the percentage of total harmonic current distortion (%THDi) has a value of 187.6%; this indicates that the lighting system using LED has low energy consumption, but would generate high levels of harmonics in a system or building. By increasing the number of lamps and drivers (in the case of two LED lamps and two drivers), the current and all power increase significantly, by approximately 2=fold but the %THDi exhibits a small change. Moreover, it can be seen that the percentage of total harmonic voltage distortion (%THDv) and the power factor do not experience a significant change. Further analysis of brand A in Table 3, shows that when the number of LED lamps is changed from one lamp to eight lamps but the number of drivers remains the same (in the case of eight LED lamps and one driver), the current and all power tend to increase approximately 8-fold in comparison with the base case of the brand A driver (the case of one LED lamp and one driver) but the %THDi decreases slightly. Finally, when the number of LED lamps and drivers changes from one lamp to eight lamps (in the case of eight LED lamps and eight drivers), the current and all power tend to increase approximately 8-fold in comparison with the base case of the brand A driver, and the change is same as for the eight LED lamps and one driver setup; this indicates that the number of LED lamps is the factor that should be considered to save energy in a building, while the number of drivers has little or no impact on energy savings. By considering the %THDi in all cases of brand A, it can be noticed that the harmonic reduction should be improved.
Figure 5. Experimental waveform for case of LED lamp and driver with brand A. (a) Current waveform in the case of one lamp with one driver; (b) Current waveform in the case of two lamps with two drivers
Figure 5. Experimental waveform for case of LED lamp and driver with brand A. (c) Current waveform in the case of eight lamps with one driver; (d) Current waveform in the case of eight lamps with eight drivers
Figure 6. Experimental waveform for case of LED lamp and driver with brand B. (a) Current waveform in the case of one lamp with one driver; (b) Current waveform in the case of two lamps with two drivers; (c) Current waveform in the case of eight lamps with one driver; (d) Current waveform in the case of eight lamps with eight drivers.
Figure 7. Harmonic spectrum among cases of each LED lamp. (a) Harmonic spectrum of Brand A LED lamp (%f)
Figure 7. Harmonic spectrum among cases of each LED lamp. (b) Harmonic spectrum of Brand A LED lamp (mA/W)
Figure 7. Harmonic spectrum among cases of each LED lamp. (c) Harmonic spectrum of Brand B LED lamp (%f)
Figure 7. Harmonic spectrum among cases of each LED lamp. (d) Harmonic spectrum of Brand B LED lamp (mA/W).
Figure 8. Comparison of harmonic spectrum for case of eight LED lamps with eight drivers among different brands of LED lamp. (a) Harmonic spectrum of LED lamp (%f)
Figure 8. Comparison of harmonic spectrum for case of eight LED lamps with eight drivers among different brands of LED lamp. (b) Harmonic spectrum of LED lamp (mA/W)
Table 3. Summary results from experimental setup for each driver brand.
After carrying out the various driver cases with brand B, one LED lamp with one driver is also considered as the base case for brand B, as shown in Table 3. By considering the base case of one driver with brand B in Table 3, it can be observed that the real power is approximately 6 W at a current of 0.068 A, while the %THDi has a value of 99.5%; this indicates that there is a slight mismatch between the energy consumption and power quality in the LED lighting system. Moreover, the power factor of brand B is less than that of the base case of brand A. Based on a further analysis of all case studies of drivers with brand B, it can be seen that the all parameters exhibit the same behavior as the driver with brand A for each case study, but the all parameters of the brand B driver have a higher value than those of brand A, except for the power factor and %THDi.
The current waveforms obtained by using an oscilloscope for the various case studies with brand A are illustrated in Figure 5. It can be observed that the current waveform has been heavily distorted from a sinusoidal wave due to switching the device in the LED driver; this is also aligned with %THDi, which is measured from a power quality meter as presented in Table 3. In addition, when the number of LED lamps increases, the current amplitude is increased and is further changed to a sinusoidal wave, whereas, when the number of LED drivers increases, the current waveform is slightly distorted and results in higher %THDi values, as presented in Table 3.
The waveform results of changing the LED driver brand from brand A to brand B are illustrated in Figure 8 for each case study. These waveforms in Figure 6 clearly show that the current waveform is similar to a sinusoidal wave with a spike when the LED driver is switched; thus, the %THDi value is lower than the case of the LED driver with brand A. By increasing the number of LED lamps from 1 lamp to 8, the obtained current waveform is considerably distorted with the sinusoidal part changing steadily into a straight line and the spike having a larger gap, resulting in higher %THDi compared to another driver case with brand B. As a result, the obtained %THDi results in Table 3 were also aligned with the current waveform obtained from oscilloscope, as illustrated in Figure 7 and Figure 8.
As previously mentioned, the LED driver can generate harmonics in a lighting system, so the current harmonics must be carefully considered. The obtained current harmonics in each order generated from various LED drivers are measured and analysed using a power quality meter. The results of all case studies are presented in terms of their harmonic current spectrum as illustrated in Figure 7, while the harmonic current spectrum in the case of eight LED lamps with eight drivers of each brand is compared in Figure 8.
By considering the LED driver with brand A, as illustrated in Figure 7a, it can be observed that the harmonic current spectrum for odd orders are higher than even orders, which would be treated as zero percent and can be neglected. The 3rd order shows the highest harmonics and the harmonics steadily decrease as the order increases. These values are higher than the standard value. In the case of using eight lamps and one driver, harmonics in order 7 and higher are lower than the other cases while the 3rd and the 5th orders have higher values. The LED of brand B is similar to the previous case; harmonics that have an effect are odd orders with a higher value than the standard. In the case of using eight lamps and one driver, the harmonics increase as the number of LED lamp increases. This indicates that LED lamps are implied to be a source of harmonics. For LED lamps and drivers of brand A mixed with brand B, the trend is also similar in this case. The current harmonics are lower than those of brand A but higher than those of brand B as a result of the different brand in use. In the case of four LED lamps and one driver, harmonics from order 3 to 9 are higher than the other cases. The generated current harmonics obtained from the power quality meter are in accordance with summarized data and current waveforms as discussed above. The generated current harmonic results of different brands are shown in Figure 8. Brand A has larger harmonic current compared to the other brand, and when mixing between two brands, the harmonic value becomes significantly lower.
3.2. The LED Lamp with Internal Driver
As noted above, the LED lamp with an internal driver (LED light bulb type) was investigated as a case study in this paper. The single line diagram of the experimental setup is illustrated in Figure 9a, while the experimental setup and instrument are illustrated in Figure 9b. The experimental setup consists of eight E27 base LED light bulbs with four switches controlling on/off. Likewise, the power quality meter and oscilloscope are also used to obtain electric parameters and waveforms. In addition, two brands of LED lamps with internal drivers are also used to evaluate the power quality and the quality of different commercial brands.
Figure 9. Experimental setup in the case of LED lamp light bulb type. (a) Single line diagram of experimental setup; (b) Overall experimental setup.
The experimental setup of the two major case studies was carried out in detail as follows: one case study using only brand C, and a second using only brand D. By considering the first major case study, the experimental setup with only brand C is also divided into four case studies: one LED lamp, two LED lamps, four LED lamps, and eight LED lamps. The same set up is used for the brand D case study.
After carrying out the various major case studies, the obtained results can be summarized as presented in Table 4, while the current waveforms and harmonic current spectrum are illustrated in Figure 10, Figure 11, Figure 12 and Figure 13. By considering the data from brand C in Table 4, one LED lamp is considered as the base case for brand C, and it can be observed that the real power is approximately 10.5 W at a current of 0.05 A, while the percentage of %THDi is 22.9%. By increasing the number of LED lamps, the current and all power significantly increases which is correlated with the number of lamps while the %THDi changes little. The total power of the base case (one LED lamp of brand C) is compared with the base case in Table 3; it can be noted that the real power of brand C exceeds that of the base case in Table 3. The real power of brand C is higher but the reactive power is less than that of base case in Table 3, so the apparent power is equal to that of the base case in Table 3. The current waveform of brand C is captured using the oscilloscope for various case studies as illustrated in Figure 10; it can be observed that the obtained current waveform has a slight distortion due to harmonics generated from internal LED drivers, but the distortion of current waveform is less than that of the LED lamp with external drivers for all case studies. By increasing the number of LED lamps, the current waveform tends to be distorted from a sinusoidal wave with the amount of LED lamps, but the current waveform is slightly distorted in comparison with the case study of the LED lamp with external drivers in Figure 4 and Figure 5.
Figure 10. Waveform of LED lamp for brand C. (a) Current waveform in the case of one lamp; (b) Current waveform in the case of two lamps; (c) Current waveform in the case of four lamps; (d) Current waveform in the case of eight lamps.
Figure 11. Waveform of LED lamp for brand D. (a) Current waveform in the case of one lamp; (b) Current waveform in the case of two lamps; (c) Current waveform in the case of four4 lamps; (d) Current waveform in the case of eight lamps.
Figure 12. Harmonic spectrum among cases of each LED lamp with internal driver. (a) Harmonic spectrum of Brand C LED lamp (%f)
Figure 12. Harmonic spectrum among cases of each LED lamp with internal driver. (b) Harmonic spectrum of Brand C LED lamp (mA/W)
Figure 12. Harmonic spectrum among cases of each LED lamp with internal driver. (c) Harmonic spectrum of Brand D LED lamp (%f)
Figure 12. Harmonic spectrum among cases of each LED lamp with internal driver. (d) Harmonic spectrum of Brand D LED lamp (mA/W)
Figure 13. Comparison of harmonic spectrum for case of 8 LED lamps with internal driver among different brands of LED lamp. (a) Harmonic spectrum of LED lamp (%f)
Figure 13. Comparison of harmonic spectrum for case of 8 LED lamps with internal driver among different brands of LED lamp. (b) Harmonic spectrum of LED lamp (mA/W)
Table 4. Summary results from experimental setup for LED light bulb type.
Further analyzing brand D in Table 4, one LED lamp is considered as the base case for this brand. It can be observed that the real power is approximately 8.6 W at a current of 0.039 A, while the percentage of %THDi is 16.6%. Likewise, by increasing the number of LED lamps, the current and all power tends to increase, which is correlated with the number of lamps as in the brand C study, while the %THDi changes little. Figure 11 shows that the current waveform is slightly distorted from the sinusoidal wave with a spike in comparison to the LED lamp with external drivers in Figure 4 and Figure 5. A spike occurs in the waveform with an amplitude higher than that of brand C, so the current waveform is further distorted with the amplitude of the spike increase and correlated with the number of lamp.
When comparing the results of brand A, B, C and D as presented in Table 3 and Table 4, it is found that the LED light bulb type with internal driver (brands C and D) consumes more real power than the LED lamp with external driver (brands A and B) in the same configuration, but they consume less reactive power with similar apparent power. That is why the power factor of brands C and D is higher than that of brands A and B, resulting in less %THDi. This shows that brands C and D are more appropriate for use in building lighting systems when the focusing is on harmonics or power quality. The overall trend is fairly the same when the number of LED lamps or drivers increases.
The generated current harmonics in each order from LED light bulb type measured by a power quality meter are shown in Figure 12a–c. In the case of brand C LED light bulbs, as shown in Figure 12a, only an odd harmonic order is generated and with highest value in the 3rd order. The number of lamps does not have any effect on current harmonics, and as the number of lamps increases, the current harmonics remain unchanged, except in the case of eight lamps. The current harmonics are increased in every order except for the 5th order, which is lower than the previous case. In the case of brand D LED light bulbs, as shown in Figure 12b, only odd order current harmonics are clearly noticeable. The current harmonics in the 3rd order are the highest when using one lamp, while the 5th order using two and four lamps cause the highest current harmonics of these orders and from order 7 and higher, the eight lamp-setup has the highest current harmonic value. Increasing the number of lamps does not affect current harmonics. The figure indicates that current harmonics are also aligned with current waveform, as discussed above.
Figure 13 shows a comparison of current harmonics in each order among different brands in the case of using 8 LED lamps. It can be seen that brand C has the highest harmonics in every order compared to brand D and mixing case except for the harmonics of the order 5. When mixing between two brands, some harmonic orders cancel each other out, resulting in reducing current harmonics in some orders such as order 7 and 15. In the 5th order, however, current harmonics from two brands superimpose each other causing higher current harmonics than in the case of only brand C or brand D.
For LED light bulb type, power consumption is higher than LED lamps with external drivers. The power factor is higher, and its value is close to 1. This type of LED light bulb does not have an effect on %THDv. For %THDi, it is significantly lower than LED lamps with external drivers. For brand C LED light bulbs, when increasing the number of lamps, current is steadily distorted as shown in Table 4 that the %THDi value is increased when the number of lamps increases. For LEDs of brand D, the power factor is higher compared to brand A with low power consumption. After performing several case studies, the overall results can be summarized as follows:
In terms of energy consumption or real power consumed, LED light bulbs (brands C and D) consume more power than LED lamps with external driver (brands A and B). Bulbs consume less reactive power which is good and this leads to a high power factor and low %THDi.
For both types of LED lamps, when increasing the number of lamps or drivers, the %THDv remains unchanged. This is because the source voltage is not affected by the harmonic current generated by the LED’s driver.
The total harmonic distortion of current in the case of brands C and D is obviously less than that of brands A and B. This is because when considering the current waveform, it is distorted less than the sinusoidal wave, meaning that it contains less harmonic current. It reveals that the LED light bulb type is more appropriate than the LED lamp with external drivers in terms of harmonic mitigation and quality of waveform.
4. Reduction of Harmonics Using Passive Low-Pass Filter
As discussed in the previous section, according to the International Electrotechnical Commission (IEC) 61000-3-2:2018 and Electromagnetic Compatibility (EMC) standard, the maximum harmonic for LED lamp equipment has been classified as follows: Class A, Class B, Class C and Class D. Each class addresses specific electric equipment [14]. Lighting equipment having a rated power greater than 25 W is classified in Class C and lighting equipment having a rated power between 5 W and 25 W are applied to class D harmonic current permitted. The maximum harmonic current permitted for class C and class D equipment has been summarized in Table 1.
Low pass filter circuits are designed and built to reduce harmonics generated from LED lamps, as depicted in Figure 14. The filter consists of one series toroidal inductor of 76.18 mH and five capacitors of 11 μF connected in parallel into a circuit. The designed circuit aims to cut off frequencies of approximately 174 Hz. The proposed filter circuit has been tested with LED lamps of both the external driver and light bulb type.
Figure 14. Low pass filter circuit.
A comparison result of LED lamp with two driver types with IEC 61000-3-2:2018 standard class C and D has been done in case of with and without installed filter. In the case of LED lamps with external drivers, brand A’s LED lamp is focused on due to the highest current harmonics. A comparison between the IEC 61000-3-2 standard value and the harmonic current generated from LED external driver type with and without a filter circuit is shown in Figure 15a. The figure indicates that the LED lamp with external drivers has a larger current harmonic than the standard permitted value. The proposed filter circuit can reduce the current harmonic significantly; however, the current harmonic value is still higher than the standard.
Figure 15. Comparison of harmonic magnitude for lighting system with and without filter including IEC standard. (a) LED lamp with external driver including Class C IEC standard
Figure 15. Comparison of harmonic magnitude for lighting system with and without filter including IEC standard. (b) LED lamp with external driver including Class D IEC standard
The comparison for eternal driver LED lamp with standard class D is shown in Figure 15b. From the figure, it can be seen that harmonic current permitted is a bit higher compared to class C. However, without low pass filter circuit LED generated harmonic current higher than permitted value. After adding the low pass filter circuit, current harmonic in every order has been significantly reduced but these values are still higher than standard permitted value.
In the case of LED light bulb type, the brand C LED lamp connected with a low pass filter circuit has been studied. Figure 15b shows the comparison between IEC 61000-3-2 standard values with the harmonic current generated from LED light bulbs with and without a filter circuit. According to the results and figure, brand C LED light bulbs have an odd harmonic value after the 5th order that is higher than the standard permitted value. After inserting the low pass filter circuit, it can be seen that the current harmonics in every order decrease considerably. The results from the power quality meter indicate that the designed filter circuit can reduce the harmonics to within the standard value.
The comparison for external driver LED lamp with standard class D is shown in Figure 16b. From the figure, it can be seen that without low pass filter circuit LED generated harmonic current higher than permitted value. However, only harmonic current in 3rd and 5th order is within standard value. After inserting the low pass filter circuit, current harmonic in every order has been reduced significantly. In addition, harmonic current in all order is within standard permitted value.
Figure 16. Comparison of harmonic magnitude for lighting system with and without filter including IEC standard. (a) LED lamp with internal driver including Class C IEC standard
Figure 16. Comparison of harmonic magnitude for lighting system with and without filter including IEC standard. (b) LED lamp with internal driver including Class D IEC standard
5. Conclusions
The efficient use of lighting in the buildings is one way to support energy conservation, and the implementation of new technology and standards to reduce energy consumption have become an interesting topic for engineers and researchers. Concerning indoor lighting, the use of LED lamps in buildings is rapidly increasing owing to their low energy consumption and long life cycle. However, studies on their harmonic current emissions have rarely been carried out. This technical problem could be severe for nearby sensitive electrical equipment installed in the considered system or building. This paper presented an energy efficiency analysis in terms of energy consumption, harmonics and power quality for LED lamps equipped in a building lighting system. The experimental setup was built to evaluate the energy consumption and power quality issues and to measure the related electrical parameters. Two types of LED lamps commercially available on the market in Thailand market were used in the experiments: LED lamps with external drivers and LED light bulbs with internal driver.
The results obtained from the power quality meter and oscilloscope indicated that LEDs with external drivers caused severe harmonic distortion and power quality because the external driver can drive multiple lamps per driver. LED lamps with brand A external drivers exhibit higher harmonic values compared to brand B. When mixing between two brands, current harmonics are reduced but are still higher than for brand B. When comparing this value with the IEC 61000-3-2:2018 standard, the harmonic value is higher than the standard permitted value. In the case of LED light bulbs, only some current harmonic orders are higher than the standard. For this type of LED lamp, when mixing between two brands, current harmonics in some orders were increased. To reduce the harmonics and prevent them from surpassing the standard, the low pass filter circuit was designed and built. This circuit was tested in the experimental test bench using the LED lamp brand that generated the highest current harmonics. The comparison has been done with both class C and D harmonic permitted value. After adding the filter in the system, it can be seen that LED lamps with external drivers can reduce the harmonic value significantly even though it is still higher than the permitted value. LED light bulbs with the filter circuit reduced the harmonic value to be below the standard value. The obtained result can be applied to the large-scale installation of LED lamps in building lighting systems due to power quality issues. Harmonics from this type of luminaire combined with other appliances can cause damage or malfunction to other sensitive electrical equipment in the building. The countermeasure must be implemented to keep harmonic values within the standard in order to guarantee high power factor, leading to less energy consumption. The passive filtering circuit is one method that can reduce current harmonics and improve power quality and energy efficiency of the building lighting system.
Author Contributions: N.P., C.J., A.N. Conceptualization, C.J. and A.N.; Methodology, C.J.; Validation, N.P. and A.N.; Formal Analysis, N.P.; Investigation, N.P.; Resources, A.N.; Data Curation, N.P.; Writing-Original Draft Preparation, C.J. and A.N.; Writing-Review & Editing, C.J. and N.P.; Visualization, A.N.; Supervision, A.N.; Project Administration, A.N.; Funding Acquisition, A.N.
Funding: The work presented in this paper is part of a research project (No. 2558A11802136) sponsored by the King Mongkut’s Institute of Technology Ladkrabang Research Fund. The author would like to thank them for the financial support.
Acknowledgments: The work presented in this paper is part of a research project sponsored (No. 2558A11802136) by the National Research Council of Thailand and the King Mongkut’s Institute of Technology Ladkrabang Research Fund. The authors would like to thank them for their financial support.
Conflicts of Interest: The authors declare no conflict of interest.
References
Geller, H.; Harrington, P.; Rosenfeld, A.H.; Tanishima, S.; Unander, F. Polices for increasing energy efficiency: Thirty years of experience in OECD countries. Energy Policy2006, 34, 556–573. [Google Scholar] [CrossRef]
Huang, B.; Mauerhofer, V.; Geng, Y. Analysis of existing building energy saving policies in Japan and China. J. Clean. Prod.2016, 112, 1510–1518. [Google Scholar] [CrossRef]
Energy Policy and Planning Office (EPPO), Ministry of Energy. Thailand 20-year Energy Efficiency Development Plan (EEDP). Available online: http://www.eppo.go.th/images/POLICY/ENG/EEDP_Eng.pdf (accessed on 24 April 2016).
Chiradeja, P.; Ngaopitakkul, A.; Jettanasen, C. Energy savings analysis and harmonics reduction for the electronic ballast of T5 fluorescent lamp in a building’s lighting system. Energy Build.2015, 97, 107–117. [Google Scholar] [CrossRef]
Gruber, J.K.; Prodanovic, M.; Alonso, R. Estimation and Analysis of Building Energy Demand and Supply Costs. Energy Procedia2015, 83, 216–225. [Google Scholar] [CrossRef]
International Electrotechnical Commission (IEC). IEC 61000-3-2:2018. Electromagnetic Compatibility (EMC)—Part 3-2: Limits—Limits for Harmonic Current Emissions (Equipment Input Current ≤16 A per Phase). Available online: https://webstore.iec.ch/publication/62553 (accessed on 1 November 2018).
Ezhilarasan, G.; Srinivasan, V.; Vijayalakshmi, M. An isolated two stage converter for LED lighting systems working with renewable energy. In Proceedings of the 2013 International Conference on Energy Efficient Technologies for Sustainability, Nagercoil, India, 10–12 April 2013; pp. 802–807. [Google Scholar]
Santamouris, M.; Cartalis, C.; Synnefa, A.; Kolokotsa, D. On the impact of urban heat island and global warming on the power demand and electricity consumption of buildings–A review. Energy Build.2015, 98, 119–1241. [Google Scholar] [CrossRef]
Parkpoom, S.; Harrison, G.P. Analyzing the Impact of Climate Change on Future Electricity Demand in Thailand. IEEE Trans. Power Syst.2008, 23, 1441–1448. [Google Scholar] [CrossRef][Green Version]
Raji, B.; Tenpierik, M.J.; Dobbelsteen, A.V.D. An assessment of energy-saving solutions for the envelope design of high-rise buildings in temperate climates: A case study in The Netherlands. Energy Build.2016, 124, 210–221. [Google Scholar] [CrossRef]
Özkan, H.A. A new real time home power management system. Energy Build.2015, 97, 56–64. [Google Scholar] [CrossRef]
Anvari-Moghaddam, A.; Monsef, H.; Kian, A.R. Optimal Smart Home Energy Management Considering Energy Saving and a Comfortable Lifestyle. IEEE Trans. Smart Grid2015, 6, 324–332. [Google Scholar] [CrossRef]
Manic, M.; Wijayasekara, D.; Amarasinghe, K.; Andina, J.J.R. Building Energy Management Systems: The Age of Intelligent and Adaptive Buildings. IEEE Ind. Electron. Mag.2016, 10, 25–39. [Google Scholar] [CrossRef]
Zhou, B.; Li, B.; Chan, K.W.; Cao, Y.; Kuang, Y.; Liu, X.; Wang, X. Smart home energy management systems: Concept, configurations, and scheduling strategies. Renew. Sustain. Energy Rev.2016, 61, 30–40. [Google Scholar] [CrossRef]
Al Dakheel, J.; Tabet Aoul, K.; Hassan, A. Enhancing Green Building Rating of a School under the Hot Climate of UAE; Renewable Energy Application and System Integration. Energies2018, 11, 2465. [Google Scholar] [CrossRef]
Gagliano, A.; Nocera, F.; Detommaso, M.; Patania, F. Design solutions for reducing the energy needs of residential buildings. In Proceedings of the IREC2015 The Sixth International Renewable Energy Congress, Sousse, Tunisia, 24–26 March 2015; pp. 1–6. [Google Scholar]
Sun, B.; Luh, P.B.; Jia, Q.S.; Jiang, Z.; Wang, F.; Song, C. Building Energy Management: Integrated Control of Active and Passive Heating, Cooling, Lighting, Shading, and Ventilation Systems. IEEE Trans. Autom. Sci. Eng.2013, 10, 588–602. [Google Scholar] [CrossRef]
Kaminska, A.; Ożadowicz, A. Lighting Control Including Daylight and Energy Efficiency Improvements Analysis. Energies2018, 11, 2166. [Google Scholar] [CrossRef]
Sesana, M.M.; Grecchi, M.; Salvalai, G.; Rasica, C. Methodology of energy efficient building refurbishment: Application on two university campus-building case studies in Italy with engineering students. J. Build. Eng.2016, 6, 54–64. [Google Scholar] [CrossRef]
Popoola, O.; Munda, J.; Mpanda, A. Residential lighting load profile modelling. Energy Build.2015, 90, 29–40. [Google Scholar] [CrossRef]
Parise, G.; Martirano, L.; Parise, L. A Procedure to Estimate the Energy Requirements for Lighting. IEEE Trans. Ind. Appl.2016, 52, 34–41. [Google Scholar] [CrossRef]
Tetri, E.; Sarvaranta, A.; Syri, S. Potential of new lighting technologies in reducing household lighting energy use and CO2 emissions in Finland. Energy Effic.2014, 7, 559–570. [Google Scholar] [CrossRef]
Bladh, M. Energy efficient lighting meets real home life. Energy Effic.2011, 4, 235–245. [Google Scholar] [CrossRef]
Tan, Y.K.; Huynh, T.P.; Wang, Z. Smart Personal Sensor Network Control for Energy Saving in DC Grid Powered LED Lighting System. IEEE Trans. Smart Grid2013, 4, 669–676. [Google Scholar] [CrossRef]
Pandharipande, A.; Caicedo, D. Adaptive Illumination Rendering in LED Lighting Systems. IEEE Trans. Syst. Man Cybern. Syst.2013, 43, 1052–1062. [Google Scholar] [CrossRef]
Byun, J.; Hong, I.; Lee, B.; Park, S. Intelligent household LED lighting system considering energy efficiency and user satisfaction. IEEE Trans. Consum. Electron.2013, 59, 70–76. [Google Scholar] [CrossRef]
Garcia, E.J.P.; Chen, A.; Santiago, I.; Outeiriño, F.J.B.; Arias, J.M.F.; Munoz, A.M. Stochastic model for lighting’s electricity consumption in the residential sector. Impact of energy saving actions. Energy Build.2015, 89, 245–259. [Google Scholar] [CrossRef]
Lien, T.K.; Sangwan, K.S.; Bhakar, V.; Naik, S.; Andrat, S.N. Life Cycle Assessment of Incandescent, Fluorescent, Compact Fluorescent and Light Emitting Diode Lamps in an Indian Scenario. Procedia CIRP2014, 15, 467–472. [Google Scholar] [CrossRef]
Cheng, C.A.; Chang, E.C.; Tseng, C.H.; Chung, T.Y. A Single-Stage LED Tube Lamp Driver with Power-Factor Corrections and Soft Switching for Energy-Saving Indoor Lighting Applications. Appl. Sci.2017, 7, 115. [Google Scholar] [CrossRef]
Saxena, R.; Nikum, K. Comparative study of different residential illumination appliances based on power quality. In Proceedings of the IEEE 5th India International Conference on Power Electronics (IICPE 2012), Delhi, India, 6–8 December 2012; pp. 1–5. [Google Scholar]
Castro, A.G.D.; Rönnberg, S.K.; Bollen, M.H.J.; Muñoz, A.M. Study on harmonic emission of domestic equipment combined with different types of lighting. Int. J. Electr. Power Energy Syst.2014, 55, 116–127. [Google Scholar] [CrossRef]
Khan, N.; Abas, N. Comparative study of energy saving light sources. Renew. Sustain. Energy Rev.2011, 15, 296–309. [Google Scholar] [CrossRef]
Rönnberg, S.K.; Bollen, M.H.J.; Wahlberg, M. Harmonic emission before and after changing to LED and CFL—Part I: Laboratory measurements for a domestic customer. In Proceedings of the 14th IEEE International Conference on Harmonics and Quality of Power (ICHQP 2010), Bergamo, Italy, 26–29 September 2010; pp. 1–7. [Google Scholar]
Rönnberg, S.K.; Wahlberg, M.; Bollen, M.H.J. Harmonic emission before and after changing to LED and CFL—Part II: Field measurements for a hotel. In Proceedings of the 14th IEEE International Conference on Harmonics and Quality of Power (ICHQP 2010), Bergamo, Italy, 26–29 September 2010; pp. 1–6. [Google Scholar]
Rönnberg, S.K.; Wahlberg, M.; Bollen, M.H.J. Harmonic emission before and after changing to LED lamps—Field measurements for an urban area. In Proceedings of the 15th IEEE International Conference on Harmonics and Quality of Power, Hong Kong, China, 17–20 June 2012; pp. 552–557. [Google Scholar]
Molina, J.; Mesas, J.J.; Mesbahi, N.; Sainz, L. LED lamp modelling for harmonic studies in distribution systems. IET Gener. Transm. Distrib.2017, 11, 1063–1071. [Google Scholar] [CrossRef]
Blanco, A.M.; Parra, E.E. Effects of high penetration of CFLs and LEDs on the distribution networks. In Proceedings of the 14th IEEE International Conference on Harmonics and Quality of Power (ICHQP 2010), Bergamo, Italy, 26–29 September 2010; pp. 1–5. [Google Scholar]
Busatto, T.; Abid, F.; Larsson, A.; Bollen, M.H.J.; Singh, G. Interaction between grid-connected PV systems and LED lamps: Directions for further research on harmonics and supraharmonics. In Proceedings of the 17th IEEE International Conference on Harmonics and Quality of Power (ICHQP), Belo Horizonte, Brazil, 16–19 October 2016; pp. 193–197. [Google Scholar]
Verma, P.; Patel, N.; Nair, N.C. LED electronics, harmonic issues and augmenting Standards. In Proceedings of the 2017 IEEE International Conference on Consumer Electronics (ICCE), Las Vegas, NV, USA, 8–10 January 2017; pp. 190–191. [Google Scholar]
Uddin, S.; Shareef, H.; Mohamed, A.; Hannan, M.A. An analysis of harmonics from dimmable LED lamps. In Proceedings of the 2012 IEEE International Power Engineering and Optimization Conference Melaka, Melaka, Malaysia, 6–7 June 2012; pp. 182–186. [Google Scholar]
Gil-de-Castro, A.; Rönnberg, S.K.; Bollen, M.H.J. Light intensity variation (flicker) and harmonic emission related to LED lamps. Electr. Power Syst. Res.2017, 146, 107–114. [Google Scholar] [CrossRef]
Dolara, A.; Leva, S. Power Quality and Harmonic Analysis of End User Devices. Energies2012, 5, 5453–5466. [Google Scholar] [CrossRef][Green Version]
Karim, F.A.; Ramdhani, M.; Kurniawan, E. Low pass filter installation for reducing harmonic current emissions from LED lamps based on EMC standard. In Proceedings of the 2016 International Conference on Control, Electronics, Renewable Energy and Communications (ICCEREC), Bandung, Indonesia, 13–15 September 2016; pp. 132–135. [Google Scholar]
Shi, Q.; Liang, H.; Hou, T.; Bai, L.; Xu, W.; Li, F. Passive filter installation for harmonic mitigation in residential distribution systems. In Proceedings of the 2017 IEEE Power & Energy Society General Meeting, Chicago, IL, USA, 16–20 July 2017; pp. 1–5. [Google Scholar]
Pellegrino, A.; Verso, V.R.; Blaso, L.; Acquaviva, A.; Patti, E.; Osello, A. Lighting Control and Monitoring for Energy Efficiency: A Case Study Focused on the Interoperability of Building Management Systems. IEEE Trans. Ind. Appl.2016, 52, 2627–2637. [Google Scholar] [CrossRef]
Sundareswaran, K.; Kumar, K.A.; Venkateswaran, P.R.; Sahu, D. A real-time implementation of solar photovoltaic powered LED interior lighting systems. In Proceedings of the 2015 IEEE Power, Communication and Information Technology Conference (PCITC), Bhubaneswar, India, 15–17 October 2015; pp. 263–267. [Google Scholar]
Yu, X.; Su, Y. Daylight availability assessment and its potential energy saving estimation—A literature review. Renew. Sustain. Energy Rev.2015, 52, 494–503. [Google Scholar] [CrossRef]