Paralleling Dissimilar Generators: Part 2 – Compatible Alternators

Published by By Gary Olson, Director of Technical Support, Cummins Power Generation, Power topic #9016 | Technical information from Cummins Power Generation – White Paper


Paralleled alternators are compatible if they can operate in parallel without having damaging or disruptive neutral currents flowing between them. The magnitude of neutral current flow related to the dissimilarity between paralleled sets depends upon the shape of their voltage waveforms. Depending on the generators’ temperature rise characteristics, age and insulating ratings, neutral current flow between generator sets is not necessarily damaging. Be aware that neutral currents can also cause disruption in protective relay operation, particularly for ground fault sensing.

Voltage waveform harmonics

The voltage waveform shape created by an alternator when operating unloaded or driving a linear load may be described in terms of its fundamental frequency and voltage magnitude and the magnitude of the harmonic voltages and their frequencies. The description is necessary because all alternators exhibit some level of harmonic voltage distortion, and while these distortions are very small relative to the distortion that can be caused by non-linear loads, they may still be significant, particularly in paralleling applications.

Figure 1 – Harmonic waveform relationships.

Figure 1 shows the relationship of first-order (fundamental frequency waveform) to third and fifth-order harmonic waveforms. The harmonic voltages are effectively added to the fundamental waveform, resulting in the pure sinusoidal shape of the fundamental being somewhat distorted. For example, the resultant voltage at time A in Figure 1 will be the sum of the blue (fifth-order), green (third-order), and red voltage magnitudes. So, the instantaneous voltage at that instant in time would be somewhat higher than the voltage of the fundamental. Note that the illustration greatly magnifies the typical magnitudes of harmonic voltage levels to more easily show the principles surrounding them.

No alternator manufacturer intentionally inserts harmonic voltages in its designs, but some magnitude of distortion is inevitable due to the physics and practical limitations of AC machine design. During the design process the alternator designer will attempt to design the machine to minimize the voltage distortion (i.e., the magnitude of the third- and higher-order harmonic voltages), while minimizing the cost of the machine at a specific rating. The differences in the overall waveform shape of dissimilar machines are at the heart of problems generated by the paralleling of these machines.

Mechanical design characteristics driving harmonics

Alternator designers can control the magnitude and orders of harmonics produced in an alternator by manipulation of several design factors, the most important of which is alternator pitch.

Figure 2 – Pitch in alternator design: 5/6 and 2/3.

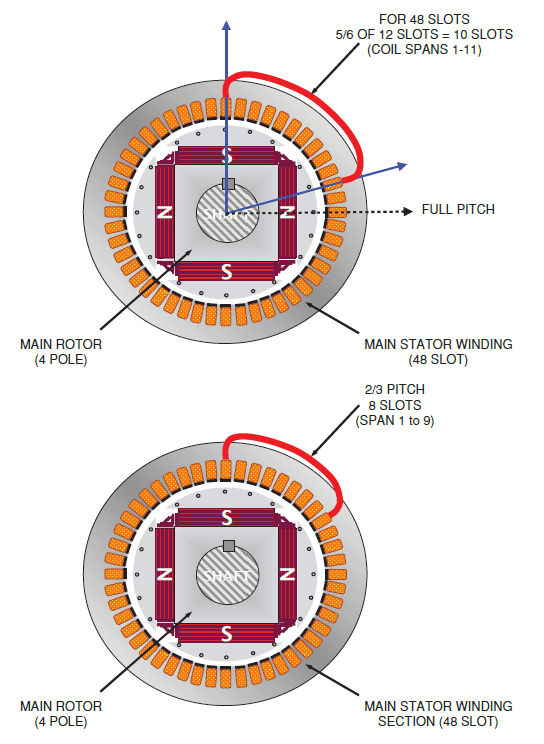
Pitch is a term used to define a mechanical design characteristic of a generator. It is the ratio of the number of slots enclosed by each coil in the alternator stator to the number of winding slots per generator pole. In Figure 2 (top half), which shows a 4 pole machine with 48 total slots, there will be 12 slots per pole, and since the coils span 10 slots, the alternator slot-to-coil ratio is 10/12, or “5/6 pitch.” In the lower half of the illustration we see an alternator winding that spans 8 slots, so with 12 slots per pole, that machine would be 2/3 pitch. The pitch of a generator is a design parameter that can be used to optimize the generator waveform shape and minimize the generator cost, because shorter pitch (lower pitch ratios) use the alternator stator less effectively and require the use of more copper for the same kW output than higher pitch machines.

For example, an alternator could be provided with a 2/3 pitch, which would eliminate third-order harmonics, but result in slightly higher fifth- and seventh-order harmonics. Alternately, the alternator designer could select another pitch design, which usually would result in high levels of third-order harmonics, but relatively lower levels of fifth- and seventh-order harmonics, and probably a bit more kW capacity for the materials used in the machine. For example, a 5/6 pitch machine illustrated would have relatively lower fifth- and seventh order harmonics, but much higher third-order harmonics.

In general, the odd-order harmonics are of the greatest concern to a system designer, because they will have the greatest impact on the operation of loads and on extraneous heating effects in the power supply and distribution system. Third-order harmonics (and their multiples) are problematical because they directly add in the neutral, and can result in large neutral current flows between paralleled machines. They are also more problematic because they can migrate through the system across some transformer types. Fifth-order harmonics (and their multiples) are considered to be a concern because they are “negative sequence” currents, and will cause some level of abnormal heating in rotating load devices. However, with careful design of a 2/3 pitch machine, the fifth- and seventh order harmonics can be reduced to magnitudes of a level similar to higher pitch machines, leaving the major advantage of higher pitch machines to be exclusively lower initial cost.

For paralleling applications, it is highly desirable to utilize 2/3 pitch designs. Because no third-order harmonics are created by the machine, paralleling compatibility with utility (mains) sources or other 2/3 pitch machines is assured because there are not neutral currents related to third-order harmonics; and higher-order harmonics see relatively greater impedances at higher frequencies and are thus much less of a problem in terms of neutral current flow. The system designer should select alternators that not only have a 2/3 pitch design, but also have minimum fifth-, seventh- and higher-order harmonics. A good standard to achieve for machines ranging in size from roughly 100 kW to 4 MW is that the machine should have not more than 5% total harmonic distortion at any load between no load and full load, measured line to line and line to neutral, and not more than 3.0% in any single phase.

Circulating neutral currents due to alternator differences

When generators are paralleled, the voltage of the two machines is forced to the exact same magnitude. Differences in voltage, regardless of their frequency, will result in current flow from the machine with higher instantaneous voltage to the machine(s) with lower instantaneous voltage. Figure 3 illustrates this phenomenon.

Figure 3 – Voltages before and after paralleling.

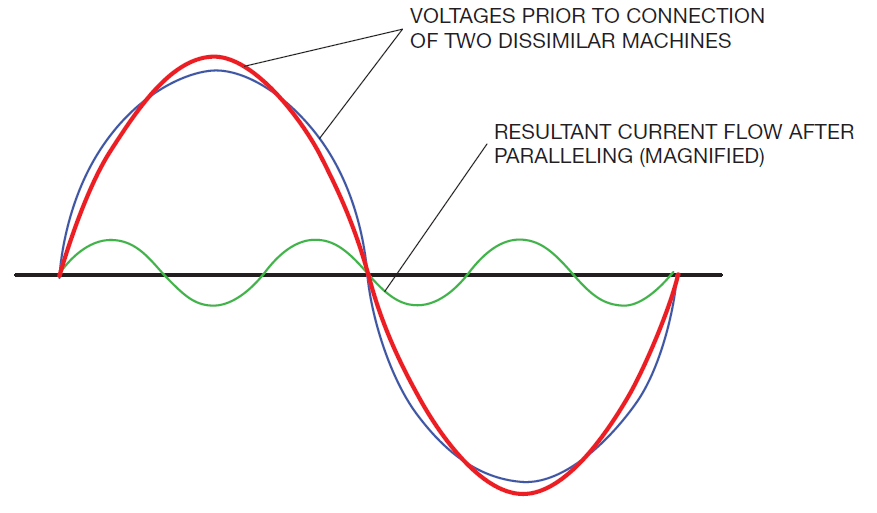
In this figure, two voltage waveforms (the red and blue lines) are superimposed upon each other. Note that these voltage waveforms may be exactly the same RMS voltage magnitude, but at different points in time the blue voltage is higher than the red, and vice versa. When the machines are connected together on a common bus, the differences in voltage result in current flow between the machines, which is represented by the green line. Note that in this simple example the magnitude of the current shown is exaggerated, again to more clearly illustrate the phenomenon. Note also that because the blue and red voltage lines cross each other three times in each half cycle, the current magnitude generated is a third-order harmonic current.

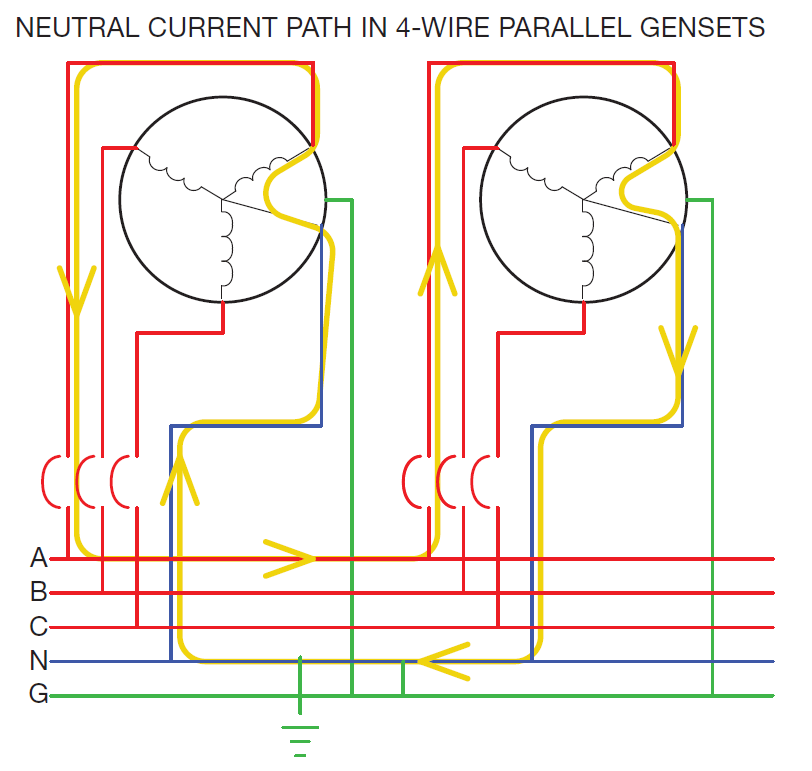
So, at any point in the cycle where there is a voltage difference between the machines prior to paralleling, current will flow between the machines. This is referred to as circulating neutral current and is apparent when there is a path through the neutral of the system in which the current can flow.

Figure 4 – A four-wire system.

The impact of incompatibility can be clearly seen with proper measuring devices, and is often visible with conventional AC current metering. The system will be most apparent by displaying current flowing from each generator with no load on the system.

If neutral current is flowing at higher than 60 Hz (particularly 150 Hz in a 50 Hz system and 180 Hz in a 60 Hz system) with no load or a linear load applied to the system, alternator design differences are indicated. Neutral current flow of 60 or 50 Hz is caused by misadjustment of the voltage or reactive load sharing system of the generator sets in the system. (This is termed a “cross-current” condition.)

This circulating current caused by alternator pitch differences is not adjustable by manipulation of crosscurrent compensation or other devices. Due to the difference in voltage waveform shape of the different alternators, circulating current is inherent in the system. The circulating current may or may not be damaging to the alternators, depending on the magnitude of the current, the ratings of the generators in the system and the susceptibility of protective devices in the system to harmonic currents. Because the harmonic content of a generator waveform varies with the load, the negative effects of operating with dissimilar generators may be more apparent at some load levels than at others, but typically the major concern will be the magnitude of current flow at rated load, because that is the point at which the internal temperature of the alternator will typically be highest and is most susceptible to failure.

A system designer can make simplifying assumptions to reduce this problem to a manageable level. Because harmonics higher than the third order in 2/3 pitch machines are not normally present at a level high enough to be damaging, the designer will typically consider only the third-order harmonic voltages. These are completely eliminated by using generators with 2/3 pitch winding design.

A 2/3 pitch is not required for successful parallel operation of generators. Other pitches may be used (and used in conjunction with 2/3 pitch machines), but their use may limit future system expansion flexibility or require other system measures to limit neutral current flow.

Compensating for dissimilar alternators in a system design

When faced with a requirement to parallel dissimilar generators, a system designer has several options to avoid problems associated with generator incompatibility:

  • If possible, require that new or replacement alternator equipment be identical to existing equipment.

This may or may not be practical depending on the voltage harmonics produced by the alternators in the existing system, especially if the machines are of significantly different kVA ratings. In machines other than 2/3 pitch arrangements, the fact that the machines are the same pitch may not be enough to eliminate problems, because differences in third order harmonics could still cause significant neutral current flow. Where this is practical, it is probably the best solution. While this may sound like an extreme suggestion, it should be recognized that the alternator on a generator set represents only about 10% of the total factory cost of the machine, and that alternators do age over time regardless of their limited use in standby applications. It is prudent to replace an alternator when it is more than 25 years old as part of a paralleling upgrade in a system.

*Note that distribution systems typically require bonding (a neutral-to-ground/earth) connection, but sources themselves are not required to be “grounded.” So, a service to loads is typically bonded at the service entrance to a facility, but the source itself is not required to be bonded unless it is separately derived (i.e., the neutral of the generator source is not ever connected to the utility source neutral). When the generator system is separately derived the system should be bonded at the switchgear bus.

Figure 5 – A three-wire system.
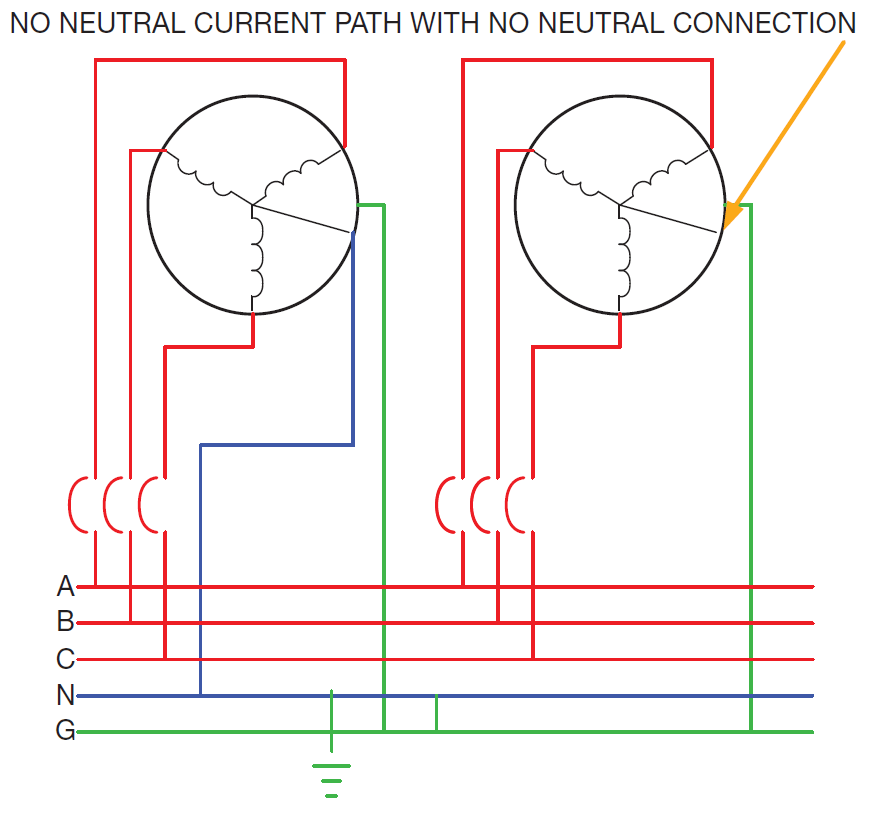
  • Use a three-wire distribution system. By avoiding a solid neutral connection between the genset bus and the loads, the designer is free to let the neutral of the dissimilar machines in a system float,* so that the most common cause of harmonic problems is minimized by removing the path on which the most disruptive current can flow. (The harmonic currents will still cause heating in the machines, but the disruptive effect of current flow in the neutral is eliminated.) In these systems, loads that require a neutral connection will be required to be served by a delta/wye transformer to develop the required neutral connection. The designer should carefully specify the neutral grounding design and monitor the installation in these systems, because an errant neutral-to-ground bonding will result in neutral current flowing through the grounding (earthing) conductors in the system, which represents a potential hazard for electric shock and for fire due to overheating of conductors. Downstream transformers can be used to provide four-wire service to loads that require it.
  • Connect neutrals of like-pitch machines only. Note that line voltage systems (those operating at less than 1000VAC) are usually required to have a neutral-to-ground connection. In a parallel application the ideal location for this bonding point is in the system switchgear, so that there is only one neutral bond for the system. Consideration must be given to the magnitude of loads requiring the neutral connection versus loads that can operate only on the three phases. System loads will naturally balance out as long as there is sufficient line to-neutral capacity in the system.
Figure 6 – Neutral contactors.
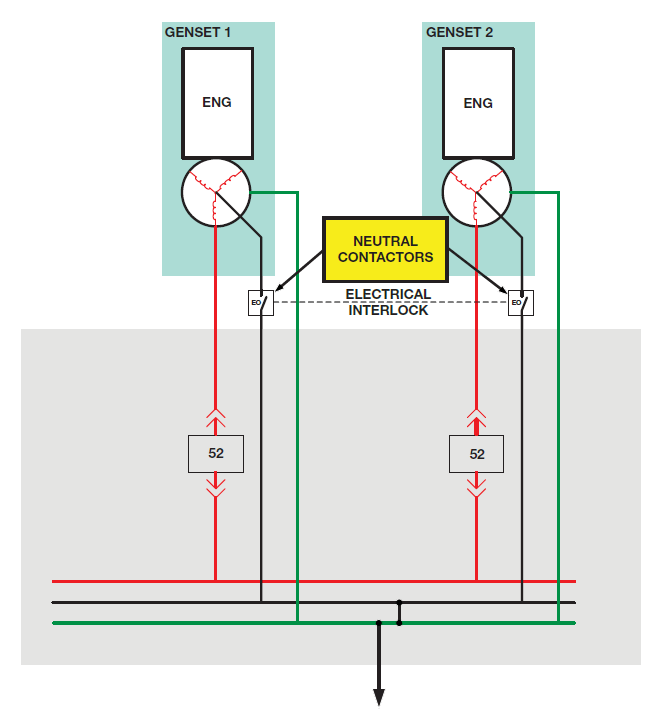
  • Add neutral contactors in the link between the gensets and switchgear neutral bus to connect the neutral only on the first unit to close to the bus. This has a similar impact to the previous recommendation, but allows any machine to be the first connected to the system. In this design it is particularly critical for the failure modes of the neutral contactors to be considered. Alarms should be raised by failure of a neutral closure to operate correctly in either opening or closing mode. Dual neutral contactor position indicating contacts (one “a” and one “b” from different switches) should be used to be more certain of the state of the neutral contactor.
  • Install reactors in the neutral leg of each generator to limit current flow at third- and higher order frequencies. Reactors can be tuned to specific frequencies that are the biggest problems, but typically they are designed for 150/180 Hz, as this is the most problematic harmonic. The major issue in the use of reactors is their cost, and the custom nature of their design, making them problematic to acquire and install quickly. Also, the failure of the reactor may go undetected for a long time, resulting in a change in the effecting bonding arrangement of the system and potential unexpected hazards. Compensate for the incompatibility by oversizing the neutral conductor and derating the alternators.
Derating factors for alternators exposed to harmonic neutral current

In 4-wire generator installations that use dissimilar generators, generator neutral current should be measured to verify that operation of the generators in parallel will not result in system operation problems or premature generator failure. If there are no other related problems in the system, the designer may allow system operation with the neutral current and compensate by derating the alternator.

The derating factors can be calculated as follows:
Maximum allowable load on alternator (KVA) = IR /[(IR2 + IN2)1/2(KVAgen)]
where:
IR = output current of the generator set at full load and rated power factor
IN = neutral current of the generator set at full balanced load, paralleled
KVAgen = alternator rated KVA at maximum temperature rise

Note that the alternator itself generates some harmonic voltages, and load devices also can cause harmonic voltage distortion by drawing non-linear load current from the alternator.

As noted previously, load devices can also affect generator system voltage waveform quality. It is not uncommon to have very high levels of current distortion in load devices. The only way to compensate for this distortion is to provide relatively large alternators in the system, so that the system can duplicate the capabilities of a utility service. With modern facilities, system operational problems should not appear if the overall total harmonic distortion of the voltage waveform with loads running on the generator set is not more than 10–15%.

Conclusions

Alternators are compatible if they have compatible voltage waveform shapes. To assure the optimal compatibility between current and potential future machines, always specify the use of 2/3 pitch alternators for line voltage applications.

When faced with paralleling dissimilar machines, some of which are not 2/3 pitch, the most desirable practice is to replace the dissimilar alternator(s) with a compatible alternator, so that all the machines are 2/3 pitch.


About the author

Gary Olson

Gary Olson graduated from Iowa Staten University with a BS in mechanical engineering in 1977, and graduated from the College of St. Thomas with an MBA in 1982. He has been employed by Cummins Power Generation for more than 25 years in various engineering and management roles. His current responsibilities include research relating to on-site power applications, technical product support for on-site power system equipment, and contributing to codes and standards groups. He also manages an engineering group dedicated to the design and development of next-generation power systems.

Power Topic #9016 – White Paper

Technical Paper: Semiconductor Equipment Voltage Sag Immunity Improvements

This Technical Paper Written by: Mark Stephens, P.E. Engineering Manager, EPRI PEAC Corporation, Semiconductor & Industrial PQ Group, EPRI PEAC Corporation, 942 Corridor Park Boulevard Knoxville, Tennessee 37932, Phone: (865)-218-8022, Fax: (865)-218-8001 mstephens@epri-peac.com, http://www.f47testing.com, June 13th, 2002


Introduction

The end of the report read…
“…Imagine a time in the not so distant future when the industry has embraced the proposed SEMI tool voltage sag immunity standard. As the lights blink in semiconductor manufacturing facility, the production tools will sail through the voltage sag without interruption. Realizing the enormous payback of the Task 24 effort, the semiconductor industry will save hundreds of millions of dollars every year in scrapped wafers and process downtime. If the proposed SEMI 2844 (later passed by as SEMI F47) standard is fervently adopted by this industry, the great chasm between today’s reality of overly sensitive tools and tomorrow’s dreams of system compatibility will be filled…”

Looking back on when I wrote this in February 1999, I still like the way I ended the EPRI Task 24 Report entitled “Power Quality in the Semiconductor Industry”. Maybe it was a overly dramatic, but it seemed to sum up what could happen if draft SEMI 2844 standard were passed by SEMI. In July of 1999, the dreams of those of us who had worked so hard on semiconductor power quality issues came to fruition – SEMI 2844 was passed at SEMICON West. SEMI issued the standard in September 1999 as “SEMI F47-0999: Provisional Specification for Semiconductor Processing Equipment Voltage Sag Immunity”. The first industry specific power quality standard was born. The standard was re-issued in February 2000 with minor modifications and the removal of the word “Provisional”. Developed in conjunction was a test methodology document entitled “SEMI F42: Test Methodology for Semiconductor Equipment Voltage Sag Immunity”. Originally based on EPRI PEAC’s own test plans, many contributed to the final revision of this document as well. There is no doubt that the passage of these two standards represents a major milestone for EPRI and for the power quality community. So, two years after the final versions of these standard were issued, is semiconductor equipment any more immune to voltage sags? To answer this, one must understand the basics of the standard, look at immunity results before the standard was implemented, and review the status of compliance now.

SEMI F47 Review

The SEMI F47 Specification for Semiconductor Processing Equipment Voltage Sag Immunity document defines the threshold that a semiconductor tool must operate without interruption (per SEMI E10) and it also provides a target for the facility and utility systems. Recognizing semiconductor factories require high levels of power quality due to the sensitivity of equipment and process controls and that recognizing semiconductor factories require high levels of power quality due to the sensitivity of equipment and process controls and that semiconductor processing equipment is especially vulnerable to voltage sags, SEMI F47 defines the voltage sag ride-through capability required for semiconductor processing, metrology, and automated test equipment.

The SEMI F47 document specifies the minimum voltage sag ride-through capability design requirements for equipment used in the semiconductor industry. The expected equipment performance capability is shown graphically on a chart representing voltage sag duration and percent deviation of equipment nominal voltage. The primary focus for this specification is semiconductor-processing equipment including but not limited to the following tool types:

  • Etch equipment (Dry & Wet)
  • Film deposition equipment (CVD & PVD)
  • Thermal equipment
  • Surface prep and clean
  • Photolithography equipment (Stepper & Tracks)
  • Chemical Mechanical Polishing equipment
  • Ion Implant equipment
  • Metrology equipment
  • Automated test equipment

The actual SEMI F47 ride-through curve is shown below

Figure 1 Required Semiconductor Equipment Voltage Sag Ride-Through Capability Curve [1]

The specification states that Semiconductor processing, metrology, and automated test equipment must be designed and built to conform to the voltage sag ride-through capability per the defined curve. Equipment must continue to operate without interrupt (per SEMI E10 – Standard for Definition and Measurement of Equipment Reliability, Availability, and Maintainability ) during single and two-phase voltage sag conditions identified in the area above the defined line. In the context of SEMI E-10, interrupt means any assist or failure. An assist is defined as an unplanned interruption that occurs during an equipment cycle where all three of the following conditions apply:

  • The interrupted equipment cycle is resumed through external intervention (e.g., by an operator or user, either human or host computer).
  • There is no replacement of a part, other than specified consumables.
  • There is no further variation from specification of equipment operation.

Furthermore, a failure is any unplanned interruption or variance from the specifications of equipment operation other than assists. Although no variation in the tool’s process is the goal, this standard addresses these issues as related to the equipment operation only.

Pre-SEMI F47 Voltage Sag Immunity Issues

In order to initially characterize semiconductor tools to determine their sensitivity to voltage sags, EPRI PEAC’s custom engineering portable sag generator was used. Tests were conducted in semiconductor manufacturer clean rooms, at the tool supplier’s facility, or at the Power Quality Test Facility (PQTF), located in Knoxville, Tennessee. In all, 33 semiconductor tools were tested plus additional tests on tool subsystems such as robots, vacuum pumps and temperature control units [2]. The breakout of the technological generation of the tools that were tested is best indicated by the wafer size that is processed. In general, the larger the diameter of the wafer, the newer the technology. As shown in Table 1, the Task 24 efforts led to the testing of four generations of semiconductor tools technologies.

Table 1 Breakout of Semiconductor Tools tested by wafer size in Task 24 Project

As shown in figure 2, more tests were done on etcher tools than any other type of equipment. Although most all tool types tested exhibited susceptibility to voltage sags, the extensive number of tests done on etcher tools is a direct indication of their problematic nature during voltage sag events.

Figure 2 Breakout of Semiconductor Equipment tested by Type In Task 24 Project

Using portable voltage sag test equipment developed by EPRI PEAC, the semiconductor tools were thoroughly characterized to understand their voltage sag susceptibilities. When examining the common “weak-links” found in semiconductor tools, many of the same mechanisms are responsible for across the board tool immunity problems. Table 3 displays the most common reasons for the shutdown of the tools that were tested and the percentage of the time that the particular “weak-link” was found to be a problem when the tool shutdown.

Table 3 Most Common Reasons for Voltage Sag Related Tool Shutdown for the First 33 Tools That Were Been Evaluated

A brief analysis of the power quality issues associated with each of these top six immunity issues follows.

Ranked #1 – Emergency Machine Off (EMO) circuits. Comprised of a pilot relay and a main contactor, the EMO circuit is typically the most vulnerable part of a semiconductor tool in relation to the overall equipment voltage sag immunity. As shown in Table 3 the EMO circuit was found to be the shutdown mechanism 47 percent of the tests that were conducted. The EMO circuit is used to power up the tool through the main contactor. Typically driven by the smaller EMO pilot relay, the main contactor is used to apply power to the overall semiconductor tool. If either the EMO relay or main contactor are susceptible to voltage sags, the entire tool will shut down as a result. In the most sensitive circuits a small general-purpose clear plastic case relay (a.k.a “ice cube”) is used for the EMO relay. Research shows that sags as minor as 78 percent of nominal, lasting less than one-cycle in duration can shutdown an entire tool when these sensitive components are present. In contrast, other EMO circuits have been found to ride through voltage sags that are less than 50 percent of nominal voltage when robust relays and contactors are utilized in the design.

Figure 3 Typical Emergency Off Circuit (Simplified)

Ranked #2 – DC Power Supply Response. The second most common reason for tool susceptibility to voltage sags hinges on the lack of stored energy and/or the control scheme of DC power supplies. DC Power supplies used on semiconductor tools range from single-phase DC linear and switch-mode designs used to power user interface PCs, tool controllers, and instrument I/O applications. The voltage sag ride-through of most power supplies designed for these applications is directly related to the amount of stored energy and power requirement of the load. If one of these power supplies exhibits poor voltage sag ride-through, upsizing of the unit or utilizing one that can accept wide input voltage ranges can provide additional robustness.

Ranked #3 – 3-Phase Power Supplies. Semiconductor tools use a variety of 3-phase power supplies for high-voltage DC, microwave, and RF applications. In order to suppress arcing in the process chamber, many of these units are designed with little stored energy. For this reason some of these devices will shutdown when subjected to voltage sags. However, research has demonstrated that some of these units can continue to operate through the voltage sag event even though the output voltage may vary. Working closely with manufactures of these supplies, EPRI PEAC has learned that feasible changes can be made to make these units more robust.

Ranked #4 – Vacuum Pumps. Vacuum pumps are integral in the support of process chamber operations in many types of semiconductor tools. Closely coupled to the tool controller and EMO circuit operations, the entire tool is likely to shut down when the vacuum pump system is affected by a voltage sag event. In one test case, a chattering EMO contactor from the main AC box was found to cause the vacuum pump system shut down , leading to an interruption in the tool operation. However, most of the vacuum pump related voltage sag immunity issues were found to originate from the vacuum pump package control circuit. Often, the vacuum pump control circuits utilize several AC powered “ice cube” general purpose relays. In fact, one manufacturer utilizes twenty-seven such “weak” relays in their control scheme, fifteen of which directly interfaced with the tool controller.

Figure 5 General Purpose AC powered “Ice-Cube” Relay is a Common weak link component in Vacuum Pump Control and tool EMO Circuits

Ranked #5 – Turbo Pumps. Typically powered from a single-phase source voltage, turbo pumps use magnetic-bearing technology to levitate the rotor on a magnetic field during highspeed turbine operation. The turbine turns at speeds up to 35,000 RPM. Previous generations of turbo molecular pumps used an AC motor and variable-frequency drive arrangement. To keep the rotor from crashing into the assembly during a power outage, a battery is used to keep the magnetic bearings energized until the rotor spun down. With a properly maintained battery the turbo-pump controller will survive outages lasting up to 2 seconds. If periodic battery replacement is not performed, the pump could be damaged during a power failure. During the voltage sag testing of etcher tools, EPRI PEAC witnessed poor ride-through in installed vacuum pump controllers due to improper battery pack maintenance. The newer generation of turbo molecular pumps, employ a DC motor and drive technology. A pulsed DC signal is used to rotate the field of a permanent-magnet motor. The kinetic inertia of the rotor acts as a motor generator to power the magnetic bearing levitation circuit until the rotor has come to a stop, thus eliminating the need for a battery.

Ranked # 6 – AC Inverter Drives. AC inverter drives, often referred to as Adjustable Speed Drives (ASDs) are used in semiconductor tools range in sizes from fractional to about 10 horsepower. These ASDs are typically employed in blower applications to keep air circulating in high temperature processes applications. Most ASDs that are used for semiconductor tools allow the user to tune a set of parameters that govern the operation of the unit. Two common features are called Flying Restart and Kinetic Buffering. With these parameters enabled, many drives are able to ride-through voltage sags without the motor speed dropping significantly. The restart algorithm that determines the motor speed at which the ASD restarts varies from manufacturer to manufacturer. Some manufacturers have more efficient algorithms than others. Thus, one ASD model may afford smoother restarting than another. Figure 6 shows the motor speed during the shutdown and restart of two different ASD models (Model A and Model B) for a constant torque load. In both cases, motor speed slowed during the shutdown. However, the speed change of the motor connected to Model A was minimal, whereas the speed change of motor connected to Model B was significant. Before a semiconductor tool vendor purchases an ASD for a tool application, the user should consult with the ASD manufacturer to determine restart characteristics.

Figure 6 Motor Speed and Current During a Five-cycle Voltage Sag (Ride Through parameters enabled, Left: Model A, Right: Model B)
Post SEMI F47 Progress

Since January 1999, EPRI PEAC has continued to conduct voltage sag testing on Semiconductor tools. As of April 2002, EPRI PEAC has completed SEMI F47 tests on over 51 semiconductor tools, 14 subsystems, and over one hundred components. Furthermore, Semiconductor manufacturers have commissioned EPRI PEAC to perform audits of over 131 installed tools. This work has occurred in the United States, Asia, and Europe. In addition, other testing firms have entered the market to provide similar products and services. Based on this level activity, the SEMI F47 standard is being used as the yardstick in which to measure voltage sag performance.

In contrast to the utility funded tests conducted as a part of EPRI’s original Task 24 project, tool manufactures, wafer manufacturers, or component suppliers have funded the Post Task 24 tests. EPRI PEAC’s breakout of the total tools tested by type and wafer size is shown in Figures 7 and 8.

Figure 7 Breakout of Total Semiconductor Equipment tested by EPRI PEAC Corporation (By Type)
Figure 8 Breakout of Total Semiconductor Equipment tested by EPRI PEAC Corporation (By Wafer Size)

In order to better understand how well semiconductor equipment manufacturers are doing in their compliance efforts, Table 4 has been compiled. The table lists EPRI PEAC’s test number, the type of tool, whether SEMI F47 compliance was achieved, how it was achieved, and if the solution was designed in-house.

Table 4 Compliance History for Tools Evaluated by EPRI PEAC Following the Implementation of the SEMI F47 Standard

Table 4 Compliance History for Tools Evaluated by EPRI PEAC Following the Implementation of the SEMI F47 Standard

Key:

  1. 3-5kVA UPS on EMO and Sensitive Controls
  2. Embedded Solutions – Robust AC Contactors and Relays or DC Powered Units
  3. Batteryless Ride-Through Device on EMO circuit
  4. Batteryless Ride-Through Device on Tool Vacuum Pump Control circuit
  5. Batteryless Ride-Through Device on Tool Controller(s)
  6. Firmware Upgrade on Drive
  7. Robust Power Supplies

Several key statistics are of interest from Table 4:

1.The Percentage of Tool Manufacturers That Designed Their Compliance Solution without assistance was 20%. This indicates that tool manufactures still require help in understanding the requirements of SEMI F47 and designing their tools to meet the standard. EPRI PEAC is actively involved in working with tool suppliers in the design stage or to correct the problem during the compliance test

2.The Percentage of Tools Tested that were able to Pass SEMI F47 was 70%. This number is encouraging in that the majority of tool suppliers are able to meet the standard. None of the units that were certified utilized a power conditioner on the entire tool. Instead, a targeted approach with small single-phase power conditioners, embedded robust components, and/or firmware upgrades was utilized. In fact, roughly one-third of the tools that received SEMI F47 certification did so without any power conditioning.

3.Of those who were able to pass the test, 36% required a second round of testing of the modified tool design in order to achieve compliance. Since the SEMI F47 tests naturally uncovers areas of the tool that are vulnerable to voltage sags, the tool engineers and the power quality testing firm are often required to work together to develop a solution that can be evaluated at a later date. In many cases, the tool availability time can dictate whether further tests can be conducted at a given date.

4.About 3 in 8 (36%) of the tools that EPRI PEAC has certified to meet SEMI F47 have utilized a 3-5kVA UPS scheme. There is no doubt that the small UPS approach is not the most favored approach by the semiconductor manufacturers or the intention of the SEMI F47 standard. Section 1.3 of the SEMI F47 standard is explicit in this statement….

“It is the intent of this standard to provide specifications for semiconductor processing equipment that will lead to improved selection criteria for sub-components and improvements in equipment systems design. While it is recognized that in certain extreme cases or for specific functions battery storage devices may be appropriate, it is not the intent of this standard to increase the size or use of battery storage devices provided with equipment. Focus on improvements in equipment component and system design should lead to a reduction or elimination in the use of battery storage devices to achieve equipment reliability during volt-age sag events.”

In order to meet SEMI F47, a battery-based UPS is not required. Therefore, more work is needed to familiarize tool suppliers with the use of batteryless storage technologies. In fact, only one-in-four of the tools certified to meet SEMI F47 used batteryless ridethrough devices. Some manufactures still opt for a small UPS (500VA) for the tool workstation to keep from locking up or crashing the operating system in the event of a sever voltage sag or outage. Until technologies such as the Supercap or Ultracap are cheaply and readily available in a commercial UPS product, small battery based UPS systems are still likely to be used on the workstations.

5.The typical cost of the solution hardware required to make the tools that passed SEMI F47 compliant is $5,000 or less. This cost does not include the costs of engineering, compliance testing, consulting, and other associated costs. The solution usually involves either utilizing a power conditioner on the tools’ sensitive control circuits or replacing sensitive control elements with units that are certified to meet the standard.

SEMI F47 Compliance Strategies

The recommended strategies for achieving compliance presented here build on those that were recommended based on the findings from the Task 24 final report and conveyed by EPRI PEAC and other co-authors in a SEMATECH document entitled “Guide for the Design of Semiconductor Equipment to Meet Voltage Sag Immunity Standards”. The basic approach is to harden the small “weak-link” components to survive SEMI F47 voltage sag events. Effective strategies for improving a semiconductor tool’s voltage sag immunity and help the system meet SEMI F47 are:

  • Use “Selective Power Conditioners” on susceptible loads
  • Embed the Solution through proper design and component selection strategies
  • Utilize a combination of both strategies [3].
Selective Power Conditioning

The use of selective power conditioning can lead to a great improvement in the overall tool’s robustness to voltage sags. The idea of this approach is to prop up the single phase powered “weak links” in the tool. The premise of this approach is that all equipment power users are not ultra-sensitive to voltage sags and thus do not need to be placed on conditioned power. The loads that are typically fed by selective power conditioning devices are single-phase devices with voltage requirements from 100Vac to 230Vac. Some of the most common selective power conditioning devices are shown in Figure 9.

Figure 9 Common Selective Power Conditioning Devices

The following is a discussion of the most common devices used for selective mitigation. Other products are available but are not discussed here due to the required brevity.

1.The Voltage Dip Proofing Inverter (DPI). The DPI falls into a class of device referred to as batteryless ride-through devices (BRTD). Since the DPI operates only when the voltage sag is detected (off-line technology) it only needs to be sized for the nominal load. The device basically continually rectifies incoming AC voltage to charge the DC bus capacitors. When a voltage sag is detected that drops below an adjustable threshold, the line to the incoming power to the device is opened and the DPI supplies a square-wave output to the load for about 1 to 3 seconds. Care should be taken when applying this solution in that not all loads are compatible with a square-wave output produced by the DPI. The same basic advice is also given when utilizing small UPS systems that produce a square-wave output. The amount of time that the load will be supplied can be calculated based on the real power and the energy storage of the particular DPI.

2.Constant Voltage Transformer (CVT). The CVT (a.k.a. ferroresonant transformer) is a ferroresonant transformer is a device that maintains two separate magnetic paths with limited coupling between them. The output contains a parallel resonant tank circuit and draws power from the primary to replace power delivered to the load. The transformer is designed so that the resonant path is in saturation while the other is not. As a result, a further change in the primary voltage will not translate into changes in the saturated secondary voltage, and voltage regulation results. These devices will allow for much better voltage sag ride-through if they are sized to at least two and a half the nominal VA requirement. Oversized in this manner, CVTs can supply a 100 percent of nominal voltage when the input voltage has dropped to as low as 40 percent of nominal.

3.The Uniterruptible Power Supply (UPS). The UPS can come in three basic types: Standby, Line-interactive, and Rectifier/Charger. The Standby UPS switches to a battery and provides an inverter output to the load once the voltage sag is detected. If the transfer is fast enough (< 1 cycle) and is in phase with the incoming voltage, typical control components are not likely to be affected by the sag event. Careful section of the this type of UPS is required in order to guarantee that sensitive control loads will not drop out before the unit switches to the inverter. The Line-Interactive UPS is an on-line type that employs a regulating transformer (CVT) when the incoming voltage is nominal. When a voltage sag is sensed, the unit then switches to the inverter to power the load. High inrush loads must be taken into account when using this unit since the CVT output can collapse from overloading. The Rectifier/Charger UPS is also an on On-line unit. The unit constantly rectifies the incoming AC line voltage. The resulting DC voltage is then used to charge the batteries and to feed the inverter circuit for the units output section. In the event of a voltage sag or outage, the unit switches to the battery for the source of the inverter’s power.

Ultimately, the determination of whether to use a UPS or some other voltage conditioning device depends on whether the load requires power during a brief outage and the end user’s willingness to perform periodic maintenance on the unit’s batteries.

4.The Dynamic Sag Corrector (DySC). The DySC system is a BRTD that corrects voltage sags down to 50 percent of nominal, supplying a sine-wave output. By drawing additional current from the input line (voltage sags above 50%) or from internal storage caps (voltage sags below 50%) the DySC maintains the output to the load. The smaller single-phase versions of this product are called the “MiniDysc” while the larger three-phase units are called “Pro DySC”. This product was developed in tandem with the SEMI F47 standard and is targeted specifically toward the semiconductor industry.

5.Coil Hold-In Devices. Coil hold-in devices are also BRTD that are designed to prop up individual relay and contactor loads . Two brands found on the market are the KnowTrip and the Coil Lock, neither of which are UL listed. These units are designed to mitigate the effects of voltage sags on individual relays and contactors. Typically, the coil hold in device is connected in line with the incoming control signal for the relay or contactor. Available for coil voltages of 120Vac, 230Vac, and 480Vac, the best application for this device is to prop up relays and contactors that are in an EMO, master control relay, or motor control center circuits. Costing less than eighty dollars, these units are very economical to support contactors and relays. Typical coil hold-in devices allow a relay or contactor to remain engaged until the voltage drops to around twenty-five percent of nominal. The unit installs between the relay or contactor coil connection terminals and the incoming AC control line.

A comparison on the Selective Power Conditioners discussed is shown in Table 5.

Table 5 Selective Power Conditioning Equipment Comparison

Embedded Solutions

In general, these solutions involve fixing the individual “weak links” components of a tool in order to increase the overall ride-through of the entire system. Embedded solutions are attractive since they in theory do not require add on power conditioning equipment, but instead involve using more robust or improved components in the tool design. Furthermore, semiconductor tool suppliers are more comfortable with this approach since it does not require the addition of unfamiliar technologies. The following guidelines for embedded solutions to meet SEMI F47 are discussed below:

No. 1 – Utilize SEMI F47 Compliant Relays and Contactors. Since SEMI F47 became a standard, control relays, safety relays, contactors, and motor starters have been certified as compliant with the standard.

No. 2 – Wire load devices in a phase-to-phase configuration where possible. This includes EMO transformers, power supplies, PCs and tool controllers. Connected in this manner, a single-phase drop to 50 percent of nominal equate to only 76 percent of nominal phase-to phase. Furthermore, if the load components on the secondary side of the transformer can survive voltage sags to 50 percent of nominal, they will not drop out even if one phase of the primary voltage drops to zero volts.

No. 3 – Avoid mismatched equipment voltages. If the equipment used in the tool design does not match the expected nominal input voltage, the tool will be more susceptible to voltage sags. This can occur when a transformer secondary voltages do not match the rated voltage for the connected equipment or a tool subsystem such as a servo controller or power supply is rated for a higher voltage (i.e. 240Vac equipment is used in a 208Vac). For relays and contactors, a mismatch of 10 percent of voltage equates to an increase in susceptibility by 10 percent. However, in DC power supplies, the energy stored in the internal capacitors can be as much as 18 percent lower when the input voltage is mismatched by a little as 10 percent – directly equating to a reduction in ride-through time.

No. 4 – Use universal input switching power supplies in every location possible, wired phase-to-phase. The universal input type power supply has a voltage range of 85 to 264Vac typically. When connected phase-to-phase in a 208Vac system (See No 2.), the power supply can continue to operate down to 41 percent of nominal. This type of supply should be specified for DC powered EMO circuit, tool DC power supplies, PCs, and tool controllers. Every Universal Input unit tested by EPRI PEAC Corporation has proven fully compliant when connected phase-to-phase.

No. 5 – Consider Circuit Breaker Characteristics. For a tool to be compliant with the SEMI F47 standard, circuit breakers and fuses should be selected to allow for higher inrush currents due to power quality variations within the SEMI F47 voltage sag range. This must be considered for constant power loads such as power supplies and variable frequency drives. Where possible, do not select breakers that have instantaneous trip characteristics.

No. 6 – Avoid the use of AC powered “ice cube” general purpose relays. Instead use a robust AC relay or utilize a DC power supply to power the EMO or control circuit configured as mentioned in guideline No. 4.

No. 7 – Do not use phase monitoring relays in the interlock circuit. These devices will easily trip during a voltage sag and can lead to tool shutdown. Instead utilize these devices to log that a voltage sag or phase problem exists. If the concern is that a motor might run in the wrong direction, interlock only with motor controls.

No. 8 – Utilize a non-volatile memory. This type of back-up technique for tool controllers ensures that the control system will not lose its place in the event of a voltage sag.

No. 9 – Do not overload DC power supplies. Since the amount of voltage sag ride-through time available from a DC power supply is directly related to the loading, DC power supplies should not be running at their maximum capacity. Oversizing by at least two times the expected load will help the power supply to ride-through voltage sags. This is only critical for systems that do not have a universal input front-end.

No. 10 – Use robust inverter drives. When using ac inverter drives in the tool design, specify units that have good voltage sag ride-through. Check with your drive supplier to make sure the drive firmware will support voltage sag ride-through. Flying restart, kinetic buffering, and the ability to have a low DC bus level trip point (50% of nominal is ideal) are essential. Be sure to configure the drive to take advantage of the features.

No. 11 – Consider Subsystem SEMI F47 performance. Make sure you consider your semiconductor tool subsystems during your design stage. If items such as vacuum pumps, cryopumps, or heat exchangers are not compliant to the SEMI F47 standard, the overall tool will not meet the standard as well.

No. 12 – Consider the Software and Control Program Issues. Your tool or system software developers should consider process variable fluctuations during voltage sags. It may essential that the bandwidth for certain process variables be widened or time filter delays be added avoid tripping of the process. The tool software developers should be part of your SEMI F47 compliance effort.

No. 13 – Consolidate Control Power Sources. When designing the layout of your tool control circuits, try to consolidate the control power feed such that they are fed from a common source or breaker where possible. If a small power conditioner is required to make the tool compliant to SEMI F47, this will make the implementation less painful.

No. 14 – Use a targeted voltage conditioning approach. As the last resort, apply only targeted voltage conditioning devices to prop up weak link components on the tool that cannot be retrofitted with comparable robust components.

Conclusion

Since the passage of SEMI F47, a flurry of activity has begun to harden semiconductor processing equipment to the standard. As a result, proactive component and voltage sag mitigation suppliers have stepped forth to have their products certified to the standard and/or integrated into tool solutions. From the perspective of the semiconductor manufacturers, the progress has not been fast enough in that many tools have not yet complied with the standard. Undoubtedly, an economy that has recently experienced a recession has played a major factor in the ability of some tool manufacturers to begin or complete SEMI F47 compliance efforts. However, based on the first two-years of implementation of SEMI F47, progress has been made in developing tools that are more robust to voltage sags. With assistance, tool vendors are beginning to understand the issues surrounding power quality and designing systems with voltage sags in mind. The SEMI F47 standard is a shining example of what an industry specific standard can accomplish. Furthermore, SEMI F47 serves as a testament that efforts in other industries such as food processing, metals, plastics, textiles, petrochemical, and pharmaceuticals should follow.

References

[1] SEMI F47-0200 “Specification for Semiconductor Processing Equipment Voltage Sag Immunity”, SEMI 2000
[2] EPRI Task 24 Final Report: Power Quality in the Semiconductor Industry, February 1999.
[3] “Guide for the Design of Semiconductor Equipment to Meet Voltage Sag Immunity Standards”, International SEMATECH Technology Transfer document 99063760B-TR, 1999.


EPRI PEAC Corporation

EPRI PEAC is the worldwide leader in Power Quality services for the Semiconductor industry – Offering training, compliance testing, design consulting, and on-site plant audits related to the SEMI F-47 Standard “Specification for Semiconductor Process Equipment Voltage Sag Immunity”. EPRI PEAC’s goal is to solve Semiconductor tool voltage sag susceptibilities for our manufacturer and tool supplier clients to enable compliance with the SEMI F47 Standard and maximize process uptime.

In 2000, EPRI PEAC Corporation established the PQ Starsm Program to test and certify manufacturer equipment per established power quality standards. PQ Starsm certification for the SEMI F47 standard (Specification for semiconductor Processing Equipment Voltage Sag Immunity) is available for semiconductor equipment suppliers. EPRI PEAC utilizes the SEMI F42 test standard (Test Method for Semiconductor Processing Equipment Voltage Sag Immunity). With the PQ Star certification, EPRI PEAC Corporation offers a third party verification that the equipment tested meets this important new power quality standard.

http://www.F47testing.com Technical Paper: Semiconductor Equipment Voltage Sag Immunity Improvements

Sags and Swells

Published by Richard P. Bingham, Manager of Technology and Products, Dranetz – BMI, 1000 New Durham Road, Edison, NJ 08818-4019, Phone 732-248-4393, Fax 732-287-8320. February 16, 1998


ABSTRACT

Sags and swells are the most common types of power quality disturbances. Millions of dollars are lost in productivity each year in the United States due to these disturbances. A simple understanding of the causes will allow for effective solutions to mitigating these disturbances in most applications.

DEFINITIONS

The definitions of sags and swells have evolved over the past fifteen years, as have the power quality instruments that measure them. Sags, or dips as they are referred to in the European communities, were initially any reduction in voltage below a user- defined low limit for between one cycle and 2.55 seconds. Swells, originally referred to as surges, were similar to sags, except that the voltage exceeded a user-defined high limit. While various definitions relative to the amplitude and duration are still in use, the IEEE 1159-1995 Recommended Practice on Monitoring Electric Power Quality has defined them as follows:

  • Sag (dip) a decrease to between 0.1 and 0.9 pu in rms voltage or current at the power frequency for durations of 0.5 cycles to 1 minute.
  • Swell – an increase to between 1.1 pu and 1.8 pu in rms voltage or current at the power frequency durations from 0.5 to 1 minute.

A sag is differentiated from an outage or interruption by the amplitude being greater than or equal to 0.1 per unit (of nominal voltage). In addition to the above definitions, the IEEE 1159 document further classifies the duration values into three categories: instantaneous, momentary, and temporary, as illustrated in the following table from Table 4-2.

Categories and Characteristics of Power Systems Electromagnetic Phenomena:

Table 1

The limits and values defined in both the ANSI C84.1-1989 Utility Power Profile and the CBEMA (Computer and Business Equipment Manufacturers Association) curve have both set limits as to the duration and amplitude values that are likely to cause problems with equipment powered by such. The lower the amplitude of a sag or higher the value of a swell, the shorter the duration should be for equipment to ride through the disturbance, as in the following table derived from such. The typical industrial utility power after building line losses is in the range of +6%, -13% from the nominal value.

Table 2

For purposes of consistency with IEEE 1159, the magnitude of the sag is expressed as a percentage of the nominal value. The expression “a sag of 80% of nominal” on a 120 Vrms nominal system refers to a reduction to 96 Vrms. Some publications will refer to the percentage reduction instead, where an 80% sag on a 120Vrms system would be a reduction to 24 Vrms.

Figure 1 shows an example of a sag on a three phase circuit, monitored by PTs with a 120 volt nominal output. The sag initiated on Phase A, and involved Phase B 3 cycles later.

A number of well-known studies have been conducted in the past concerning frequency and extent of power quality disturbances. Two recent studies have been conducted by the Electric Power Research Institute (EPRI) and the National Power Laboratories (NPL) on the distribution and point-of-use levels, respectively. The EPRI sponsored program has used 300 power quality monitoring nodes on the distribution systems of 24 utilities through US, which was undertaken by Electrotek Concepts, Inc. Monitoring units were placed at the distribution substation, at a point near the middle of the feeder, and at a point near the end of the feeder. It has been reported that approximately 42% of the sags observed to date were outside CBEMA limits.

Figure 1

The NPL study was a four year study between 1990 and 1994 of point-of-utilization power quality monitoring at 112 North American locations. Single phase, line-to neutral data was collected at the standard wall receptacle. Monitors were placed for varying lengths of time at the site, depending on the need to determine climatic effects and other correlating factors. Sites included: a climactic and geographic cross section of the US, cross section of major types of utility loads (heavy industry, light industry, office and retail stores, residential, mixed); and, a broad range of building locations, building types, building ages, and population areas.

A 104 Vrms limit for sag, and 127 Vrms limit for a swell was used, as per the ANSI C84.1 1989 limits and CBEMA curve. A quantity of 1057 site months of data was collected, which yielded over 160,000 power disturbances during the monitoring period. Sags were the most prevalent type of events, averaging 27.9 per month, with an average sag amplitude of 99.3 Vrms. The median duration of sag was 0.26 sec, versus a 2.1 sec average, which the result of several long-term sags (beyond the IEEE 1159 duration limit). Figure 2 shows a graph of the distribution by duration of sags below 90 Vrms.

PERCENTAGE OF SAGS OF GIVEN DURATION

Figure 2

The average number of swells per month was less than half of the sags, at 13.9, with an average swell amplitude of 127.8 Vrms. The median duration was 60.0 seconds, with some sites operating for extended durations in an overvoltage condition. The most prevalent occurrence for both sags and swells was during May through August. Figure 3 shows the relative probabilities of sags of varying amplitudes. The data is combined from the NPL study, and a graph in an IEEE paper titled, “Predicting and Preventing Problems Associated with Remote Fault-Clearing Voltage Dips.” Additional graphs of the amplitude and duration distributions of sags and swells can be found in Appendix A.

PROBABILITY OF SAGS OF GIVEN AMPLITUDE

Figure 3
SYMPTOMS

Equipment used in modem industrial plants (process controllers, programmable logic controllers, adjustable speed drives, robotics) is actually becoming more sensitive to voltage sags as the complexity of the equipment increases. The proliferation of microprocessor-based equipment continues in the office environment, industrial plants, and residential homes. As the speed that the circuitry operates at continues to increase (100 MHz clocks are becoming more prevalent), and the voltage supplies decrease (3Vdc logic is also becoming more prevalent), the vulnerability to such disturbances increases. Reduction in ride-through times of power supplies increases the vulnerability of the equipment to sags.

The effects of a sag are often more noticeable than those of a swell. A sag of duration longer than three cycles is often visible in a reduction in the output of lights. Sags often not distinguishable from momentary outages, as the effects to the equipment may be the same. Sensitive equipment, such as computers, may experience intermittent lockups or garbled data. Even relays and contactors in motor starters can be sensitive to voltage sags, resulting in shutdown of a process when the drop out occurs. A wide disparity has been found here, ranging from 20% to 65% sags for over 1000 cycles. For one industrial plant that extruded plastic pipe, voltage sags to 80% of the 480 V nominal line with durations of 40 msec or greater would affect the production line control electronics, resulting in one or more extruder lines being shut down, and several hours of clean up before production could start again.

The effects of a swell can often be more destructive than those of a sag. The overvoltage condition may cause breakdown of components on the power supplies of the equipment, though the effect may be a gradual, accumulative effect. The increase in output from incandescent lighting may be noticeable, if the duration is longer than three cycles.

Various organizations have been testing the susceptibility of various types of equipment to voltage sags and swells. PEAC, PowerCET and various IEEE groups have conducted such studies of the past several years. In a study entitled “Voltage Sags in Industrial Systems” in 1993 [13], it was found that motor contactors and electromechanical relays: would drop out with a sag of 50-70% for greater than 1 cycle. High intensity discharge lamps would require restriking for sags below 80%. The ride-through of adjustable speed drives (ASDs) varied 0.05 to 0.5 seconds, though some were effected by a 90% sag for 3 cycles. The remote I/O units of some programmable logic controllers (PLCs) were found to trip on a reduction to 90% of nominal for just a few cycles.

In a paper entitled “The Impact of Voltage Sags on Industrial Plant Loads” [14], the results were reported of several different models of various types of equipment which were similarly tested. For process controllers, the results were quite varied. Where one would only withstand 70-80% of nominal for greater than 1 cycle, another could withstand 0V at 10 cycles, 35% sag up to 40 cycles, and 75% for 40 cycles and beyond. Like with other equipment, the PLCs tested found some of the newer equipment is more sensitive than older models. A newer model PLC would tolerate a 50-60% sag for 1-20 cycles, while an older model from the same manufacturer would ride through 0 Vrms for up to 10 cycles.

The effect on personal computers to sags is often the loss of any data stored in volatile memory (such as RAM). This problem is not very prevalent in the newer lap-top computers, which often run off of a internal battery, making them more immune to the effect of sags. Destruction of non-volatile memory (such as disk drive media) has also been experienced, particularly in older models, where the read/write head would be susceptible to contact with the media in the event of an uncontrolled shut-down.

A power interruption of 30% voltage sag for several cycles can reset programmable controllers for an assembly line. One glass plant estimates that a five-cycle interruption can cost about $200k. The cost to a major computer center of a 2-second outage was $600k. Following a voltage sag, an auto manufacturer indicated that the restarting of the assembly lines may required clearing the lines of damaged work, restarting boilers, and reprogramming automatic controls, for a typical cost of about $50k per incident. One automaker estimated that the total losses from momentary voltage sag at all its plants runs to about $10M a year. [6]

CAUSES

The causes of sags have been broken into three areas of occurrence: the transmission system (typically above 65kV); distribution systems (65kV to 12 kV); and, point-of utilization (120-480V). Swells are treated under a single category. A common, underlying cause of sags and swells in all three areas is a sudden change of current flow through the source impedance. An understanding of Ohm’s Law and Kirchoff’s Equations, as they relate to real life, non-ideal sources, is necessary to understanding the effects of such. In the case of a sag, the sudden, large increase in the current required from a source will cause a larger voltage to be developed across the source impedance. This will result in a reduction in the voltage, as seen by the load. Likewise with a surge, a sudden reduction in the current flow will cause an increase in voltage in inductive/capacitive impedances, which the load may experience.

Voltage sags have be linked to the most common cause of power-related computer system failure. This was confirmed in a 1976 study in Northern Virginia [1], where there were an average of 40 thunderstorms/year. The effect in high-incidence areas of lightning strikes, such as Florida, is even more pronounced. Table 2 shows the results from that study. Overhead lines had over three times the number of occurrences as underground lines.

CAUSE OF SAGS ON DISTRIBUTION SYSTEM

CAUSE# of OCCURRENCESPERCENTAGE
Wind and lightning3746%
Utility equipment failure810%
Construction or traffic accident810%
Animals56%
Tree limbs11%
Unknown2126%
TOTAL80
Table 3
SAG CAUSES – TRANSMISSION SYSTEMS

The causes of voltage sags on a transmission level system are similar to those on a distribution system. They include the weather (especially lightning), construction accidents, transportation accidents (helicopter or light planes are common culprits), animals or a fault on another part of the system causing “sympathetic” sags. There have been recorded instances of the nesting habits of large birds in the towers resulting in phase-to-ground faults when the insulators were “shorted out” by bird droppings that were made into a conductive path during rain storms.

Lightning is often attributed with being the most common cause of faults on overhead transmission and distribution lines. The fault can occur by lightning directly striking a phase conductor, or by striking a grounded object, such as shield wire or tower, which is called a backflash. A flashover develops from the voltage path across the phase conductors to ground or to another other phase, resulting in flow of fault current.

Transmission-related voltage sags are normally shorter in duration than distribution voltage sags. This is attributed to the fact that the fault clearing mechanisms (the relay/breaker schemes) must react faster, because of the large amount of energy in transmission faults. Total time for fault detection and breaker operation is 3-6 cycles on older systems, with newer breakers having fault clearing times within a cycle.

Another reason for the shorter duration is that transmission systems are looped or networked, versus radial for distribution systems. This means that when a single line trips, the remaining system can still handle the load, including the fault current. However, the larger currents involved can have further reaching effects. The effects of sag to 90% have been found to be experienced up to 700 miles away from the fault, while a sag to 75% have effect up to 300 miles away. [11]

SAG CAUSES – DISTRIBUTION SYSTEMS

Similar to the transmission system causes, weather (lightning, wind, ice), animal contact, contamination of insulators, construction accidents, motor vehicle accidents, falling or contact with tree limbs can result in voltage sags. Such faults may be 3-phase, line-to-line, or single line-to-ground. The 3-phase faults are the most severe, but are relatively unusual. “Single line-to-ground faults on the utility system are the most common cause of voltage sags in an industrial plant”. [9]

Preliminary results from the EPRI study indicate that most important cause of momentary voltage sags is lightning strikes. In the majority of sags, the voltage drops to about 80% of nominal value on the parallel feeders, while the faulted feeder may have a lower sag value, or may result in an outage if the fault cannot be cleared. Distribution system sags tend to cluster around several duration ranges, based on the fault protection schemes: 6-20 cycles (typical distribution fault clearing times, 30-60 cycles (the instantaneous reclosing time for breakers) or 120-600 cycles (the delayed reclosing time for breakers).

A typical distribution substation is show in Figure 4. A fault on the 115KV primary side of the transformer (transmission level) will effect all of the feeders, as the 13.8KV bus voltage will be lowered. A fault on a single feeder will most likely cause an outage to loads on that feeder, as well as sag on the parallel feeders. The closer the fault is to the substation bus, the more of an effect it will have on the parallel feeders.

DISTRIBUTION SUBSTATION LAYOUT – Figure 4

When the breaker opens or the fuse blows, clearing the fault, the system current and bus voltage will return to normal. Distribution breakers typically allow faults to remain longer than transmission breakers and typically reclose slower, in order to allow time for the protective equipments (such as fuses) that are downstream to function. The recloser will open, and then reclose into the fault after about 1-10 seconds (depending on type of recloser scheme), after which time the breaker is either locked out, or the fault has been cleared. Depending on the number of reclosers before lock-out, parallel feeders can experience as many as four voltage sags in succession.

When the fault occurs on a fused branch of a distribution feeder, the fuse blows and customer located on that branch will experience an outage, which will last until which time that the fuse is replaced. If the breaker/reclose operates during the fault, all the customers on that feeder experience an interruption of a duration that depends on the recloser setting.

SAG CAUSES – POINT OF UTILIZATION (LOADS)

In the NPL study, 50% or more of the recorded low/high RMS events were caused by load equipment in the same building. Sudden increases in the current requirement can have the same effect within a facility’s wiring as on a utility distribution system. Voltage sags can be caused by fault conditions within the building, or the start up of large inductive loads, such as motors, that create a temporary in rush current condition. The starting of large horsepower motors that would draw adequate current are typically longer in duration than 30 cycles, and the associated voltage magnitudes are not as low as with a utility fault. The voltage sag condition lasts until the large current demand decreases, or the fault is cleared by a protective device. In the plant, this will typically be a fuse or a plant feeder breaker.

SWELL CAUSES

As discussed previously, swells are less common than voltage sags, but also usually associated with system fault conditions. A swell can occur due to a single line-to ground fault on the system, which can also result in a temporary voltage rise on the unfaulted phases. This is especially true in ungrounded or floating ground delta systems, where the sudden change in ground reference result in a voltage rise on the ungrounded phases. On an ungrounded system, the line-to ground voltages on the ungrounded phases will be 1.73 pu during a fault condition. Close to the substation on a grounded system, there will be no voltage rise on unfaulted phases because the substation transformer is usually connected delta-wye, providing a low impedance path for the fault current.

Swells can also be generated by sudden load decreases. The abrupt interruption of current can generate a large voltage, per the formula: v = L di/dt, where L is the inductance of the line, and di/dt is the change in current flow. Switching on a large capacitor bank can also cause a swell, though it more often causes an oscillatory transient.

MONITORING & TESTING

As with other technology-driven products, the power quality monitoring products have rapidly evolved in the last fifteen years. Increased complexity and performance of VLSI components, particularly microprocessor, digital signal processors, programmable logic, and analog/digital converters, have allowed the manufacturer’s of power quality monitoring instruments to include more performance in the same size package for the same or reduced price.

Different types of monitoring equipment is available, depending on the user’s knowledge base and requirements. The four basic categories of power quality monitors (also known as power line disturbance monitors) are: event indicators, text monitors, solid state recording volt/ammeters, and graphical monitors. While all of these devices can be used to measure/monitor sags and swells, the effectiveness of each depends on what information the user wants to gain. Since sags and swells are relatively slow events (as opposed to microsecond duration transients), the wide variety of instruments are generally capable of capturing a sag or swell with reasonable reliability.

Event indicators are usually on the lower price end of the market. They indicate to the user that a sag or swell has occurred through visual means, such as indicator lights or illuminated bar graphs. Some products will store the worst case amplitudes of such and/or the number of occurrences of the type of event. Most such device do not provide an indication of the time of occurrence or the duration. The voltage limit detectors may be preset or programmable, with the accuracy being in the 2-5% range. Textual-based monitors were actually the first dedicated power quality monitors, produced back in 1976. The function of these instruments is similar to the event indicators, except the output is in alphanumeric format Additional information, such as duration and time-of-occupance is often included. Some of these products allow for the correlation of other information (such as environmental parameters and system status levels) to assist the user in determining the cause of the event.

Solid state recording volt/ammeters have replaced the older pen-and-ink chart recorders as a means of providing a graphical history of an event. These devices typically lack the resolution necessary for monitoring fault-clearing sags. Sampling techniques range from average of several cycles to samples over 2-30 cycles. The averaging over several cycles may mask the sag or swell, as well as result in misleading amplitudes. Sampling over multiple cycles will not properly represent the event either.

Graphical monitors provide the most information about a sag or swell. Most graphical monitors provide a cycle-by-cycle picture of the disturbance, as well as recording minimum/maximum values, duration, and time-of-occurance. The three-phase voltage graphs, coupled with graphs of neutral to ground voltage, phase currents, neutral current (in wye), and ground currents, will usually provide the user with enough information to determine if the fault occurred upstream or downstream. The timing and magnitude information can often identify the source of the fault. For example, if the phase current levels of the load did not change prior to the voltage sag, the fault is more likely upstream. If the magnitude of the sag is down to 20% of nominal, it is likely that the fault was close by. If the sag duration was less than four cycles, it was most likely a transmission system fault. If the swell waveform is preceded by a oscillatory transient, it may be the result of a power factor correction capacitor being switched on. A line-to-neutral voltage sag is often accompanied by a neutral-to-ground voltage swell.

The location of the monitor, power supply wiring, measurement input wiring, and immunization from RFI/EMI is especially critical with the higher performance graphical monitors. The monitor itself must also be capable of riding through the sag and surviving extended duration swells. The functionality of the monitor should be thoroughly evaluated in the laboratory, under simulated disturbances, before placing out in the field. Just because it didn’t record it, does not mean it didn’t happen.

Unless there is significant information pointing to the cause of the disturbance before the monitoring begins, it is common practice to begin at the point of common coupling with the utility service as the initial monitoring point. If the initial monitoring period indicates that the fault occurred on the utility side of the service transformer, then further monitoring would not be necessary until attempting to determine the effectiveness of the solution. If the source of the disturbance is determined to be internal to the facility, the placing multiple monitors on the various feeds within the facility would most likely produce the optimal answer in the shortest time period. Otherwise, the monitor must be moved from circuit to circuit, with particular attention to circuits powering suspected sources, and the circuits of the susceptible devices.

Recent developments in artificial intelligence tools, especially fuzzy logic, have allow software vendors to develop products that allow knowledge and reasoning patterns to be stored in the software program. Further analysis of the event, beyond the IEEE 1159 classifications, is possible. These include the severity of the event, relative to the type of equipment that would be effected, and probability factors on the cause of the disturbance. Multiple, successive sags that return to nominal for an adequate time for the power supply capacitors to recharge may not be as severe as a longer duration sag of a higher amplitude.

SOLUTIONS

The first step in reducing the severity of the system sags is to reduce the number of faults. From the utility side, transmission-line shielding can prevent lighting induced faults. If tower-footing resistance is high, the surge energy from a lightning stroke is not absorbed quickly into the ground. Since high tower-footing resistance is an import factor in causing backflash from static wire to phase wire, steps to reduce such should be taken. The probability of flashover can be reduced by applying surge arresters to divert current to ground.

Tree-trimming programs around distribution lines is becoming more difficult to maintain, with the continual reductions in personnel and financial constraints in the utility companies. While the use of underground lines reduces the weather-related causes, there are additional problems from equipment failures in the underground environment and construction accidents.

The solutions within the facility are varied, depending on the financial risk at stake, the susceptibility levels and the power requirements of the effected device. Depending on the transformer configuration, it may be possible to mitigate the problem with a transformer change. “It is virtually impossible for an SLTG condition on the utility system to cause a voltage sag below 30% at the customer bus, when the customer is supplied through a delta-wye or wye-delta transformer.” [13]

In a IEEE paper on “The Impact of Voltage Sags of Industrial Plant Loads” [14], the following table shows what the transformer secondary voltages would be with SLTG faults. The table shows the tradeoffs on the impact to the phase voltages that occur, based on the wiring configuration of the transformer.

TRANSFORMER SECONDARY VOLTAGES (pu) WITH SLTG FAULTS

Table 4

For wye-wye and delta-delta connections two phase-to-phase voltages will drop to 58% of nominal, while the other phase-to-phase is unaffected. However, for delta-wye and wye delta connections, one phase-to-phase voltage will be as low as 33% of nominal, while the other two voltages will be 88% of nominal. It is the circulating fault current in the delta secondary windings that results in a voltage on each winding.

Another possible solution is through the procurement specification. If a pre-installation site survey is done, the distribution curve and probability of the sags and/or swells can be determined. The user then specifies such information in the equipment procurement specifications. Only equipment with acceptable ride through characteristics would then be used.

When neither of the above solutions are practical or adequate, some form of additional voltage regulator are required to maintain constant output voltage to the effected device, despite the variation in input voltage. Each type has its own disadvantage and advantages for a given application. The utility companies can add dynamic voltage restorers, static condensers, fault current limiters, and/or high-energy surge arresters. Since these are beyond the control of the end user of the electricity, the following concentrates on “in-the facility” solution. These include: ferroresonant transformers, magnetically controlled voltage regulators (3-10 cycle response); electronic tapswitching transformers (1-3 cycles); shielded isolation transformers; static transfer switches (within 4 milliseconds); static UPSs; and, rotary UPSs.

FERRORESONANT TRANSFORMERS

Ferroresonant transformers, also called constant-voltage transformers (CVT), can handle most voltage sags. Ferroresonant transformers can have separate input and output windings, which can provide voltage transformation and common-mode noise isolation as well as voltage regulation. While CVTs provide excellent regulation, they have limited overload capacity and poor efficiency at low loads. At a load of 25% of rating, they require an input of a minimum of 30% of nominal to maintain a +3/-6% output. At 50% load of rating, they typically require 46% of nominal input for regulation, which goes to 71% of nominal input at full load. Therefore, for maximum improvement of voltage sag ride through capability, CVT should be sized about four times greater than the load.

Ferroresonant CVTs are most effective for constant, low power loads, such as personal computers or process controllers. Variable loads present problems because of the tuned circuit on the transformer output. Ferroresonant transformers have a nonlinear response, similar to that of a regular transformer when excited high on its saturation curve.

MAGNETICALLY CONTROLLED VOLTAGE REGULATORS

Magnetic synthesizers use transformers, inductors and capacitors to synthesize 3-phase voltage outputs. Enough energy is stored in the capacitors to ride through one cycle. They use special autotransformers, with buck-boost windings to control the voltage. The effect of the buck-boost windings is varied by a control winding with DC current that affects the saturation of the core. The control-winding current is produced by electronic sensing and control circuits. The response time is relatively slow (3-10 cycles).

TAP SWITCHING TRANSFORMERS

Electronic tap-switching transformers have the high efficient, low impedance, noise isolation, and overload capacity of a transformer. These regulators use solid state switches (thyristors) to change the turns ratio on a tapped coil winding. The switching is controlled by electronic sensing circuits, and can react relatively quickly (1-3 cycle). Thyristor switching at zero voltage is easier and less costly than at zero current, but can cause transient voltages in the system, as the current and voltage are only in phase at unity power factor. Thus, switching at zero-current is preferred. The voltage change is in discrete steps, but the steps can be small enough so as not to induce additional problems.

STATIC UPS

A UPS can provide complete isolation from all power line disturbances, in addition to providing ride-through during an outage. A static UPS consist of a rectifier AC to DC converter, DC bus with a floating battery, DC to AC inverter, and solid state bypass switch. The rectifier converts the raw input power to DC, which keeps the floating battery fully charged and supplies power to the inverter section. The inverters generate 6 or 12 step waves, pulse-width modulated waves, or a combination of the two, to create a synthetic sine-wave output. Inverter output should be a stable, low-distortion sine wave, provided there is adequate filtering in the output stage. The batteries supply the DC bus voltage when the AC voltage is reduced.

There units range from a few hundred VA to 750kVA or higher. Since they are constantly running, there is no switch-over time, except when the bypass switch is activated. The capacity of the battery banks determine the length of ride-through.

ROTARY UPS/MOTOR GENERATORS

Motor generator sets can also provide power conditioning by fully isolating the output power of the generator from disturbances of the input power (except for sustained outages). Various configurations are possible, including single shaft synchronous MG, DC motor driven MG, 3600 rpm induction motor with a flywheel driving a 1800 rpm generator, synchronous MG with an additional DC machine on same shaft, which powers AC generator with AC fails; or, variable speed, constant frequency synchronous MG (varies number of poles so that frequency remains the same. The inertia of an MG set, (especially if supplemented by a flywheel), can ride-through several seconds of input power interruption. Since the generator output can be of different voltage and frequency from the motor input, conversion from 60 Hz to 400 Hz is possible.

NEWER SOLUTIONS

EPRI has been working with PSEG and Westinghouse Electric Corp to develop an active power line conditioner, which will combine active harmonic filtering, line voltage regulation and transient voltage surge protection in a single compact unit. To date, 5KVA, 50KVA and 150KVA units are available.

Several successfully applications of superconductivity magnetic-storage systems have been carried out in the United States. The stored energy that is provided by the batteries in a static UPS, or the inertia of the motor in a MG set, is instead provided by current stored in a superconductive magnetic system. This energy can be quickly coupled back into the system, when the AC input power is inadequate.

BIBLIOGRAPHY

1- Berutti, Al, and R.M.Waggoner, Practical Guide to Quality Power for Sensitive Electronic Equipment, EC&M, Based on Materials originally written by John A. DeDad and editors of EC&M, Intertec Publishing Corp, 1993
2 – Chavousite, David M. , Power Quality Assurance, “Selective Power Conditioning Keeps Plant Operating, July/August 1994, pg 72-75 3 – Conrad, L., K.Little, and C.Grigg, “Predicting and Preventing Problems Associated with Remote Fault-Clearing Voltage Dips”, IEEE Transactions on Industry Applications, Volume 27, pg 167-172, January 1991.
4 – DeDad, John A., EC&M, “Power Quality and electronic equipment protection.. What to Use, When to Use it”, January, 1991, pg 37-46.
5- Dorr, Douglas S. National Power Laboratory Power Quality Study, “Point of Utilization Power Quality Study Results, October 1994.
6 – Douglas, John, EPRI Journal, “Power Quality”, December 1993, pg 8-15. CEE News, March 12, 1994
7 – Dranetz Field Handbook for Power Quality Analysis, Dranetz Technologies, Inc. 1989.
8 -IEEE P1195/D5 Recommended Practice on Monitoring Electric Power Quality, May 2, 1994 revision
9 – IEEE Transactions on Industry Applications, ” Voltage Sags in Industrial Systems”, March/April 1993,
10 – Kreiss, David, PQ Conference October 1994, “Determining the Severity and Cause of VOltage Sags Using Artificaila Intelligence.
11 – Lamoree, Jeff, Electrical World, “How Utility Faults Impact Sensitive Customer Loads”, April 1992, pg 60-63.
12 – Martzloff, Francois D. and Thomas M.Gruz, “Power Quality Site Surveys; Facts, Fiction, and Fallacies, ” IEEE Transactions on Industry Applications, VOl 24, No., 6, November/December 1988.
13 – McGrahaghan, Mark, David R. Mueller, and Marek J. Samothj, IEEE Transactions on Industry Applications, ” Voltage Sags in Industrial Systems”,Vol 29, No2, March/April 1993, pg397-403
14 – Smith, Charles J, Jeff Lamoree, Paul Vinett, Tom Duffy, Mike Klein, “The Impact of Voltage Sags on Industrial Plant Loads”

What is Voltage Drop Study and Analysis

Published by Carelabs, Carelabs is authorized provider of Electrical Installation’s Study, Analysis, Inspection, and Certification services in UAE, and offer voltage drop study and analysis services. Website: carelabz.com


Image: Carelabs – Voltage Drop Study and Analysis

Dynamic voltage (IR) drop, in contrast to the static voltage drop depends on the switching activity of the design, and hence it is vector dependent.

Designing an ideal power grid which is robust across multiple operating scenarios of a chip continues to major challenge. The problem has magnified with technology shrinking allowing more performance to pack in a smaller area, from one node to another.

The power distribution on a chip needs to make sure circuit robustness catering to not only to the average power / current requirements, but also needs to make sure timing or accuracy not affected by Dynamic IR drop, caused by limited power demand and switching patterns.  Further, today’s devices power management techniques like power gating and switch power supplies are measures. In the case of switched power supplies, typically, power switch cells are uniformly distributed across the standard cell logic (logic gates) area of the floor plan.

There may further be sub-divisions in the switched power grid in the form of power domains, depending on the granularity of power gating. These power switches add further dimension to the power distribution problem as they often limit the response of the power grid to dynamic power or electrical needs. While the power distribution can improve easily by increasing the number of power switches, it has an impact on the off mode leakage (Iddq) and hence battery life in handheld applications.

So clearly, it is important to decrease the number of switches used as well as decrease the signal routing resources used on the power grid. Design closure and signoff (timing, IR Drop, EM, reliability etc.) comprehending Dynamic IR drop effects realistically. The factors provide cynicism in Dynamic voltage drop analysis should remove and must make sure the method power coverage of various silicon conditions and design operating scenarios. We then discuss power distribution and power grid planning method, and highlight the various aspects that need to take care of, from the early stages of design implementation. We give some of the systematic power grid enhancements like power automated switch placement and switched supply resistance minimization through DRC-aware power metal fill. All the analysis and results are based on production application of low power application processors for mobile devices.

Static and Dynamic IR Drop

Static IR drop is average voltage drop for the design. While Dynamic IR drop depends on switching activity of the logic, therefore it is vector dependent. Dynamic IR drop depends on the switching time of logic and is less dependent on clock period. This nature illustrated in The Average current depends totally on the time period, while the dynamic IR drop depends on the instantaneous current which is higher while the cell is switching.

Static IR drop is good for closure analysis, in older technology nodes where enough natural decoupling capability from the power network and non-switching logic is available. While Dynamic IR drop measures IR drop caused when large amount of circuitry switch together, causing peak electricity demands. This electrical demand could highly localize and could brief within a single clock cycle (a few hundred PS) and could result in an IR drop that causes further setup or hold-time violations. Usually, high IR drop impact on clock networks causes hold time violations, while IR drop on data path signal nets results setup time violations.

Dynamic Analysis on Power Grid

A normal power grid and power switches designed for regular power. Usually, they designed for appropriate static IR drop objective and not for Dynamic IR drop. In the basic stage of the design, the grid power checks only with the Static IR drop result. This is because of late availability of use case scenarios (Voltage change dump (VCD) files). For the example, the switch and metal grid densities in the notches region can satisfy the static IR drop criteria, because the average power density in this region is not significant.

When an application runs, gap area have higher power density due to limited switching in gap area and the switches combined with metal is not enough to support the electrical density in the gap area. Because of which have very high dynamic IR drop.  Here due to less number of switch cells combined with not so powerful grid is the main reason for high dynamic IR drop. As described by the figure, Switch Voltage drop and MET3 voltage drop are the dominant factors in the overall voltage drop. A similar analogy on the power density can extend to larger region.

Dynamic IR Analysis

Difficulties in analysing the dynamic IR impact on SOCs or complex designs is to get direction for enough scenarios and to get them in time to identify issues before the design tapes out. Our Early Analysis flow addresses this issue. In this flow, the switching activity of a sub IP integrated at the top level and switching activity at the top level created, for use in dynamic IR analysis. With the help of flow analysis, we are able to analyse architectural hot spots for dynamic IR drop, like crossbar collaborating shared memories having great power density.


Source: https://carelabz.com/what-voltage-drop-study-analysis/

How do harmonics increase power losses and overheat transformers?

Published by Mirus International Inc., [2010-01-08] MIRUS-FAQ001-B2, FAQ’s Harmonic Mitigating Transformers, 31 Sun Pac Blvd., Brampton, Ontario, Canada. L6S 5P6.


Harmonics generated by non-linear loads substantially increase the losses in conventional or K-rated delta-wye distribution transformers. This increase in losses will increase operating costs and can shorten transformer life. The main thrust of the K-rated design is not to lower the increased losses caused by harmonics but rather to withstand them without overheating.

Transformer loss components include no load (PNL) and load losses (PLL). The no load losses are transformer core losses. They depend mainly upon the peak flux levels reached in the core so the increase in no load losses due to harmonics is usually negligible. On the other hand, load losses are significantly increased by harmonic currents created by non-linear loads.

Load losses consist primarily of I2R copper losses (PR) and eddy current losses (PEC). Harmonics increase these losses in the following ways:

1.Copper Losses, I2R
Harmonic currents are influenced by a phenomenon known as skin effect. Since they are of higher frequency than the fundamental current they tend to flow primarily along the outer edge of a conductor. This reduces the effective cross sectional area of the conductor and increases its resistance. The higher resistance will lead to higher I2R losses.

2.Eddy Current Losses
Stray electromagnetic fields will induce circulating currents in a transformer’s windings, core and other structural parts. These eddy currents produce losses that increase substantially at the higher harmonic frequencies. The relationship is as follows:

Where:
PEC = Total eddy current losses
PEC-1 = Eddy current losses at full load based on linear loading only.
Ih = rms current (per unit) at harmonic h
h = harmonic #

For linear loads, eddy currents are a fairly small component of the overall load losses (typically about 5%). With non-linear loads however, they become a much more significant component, sometimes increasing by as much as 15x to 20x. A transformer can easily be subjected to losses exceeding its full load rating even though the RMS value of the non-linear load current indicates only partial loading.

Because Harmonic Mitigating Transformers (HMT) cancel certain harmonic fluxes without coupling them to the primary windings, their primary winding currents are lower than those found on conventional transformers having the same level of non-linear load currents on the secondary side. This means that the I2R losses and eddy current losses on the primary of an HMT are considerably reduced compared to those in a conventional transformer.

The conventional and k-rated delta-wye transformers have the same level of 3rd, 5th, 7th, and 9th harmonic currents in their primary windings as in their secondaries. Do not be misled by the low level of triplen harmonics in the feeder conductors to a delta-wye transformer. Checking the delta primary winding itself will show that the same percentage of 3rd and 9th harmonic currents (compared to the fundamental current) are circulating in the delta primary as is present on the wye secondary. This increases the losses and voltage distortion on a delta-wye transformer compared to an HMT.

Checking the primary of an HMT will reveal only residual amounts of 3rd and 9th harmonic current. Even better, checking the primary of a dual output HMT (MIRUS Harmony-2 for example) will show only residual amounts of 3rd, 5th, 7th, and 9th. Hence lower harmonic losses and lower voltage distortion when HMTs are used to feed non-linear loads.

References:

1.Thomas S. Key, Costs and Benefits of Harmonic Current Reduction for Switch-Mode Power Supplies in Commercial Office Building, IEEE Transactions on Industry Applications, Vol. 32, No. 5 Sept/Oct 1996, pp. 1017-1024
2.ANSI/IEEE C57.110-1986, Recommended Practice for Establishing Transformer Capability When Supplying Nonsinusoidal Load Currents, American National Standards Institute


Harmonics and Harmonic Mitigating Transformers (HMT’s) Questions and Answers

This document has been written to provide answers to the more frequently asked questions we have received regarding harmonics and the Harmonic Mitigating Transformer technology used to address them. This information will be of interest to both those experienced in harmonic mitigation techniques and those new to the problem of harmonics. For additional information visit our Website at www.mirusinternational.com.

K-Factor Transformers and Non-linear Loads

Published by

  • Kiran Deshpande & Prof. Rajesh Holmukhe, Dept. of Electrical Engineering, College of Engineering, Bharati Vidyapeeth University, Pune, E-mail: irkin85@hotmail.com
  • Prof. Yogesh Angal, Dept. of Instrumentation Engineering, Dr. D. Y.Patil Institute of Engineering and Technology, Pimpri, Pune: 411 018.

Abstract – Harmonic currents generated by non-linear loads can cause problems in the power systems and particularly the distribution transformers as they are vulnerable to overheating and premature failure. Normally designers recommend an oversized transformer to protect transformer from overheating. K-factor transformers are specifically designed to accommodate harmonic currents. K-transformers are preferred because they have additional thermal capacity of known limits, design features that minimize harmonic current losses, and neutral and terminal connections sized at 200% of normal. K-factor transformers allow operation up to nameplate capacity without derating.

Index Terms – Additional thermal capacity, Derating, Distribution transformers, Harmonic currents, K- Factor, Nameplate capacity, Neutral and Terminal connections, Non-linear loads, Overheating.

I. INTRODUCTION

Today’s modem offices and plants are dominated by nonlinear loads, desktop computers, solid state ballasts, PID lighting, programmable controllers, and variable speed drives to name a few. Due to these electronic loads, significant harmonic loads have been added to the building’s distribution systems. The result is premature failure of the transformer due to overheating. Till recent times, the only solution to this problem was to derate the transformer. This solution is no longer acceptable.

II. A review of Nonlinear Loads

The effect of nonlinear loads on the electrical power systems has become matter of concern since past few years. Nonlinear loads draw currents which are not sinusoidal. They include equipment’s such as solid state motor drives, arc furnaces, battery chargers, UPS systems, and the increasing electronic power supplies. The increased use of these nonlinear loads is the cause of concern as larger percentage of power systems tend to become nonlinear. The nonlinear loads were thought to be matter of concern for industrial power systems where large static power converters were being used. But now larger application of electronics to practically every electrical load, nonlinear loads are present in commercial and even residential power system. Nonlinear loads produce harmonic currents which flow from the load towards the power source following the path of least impedances. Harmonic currents are the currents which have frequencies that are whole number multiples of fundamental frequency. The harmonic currents superimposed on the fundamental currents result in the non-sinusoidal waveform associated with the nonlinear loads. Fig.1 show the voltages and current waveforms for nonlinear loads. It can be seen that voltage waveform is sinusoidal but current waveform is not.

Fig. 1. Voltage and current waveform for nonlinear load.
III. Effects of Harmonic Currents on Power System

Harmonic currents adversely affect every component of the power system. These currents create additional dielectric, thermally, and/or mechanical stresses. Harmonic currents flowing through the power system impedances result in harmonic voltage drops which are observed as harmonic voltage distortion. The voltage distortions could become very severe when the power systems inductive and capacitive impedances become equal, a condition of parallel resonance. This condition could appear at one of the nonlinear load’s significant harmonic current frequencies (typically the 5th, 7th, 11th or 13th harmonic). Harmonic currents can cause losses in normal power components even when resonance conditions do not prevail. Due to skin and proximity effects, wiring experience additional heating. If normal wiring sizing methods are employed, then the derating for wiring for harmonics is minimal and can be ignored.

IV. Methods to Derate Transformer as suggested by ANSI / IEEE Standards.

Harmonic currents cause additional heating in the form of additional winding eddy current losses in transformers. ANSI / IEEE C 57.110 provides methods to derate a transformer for any given load profile. This standard considers the winding eddy current losses to be proportional to the harmonic number required. This relationship has been found to be accurate for lower power frequency harmonics, but result in an overestimation of losses for higher harmonics (generally greater than 11th). A typical derating curve is shown in fig.2. Transformers directly supplying single phase power supplies may require derating of 30% to 40% to avoid overheating. ‘Underwriters Laboratories’ (UL) recognize the potential safety hazards associated with nonlinear loads and developed a rating system to indicate the capability of transformer to handle harmonic loads. The ratings are described in UL-I56I and are known as K-Factors. K-Factors are a weighing of the harmonic load currents according to their effects on transformer heating, as derived from ANSI / IEEE C57.110. A K Factor of 1.0 indicates a linear load (no harmonics). The higher the K-Factor, the greater the effect of harmonic heating [1].

K – Factor = Σ(Ih)2 h2 (1)

Where Ih is the load current at the harmonic h, expressed in a per-unit basis such that the total RMS current equals one ampere, i.e.

Σ(Ih)2 = 1.0 (2)

The problem associated with calculating K- Factor is selecting the range of harmonic frequencies that should be included. Some use up to 15th harmonic, others up to 25th harmonic, and still others include up to 50th harmonic. For the same load, each of these calculations can yield significantly different K-Factors, because even very small current levels associated with higher harmonics, when multiplied by the harmonic number squared, can yield significantly to the K-Factor. Based on the underlying assumptions of C57.II0, it seems reasonable to limit the K-Factor calculation to harmonic currents less than 25th harmonic. Sample calculations are given in Table No.1. In establishing standard transformer K-Factor rating; UL chose ratings of 1, 4, 9, 13, 20, 30, 40 and 50. From a practical viewpoint individual loads with K-Factors greater than 20 are infrequent. At best office areas with some nonlinear loads and large computer rooms normally have observed K-Factors of 4 to 9. Areas with high concentrations of single phase computers and terminals have observed K- Factors of 13 to 17. When multiple nonlinear loads are powered from the same source, lower harmonic current levels may be expected due to phase shifts and cancellations. In one study of commercial buildings, single phase loads with current distortion of 104%, THD (Total Harmonic Distortion) resulted in only a 7% THD at the service entrance, when added with other loads in the building. Additional studies of typical loads are beginning to provide information which could aid in the development of additional rules of thumb to use when direct load measurements are not available. K – Factor transformers are designed to be operated fully loaded with any harmonic load having K-Factor equal to or less than its K-rating. For example, a K-13 transformer can be fully loaded with any harmonic load having a K-Factor up to K-13. If the load has a K-Factor greater than 13, then the transformer cannot be safely operated at full load and would require derating.

Fig. 2. Typical Transformer derating for
Nonlinear loads
V. How do K-Factor Transformers differ from Standard Transformers?

K-Factor transformers have additional thermal capacity to tolerate the heating effects of the harmonic currents. A well designed K-Transformer will also minimize the winding eddy current losses through the use of parallel conductors and other winding techniques. The K factor indicates the multiples of the 60 Hz winding eddy current losses that the transformer can safely dissipate. Transformer load losses consist of winding I2R losses plus stray losses. Using UL best methods, stray losses are assumed to be primarily winding eddy current losses for transformers 300 KVA and smaller.

For example, a transformer having winding I2R losses of2000 watts and 60 Hz stray losses of 1000 watts would, with a K-20 rating, is required to dissipate the 2000 watts of I2R losses plus 20 times the 60 Hz stray losses of 1000 watts for a total load loss of 4000 watts without exceeding the maximum winding temperature rise. The result is a larger, more expensive transformer.

For K-Factor transformers, UL also requires that the neutral terminal and connections to be sized to accommodate twice the rated phase conductor size (double the minimum neutral capacity) of standard transformers.

There are several areas where designs are changed to accommodate the effects of harmonics.

  1. Secondary Windings: The secondary windings, instead of working with a pure sine wave and producing normal values and stray losses have to cope up with non-sinusoidal waveforms containing multiple harmonics, which raise the stray losses significantly. To compensate for these increased losses, a multiple of small, individually insulated conductors are used. Transposition is used wherever necessary.
  2. Neutral: Since harmonic currents are additive in neutral, neutral currents in excess of two times phase currents can be measured. To compensate for this, double sized neutral lugs and lug pads is furnished.
  3. Primary winding: The primary winding has some lower order harmonics circulating within the delta, producing losses and additional heating. This is compensated for by using a heavier conductor.
  4. Core: The core is affected by voltage harmonic distortion. This voltage distortion increases the core flux density, creating higher core loss, higher magnetizing currents, higher audible noise and heating problems. To reduce flux density, alloy induction designed core is used.
VI. About Standard Transformers not marked with K-Factor ratings:

Standard transformers, i.e. transformers not marked with a K-Factor rating, may have some tolerance to nonlinear loading, but their capability is unknown to the user and is not certified by a third party such as UL. Currently marking transformer with a K-Factor rating is not required by UL. Due to conservative design application, some unmarked transformer may therefore have enough extra thermal capacity to tolerate additional harmonic load heating. This is particularly true for 80° C or 115°C rise transformers built with 220°C insulation material which can safely withstand a 150°C winding temperature rise.

VII. Consideration of additional Over Current Protection for Transformers supplying Nonlinear Loads.

Additional over current protection should be considered for all transformers supplying nonlinear loads. The National Electric Code allows primary-only over current protection at 125°C of the transformer’s primary full load amperes. With three-phase transformers, the triplen harmonics are cancelled in the delta winding and do not appear in the input current. The output currents and transformer loading greater than is apparent from the input current. Therefore a transformer can be overloaded without the primary over-current protection ever tripping. Adding secondary over-current protection helps, but it still does not protect the transformer from the heating effects of harmonic currents. The use of supplemental protection in the form of winding temperature sensors can be used to provide alarm and/or system shutdown in the event of overload, excessive harmonic current, high ambient temperature, or inadequate cooling.

Fig.3. Development of Triplen Harmonic current
VIII. More on Triplen Harmonic currents.

Triplen harmonic currents are phase currents which flow from each of the phases into the fourth wire neutral and have frequencies in integer multiples of three times the 60 Hz base frequency (180 Hz, 360 Hz, 540 Hz etc.). At each of these third multiple triplen frequencies, these triplen phase currents are in phase with each other and when flowing in the neutral as zero sequence currents are equal to three times their RMS phase values. The development of triplen harmonic current is shown in fig.3.

In a 3 phase, 4 wire system, single phase line to neutral currents flow in each phase conductor and return in common neutral. Since the three 60 Hz currents are separated by 120°, when balanced they cancel each other. The measured resultant current is equal to zero.

Theory also states that for even harmonics, starting with the second order, when balanced, the even harmonic will cancel in the common neutral. Other odd harmonics add in the common neutral, but their magnitude is considerably less than triplens. The RMS value of the total current is the square root of the RMS value of the individual currents squared.

ITotal = √ I260Hz + I2180Hz + I2300Hz + I2420Hz + … (3),

Where I = RMS value of current.

At any given instant, the 60 Hz currents on the three phase legs have a vector resultant of zero and cancel in the neutral. But, the third (and other odd triplen harmonics) on the phase legs are in phase and become additive in the neutral.

IX. The UL Approach to Transformers

A. A transformer intended for use with loads drawing non-sinusoidal currents shall be marked “Suitable for non-sinusoidal current load with K-Factor not to exceed x. (x= 4, 9, 13, 20, 30, 40 or 50).”

B. Formulas to determine eddy losses and total losses where the transformer load losses (PLL) are to be determined as follows:

PLL = PDC(1 + K(PEC)) (4)

Where, PDC = Total I2R losses

K = the K-Factor rating at the transformer (4, 9, 13, 20, 30, 40 or 50).

PEC = assumed eddy current losses calculated as follows:

For Transformers rated 300 KVA or less, and for transformers Rated 300 KVA and above, in which;

PAC = Impedance loss

C= 0.7 for transformers having a turn ratio greater than 4:1 and having one or more winding with a current rating greater than 1000 amperes., or C= 0.6 for all other transformers.

PDC-I = the I2R losses for the inner winding.

The impedance losses and the I2R losses shall be determined in accordance with the test code for Dry Type Distribution and Power Transformers, ANSI/IEEE C57.12.91-1979. [4]

As stated in ANSI/IEEE C57.1 10-1986, harmonic load currents may be accompanied by DC components in the load current which are frequently caused by the loss of a diode in a rectifier circuit. A DC component of load current will increase the transformer core loss slightly, and may increase the magnetizing current and audible sound level. [3].

Fig. 4. Shielded and unshielded Transformers.

Relatively small DC components (up to the RMS magnitude of the transformer excitation current at rated voltage) are expected to have no significant effects on the load carrying of the transformer excitation current at rated voltage) are expected to have no significant effect on the load carrying capability of a transformer determined by this recommended practice. Higher DC load components may adversely affect transformer capability and must be corrected by the user.

Harmonic currents flowing through transformer leakage Impedance and through system impedance may also produce some small harmonic distortion in the voltage waveform at the transformer terminals. Such voltage harmonics may cause extra harmonic losses in the transformer core. However, operating experience has indicated that core temperature rise usually will not be the limiting parameter for determination of safe magnitudes of non-sinusoidal load currents.

The Noise Isolation Transformer suppresses common mode noise by introducing a ground shield between its primary and secondary windings. The ground shield provides a low impedance path to ground by capacitive coupling which prevents unwanted high frequency signals contained in the source voltage from reaching the transformer secondary.

The grounded shield between primary and secondary windings is called an electrostatic shield. This shield does not perform any function with regard to harmonic current or voltage distortion wave forms. However this shield is extremely valuable in protecting sensitive equipment’s from common mode electrical noise and transients generated on the line side of the transformer. The shielded and unshielded transformers are shown in fig, 4.

The ratio of common mode noise attenuation (CMA) on the input to that of the output of the transformer is expressed in decibels as shown in equation shown here below:

CMA = 20 log10 [Vin/Vout] dB (5)

Table No.1.Calculations for a typical nonlinear load

Table No.2. K- Factors for various types of Loads

LoadK- FactorILK
Incandescent LightingK-10.00
Electric Resistance HeatingK-10.00
Motors (without solid state drives)K-10.00
Control TransformersK-10.00
Motor-GeneratorsK-10.00
Distribution TransformersK-10.00
Electric Discharge LightingK-425.82
UPSK-425.82
WeldersK-425.82
Induction Heating EquipmentK-425.82
PLCs and solid state controlsK-425.82
Telecommunication Equipment (e.g. PBX)K-1357.74
UPS without input filteringK-1357.74
Multiwire receptable circuits in general care areas of health care facilitiesK-1357.74
Main frame computer loadsK-2080.94
Solid State Motor DrivesK-2080.94
Multiwire receptable circuits in Industrial, Medical and Educational LaboratoriesK-30123.54
Small Main Frames (Mini and Micro)K-30123.54
Other loads identified as producing very high amounts of harmonicsK-40208.17

Table No.3. Index of K-rating

K- FactorK-1K-4K-9K-13K-20K-30K-40
ILK0.025.8244.7257.7480.94123.54208.17

An isolation transformer with an electrostatic shield can have a ratio of input noise voltage (VIN) to output noise voltage (VOUT) within the range of 10:1 to 1000:1 or even higher. The calculations for K-Factor loads can be carried out with the help of information available in the Table No.2 and 3.

X. Disadvantage of using Derated Transformers instead of K-Factor Transformer

Transformers carries some disadvantage as under:

1.First is the issue of managing the derating when the transformer nameplate indicates greater capacity. Initially, the transformer may be operated at reduced loading. But in the future, the loading may be increased without considering the intended derating.

2.If smaller overcurrent protection is used intentionally to limit the overloading, nuisance tripping may occur due to the transformer inrush current. Larger overcurrent protection may be required for the oversized (derated) standard transformer resulting in larger conductor requirements with the associated higher feeder costs.

3.The transformers designed specifically for nonlinear loads minimize losses due to harmonic currents. They operate with the nonlinear loads more efficiently and generate less heat that need to be dissipated.

XI. Using a K-Factor Transformer

Once the harmonic current of the total load is known, and a K-Factor is specified (K4, K13 etc.), the appropriate type K-Factor transformer can be fully loaded up to 100% or nameplate KVA. All other optional feature that the industry is accustomed to can be specified.

  1. Copper or Aluminum
  2. 80° C, 115°C, 150°C.
  3. Electro-static shield.
XII. What should be remembered when using a K-Factor Transformer?

1) Harmonic loads do cause premature failure when standard transformers are used.
2) Average reading RMS meters do not measure harmonic currents. True reading RMS meters should be used.
3) Insist on a K-Factor transformer that has been 3rd party tested. Accept no verbal claims. The proof must be on the label.

Conclusions:

Because transformers are the power system components most affected by nonlinear loads, they are the first to receive a harmonic rating system. K-Factor ratings are based on heating effects of harmonics and are not necessarily applicable to other power system components. If harmonic rating systems for other components are needed, they will have to be developed by other methods, e.g., THD, crest factor, or some new and component-specific weighing of harmonic currents.

What is the likelihood that additional rating systems will actually be developed? That’s hard to predict. The best solution to the problem caused by harmonic currents would be preventive, i.e. the use of components does not generate harmonics. Impending standards such as IEC 555 and IEEE 519 encourage the development of such devices.

Indeed, low harmonic current power supplies and electronic ballasts are already available. As such new designs are implemented, they should gradually displace existing electronic loads (and their greater harmonics), serving to reduce the prevalence of harmonic currents over the long term.

Short term, however, projection show harmonic levels in power systems increasing as more electronic loads are added. Whether this will provide sufficient impetus for new rating system for other power system components is problematical. One thing is sure, though, until the day that harmonic currents actually diminish, K-Factor Transformers will play an important role in coping with the problems harmonics create.

References

[I] The Institute of Electrical & Electronic Engineers, “Recommended Practice for establishing Transformer capabilities when supplying Non-sinusoidal Load Currents”, ANSIIIEEE C57.110-1986, New York, 1986.
[2] Gruzs, T.M. “A survey of Neutral Currents in Three phase Computer Power Systems”, IEEE Transactions on Industry Application, Vo1.26,No.4, July/August 1990.
[3] IEEE P-l100 Working Group. Recommended Practice for Powering and Grounding Sensitive Electronic Equipments. Draft 1992.
[4] Underwriters Laboratory. Proposed Requirements and Proposed Effective Dates for the First Edition of the Standard for Dry Type General Purpose and Power Transformers, UL 156. Santa Clara CA, 1991.
[5] Computer Business Equipment Association (CBEMA). Three Phase Power Source Overloading Caused by Small Computers and Electronic Office Equipment. ESC-3 Information Letter, 1987.
[6] McGranaghan et al. “Analysis of Harmonic Distortion Levels in Commercial Buildings.” PQA 91,Paris, France, October 1991.
[7] ANSI/IEEE Standard 519-1981. IEEE Guide to Harmonic Control and Reactive Compensation of Static Power Converters.
[8] McPartland Brian J.: “Use K-Factor Transformers? Definitely! But Which K-Factor?” EDI, June 1991, Vo.2 No.6.

What is Protective Device Testing and How is it Done

Published by Carelabs (Carelabz), Website: carelabz.com


Image: Carelabz – Surge Arresters

Equipment applied to electric power systems to detect abnormal and intolerable conditions and to initiate appropriate corrective actions. These devices include lightning arresters, surge protectors, fuses, and relays with associated circuit breakers, reclosers, and so forth.

From time to time, disturbances in the normal operation of a power system occur. These may be caused by natural phenomena, such as lightning, wind, or snow; by falling objects such as trees; by animal contacts or chewing; by accidental means traceable to reckless drivers, inadvertent acts by plant maintenance personnel, or other acts of humans; or by conditions produced in the system itself, such as switching surges, load swings, or equipment failures. Protective devices must therefore be installed on power systems to ensure continuity of electrical service, to limit injury to people, and to limit damage to equipment when problem situations develop. Protective devices are applied commensurately with the degree of protection desired or felt necessary for the particular system.

Why Protective Device Testing is Done?

Protection systems play a key role for the safe and reliable operation of today’s electricity power systems. Properly working protection devices help to maintain the safety of the system and to safeguard assets from damage. In order to ensure reliable operation, protective relays as well as recloser controls must be tested throughout their life-cycle, from their initial development through production and commissioning to periodical maintenance during operation. Our test equipment is ideal for each of these life-cycle phases and for any environment. As a reliable long-term partner, we offer state-of-the-art testing solutions which are continuously being developed and maintained to help you to keep pace with the increasingly complex requirements of your systems.

What is Done During Protective Device Testing?

Lightning protection is a means to protect equipment, facilities and people from the effects of nearby or direct lightning events. Whereas, surge protection provides protection to equipment from the effects of more distant lightning events or power system anomalies. Five basic procedures are employed to test protection devices.

Clamping Voltage Tests

When a transient occurs, the SPD resistance changes from a very high stand-by value to a very low conduction value. The transient is absorbed and clamped at a defined level, protecting sensitive electronic circuits and diverting the transient energy to ground. A normalised current impulse of 8/20us is defined in the standards IEC 61643-1 and IEC61180-1.

Surge Withstand Tests

Surge withstand tests are intended to assess the maximum peak current carrying capability of varistors. The surge withstand capability is approximately proportional to the varistor disk size (diameter). Energy levels are much higher than for the clamping voltage tests with impulse levels in the tens of kilo amps range.

Energy Absorption Tests

High energy surges are usually generated by inductive discharges of motors and transformers. Energy absorption in an SPD is the integral current flow through and the voltage across an SPD. Surge currents of relatively long duration are required for testing maximum energy absorption capacity of an SPD. A rectangular wave of 2ms duration is sometimes used instead of the double exponential waveforms.

Combination Wave Tests

Surge events can be generated by lightning phenomena, switching transients or the activation of protection devices in the power distribution system. A surge itself is influenced by the propagation path taken so that impulses from the same event may have different forms depending upon where a measurement is taken. Combination Wave Generators (CWG) simulate a surge event in power lines close to or within building.

Duty Cycle (Flammability) Tests

A series of pulses is applied to the varistor to assess maximum rated dissipation. Exceeding the maximum rated dissipation will cause the protection device to be destroyed. A flammability risk could occur. The 8/20us current impulse is superimposed on the mains power supply

How do We Conduct Protective Device Testing?

Basic devices have the ability to recognize and define fuses, protective relays, breaker trip devices, and surge suppressors and to understand their differences and uses. A common mistake for relay testers is to use spare outputs, displays, and/or LEDs for their pickup and timing tests and ignore the in-service output logic, believing that they are using the same elements in their test equations as the final logic.

Depending on the protective device the tests varies accordingly:

Low-voltage breakers

They conduct the flow of current as long as a nominal value of current is flowing through the circuit to the load attached to it. Even at the slightest contact, current conduction occurs. But as soon as the breaker senses an excessively large amount which does not lie in its operating range (which can be checked through the ratings of the circuit breaker), the trip unit actuates the bimetallic strip and the contact breaks and immediately further flow of current is stopped. In addition to the safety operation, it also provides a kind of voltage insulation to the circuit and retains the flow after the current retains its appropriate value.

The field-testing and calibration of solid-state trip units can be performed by either primary current injection method or secondary current injection method. A coordination study is an organized effort to achieve optimum electrical distribution system protection by determining the appropriate frame sizes, ampere ratings and settings of overcurrent protective devices. When an overcurrent occurs in a properly coordinated distribution system, only the protective device nearest the fault will open. The secondary injection test is performed using a specially designed power supply unit. It should be noted that the secondary injection method only tests the solid-state trip unit logic and does not test the current sensors, wiring, or the breaker current handling components. Most solid-state trip units have terminal blocks that are equipped with test plug terminals for making the calibration test. The test set allows checking of the solid state trip unit operation without using primary current. The test set will pass enough current to check any desired calibration point. The breaker must be de-energized before checking the operation of the solid-state trip units. If the test set shows that the solid-state trip unit is not functioning properly, the trip unit should be replaced.

The primary current injection method is usually preferred because this method verifies the sensors and wiring, as well as the conduction path in the breaker. It is recommended that the primary injection test be performed simultaneously on all three phases when testing breakers with solid-state trip units. If three phase primary injection testing is not practical, then it is recommended that the sensors and wiring should be tested separately. This testing should be performed per NETA and the National Electrical Manufacturers Association (NEMA) procedures, and in accordance with manufacturer recommendations. Coordination Time-current curves are used to show the amount of time required for a circuit breaker to trip at a given overcurrent level.

Relays

A relay is an automatic device which senses an abnormal condition of electrical circuit and closes its contacts.

The first electrical test made on the relay should be a pickup test. Pickup is defined as that value of current or voltage which will just close the relay contacts from the 0.5 time-dial position. Allowing for meter differences, interpretation of readings, etc., this value should be within ±5% of previous data. Generally, one or two points on the time-current curve are sufficient for maintenance purposes. Reset the relay to the original time-dial setting and two points that could be checked and 3 and 5 times pickup. Of course, other points could be used, but the important thing is to always use the same point(s). The instantaneous unit should be checked for pickup using gradually applied current for reasons previously discussed. Wherever possible, current should be applied only to the instantaneous unit (to avoid over-heating the time unit).

There are different types of relays:

Current Relays

Relays can include phase overcurrent, current balance, negative sequence, zero sequence, thermal, and ground fault.

This is the first generation oldest relaying system and they have been in use for many years. They have earned a well-deserved reputation for accuracy, dependability, and reliability.

Contact function – Manually close (or open) contacts and observe that they perform their required function, i.e. trip, reclose, block, etc.

Pickup – Gradually apply current or voltage to see that pickup is within limits. Since preventive maintenance is the guide post, gradually applied current or voltage will yield data which can be compared with previous or future data and not be clouded by such effects as transient overreach, etc.

Dropout or reset – Reduce the current until the relay drops out or fully resets. This test will indicate excess friction. Should the relay be sluggish in resetting or fail to reset completely, then the jewel bearing and pivot should be examined. A 4X eye loupe is adequate for examining the pivot, and the jewel bearing can be examined with the aid of a needle which will reveal any cracks in the jewel. Should dirt be the problem, the jewel can be cleaned with an orange stick while the pivot can be wiped clean with a soft, lint free cloth. No lubricant should be used on either the jewel or pivot.

Test should be made to check that the overcurrent unit operates only when the directional unit contacts are closed.

Directional and Power Relays

Directional overcurrent relaying refers to relaying that can use the phase relationship of voltage and current to determine direction to a fault.

Power Directional Relays provides protection against excess power flow in a predetermined direction. And are used for anti-motoring protect on of AC generators.

The simplest pickup test for a directional unit is an in-phase test – i.e. current and voltage in phase. This test will eliminate the need for a three-phase supply, phase shifter, and phase-angle meter. However, it must be kept in mind that such a test is usually far from the angle of maximum torque (usually 60° lag for ground relays) and thus, small changes in components can yield large variations in in-phase pickup. As long as this fact is recognized and the pickup value is within limits, an angle of maximum torque check would not be necessary. Clutch pressure must always be measured in the same manner. For example, some instruction books express clutch settings in both grams and current/voltage levels. Portable pre-calibrated reactance-resistance test boxes are available for many of these tests. The use of such equipment, properly applied, will yield results which will exceed in accuracy those obtained with conventional phase-angle meters, ammeters, voltmeters, etc. In addition to the tests previously described for the overcurrent relay, the directional unit should be tested for minimum pickup, angle of maximum torque, contact gap, and clutch pressure. Further, a test should be made to check that the overcurrent unit operates only when the directional unit contacts are closed. . Either test is valid, but to have comparative data, the same method, either grams or electrical quantities should be employed each time

Voltage Relays Secondary Injection Test

Measure the relay auxiliary supply to ensure it is within the nameplate rating allowable range.

Creep or Pickup Test

  • Connect the voltage injector’s output.
  • Adjust relay’s set points to the plant / substation recommended settings, if necessary.
  • Set Red phase of voltage injector to 120% of relay setting. Note: Set Yellow and Blue phase to zero.
  • Inject and reduce slowly the Red phase injector’s voltage in order to monitor and record the relay’s pickup voltage.
  • Repeat step 2.3 and 2.4 for other settings, if any.

Trip Time Test

  • Set Red phase of injector’s voltage to 80% of relay setting. Note: Set Yellow and Blue phase to zero.
  • Inject Red phase voltage through the relay in order to record the tripping time. Check test results against the tripping curve characteristics of the relay.

Differential Relays

A test of minimum pickup should be performed. The differential characteristic (slope) should be checked and where applicable the harmonic restraint should be tested. Generally, differential relays are extremely sensitive devices and require some special consideration. For example, those relays employing ultra-sensitive polarized units as sensing devices are slightly affected by previous his-tory such as heavy internal or external fault currents. To eliminate previous history and truly perform a maintenance test, it is the usual practice to disregard the first pickup reading and use the second reading for comparison with previous and future data. By “disregard” it is not meant to imply that the initial reading be forgotten; rather it is meant that this reading not be used for comparison purpose.

Fuses

The fuse is a reliable overcurrent protective device, primarily used as a circuit protection device for over currents, overloads and short-circuits.

A time-current characteristic curve, for any specified fuse, is displayed as a continuous line representing the average melting time in seconds for a range of overcurrent conditions.

NFPA 70B recommends checking fuse continuity during scheduled maintenance, but testing to assure proper operation and protection against overcurrent conditions is not required. Fusible switches and fuse blocks require maintenance, such as tightening of connections and checking for signs of overheating as recommended per NFPA 70B.

In all cases, though, the idea is to send a small current through the fuse; if it passes through the fuse the fuse is good. If it does not the fuse is blown and needs replacement. This means that a battery is necessary to provide that small current and every fuse tester will have a battery in it. If a tester shows that a fuse is blown, the next step is to check the tester. This is accomplished by touching the test leads together or, in the case of testers without leads, to put a piece of metal (wire, coin, dinner spoon, anything metal) across the probes. If it does not indicate “good” the battery probably needs replacing.

  • Using a Continuity Tester

Continuity testers will have two test leads and a small light that will light up if the leads are touched together. To test a fuse simply touch one lead to each of the electrical contacts on the fuse; if the light bulb lights up the fuse is good.

  • Testing a Fuse with a Multimeter

A multimeter again has two leads just like a continuity tester. However, there are many settings on a multimeter to measure amperage, voltage and resistance in several different ranges. Some multimeters are auto ranging (no need to choose a range), some are digital and some are analog meters with a needle to indicate the reading. With all multimeters the first step is to set it to measure resistance, or Ω. If different ranges are available, choose the lowest range (K means thousand on the dial, so 2K equals 2000) – usually around 200. Like a continuity tester, touch one probe to each contact on a fuse and observe the reading. A very low w reading of 1 ohm or less means the fuse is good; if it is blown the reading will be infinite, or the maximum the meter will display. An intermediate reading of several ohms probably means you aren’t making good contact; wriggle the probes on the fuse contacts or clean them and try again.

Motor Management Systems

Microprocessor-Based Motor Protection Takes Protecting and Monitoring Electric Motors into the Digital Age

Before microprocessor relays, electromechanical and solid state relays were tested on an element by element basis. This was a coherent approach, allowing individual parts of the relay to be calibrated and proven. When microprocessor relays arrived, many continued this approach and tested individual elements within the relay, while others found alternative methods to test. Developing automated testing procedures for microprocessor relays can be classified into three categories:

  • Element testing,
  • Functional testing, and
  • Black box testing.

The black box testing method, is adequate in terms of NERC compliance.

Whether functional or black box testing, the use of dynamic testing software is the logical choice to perform the testing. Dynamic tests drive relaying test sets to run in a series of defined sequences called states-such as pre-fault, fault and post-fault..

The use of element testing for microprocessor relays is likely to decline because, in part, to its noted shortcomings. The choice of functional vs. black box testing is less clear because both have their advantages and disadvantages. One thing is clear, however, regardless of the testing method employed-documentation of testing is critical, especially if the relay application is under the NERC umbrella. Tracking of testing intervals, previous test dates and last test dates are all part of the data required to be submitted during an audit. A detailed account of the testing on a subset of the full listing will often be requested. Maintaining this data by paper copy can result in much time spent tracking dates and data gathering. The larger the number of relays to track, the more daunting this task can be. Storage of all this data into a centralized database, with the ability to extract data and run audit reports, is quickly becoming a necessity to prepare for NERC audits. These reports can prevent a last minute crisis of discovering relays that were missed by tracking testing dates on a continual basis-and also provide the data needed for audit submissions. There are many different relay database programs, some home grown, others commercial. Regardless of NERC regulations, the reliance on these databases will only grow.

Resetting Overcurrent Protective Devices

Circuit breakers are sometimes selected over fuses because circuit breakers can be reset where fuses have to be replaced. The most time consuming activity that results from the operation of the overcurrent protective device is typically investigating the cause of the overcurrent condition.

A known overload condition is the only situation that permits the immediate resetting or replacement of overcurrent protective devices per OSHA. If the cause for the operation of an overcurrent protective device is not known, the cause must be investigated.

Thus, having a device that can be easily reset, such as a circuit breaker, possibly into a fault condition, could be a safety hazard and a violation of OSHA regulations.

Because a fuse requires replacement by a qualified person, it is less likely to violate OSHA. Also, when an opened fuse is replaced with a new fuse in the circuit, the circuit is protected by a new factory calibrated device.

Generally, overload conditions occur on branch-circuit devices. Typically this is on lighting and appliance circuits feed from circuit breaker panel boards, where resetting of circuit breakers may be possible. Motor circuits also are subject to overload considerations.

However, typically the device that operates is the overload relay, which can be easily reset after an overload situation. The motor branch-circuit device (fuse or circuit breaker) operates, as indicated in NEC® 430.52, for protection of short-circuits and ground-fault conditions. Thus, if this device opens, it should not be reset or replaced without investigating the circuit since it most likely was a short-circuit condition.

User Benefits

The technical excellence and many unique features of the Protection Device Testers translate directly into benefits for the user:

  • optimum return on investment
  • Standard control unit, reduces user training
  • Impulse reproducibility
  • Accurate measurement system delivers information about the SPD
  • Integration into existing test facilities saves engineering costs
  • Pass / Fail indication for individual samples, speeds up production
  • High degree of automation, reduces operator workload
  • Save operator time with the automated test routines and test report facility
  • Easy integration into a full test suite
  • Unparalleled reliability and system up-time

Source: https://carelabz.com/what-protective-device-testing-how-done/

What ill effects do harmonics created by the computer power supplies have on themselves?

Published by Mirus International Inc., [2010-01-08] MIRUS-FAQ001-B2, FAQ’s Harmonic Mitigating Transformers, 31 Sun Pac Blvd., Brampton, Ontario, Canada. L6S 5P6.


As voltage becomes more and more distorted, it will begin to have a negative effect on the connected equipment. A flat-topped voltage waveform can affect a switch-mode power supply (SMPS) in at least 2 major ways:

  • A reduced peak voltage will translate to a lower DC bus voltage in the SMPS. Input current to the SMPS will increase because the computer or other electronic load still requires the same amount of power. Increased I2R losses in the SMPS accelerate the aging of its components.
  • Power disturbance ride-through capability is reduced since the reduced peak voltage means the large filter capacitor on the DC bus of the SMPS will be able to store much less energy.
Figure 9-1: How voltage flat-topping affects DC bus voltage and equipment over-heating

When an SMPS is supplied by a voltage waveform with a flattened peak (red trace in Figure 9.1) rather than a nearly pure sinusoidal voltage (blue trace), the DC bus voltage is reduced proportionately (red trace). With a lower DC bus voltage, the SMPS will need to draw more current in order to deliver the same amount of power required by the load (I = P/V). This increase in current will result in increased component heating from higher I2R losses and a reduced life expectancy of the components due to their higher operating temperature. For example, a 10% decrease in peak voltage (from 169V to 153V) will increase the SMPS line current by about 11% which will in turn increase the I2R portion of the SMPS losses by about 23%. The correlation of SMPS failures with increased voltage distortion is usually subtle because equipment aging takes time to accumulate.

The first purpose of the large filter capacitor on the DC bus of an SMPS is to reduce the voltage ripple. The second purpose is to support its electronic load during a power disturbance that produces a momentary power interruption or major power dip. Since a typical SMPS is capable of operating for short periods at voltage levels as low as 70%, we can calculate the reduction in ride-through time if the initial voltage stored in the capacitor is below its rated peak voltage. For instance, if the peak voltage supplied to the SMPS is flat-topped by 30%, the ride-through capability is essentially zero and the I2R losses are twice those present at rated peak voltage.

Figure 9-2: How voltage flat-topping affects equipment ride-through capability

With the correct initial peak voltage, the stored energy in the capacitor will often provide several cycles of ride-through capability before its voltage is reduced to 70% of nominal. This is dramatically reduced however, when the SMPS supply voltage is flat-topped because the energy stored in the capacitor is proportional to the square of the voltage. Figure 9-2 shows how a 10% reduction in the peak voltage supplied to computer equipment will reduce the power dip ride-through time by about 37%. Without the correct peak voltage, the smoothing capacitor in the SMPS will not be fully charged. Initially lower stored energy means that the capacitor will support the load for a much shorter period during a power interruption. When voltage flat-topping becomes severe enough, brief power interruptions such as those characterized by the lights flickering, will begin to affect equipment that would otherwise be unaffected.

In order to ensure reliable operation of power electronic equipment as well as other equipment on the power system, it is important to simultaneously maintain the correct level of both RMS voltage and peak voltage. This can best be achieved by using harmonic mitigation equipment that minimizes voltage distortion throughout the system by removing the harmonic currents from interacting with the upstream supply and distribution equipment.


Harmonics and Harmonic Mitigating Transformers (HMT’s) Questions and Answers

This document has been written to provide answers to the more frequently asked questions we have received regarding harmonics and the Harmonic Mitigating Transformer technology used to address them. This information will be of interest to both those experienced in harmonic mitigation techniques and those new to the problem of harmonics. For additional information visit our Website at www.mirusinternational.com.