Published by Shantha Gamini Jayasinghe1,*, Lasantha Meegahapola2, Nuwantha Fernando2, Zheming Jin3 and Josep M. Guerrero3
1Australian Maritime College, University of Tasmania, Launceston 7250, Australia,
2School of Engineering, Royal Melbourne Institute of Technology, Melbourne 3001, Australia; lasantha.meegahapola@rmit.edu.au (L.M.); nuwantha.fernando@rmit.edu.au (N.F.)
3Institute of Energy Technology, Aalborg University, Aalborg 9220, Denmark; zhe@et.aau.dk (Z.J.);joz@et.aau.dk (J.M.G.)
*Correspondence: shanthaj@utas.edu.au; Tel.: +61-363-249-752
Abstract: Ship microgrids have recently received increased attention, mainly due to the extensive use of power electronically interfaced loads and sources. Characteristics of these microgrids are similar to islanded terrestrial microgrids, except the presence of highly dynamic large loads, such as propulsion loads. The presence of such loads and sources with power-electronic converter interfaces lead to severe power quality issues in ship microgrids. Generally, these issues can be classified as voltage variations, frequency variations and waveform distortions which are commonly referred to as harmonic distortions. Amongst the solutions identified, energy storage is considered to be the most promising technology for mitigating voltage and/or frequency deviations. Passive filtering is the commonly used technology for reducing harmonic distortions, which requires bulky capacitors and inductors. Active filtering is emerging as an alternative, which could be realised even within the same interfacing converter of the energy storage system. The aim of this paper is to investigate recent developments in these areas and provide readers with a critical review on power quality issues, energy storage technologies and strategies that could be used to improve the power quality in ship microgrids. Moreover, a brief introduction to ship power system architectures is also presented in the paper.
Keywords: energy storage; frequency variations; harmonics; power quality; ship microgrids; voltage variations
1. Introduction
Ship power systems have significantly evolved over the last century with complex network architectures and power electronically interfaced multifarious high power loads and sources. With these developments, modern ship electrical power systems have become more or less similar to terrestrial microgrids [1]. The common characteristics between the two types of microgrids include islanded operation, increased use of power electronic converters and network architectures. Therefore, technologies developed for islanded microgrids can be extended for ship microgrids as well. Nevertheless, due to the presence of large dynamic loads and various operating scenarios, power management and control of ship microgrids have become more complex compared to terrestrial microgrids [2].
Large dynamic loads in ship microgrids demand significant changes in the supply within a short time which lead to large deviations in the voltage and/or frequency. The common approaches of mitigating these deviations are the over design and maintaining a spinning reserve. These methods introduce additional weight, increase the cost and require more space. Energy storage systems (ESSs) have been identified as a promising alternative that can be used to handle transients in an efficient and effective manner in ship microgrids compared to the over design and having a spinning reserve. The current practice in the maritime industry is to use ESSs as the emergency power supply. However, they could also be designed to smoothen transients and thereby reduce voltage and/or frequency deviations in ship microgrids. Moreover, ESSs can be used for shaving the peak-load, energy recovery during regeneration and providing ancillary services to the main generator [1–4].
Power electronic converter systems found in propulsion motor drives, pumps, fans and generating sources introduce waveform distortions, mainly in the form of harmonics. Distortions created by high power converters with passive front-end interface or low frequency devices are more significant compared to low power converters. As majority of the power converters in ship microgrids are of these types, the effect of waveform distortions is much more severe compared to that of the terrestrial microgrids. The traditional approach taken to mitigate these harmonic distortions in ship power systems is the use of passive filters, which require bulky inductors and capacitors. Nowadays, the trend is to use active filters which are based on power electronic converters. Modern ESSs are equipped with bi-directional power electronic converter systems, hence they can control both active and reactive power instantaneously. Therefore, there is a possibility of using those interfacing converters as active filter as well to reduce waveform distortions.
The aim of this paper is to critically review the capabilities and characteristics of the energy storage technologies in terms of power quality improvement, and recent developments in power quality improvement strategies in ship microgrids. The rest of the paper is organised as follows: Section 2 presents an overview of ship power system architectures, loads and sources. A comprehensive analysis on power quality issues in ship power systems and associated standards are presented in Section 3. The potential use of energy storage systems as a solution to the identified power quality issues are discussed in Section 4. Finally, conclusions drawn from the study and authors opinions on future developments in the use of energy storage as a solution to power quality issues are presented in Section 5.
2. Ship Power System Architectures, Loads and Sources
2.1. Ship Power System Architectures
2.1.1. Traditional Ship Power System Architectures
Traditional ac ship power systems are based on the radial power distribution architecture and having separate generators for propulsion and service loads. The SS Canberra, ocean liner, is a good example for this architecture. Single line diagrams of her power systems are shown in Figure 1. The propulsion system is powered by two steam-turbine-coupled 32.2 MW generators, while the service loads are supplied by four steam-turbine-coupled 1.5 MW generators. This approach helps prevent transients and oscillations in the propulsion power system propagating into the service power system. However, in this system, the excess capacity of the propulsion power system at low speed or when the ship is not moving is not usable. Therefore, the utilization of available resources is very low in this approach and it results in low efficiency in the overall system [5–8]. In addition, with the growth of the power demand in service loads in modern ships maintaining two large power systems is not efficient and economical.
Recent developments in power electronics have enabled more controllability in ac propulsion systems, and thus the use of a common power system for both propulsion and service loads have become possible [1–4]. This architecture is known as integrated power system (IPS). A simplified representation of an IPS architecture with radial power distribution is given in Figure 2. The IPS architecture is considered to be first used in the Queen Elizabeth II(QEII). The QEII ocean liner consisted of steam-turbine-driven alternators which were fitted with diesel generator sets at a later stage [9].The distribution system of QEII operated at 10 kV. Transformers were used to step down this voltage to a low voltage to accommodate service loads. This IPS architecture continued with modifications such as separate high voltage and low voltage busses for port-side and starboard-side. As the IPS architecture allows more flexibility in ship design, reduction in number of prime movers and increase in the overall efficiency, it has become the popular choice, especially in cruise ships, ferries and large vessels [1,9].

( T – Transformer).
As the propulsion loads and service loads are connected to the the same power system, power quality issues have become more significant with the IPS architecture. Some of these issues are similar to those present in terrestrial microgrids as well, and thus technologies used to address issues in terrestrial microgrids can be adopted in ship microgrids as well. Those issues and potential solutions are discussed in Section 3.
2.1.2. Modern Power System Architectures
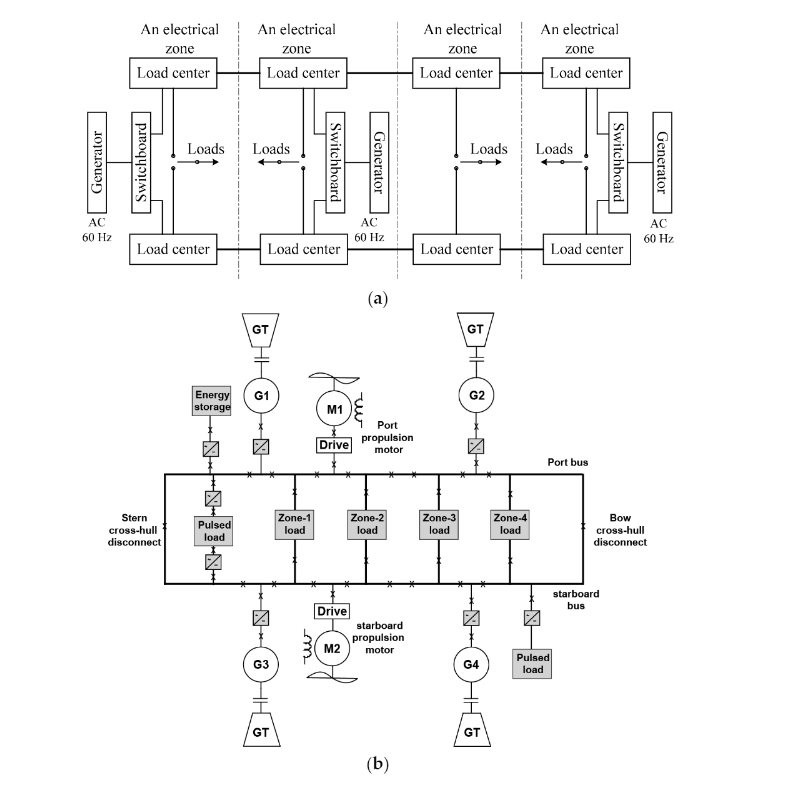
While the radial power distribution has been widely adopted in ship power systems, the need for a more complex power systems that can offer higher survivability, reliability and efficiency have recently gained priority. The zonal electrical distribution (ZED) is emerging as one of the most suitable candidate power system architecture to achieve these objectives [10,11]. Figure 3a,b show a simplified diagram of an ac ZED system proposed in [10] and a dc ZED system considered by the Electric Ship Research and Development Consortium (ESRDC) [2,12], respectively. In contrast with radial power systems, zonal power systems achieve high survivability by separating the distribution system into zones and maintaining independent power sources in each zone [10–12]. In the event of a fault, it can be isolated by opening appropriate switches and thereby potential blackouts can be avoided. For example, a fault in Zone-1 can be isolated by opening the two supply switches. A fault in any point in the distribution cable system itself can also be isolated by opening any of the adjacent circuit breakers. If the fault is in a zonal load, it can be isolated by opening the load terminal breaker. Under such conditions, power distribution to any of the other loads can be continued via redundant paths with minimal impact on the power disruption to the other loads.
ZED systems require comprehensive understanding of load profiles and complex communication and coordination strategies [9–12]. Moreover, advanced fault detection, identification and isolation algorithms are essential for the successful implementation of ZED systems in ship microgrids. Communication technologies such as controller area network (CAN), local area network (LAN) based systems [11], protection algorithms and monitoring systems, e.g., multi-functional monitoring (MFM)systems and complex decision making algorithms, such as graph theory based techniques [11] area few examples that show the direction of technology development in ZED based ship power systems.
2.1.3. Comparison of ac and dc Power Systems and Impact on Power Quality
Traditional ship power systems are based on low voltage ac (LVAC) power distribution. Recently, medium voltage ac (MVAC) distribution systems ranging from 3.3 to 13.8 kV have become popular, especially in large ships [13–15]. These systems operate at a fixed frequency and the propulsion motors are directly connected to the fixed frequency systems resulting in fixed-speed operation of the motors. In this fixed-speed operation, pitch angle control is used to vary the propulsion power, which is inefficient at low load conditions [13]. With technology development, it has been possible to use variable-speed drives to control the speed of the propulsion motor with a fixed pitch propeller. In addition to the propulsion drives, other loads have also experienced enhanced performance with the application of the power electronic technology. As a result, recent developments in maritime power systems have seen certain advantages in the use of variable-speed drives (VSD). Since the majority of VSDs use the ac-dc-ac power conversion architecture, a dc distribution can eliminate the front-end ac-dc rectifier and thereby reduce poser losses, cost, weight and volume of the converter system.
The use of ac power has advantages such as the possibility of using brushless ac machines for loads without the need of control electronics and ease of protection during faults due to zero voltage arc extinguishment. However, the use of ac power also leads to the need of bulky transformers for step-up or step-down of voltages and relatively lower efficiency due to reactive power transfer. With modern power electronic loads, the number of power conversion steps may also increase significantly and hence pose a disadvantage. AC power systems require stringent fixed frequency and hence the prime movers have to run at the given speed under varying loads which may not yield optimum operation all the time. Furthermore, ac power systems also require multiple generator synchronization and hence encounter difficulties in immediate re-engagement of isolated systems in contrast with dc power system in a ZED based architecture. Such limitations have hindered the enhancement of survivability of the power system and power quality enhancement under faulty conditions. As a result, the dc power systems have been widely researched as an alternative to ac power systems.
The use of dc power for maritime power systems involves medium voltage dc (MVDC) having voltages from 1 kV up to 35 kV [13–16]. DC power systems enable weight savings with the use of different types of electrical machines for power generation e.g., high-speed machines with low weight, volume and high power density and elimination of low frequency transformers [17,18]. In addition, enhanced control of power flow, bi-directional power flow, ease of integration of energy storage, ease of engagement and disengagement of different parts of the system and absence of synchronization are some of the other advantages of having dc distribution in ships [13–17]. Moreover, the absence of harmonic issues is another advantage of dc systems over ac systems. Nevertheless, dc ship power systems and associated technologies are still at the development stage, and thus can be considered as an expanding area of research in the field of transportation electrification.
2.2. Loads in Maritime Power Systems and Their Impact on Power Quality
Typical shipboard electrical loads include propulsion loads, pumps and compressors for heating ventilation and air conditioning, control and communication systems in the bridge and hotel loads. Other types of loads may vary depending of the functionality of the vessel. For example, in aircraft carriers [16], additional loads may include lifting systems for aircrafts. These different loads also demand power from the ship microgrid. Generally, their dynamics and characteristics should be taken into consideration at the power system design stage. In a radial power system, the aggregated load is considered for determination of design parameter of the system. For example, the required total capacity will consider load factors for determination of switchgear and cables. The power quality can also be analysed by consideration of worst-case scenarios of operation. However, in the case of using ZEDs, the utilization of different components of the system is complicated [7]. The use of stochastic methods is a solution proposed in literature to evaluate the power system operation under a range of operating conditions and estimate corresponding load profiles [1]. Such techniques can also be extended for the analysis of power quality to guarantee high quality power in all operating scenarios.
The placement of the loads on a power system impacts the power system operation and power quality. This is especially true for loads that demand high power such as the propulsion loads or pulsed power loads in naval applications. The time constants of the loads characterize the rapidness of power demand. Table 1 outlines typical time constants of common loads in ship power systems [5,19].Load management in a complex ship microgrid having components with such a wide range of time constants is a challenging task. Strategies based on time constant are becoming popular as promising load management methods for ship microgrids [20].
Table 1. Time constants of different components of a marine electric power system [5,19].

The simplified representation of an IPS shown in Figure 2 can be used as an example system to discuss further on the time constants of different components and their implications. In this system, four steam-turbine-driven generators are used as the sources. The starboard and port propulsion motors are fed through power electronic converter systems. Depending on the required power level, propulsion motor could be chosen as either an induction motor (up to 5 MW) or a synchronous motor (above 5 MW) [13]. Permanent magnet (PM) motors are also increasingly being used in electric ship applications [15]. Irrespective of the type of the motor, its dynamics are affected by the rotor time constant. A typical fixed-pitch, variable speed, propulsion drive system in an ac ship includes a back-to-back converter structure for rectification of the ac power to dc and then inversion to produce variable voltage and variable frequency output to the motors. The rectifier stage is not required in dc ships and thus only the inverter stages are used to control the propulsion motors. The typical time constants of the propulsion drive system based on industrial drives up to 20 MW is identified in [17]. The propeller run-up time depends on the size and inertia of the propulsion system and can be found to be within the range of 1–60 s. Following propeller run-up, the ship run-up time is from60 to 500 s [17]. While these are comparatively longer time transients, the short-term transient that impact the power system include the dynamics of the machine and the pulse width modulation (PWM)drive. The PWM switching transients in the range of 100 ns to 1μs are filtered within the power electronic converter itself. However, the dynamics of electrical machines are in the range of 1ms to 1s and thus they will significantly influence the ship power quality depending on the ability to supply rapid changes in power demand.
In electric ship technologies, the propulsion load is accommodated via the electrical power system. As a result, the propulsion system dynamics significantly impact the ship microgrid and its power quality. The priorities to deliver power to each of these loads differ depending on their functionality. For example, the propulsion load demand may have high priority due to manoeuvring requirements as the inability to achieve the rapid response may result in momentary loss of ship control. However, the simultaneous delivery of a pulsed power load requires rapid delivery of power with a low time constant, and momentary shift of power for the pulsed power load will not significantly impact the high time constant loads, such as propulsion motors. Therefore, control strategies for coordinated control of different loads with differentiation of their response is found to be an essential feature in modern marine power systems, especially those that are equipped with high energy detection systems and pulsed power weapons.
The pulsed loads in ships are generally defense equipment such as electromagnetic weapons and high energy detection systems [21,22]. The authors of [22] have examined the impact of pulse loads on the power system. In this study, pulse loads of 30 MW × 0.1s and 50 MW ×1s are simulated and it is shown that the system performance and transient conditions under pulsed power loads heavily depend on the system control parameters, power system topology and the location of the pulsed power load. A generic pulsed power load is studied in [21,22] and is modelled as a current sink. The time constants are in the order of 100μs. (e.g., 76.9μs used in the system studied in [21]).
2.3. Power Sources in Ship Power Systems
The power sources applied in electric ships vary with size and application and the power levels may vary from 60 kW [18] to 120 MW range. Moreover, the use of energy storage is shown to reduce the generator capacity requirement. In [23], the authors investigate a full electric ship in simulation capable of 1.16 MW power output out of which 500 kW is generated by gas turbine (GT) generators and the remaining power is managed with the use of solid oxide fuel cell (SOFC) and ESSs. On the other extreme, the authors of [16] investigate shipboard power systems for an aircraft carrier “capital ship” with generation capacity of 120 MW. In contrast, the power sources include diesel generator and gas turbine engines [24,25]. Medium power applications such as electric ferry ships may involve the power generation capacities in the order of 10 MW, e.g., 12 MVA system in [26]. Such examples demonstrate that the maritime power requirements significantly vary depending on the functionality of the ship.
Due to the high-power demands in naval and commercial shipping, nuclear power for marine power has been of interest since mid-20th century and has been applied for propulsion in the past[27,28]. However, nuclear powered IPSs have not appeared to have achieved popularity to date. In contrast, diesel electric and gas turbine electric systems have been widely adopted for power generation in ships. Integration of renewable energy sources has also been investigated in the past. For example, in [29,30] approximately 1% of power is generated by PV in the electric ship. In order to increase the penetration of renewable energy sources in marine power systems and also to accommodate the rapid varying loads, ESS based solutions found to be the key enabling technology. The use of ESS in ship microgrids is discussed in detail in Section 4.
3. Power Quality Issues and Regulations Applicable to Ship Microgrids
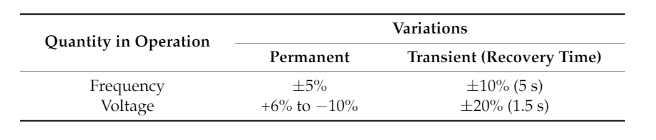
According to IEC standard 61000-4-30 power quality is defined as “characteristic of the electricity at a given point on an electrical system, evaluated against a set of reference technical parameters” [31], and this definition could be equally applicable for ship power systems. The main power quality issues in ship microgrids are listed in Table 2. According to Table 2, majority of the power quality issues can be attributed to the changes in voltage waveforms which are due to cyclic or non-cyclic load transients in the ship microgrid. In addition, frequency variations and harmonics are also becoming important power quality issues due to the increasing trend in deploying power electronically interfaced loads and generation sources in ship microgrids. It must be noted that both the frequency variations and the harmonic issues are present only in ac microgrids; however, voltage variations present in both ac and dc microgrids. With the growing more-electric trend, these power quality issues in ships are becoming an important area that requires standardization. In response to this need, ship classification societies have taken initiatives to define regulations for power quality in order to minimize the associated risk for ships, crew, cargo and seas. Table 3 shows the regulations imposed by classification societies for voltage and frequency variations for ac ship distribution systems [3].Electrical equipment on-board supplied from the main or emergency systems should be able to operate satisfactorily under these variations in voltage and frequency. The values in Table 3 are unified and unchanged for many years.
Table 2. Classification of Power Quality Issues in Ship Power System/Microgrid.

Table 3. Acceptable ranges of voltage and frequency variations in ac distribution systems.
Until recently, waveform distortion has not been taken seriously compared to voltage and frequency variations which changed after accident on-board of Queen Mary II. QMII is an all-electric cruise vessel with four diesel engines (4×16.8 MW) and two gas turbines (2×25 MW). The propulsion system consists of four pods each rated at 21.5 MW. In addition, there are three thrusters, 3.2 MW each, which are used to support manoeuvring of the ship. A thyristor based load commutated inverter(LCI) system is used to drive the high-power motors. Harmonics generated by these converters are suppressed by two passive harmonic filters (HFs) [5]. The accident on-board QMII occurred in September 2010, caused by the catastrophic failure of an aged capacitor and explosion in the aft harmonic filter room. According to the report of Marine Accident Investigation Branch, after several seconds the vessel blacked. It was concluded that “most likely that the disruption within the aft HF at the time of the accident caused general instability in the electrical network which could not be contained and led to the generators shutting down” [6]. As a result of accident, the importance of regulations on waveform distortion was highlighted and thus classification societies imposed an 8% limit for the total voltage harmonic distortion (THDV) in ship electrical distribution systems. Some classification societies, for instance DNV GL [7] or ABS [3], added additional requirements related to single harmonic content in the voltage waveform. According to these requirements, no single order voltage harmonic shall exceed 5%.
In addition to the standards and rules for civil or commercial ships, there are rules concerning navy vessels as well. For example, STANAG 1008 applies for the electrical power plants in NATO naval vessels. According to the STANAG 1008 the THDV factor should be less than 5% (up to voltage harmonic of 40th order) and no single order voltage harmonic shall exceed 3%. Moreover, the effect of operation of user equipment and resulting minimum harmonic distortion in the electrical power system is also taken into consideration in STANAG 1008. If rectifiers or power electronic converters are connected to the shipboard power system, power of the largest single distorting load Pdistort and the sum of the power of all loads ∑Pdistort which distort the current waveform should be determined and compared with the short circuit power of the generation capacity approximated as:
Ssc = 100 × Sn/x′′d% (1)
where Ssc represents the equivalent short circuit power of the supply system in kVA, Sn is the nominal apparent power of the feeding generators in kVA. x′′d% is the equivalent sub-transient reactance of the feeding generators as a percentage. The subsequent actions depend on results of the comparison which is shown in Table 4. If harmonics would be above permitted values, then measures should betaken to reduce the harmonics (multi-pulse rectifiers, filters, etc.).
Table 4. The STANAG 1008 requirements regarding maximum power of distorting loads, which does not require further detailed analysis.

4. Energy Storage Solution for Power Quality Improvement
4.1. Energy Storage Systems (ESSs) for Ship Microgrids
Different energy storage technologies are presently integrated into ship microgrids to manage the energy balance and provide auxiliary services to the ship power system. These energy storage technologies could be mainly categorised into four types: electrochemical devices (e.g., batteries, fuel cells), electrostatic devices (e.g., supercapacitors), electro-mechanical devices (e.g., flywheels), and electromagnetic devices (e.g., superconducting magnetic energy storage (SMES) systems). The energy density and power density are the two key features that could be used to characterise an energy storage system. The energy density is defined as the energy stored per-unit weight, hence energy density signifies the relative size of the storage system. The power density is defined as the amount of power that could be obtained for a per-unit weight. Figure 4 illustrates the power and energy density characteristics of different energy storage technologies suitable for ship microgrids.
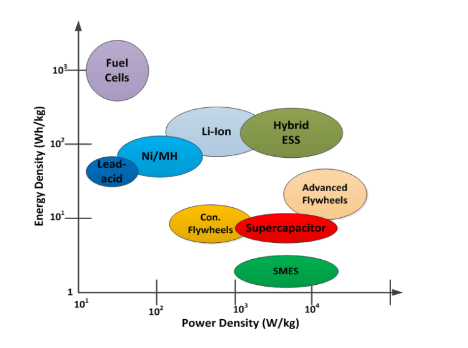
According to Figure 4, each technology has unique characteristics in terms of the power density and energy density and hence the technology selection should be carefully conducted considering the key performance requirement of the microgrid. Table 5 lists the advantages and challenges associated with each energy storage technology.
Table 5. Advantages and Disadvantages of Different Storage Technologies.

In addition to the energy storage technologies listed in Table 5, there are other storage technologies used in terrestrial microgrids such as compressed-air energy storage (CAES) systems and hydrogen generation and storage. In ships CAES systems are mainly used for powering hydraulic systems and engine start-up, but rarely used for storing electrical energy. This is mainly due to the large volume required. Fuel cells are currently being used as power generation sources in ship microgrids. Nevertheless, hydrogen generation through electrolysis as a way of energy storage and subsequent use in fuel cells has not drawn much attention and thus not explicitly discussed in this paper.
4.1.1. Battery Energy Storage Systems
Battery energy storage is the most commonly used energy storage technology in ship microgrids. The lead-acid, Li-ion, NiCad and NiMH are the most commonly used battery types in battery energy storage systems. However, the lead-acid batteries are rarely being used in energy storage system applications mainly due to their low energy density and low power density. Similarly, NiCad batteries also have low energy density and low power density and thus rarely being used in battery energy storage systems [34].
The most commonly used battery technology is the Li-Ion technology, which has high power density and high energy density in comparison to the other battery technologies available in the market. The Li-Ion batteries are maintenance free and also have the highest lifetime (at 80% depth-of-discharge(DoD)) over other battery types available in the market [37]. The battery technology continues to evolve with the help of nanotechnology, hence more power and energy dense batteries are likely to be manufactured in the future [35]. It must be noted that much higher current could be drawn beyond the rated current, however, it will degrade the battery performance and ultimately the life span. Therefore, ESSs based on battery systems are not suitable for providing rapid power response to mitigate the adverse effects from loads with high ramp rates.
4.1.2. Supercapacitors
Supercapacitors (also known as ultracapacitor) have the capability to release or absorb a large amount of power instantaneously than battery energy storage systems. In supercapacitors energy is stored in an electrostatic field and hence the charging and discharging cycles can be repeated without any limit and also it could be charged within a very short time span as oppose to batteries. The supercapacitor structure is different to a conventional capacitor due to its electrostatic double-layer and thinner carbon electrodes. These properties increase the capacitance of supercapacitor compared to conventional capacitor [38]. Even though Supercapacitors are widely used in automotive applications, they are not being heavily deployed in ship microgrids mainly due to relatively high cost and the low energy density. Supercapacitors are commonly used together with batteries in hybrid ESSs, which will be discussed in Section 4.1.5.
4.1.3. Flywheels
n fly-wheel ESSs the energy is stored as kinetic energy within its rotating mass and typically it has high power density than any other energy storage technology used at present. The flywheel is typically coupled with a generator/motor configuration to store and extract energy from the flywheel. At the charging stage, the flywheel is accelerated to store energy as the kinetic energy (usually rotated at 10,000–100,000 rpm) [39], while at the discharging phase it is decelerated to extract the kinetic energy and subsequently converted to the electrical energy. Typically, a power electronic frequency converter is used for advanced flywheel based ESSs to integrate with the microgrid, and it will enable flywheel to operate at a wide speed range. Flywheel-based ESSs can respond rapidly, and its respond time is typically 4–5ms. Hence, they can be used for mitigating power quality issues emanating from large pulse loads in ships. The main disadvantage being the low energy density, flywheel based ESSs cannot be used for delivering power quality and ancillary services for longer durations.
4.1.4. Superconducting Magnetic Energy Storage (SMES) Systems
n SMESs energy is stored in a magnetic field created by the superconducting coil. The super conducting coil is maintained below the critical superconducting temperature, by using an external cooling pump. This will make the resistance of the superconducting coil to zero, hence once the potential difference is removed, the current in the superconducting coil keep circulating in the coil without any losses. As the superconducting coil carries the dc current, it also requires a power electronic interface to integrate with the ac network of the ship. Therefore, SMESs are also a flexible energy storage option for mitigating power quality issues in ship microgrids. The SMESs are also capable of delivering power rapidly, hence can be used for mitigating power quality issues due to high pulsed loads. The SMESs are becoming very popular as an energy storage option for naval ships, hence it is vital to further investigate their usage in the context of mitigating power quality issues in ship microgrids.
4.1.5. Hybrid Energy Storage Systems
The hybrid energy storage systems are also proposed and developed in recent years to exploit the advantages of multiple energy storage technologies to fulfil various needs of microgrids [40–42].The most commonly proposed hybrid ESS uses batteries and supercapacitors, hence this ESS has the benefits from high energy density of batteries and high power density of supercapacitors [40,41].Therefore, supercapacitor will provide a transient power response for a short duration to mitigate the transient power quality issues, while the battery energy storage system will provide power quality support long durations.
In comparison to any other single ESS, the hybrid ESS requires complex control architectures [43], since different energy storage technologies have different characteristics, hence they should be optimally controlled to extract the maximum benefit from both energy systems. For example, energy storage system with high power density should be used to compensate for the transient compensation while energy-intensive component should be used for compensating low-frequency component. Various power architectures have also been proposed for hybrid ESSs and these architectures are discussed in [40].
4.2. Managing Power Quality Issues
In terrestrial microgrids, most of the generation sources are based on inverter-interfaced generation sources, and ESSs are also interfaced through power electronic converter systems. Therefore, the output current could be controlled instantaneously to mitigate power quality issues in microgrids. Nevertheless, the rapid response capability of inverter systems is limited by the characteristics of the energy storage devices. As discussed earlier, high power density and rapid response are vital characteristics of ESSs to provide rapid energy needs dictated by the inverter. Therefore, based on nature of the power quality disturbance, appropriate ESS should be selected for the inverter system. This section delineates various strategies used in terrestrial microgrids to mitigate power quality issues.
4.2.1. Managing Voltage Sags/Dips
The voltage sags are closely related to the low-voltage ride -through (FRT) studies in microgrids; hence relevant literature reports strategies that can be used to mitigate voltage sags [44–48], as well as LVRT strategies for microgrids [49–51]. Therefore, both voltage sag mitigation strategies and LVRT strategies are discussed here. Reactive power control is the most commonly used strategies are discussed here.
Reactive power control is the most commonly used strategy for mitigating voltage sags in microgrids, and will also allow microgrid to ride-through faults [46]. This strategy is commonly known as Q/V droop control. Reactive power control/injection could be achieved either using existing power electronics based sources or additional dynamic reactive power devices, such as static synchronous compensators (STATCOMs) [44,51]. STATCOM is a system that can combine both active and reactive power capabilities into a single converter to achieve both frequency and voltage regulation and thus becoming popular in modern power systems. In Q/V droop control strategy, the error between actual and reference voltage is calculated (see Figure 5) and then processed through a droop constant (Kv_droop) to generate the reactive power reference (Qref), and based on the voltage error, the STATCOM will inject reactive power to the microgrid to compensate the voltage sag [51].

A unified power quality conditioner proposed in [47] also adopted a similar control strategy for mitigating voltage sags in microgrids. Thus, a similar reactive power control strategy could be also adopted for power electronic interfaced ESSs in microgrids [45]. However, the ESS should be able to release large transient energy for mitigating large voltage sags in the microgrid. Thus, it is essential to select the appropriate energy storage technology (i.e., energy storage technology with high power density) if the ESS is dictated to mitigate voltage sags in the microgrid network. For example, in [50],a supercapacitor-based ESS is proposed for improving FRT capability of the microgrid.
However, effectiveness of the reactive power control strategy for voltage sag mitigation depends on the X/R ratio of the network, since the network voltage becomes less sensitive to reactive power when the network is predominantly resistive. Typically, if the network voltage is less than 11 kV, the X/R ratio becomes less than unity and hence active power becomes more dominant over reactive power when controlling the network voltage. Therefore, it is vital to assess the network impedance characteristics before implementing voltage sag mitigation through power electronic interfaced ESSs.
As delineated in [50], the voltage sags could be symmetrical or asymmetrical, therefore under asymmetrical voltage sags both positive and negative sequence voltage should be compensated in order mitigate the voltage sag and improve the LVRT capability to the microgrid. A negative and positive sequence droop based control method is proposed in [34] to mitigate the asymmetrical voltage sags in microgrids. In this sequence/droop based strategy appropriate proportions of positive and negative sequence active and reactive power are injected to the network to mitigate the voltage sag in the network. As this strategy is developed for a 3-phase voltage source inverter (VSI) based distributed generation (DG) systems, similar strategy could be adopted for an ESS interfaced with 3-phase VSI.
4.2.2. Managing Voltage Unbalance
The voltage unbalance is another major power quality issue reported in ac microgrids. The excessive voltage unbalance could cause induction motor driven pumps to overheat and ultimately lead to immature failure of the motor. The voltage unbalance is mainly caused by the unevenly distributed single-phase loads in the microgrid. Load reconfiguration is one option, however due to the stochastic nature of the loads, load reconfiguration does not always guarantee a perfect distribution of load in all three phases in the microgrid.
Various voltage unbalance mitigation strategies have been proposed for microgrids [52–55] and strategies are mainly implemented at the power electronic converter of the distributed generator. In every strategy, positive and negative sequence voltages are extracted and subsequently positive and negative sequence components are controlled separately to mitigate the voltage unbalance in he microgrid.
In [52], voltage unbalance mitigation strategy was implemented for DGs and active power filter in a microgrid. The hierarchical control strategy is used in [52] in which primary control was used for power sharing among DGs, while at the secondary control voltage unbalance mitigation strategy was implemented. Furthermore, this strategy only activates when the microgrid violates the maximum voltage unbalance factor (VUF) allowed for the microgrid. Voltage unbalance mitigation strategy proposed in [53] deploys a direct voltage unbalance compensation scheme by controlling the negative sequence reactive power in the synchronous reference frame. The advantage of this strategy is that it can continuously control voltage unbalance in the microgrid. Authors in [54] have proposed to control the active and reactive power ripple in order to attenuate the voltage unbalance in the microgrid. A factor called “K” was defined by the authors in order to command active and reactive power ripple from the DG. Therefore, by varying the K factor based on the network characteristics (i.e., X/R ratio)and the unbalance level, voltage unbalance could be mitigated in the microgrid. Since all these strategies are implemented in 3-phase VSIs, these strategies could be adopted for ESSs interfaced with 3-phase VSIs.
4.2.3. Managing Harmonics and Resonance Issues
Due to non-linear power electronic loads connected on-board, ship power network may contain significant harmonics in their network and subsequently may lead to detrimental resonance issues in the network. The most common method of eliminating harmonics is connecting passive filters in series with the harmonic emission source, which could be either a non-linear power electronic load or power electronic based distributed generator. However, the main focus here being reviewing the active harmonic elimination techniques used in microgrids.
A range of harmonic and resonance elimination techniques has been proposed, mainly focusing on terrestrial microgrids [55–62]. The harmonic mitigation strategies are proposed for both voltage and current harmonics in microgrids. The most commonly proposed methods are selective harmonic current injection for current harmonic mitigation [55,56,61], virtual grid impedance [31,32],resistive active power filter [59], repetitive control methods [60], and using additional devices such as D-STATCOM [35].
In selective harmonic current injection, it is required to have a good understanding of the nature of the harmonic currents to inject opposing currents by the VSI to cancel out the harmonics in the microgrid [55–58]. Therefore, in addition to the main load current reference an additional harmonic current is added to the current reference of the battery inverter as stated in [55]. A similar selective harmonic compensation scheme has been proposed in references [56] for the DGs in the microgrid.
In order to share the harmonic current injections equally among all the DG inverters a virtual impedance has also been proposed in this paper.
A virtual impedance is added to the control loop in [58] to attenuate the harmonic current injections by DGs due to voltage distortions present in the network. Since larger the voltage distortion, higher the harmonic current injections by inverter interfaced DGs. In addition, a capacitive virtual impedance has been proposed in order to share the harmonic compensation load equally among all DGs. In [58], a virtual impedance method has also been used for the damping harmonic voltages due to the adverse effect of the grid-side inductor of the LCL filter.
In addition, resistive active filter methods are also proposed in the literature to suppress harmonics in small grids, similar to the size of microgrids. In this proposed active filter, harmonic voltages are extracted in synchronous reference frame and subsequently drive the current regulator to produce a voltage command to suppress harmonic voltages [59]. Furthermore, repetitive control methods have also been proposed for voltage harmonic suppression, and also used D-STATCOMs to suppress harmonics in the network.
4.2.4. Managing Frequency Excursions
In terrestrial microgrids, ESSs play an important role in maintaining the power balance in the microgrid. The ac network frequency is considered as the main indicator for the power balance in ac microgrids, hence the ESSs can be primarily controlled based on the microgrid ac network frequency.
When the ac network frequency increases the ESS could be charged, while ac system frequency decreases it could be discharged to balance the power. The system response during frequency variations can be mainly divided into three types: primary, secondary and tertiary. During the primary response, conventional generators will release the stored kinetic energy within first few seconds, and subsequently the generator governor increases the power output based on the error between the actual frequency and reference frequency. The primary response is vital in maintaining the frequency stability of the ac grid, as the failure to maintain the frequency within a defined frequency band would cause failure in the entire network. However, microgrids are typically comprised of inverter-interfaced generation sources; hence they would not respond naturally to system frequency variations.
In the published literature, various strategies have been proposed to emulate inertial response or frequency response for power electronics based wind generation systems [63–66]. As the ESSs are also interfaced through power electronic converter systems, the emulated frequency response strategies can also be applied to ESS control scheme. This could be achieved by adding an additional control loop to the main active power control loop of the energy storage system to increase the power output in order to mitigate the frequency drop [64].
The use of energy storage technologies for mitigating voltage and frequency fluctuations is well explored in the recent literature [67–69]. In majority of the ac systems, where the grid is considered to be predominantly inductive, the ESSs are designed to exchange active power to regulate the frequency. If there is a sudden change of the load, ESS can acts fast to supply the power deficit or absorb the surplus power and thus the system frequency stays within a predefined range. This approach is commonly known as P/f control.
4.3. Challenges of Incorporating Power Quality Mitigation Strategies to ESSs
Although there is a range of energy storage technologies available for ship microgrids, the main challenge being the accurate selection and design of the energy storage system to counteract the specific power quality issue in the ship microgrid. Traditionally ESSs are chosen based on emergency energy needs and economic considerations, hence the characteristics associated the ESS is treated as a secondary requirement. For example, if a battery based ESS is chosen to mitigate voltage sags caused by high pulsed loads, then the ESS could fail over time due to its incapability to deliver high power at fast ramp rates. Thus, the main challenge is the selection of the appropriate technology to suit power quality issues and other traditional requirements. Perhaps the ESS designer should make a trade-off between the traditional needs and power quality needs when designing ESSs for future ship microgrids. The hybrid energy storage is one of the viable option to fulfil this requirement.
The above mentioned P/f and Q/V control approach is suitable only for more inductive systems [70], which are generally high voltage systems. Nevertheless, low voltage ac power systems, which are commonly found in ships, are more resistive than inductive, and thus a different approach should be used. In such systems, active power has a greater influence on the voltage and thus ESSs are needed to exchange active power for voltage regulation with reactive power exchange being controlled to regulate frequency. In dc ship power systems, the ESSs are used to regulate the voltage by supplying the deficit of power or absorbing the surplus of power. The control of the interfacing power converter is straight forward, as it does not involve synchronization of frequency control. In summary, it is clear that irrespective of the type and characteristics of the power system, ESS should act fast to keep the voltage and frequency within a permissible range.
Power levels of the converters used to drive propulsion motors or other large motors in pumps, fans or thrusters are very high and they work relatively at low frequencies. Consequently, waveform distortion, commonly known as harmonic distortion produced by these converters are very high. A common solution used to reduce harmonic distortion is the use of passive filters which are heavy, bulky, and less reliable, mainly due to the capacitors in these filters. As an alternative, ESS interfacing power converters can be used as an active filter as well and thereby mitigate harmonics produced by large motor drives.
5. Concluding Remarks
With the extensive use of power electronic converters and range of high power rapid response loads in ship microgrids, issues related to power quality are becoming significant. Thus, this review paper categorically analysed the range of power quality issue in ship microgrids and subsequently discussed mitigation strategies using different types of ESSs and various control mechanisms. The majority of ESSs are dc in nature and low in operating voltage levels and thus interfacing dc-dc or dc-ac converters are essential for integrating them to the ship power systems. Since the ESSs are used only as a supporting system their power levels are relatively low and thus high frequency switching is possible in these converters. This allows them to respond fast and reduce waveform distortions.
The mitigation strategies are primarily based on strategies proposed for terrestrial microgrids, as the same strategies could be implemented at the power electronic converter interfaced energy sources. This paper highlights that when implementing these strategies, characteristics of the ESSs should be carefully analysed as the power density and energy density greatly affect the effectiveness of the mitigation strategy. Thus, it is important to select the appropriate energy storage technology considering the type of power quality issue(s) being addressed.
Conflicts of Interest: The authors declare no conflict of interest.
References
- McCoy, T.J. Trends in ship electric propulsion. In Proceedings of the 2002 IEEE Power Engineering Society Summer Meeting, Chicago, IL, USA, 21–25 July 2002; Volume 1, pp. 343–346.
- Chalfant, J.S.; Chryssostomidis, C. Analysis of various all-electric-ship electrical distribution system topologies. In Proceedings of the 2011 IEEE Electric Ship Technologies Symposium, Alexandria, VA, USA, 10–13 April 2011; pp. 72–77.
- American Bureau of Shipping. International Naval Ships, Guide for Building and Classing, Part 4 Vessel Systems and Machinery, American Bureau of Shipping; 2016 International Association of Classification Societies, Requirements Concerning Electrical and Electronic Installations; IACS Req.: Houston, TX, USA, 2016. [Google Scholar]
- Sulligoi, G.; Vicenzutti, A.; Tironi, E.; Corti, M.; Lamedica, R.; Ruvio, A.; Lipardi, G.; Piva, L. Naval smart grid: Integrated Power System for all electric naval vessels with control and reliability characteristics. In Proceedings of the AEIT Annual Conference—From Research to Industry: The Need for a More Effective Technology Transfer (AEIT), Trieste, Italy, 18–19 September 2014; pp. 1–6.
- QUEEN MARY II Technical Information. Available online: http://www.cunard.com/documents/press%20kits/queen%20mary%202/queen_mary_2_technical.pdf (accessed on 12 November 2016).
- Report on the Investigation of the Catastrophic Failure of a Capacitor in the AFT Harmonic Filter Room on Board RMS Queen Mary 2 while Approaching Barcelona on 23 September 2010. Report No 28/2011. Available online: http://www.maib.gov.uk/publications/investigation_reports/2011/qm2.cfm (accessed on 12 November 2016).
- Rules for Classification Ships, Part 4 Systems and components, Chapter 8 Electrical installations. Det Norske Veritas GL Edition: Høvik, Norway, 2011. Available online: https://rules.dnvgl.com/docs/pdf/DNV/rulesship/2011-01/ts408.pdf (accessed on 12 November 2016).
- Wolfe, J.; Roa, M. Advanced Methods for Tabulation of Electrical Loads during Special Modes of Marine Vessel Operation. IEEE Trans. Ind. Appl. 2017, 53, 667–674. [Google Scholar] [CrossRef]
- Skjong, E.; Rødskar, E.; Molinas, M.; Johansen, T.; Cunningham, J. The marine vessel’s electrical power system: From its birth to present day. Proc. IEEE 2015, 103, 2410–2424. [Google Scholar] [CrossRef]
- Hegner, H.; Desai, B. Integrated fight through power. In Proceedings of the 2002 IEEE Power Engineering Society Summer Meeting, Chicago, IL, USA, 21–25 July 2002; pp. 336–339.
- Rose, M.W.; Cuzner, R.M. Fault isolation and reconfiguration in a three-zone system. In Proceedings of the 2015 IEEE Electric Ship Technologies Symposium (ESTS), Alexandria, VA, USA, 21–24 June 2015; pp. 409–414.
- Bose, S.; Natarajan, B.; Scoglio, C.; Das, S.; Schulz, N.N. Analysis of robustness for shipboard power system with non-radial power flow. In Proceedings of the 2011 IEEE Electric Ship Technologies Symposium, Alexandria, VA, USA, 10–13 April 2011; pp. 181–186.
- Hansen, J.F.; Wendt, F. History and State of the Art in Commercial Electric Ship Propulsion, Integrated Power Systems, and Future Trends. Proc. IEEE 2015, 103, 2229–2242. [Google Scholar] [CrossRef]
- Dubey, A.; Santoso, S. Availability-Based Distribution Circuit Design for Shipboard Power System. IEEE Trans. Smart Grid 2015. [Google Scholar] [CrossRef]
- Schuddebeurs, J.D.; Norman, P.J.; Booth, C.D.; Burt, G.M.; McDonald, J.R. Emerging Research Issues Regarding Integrated-Full-Electric-Propulsion. In Proceedings of the 41st International Universities Power Engineering Conference, Newcastle-upon-Tyne, UK, 6–8 September 2006; pp. 669–673.
- Bosich, D.; Vicenzutti, A.; Pelaschiar, R.; Menis, R.; Sulligoi, G. Toward the future: The MVDC large ship research program. In Proceedings of the 2015 AEIT International Annual Conference (AEIT), Naples, Italy, 14–16 October 2015; pp. 1–6.
- Apsley, J.M.; Gonzalez-Villasenor, A.; Barnes, M.; Smith, A.C.J.; Williamson, S.; Schuddebeurs, J.D.; Norman, P.J.; Booth, C.D. Propulsion Drive Models for Full Electric Marine Propulsion Systems. IEEE Trans. Ind. Appl. 2009, 45, 676–684. [Google Scholar] [CrossRef]
- Chen, X.; Wang, X. A novel wound rotor BDFIG for ship shaft generator application—Control and prototype tests. In Proceedings of the 2014 17th International Conference on Electrical Machines and Systems (ICEMS), Hangzhou, China, 22–25 October 2014; pp. 1196–1200.
- IEEE Industry Applications Society. 1709–2010—IEEE Recommended Practice for 1 kV to 35 kV Medium-Voltage DC Power Systems on Ships; IEEE Standard: New York, NY, USA, 2010; pp. 1–54. [Google Scholar]
- Feng, X.; Butler-Purry, K.L.; Zourntos, T. Multi-Agent System-Based Real-Time Load Management for All-Electric Ship Power Systems in DC Zone Level. IEEE Trans. Power Syst. 2012, 27, 1719–1728. [Google Scholar] [CrossRef]
- Pico, H.N.V.; Aliprantis, D.C.; Sudhoff, S.D. Reachability analysis of shipboard power systems with uncertain pulsed loads. In Proceedings of the 2015 IEEE Electric Ship Technologies Symposium (ESTS), Alexandria, VA, USA, 21–24 June 2015; pp. 395–402.
- Van der Burgt, J.J.A.; van Gelder, P.; van Dijk, E. Pulsed power requirements for future naval ships. In Proceedings of the 1999 12th IEEE International Pulsed Power Conference, Digest of Technical Papers, Monterey, CA, USA, 27–30 June 1999; Volume 2, pp. 1357–1360.
- Jiang, W.; Fang, R.; Khan, J.; Dougal, R. Performance Prediction and Dynamic Simulation of Electric Ship Hybrid Power System. In Proceedings of the 2007 IEEE Electric Ship Technologies Symposium, Arlington, VA, USA, 21–23 May 2007; pp. 490–497.
- Jin, Z.; Sulligoi, G.; Cuzner, R.; Meng, L.; Vasquez, J.C.; Guerrero, J.M. Next-Generation Shipboard DC Power System: Introduction Smart Grid and dc Microgrid Technologies into Maritime Electrical Networks. IEEE Electrif. Mag. 2016, 4, 45–57. [Google Scholar] [CrossRef]
- Vijlee, S.Z.; Ouroua, A.; Domaschk, L.N.; Beno, J.H. Directly-Coupled Gas Turbine Permanent Magnet Generator Sets for Prime Power Generation on Board Electric Ships. In Proceedings of the 2007 IEEE Electric Ship Technologies Symposium, Arlington, VA, USA, 21–23 May 2007; pp. 340–347.
- Mashayekh, S.; Wang, Z.; Qi, L.; Lindtjorn, J.; Myklebust, T.A. Optimum sizing of energy storage for an electric ferry ship. In Proceedings of the 2012 IEEE Power and Energy Society General Meeting, San Diego, CA, USA, 22–26 July 2012; pp. 1–8.
- Schwoerer, F.; Witzig, W.F. Nuclear power today and tomorrow. IEEE Spectr. 1964, 1, 120–130. [Google Scholar] [CrossRef]
- Donnelly, W. Nuclear Power and Merchant Shipping; U.S. Atomic Energy Commission, Division of Technical Information: Oak Ridge, TN, USA, 1964. [Google Scholar]
- Guo, C.; Sun, Y.; Yuan, C.; Yan, X.; Wang, Y.; Jiang, Q. Research on power load flow calculation for photovoltaic-ship power system based on PSAT. In Proceedings of the 2015 International Conference on Renewable Energy Research and Applications (ICRERA), Palermo, Italy, 22–25 November 2015; pp. 443–448.
- Tsekouras, G.J.; Kanellos, F.D.; Prousalidis, J. Simplified method for the assessment of ship electric power systems operation cost reduction from energy storage and renewable energy sources integration. IET Electr. Syst. Transp. 2015, 5, 61–69. [Google Scholar] [CrossRef]
- IEC 61000-4-30:2015. Electromagnetic Compatibility (EMC)—Part 4-30: Testing and Measurement Techniques—Power Quality Measurement Methods; International Electrotechnical Commission: Geneva, Switzerland, 2015. [Google Scholar]
- Mindykowski, J. Case Study—Based Overview of Some Contemporary Challenges to Power Quality in Ship Systems. Inventions 2016, 1, 12. [Google Scholar] [CrossRef]
- Domaschk, L.N.; Ouroua, A.; Hebner, R.E.; Bowlin, O.E.; Colson, W.B. Coordination of Large Pulsed Loads on Future Electric Ships. IEEE Trans. Magn. 2007, 43, 450–455. [Google Scholar] [CrossRef][Green Version]
- Musolino, V.; Piegari, L.; Tironi, E. Technical and economical evaluation of storage systems in naval applications. In Proceedings of the 2013 International Conference on Clean Electrical Power (ICCEP), Alghero, Italy, 11–13 June 2013; pp. 120–127.
- Hebner, R.E.; Davey, K.; Herbst, J.; Hall, D.; Hahne, J.; Surls, D.D.; Ouroua, A. Dynamic Load and Storage Integration. Proc. IEEE 2015, 103, 2344–2354. [Google Scholar] [CrossRef]
- Evans, I.C.; Hoevenaars, A.H.; Eng, P. Meeting Harmonic Limits on Marine Vessels. In Proceedings of the 2007 IEEE Electric Ship Technologies Symposium, Arlington, VA, USA, 21–23 May 2007; pp. 115–121.
- Musolino, V.; Piegari, L.; Tironi, E. Storage systems for transportation, land handling and naval applications. In Proceedings of the Electrical Systems for Aircraft, Railway and Ship Propulsion (ESARS), Bologna, Italy, 16–18 October 2012; pp. 1–9.
- Guerrero, M.A.; Romero, E.; Barrero, F.; Milanes, M.I.; Gonzalez, E. Supercapacitors: Alternative Energy Storage Systems. Prz. Elektrotech. 2009, 85, 188. [Google Scholar]
- Akinyele, D.O.; Rayudu, R.K. Review of Energy Storage Technologies for Sustainable Power Networks. Sustain. Energy Technol. Assess. 2014, 8, 74–91. [Google Scholar] [CrossRef]
- Adhikari, S.; Lei, Z.; Peng, W.; Tang, Y. A battery/supercapacitor hybrid energy storage system for DC microgrids. In Proceedings of the 2016 IEEE 8th International Power Electronics and Motion Control Conference (IPEMC-ECCE Asia), Hefei, China, 22–26 May 2016; pp. 1747–1753.
- Vechiu, I.; Etxeberria, A.; Camblong, H.; Vinassa, J.M. Three-level Neutral Point Clamped Inverter Interface for flow battery/supercapacitor Energy Storage System used for microgrids. In Proceedings of the 2011 2nd IEEE PES International Conference and Exhibition on Innovative Smart Grid Technologies (ISGT Europe), Manchester, UK, 5–7 December 2011; pp. 1–6.
- Xiao, J.; Wang, P.; Setyawan, L. Hierarchical Control of Hybrid Energy Storage System in DC Microgrids. IEEE Trans. Ind. Electron. 2015, 62, 4915–4924. [Google Scholar] [CrossRef]
- Kollimalla, S.K.; Mishra, M.K. Coordinated control and energy management of hybrid energy storage system in PV system. In Proceedings of the 2014 International Conference on Computation of Power, Energy, Information and Communication (ICCPEIC), Chennai, India, 16–17 April 2014; pp. 363–368.
- Srivatchan, N.S.; Rangarajan, P.; Rajalakshmi, S. Control Scheme for Power Quality Improvement in Islanded Microgrid Operation. Procedia Technol. 2015, 21, 212–215. [Google Scholar] [CrossRef]
- Meegahapola, L.G.; Robinson, D.; Agalgaonkar, A.P.; Perera, S.; Ciufo, P. Microgrids of Commercial Buildings: Strategies to Manage Mode Transfer from Grid Connected to Islanded Mode. IEEE Trans. Sustain. Energy 2014, 5, 1337–1347. [Google Scholar] [CrossRef]
- Zhao, X.; Guerrero, J.M.; Savaghebi, M.; Vasquez, J.C.; Wu, X.; Sun, K. Distributed low voltage ride-through operation of power converters in grid-connected microgrids under voltage sags. In Proceedings of the IECON 2015—41st Annual Conference of the IEEE Industrial Electronics Society, Yokohama, Japan, 9–12 November 2015; pp. 1909–1914.
- Gayatri, M.T.L.; Parimi, A.M.; Kumar, A.V.P. Utilization of Unified Power Quality Conditioner for voltage sag/swell mitigation in microgrid. In Proceedings of the 2016 Biennial International Conference on Power and Energy Systems: Towards Sustainable Energy (PESTSE), Bangalore, India, 21–23 January 2016; pp. 1–6.
- Gayatri, M.T.L.; Parimi, A.M.; Kumar, A.V.P. Application of Dynamic Voltage Restorer in microgrid for voltage sag/swell mitigation. In Proceedings of the 2015 IEEE Power, Communication and Information Technology Conference (PCITC), Bhubaneswar, India, 15–17 October 2015; pp. 750–755.
- Zhao, X.; Guerrero, J.M.; Savaghebi, M.; Vasquez, J.C.; Wu, X.; Sun, K. Low Voltage Ride-Through Operation of Power Converters in Grid-Interactive Microgrids by Using Negative-Sequence Droop Control. IEEE Trans. Power Electron. 2016. [Google Scholar] [CrossRef]
- Gkavanoudis, S.I.; Oureilidis, K.O.; Demoulias, C.S. Fault ride-through capability of a microgrid with wtgs and supercapacitor storage during balanced and unbalanced utility voltage sags. In Proceedings of the 2013 International Conference on Renewable Energy Research and Applications (ICRERA), Madrid, Spain, 20–23 October 2013; pp. 231–236.
- Jayawardena, A.V.; Meegahapola, L.G.; Robinson, D.A.; Perera, S. Low-voltage ride-through characteristics of microgrids with distribution static synchronous compensator (DSTATCOM). In Proceedings of the 2015 Australasian Universities Power Engineering Conference (AUPEC), Wollongong, Australia, 27–30 September 2015; pp. 1–6.
- Hashempour, M.M.; Savaghebi, M.; Vasquez, J.C.; Guerrero, J.M. Voltage unbalance and harmonic compensation in microgrids by cooperation of distributed generators and active power filters. In Proceedings of the 2016 7th Power Electronics and Drive Systems Technologies Conference (PEDSTC), Tehran, Iran, 16–18 February 2016; pp. 646–651.
- Zhao, X.; Wu, X.; Meng, L.; Guerrero, J.M.; Vasquez, J.C. A direct voltage unbalance compensation strategy for islanded microgrids. In Proceedings of the 2015 IEEE Applied Power Electronics Conference and Exposition (APEC), Charlotte, NC, USA, 15–19 March 2015; pp. 3252–3259.
- Kabiri, R.; Holmes, D.G.; McGrath, B.P. Control of Active and Reactive Power Ripple to Mitigate Unbalanced Grid Voltages. IEEE Trans. Ind. Appl. 2016, 52, 1660–1668. [Google Scholar] [CrossRef]
- Xu, L.; Miao, Z.; Fan, L.; Gurlaskie, G. Unbalance and harmonic mitigation using battery inverters. In Proceedings of the North American Power Symposium (NAPS), Charlotte, NC, USA, 4–6 October 2015; pp. 1–6.
- Savaghebi, M.; Vasquez, J.C.; Jalilian, A.; Guerrero, J.M.; Lee, T.L. Selective harmonic virtual impedance for voltage source inverters with LCL filter in microgrids. In Proceedings of the 2012 IEEE Energy Conversion Congress and Exposition (ECCE), Raleigh, NC, USA, 15–20 September 2012; pp. 1960–1965.
- Micallef, A.; Apap, M.; Spiteri-Staines, C.; Guerrero, J.M. Mitigation of Harmonics in Grid-Connected and Islanded Microgrids via Virtual Admittances and Impedances. IEEE Trans. Smart Grid 2015. [Google Scholar] [CrossRef]
- He, J.; Li, Y.W.; Wang, R.; Zhang, C. Analysis and Mitigation of Resonance Propagation in Grid-Connected and Islanding Microgrids. IEEE Trans. Energy Convers. 2015, 30, 70–81. [Google Scholar] [CrossRef]
- Lee, T.L.; Hu, S.H. Discrete Frequency-Tuning Active Filter to Suppress Harmonic Resonances of Closed-Loop Distribution Power Systems. IEEE Trans. Power Electron. 2011, 26, 137–148. [Google Scholar]
- Yang, S.; Wang, P.; Tang, Y.; Zhang, L. Explicit Phase Lead Filter Design in Repetitive Control for Voltage Harmonic Mitigation of VSI-based Islanded Microgrids. IEEE Trans. Ind. Electron. 2017, 64, 817–826. [Google Scholar] [CrossRef]
- Savaghebi, M.; Guerrero, J.M.; Jalilian, A.; Vasquez, J.C. Mitigation of voltage and current harmonics in grid-connected microgrids. In Proceedings of the 2012 IEEE International Symposium on Industrial Electronics (ISIE), Hangzhou, China, 28–31 May 2012; pp. 1610–1615.
- Goyal, M.; John, B.; Ghosh, A. Harmonic mitigation in an islanded microgrid using a D-STATCOM. In Proceedings of the 2015 IEEE PES Asia-Pacific Power and Energy Engineering Conference (APPEEC), Brisbane, Australia, 15–18 November 2015.
- Morren, J.; de Haan, S.W.H.; Kling, W.L.; Ferreira, J.A. Wind turbines emulating inertia and supporting primary frequency control. IEEE Trans. Power Syst. 2006, 21, 433–434. [Google Scholar] [CrossRef]
- Ramtharan, G.; Ekanayake, J.B.; Jenkins, N. Frequency support from doubly fed induction generator wind turbines. IET Renew. Power Gener. 2007, 1, 3–9. [Google Scholar] [CrossRef]
- Conroy, J.F.; Watson, R. Frequency Response Capability of Full Converter Wind Turbine Generators in Comparison to Conventional Generation. IEEE Trans. Power Syst. 2008, 23, 649–656. [Google Scholar] [CrossRef]
- Meegahapola, L.G.; Flynn, D. Investigation of frequency stability during high penetration of CCGTs and variable-speed wind generators in electricity networks. In Proceedings of the 2015 IEEE Power & Energy Society General Meeting, Denver, CO, USA, 26–30 July 2015; pp. 1–5.
- Tan, Y.; Muttaqi, K.; Ciufo, P.; Meegahapola, L. Enhanced Frequency Response Strategy for PMSG Based Wind Energy Conversion System Using Ultracapacitor in Remote Area Power Supply Systems. IEEE Trans. Ind. Appl. 2016, in press. [Google Scholar]
- Sebastián, R. Application of a battery energy storage for frequency regulation and peak shaving in a wind diesel power system. IET Gener. Transm. Distrib. 2016, 10, 764–770. [Google Scholar] [CrossRef]
- Stroe, D.I.; Knap, V.; Swierczynski, M.; Stan, A.; Teodorescu, R. Operation of Grid-Connected Lithium-Ion Battery Energy Storage System for Primary Frequency Regulation: A Battery Lifetime Perspective. IEEE Trans. Ind. Appl. 2017, 53, 430–438. [Google Scholar] [CrossRef]
- Rocabert, J.; Luna, A.; Blaabjerg, F.; Rodríguez, P. Control of Power Converters in AC Microgrids. IEEE Trans. Power Electron. 2012, 27, 4734–4749. [Google Scholar] [CrossRef]
Article Source: Inventions 2017, 2(1), 4; https://doi.org/10.3390/inventions2010004 https://www.mdpi.com/2411-5134/2/1/4/htm