The Scope of Power Quality

Published by CEA Technologies Inc. (CEATI), POWER QUALITY Energy Efficiency Reference Guide, Chapter 1 – The Scope of Power Quality.


1.1 Definition of Power Quality

The Institute of Electrical and Electronic Engineers (IEEE) defines power quality as:

“The concept of powering and grounding electronic equipment in a manner that is suitable to the operation of that equipment and compatible with the premise wiring system and other connected equipment.” 1

Making sure that power and equipment are suitable for each other also means that there must be compatibility between the electrical system and the equipment it powers. Th ere should also be compatibility between devices that share the electrical distribution space. This concept is called Electromagnetic Compatibility (“EMC”) and is defined as:

“the ability of an equipment or system to function satisfactorily in its electromagnetic environment without introducing intolerable electromagnetic disturbances to anything in that environment.” 2

The best measure of power quality is the ability of electrical equipment to operate in a satisfactory manner, given proper care and maintenance and without adversely aff ecting the operation of other electrical equipment connected to the system.


1 – IEEE-Std 1100-1999, IEEE Recommended Practice for Powering and Grounding Electronic Equipment, New York, IEEE 1999.
2 – A definition from the IEC at http://www.iec.ch/zone/emc/whatis.htm

1.2 Voltage

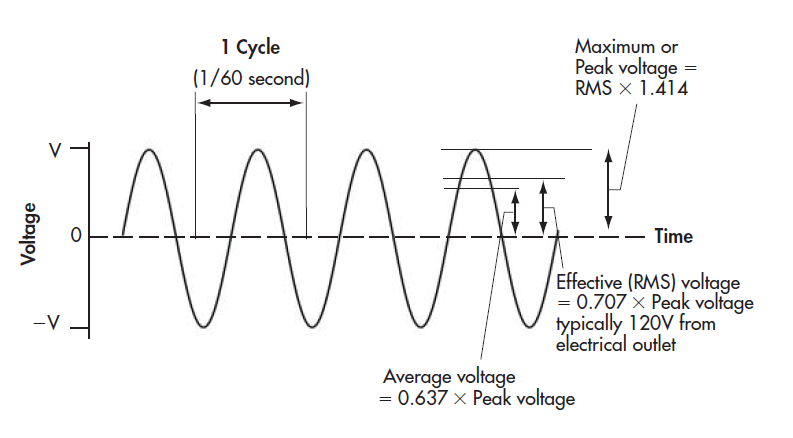
The voltage produced by utility electricity generators has a sinusoidal waveform with a frequency of 60 Hz in North America and 50 Hz in many other parts of the world. This frequency is called the fundamental frequency.

Figure 1: Pure Sinusoidal AC Voltage Waveform

Any variation to the voltage waveform, in magnitude or in frequency, is called a power line deviation. However, not all power line deviations result in disturbances that can cause problems with the operation of electrical equipment.

1.2.1 Voltage Limits

Excessive or reduced voltage can cause wear or damage to an electrical device. In order to provide standardization, recommended voltage variation limits at service entrance points are specified by the electrical distributor or local utility. An example of typical voltage limits is shown in the table below.

Table: Typical Voltage Limits

In addition to system limits, Electrical Codes specify voltage drop constraints; for instance:

(1) The voltage drop in an installation shall:

  • Be based upon the calculated demand load of the feeder or branch circuit.
  • Not exceed 5% from the supply side of the consumer’s service (or equivalent) to the point of utilization.
  • Not exceed 3% in a feeder or branch circuit.

(2) The demand load on a branch circuit shall be the connected load, if known, otherwise 80% of the rating of the overload or over-current devices protecting the branch circuit, whichever is smaller.3


3 – Check with your local Authority Having Jurisdiction for rules in your area.

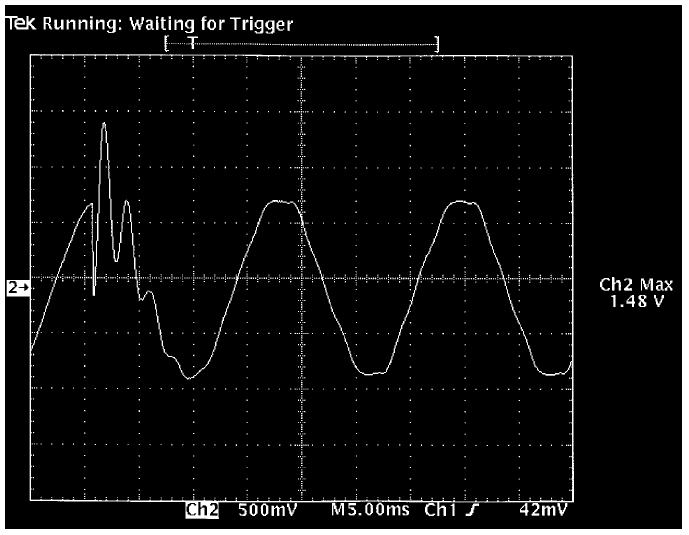
For voltages between 1000 V and 50 000 V, the maximum allowable variation is typically ±6% at the service entrance. There are no comparable limits for the utilization point. These voltage ranges exclude fault and temporary heavy load conditions. An example of a temporary heavy load condition is the startup of a motor. Since motors draw more current when they start than when they are running at their operating speed, a voltage sag may be produced during the initial startup.

Figure 2: RMS Voltage and Current Produced when Starting a Motor

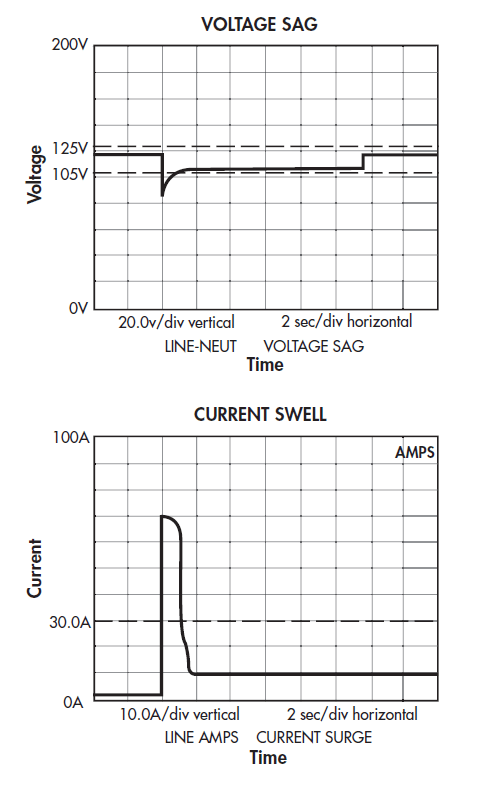
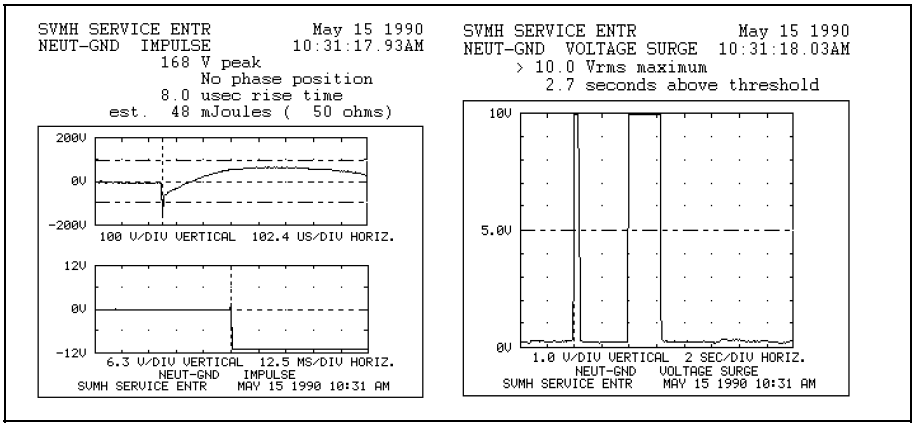
(Reproduced with Permission of Basic Measuring Instruments, from “Handbook of Power Signatures”, A. McEachern, 1988)

It is not technically feasible for a utility to deliver power that is free of disturbances at all times. If a disturbance-free voltage waveform is required for the proper operation of an electrical product, mitigation techniques should be employed at the point of utilization.

1.3 Why Knowledge of Power Quality is Important

Owning or managing a concentration of electronic, control or life-safety devices requires a familiarity with the importance of electrical power quality.

Power quality difficulties can produce significant problems in situations that include:

  • Important business applications (banking, inventory control, process control)
  • Critical industrial processes (programmable process controls, safety systems, monitoring devices)
  • Essential public services (paramedics, hospitals, police, air traffic control)

Power quality problems in an electrical system can also quite frequently be indicative of safety issues that may need immediate corrective action. Th is is especially true in the case of wiring, grounding and bonding errors.

Your electrical load should be designed to be compatible with your electrical system. Performance measures and operating guidelines for electrical equipment compatibility are available from professional standards, regulatory agency policies and utility procedures.

1.4 Major Factors Contributing to Power Quality Issues

The three major factors contributing to the problems associated with power quality are:

Use of Sensitive Electronic Loads

The electric utility system is designed to provide reliable, efficient, bulk power that is suitable for the very large majority of electrical equipment. However, devices like computers and digital controllers have been widely adopted by electrical end-users. Some of these devices can be susceptible to power line disturbances or interactions with other nearby equipment

The Proximity of Disturbance-Producing Equipment

Higher power loads that produce disturbances – equipment using solid state switching semiconductors, arc furnaces, welders and electric variable speed drives – may cause local power quality problems for sensitive loads.

Source of Supply

Increasing energy costs, price volatility and electricity related reliability issues are expected to continue for the foreseeable future. Businesses, institutions and consumers are becoming more demanding and expect a more reliable and robust electrical supply, particularly with the installation of diverse electrical devices. Compatibility issues may become more complex as new energy sources and programs, which may be sources of power quality problems, become part of the supply solution. These include distributed generation, renewable energy solutions, and demand response programs.

Utilities are regulated and responsible for the delivery of energy to the service entrance, i.e., the utility meter. The supply must be within published and approved tolerances as approved by the regulator. Power quality issues on the “customer side of the meter” are the responsibility of the customer. It is important therefore, to understand the source of power quality problems, and then address viable solutions.

1.5 Supply vs. End Use Issues

Many studies and surveys have attempted to define the percentage of power quality problems that occur as a result of anomalies inside a facility and how many are due to problems that arise on the utility grid. While the numbers do not always agree, the preponderance of data suggests that most power quality issues originate within a facility; however, there can be an interactive effect between facilities on the system.

Does this matter? After all, 100% of the issues that can cause power quality problems in your facility will cause problems no matter where they originate. If the majority of power quality issues can be controlled in your own facility, then most issues can be addressed at lower cost and with greater certainty. Understanding how your key operational processes can be protected will lead to cost savings.

Utilities base their operational quality on the number of minutes of uninterrupted service that are delivered to a customer. Th e requirements are specific, public and approved by the regulator as part of their rate application (often referred to as the ‘Distributors Handbook’).

While some issues affecting the reliability of the utility grid – such as lightning or animal caused outages – do lead to power quality problems at a customer’s facilities, the utility cannot control these problems with 100% certainty. Utilities can provide guidance to end users with power quality problems but ultimately these key principles apply:

  • Most PQ issues are end-user issues
  • Most supply issues are related to utility reliability
1.6 Countering the Top 5 PQ Myths

1) Old Guidelines are NOT the Best Guidelines

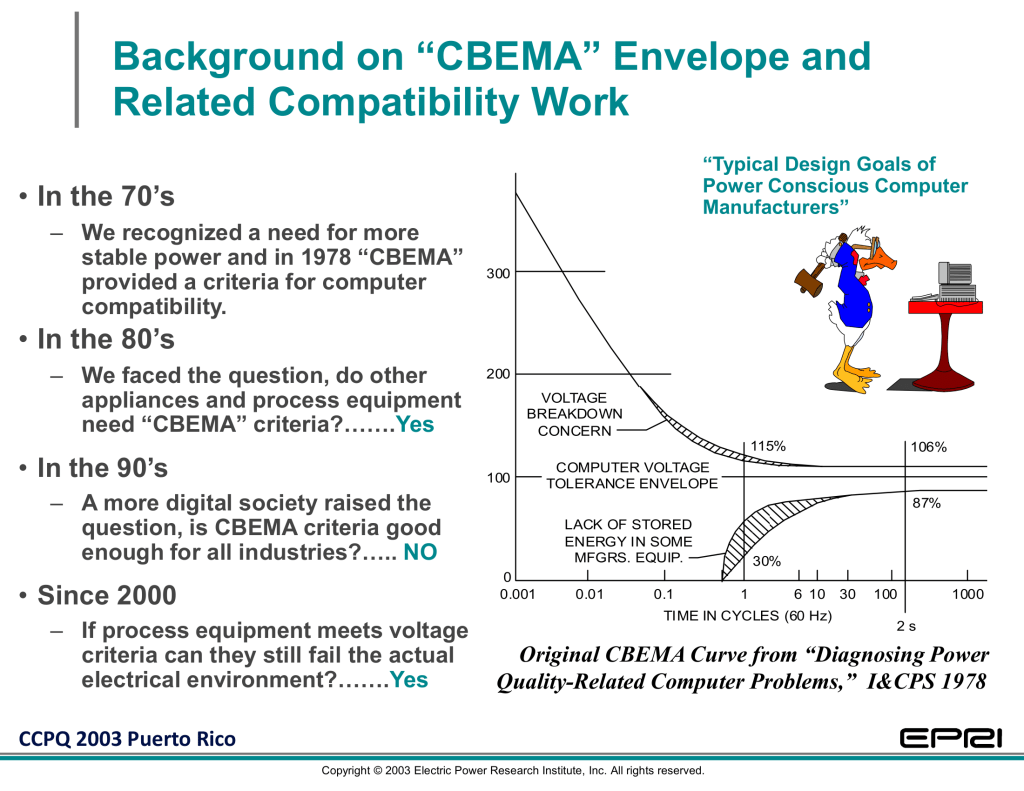
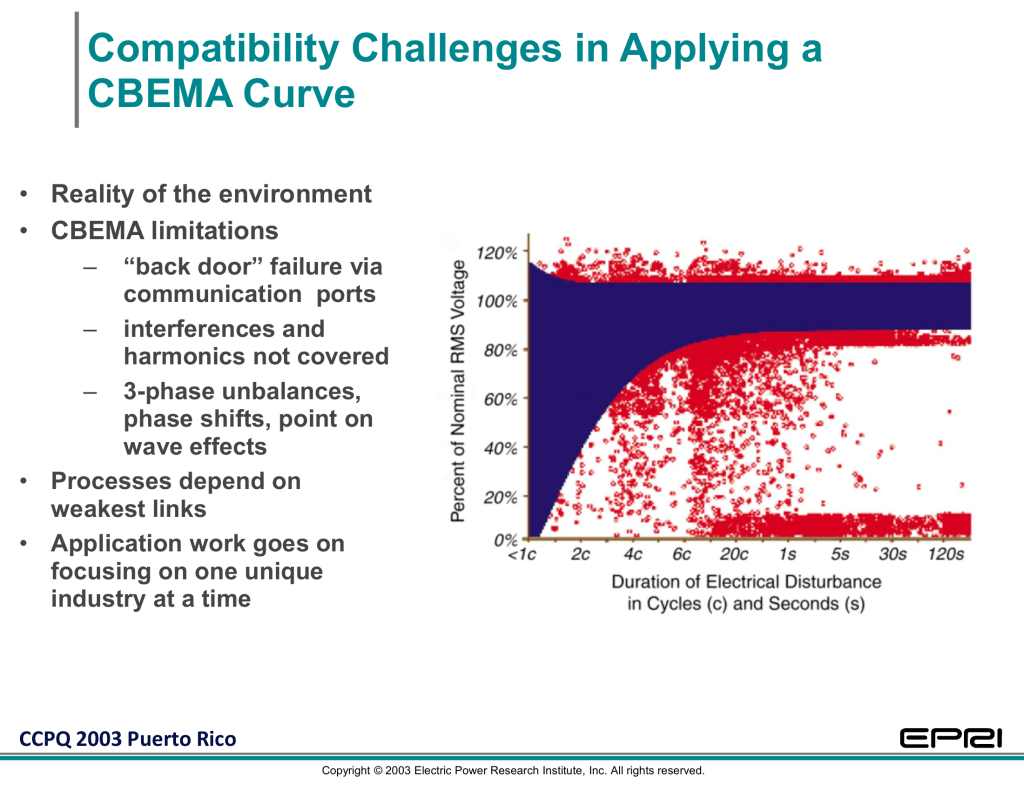
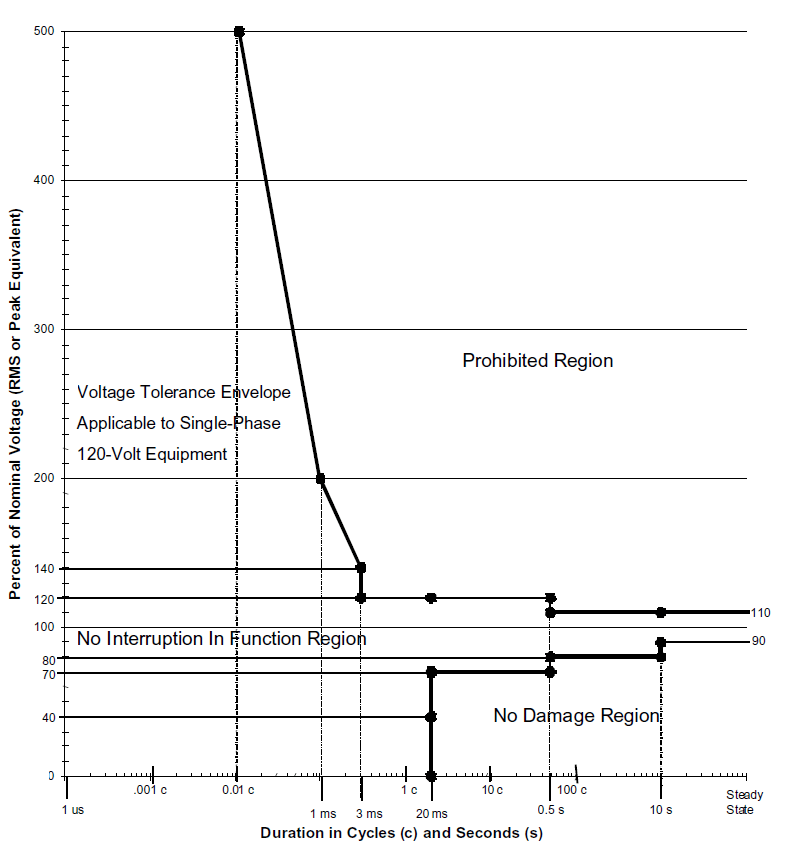
Guidelines like the Computer Business Equipment Manufacturers Association Curve (CBEMA, now called the ITIC Curve) and the Federal Information Processing Standards Pub94 (FIPS Pub94) are still frequently cited as being modern power quality guidelines.

The ITIC curve is a generic guideline for characterizing how electronic loads typically respond to power disturbances, while FIPS Pub 94 was a standard for powering large main-frame computers.

Contrary to popular belief, the ITIC curve is not used by equipment or power supply designers, and was actually never intended for design purposes. As for the FIPS Pub 94, it was last released in 1983, was never revised, and ultimately was withdrawn as a U.S. government standards publication in November 1997. While some of the information in FIPS Pub 94 is still relevant, most of it is not and should therefore not be referenced without expert assistance.

2) Power Factor Correction DOES NOT Solve All Power Quality Problems

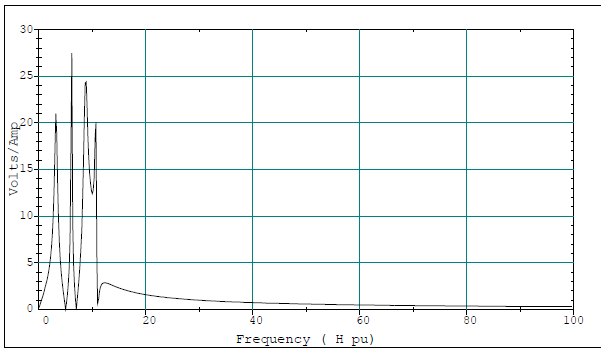
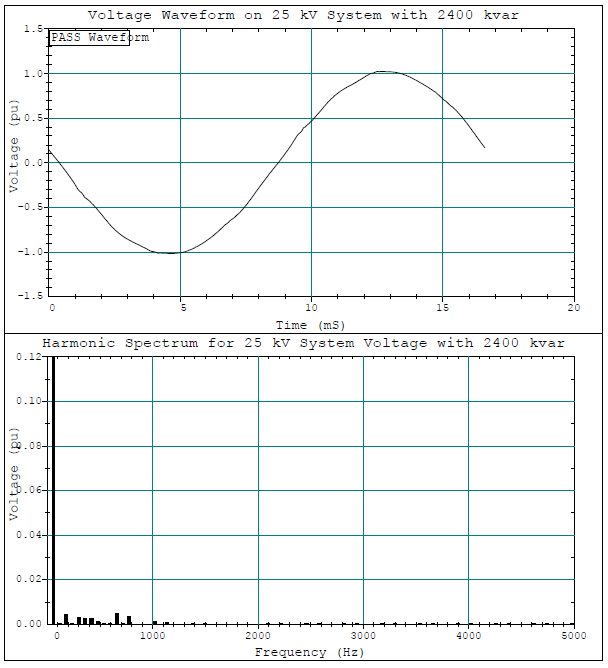
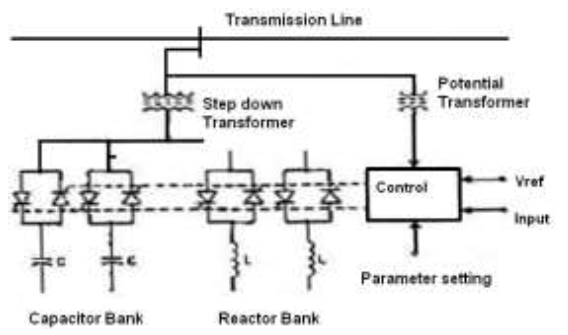
Power factor correction reduces utility demand charges for apparent power (measured as kVA, when it is metered) and lowers magnetizing current to the service entrance. It is not directly related to the solution of power quality problems. There are however many cases where improperly maintained capacitor banks, old PF correction schemes or poorly designed units have caused significant power quality interactions in buildings.

The best advice for power factor correction is the same as the advice for solving power quality issues; properly understand your problem first. A common solution to power factor problems is to install capacitors; however, the optimum solution can only be found when the root causes for the power factor problems are properly diagnosed. Simply installing capacitors can often magnify problems or introduce new power quality problems to a facility.

Power factor correction is an important part of reducing electrical costs and assisting the utility in providing a more efficient electrical system. If power factor correction is not well designed and maintained, other power quality problems may occur. The electrical system of any facility is not static. Proper monitoring and compatible design will lead to peak efficiency and good power quality.

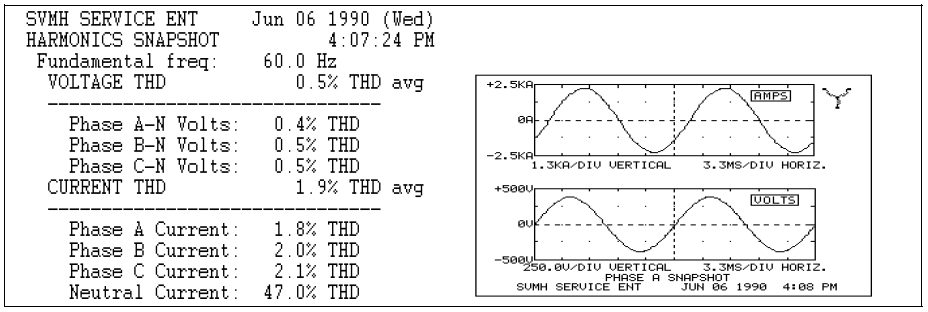
3) Small Neutral to Ground Voltages DO NOT Indicate a Power Quality Problem

Some people confuse the term “common mode noise” with the measurement of a voltage between the neutral and ground wires of their power plug. A small voltage between neutral to ground on a working circuit indicates normal impedance in the wire carrying the neutral current back to the source. In most situations, passive “line isolation” devices and “line conditioners” are not necessary to deal with Neutral to Ground voltages.

4) Low Earth Resistance is NOT MANDATORY for Electronic Devices

Many control and measurement device manufacturers recommend independent or isolated grounding rods or systems in order to provide a “low reference earth resistance”. Such recommendations are often contrary to Electrical Codes and do not make operational sense. Bear in mind that a solid connection to earth is not needed for advanced avionics or nautical electronics!

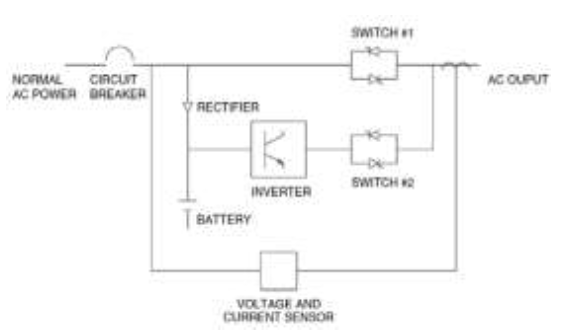
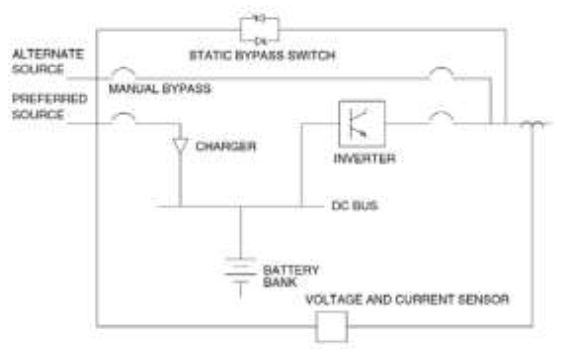
5) Uninterruptible Power Supplies (UPS) DO NOT Provide Complete Power Quality Protection

Not all UPS technologies are the same and not all UPS technologies provide the same level of power quality protection. In fact, many lower priced UPS systems do not provide any power quality improvement or conditioning at all; they are merely back-up power devices. If you require power quality protection like voltage regulation or surge protection from your UPS, then make sure that the technology is built in to the device.

1.7 Financial and Life Cycle Costs

The financial and life cycle costs of power quality issues are two fold;

  1. The “hidden cost” of poor power quality. The financial impact of power quality problems is often underestimated or poorly understood because the issues are often reported as maintenance issues or equipment failures. Th e true economic impact is often not evaluated.
  2. The mitigation cost or cost of corrective action to fix the power quality issue. The costs associated with solving or reducing power quality problems can vary from the inexpensive (i.e., checking for loose wiring connections), to the expensive, such as purchasing and installing a large uninterruptible power supply (UPS).

Evaluation of both costs should be included in the decision process to properly assess the value, risk and liquidity of the investment equally with other investments. Organizations use basic financial analysis tools to examine the costs and benefits of their investments. Power quality improvement projects should not be an exception; however, energy problems are often evaluated using only one method, the ‘Simple Payback’. The evaluation methods that can properly include the impact of tax and cost of money are not used, e.g., Life Cycle Costing.

Monetary savings resulting from decreased maintenance, increased reliability, improved efficiency, and lower repair bills reduce overall operating costs. A decrease in costs translates to an increase in profit, which increases the value of the organization.

Regrettably, the energy industry has adopted the Simple Payback as the most common financial method used. Simple Payback is admittedly the easiest, but does not consider important issues. To properly assess a capital improvement project, such as a solution to power quality, Life Cycle Costing can be used. Both methods are described below.

1.7.1 Simple Payback

Simple Payback is calculated by dividing the initial, upfront cost of the project (the ‘first cost’), by the annual savings realized. The result is the number of years it takes for the savings to payback the initial capital cost. For example, if the first cost of a power quality improvement project was $100,000, and the improvements saved $25,000 annually, the project would have a four year payback.

As the name implies, the advantage of the Simple Payback method is that it is simple to use. It is also used as an indicator of both liquidity and risk. Th e cash spent for a project reduces the amount of money available to the rest of the organization (a decrease in liquidity), but that cash is returned in the form of reduced costs and higher net profit (an increase in liquidity). Thus the speed at which the cash can be ‘replaced’ is important in evaluating the investment.

Short payback also implies a project of lesser risk. As a general rule, events in the short-term are more predictable than events in the distant future. When evaluating an investment, cash flow in the distant future carries a higher risk, so shorter payback periods are preferable and more attractive.

A very simple payback analysis may ignore important secondary benefits that result from the investment. Direct savings that may occur outside the immediate payback period, such as utility incentive programs or tax relief, can often be overlooked.

1.7.2 Life Cycle Costing

Proper financial analysis of a project must address more than just ‘first cost’ issues. By taking a very short-term perspective, the Simple Payback method undervalues the total financial benefit to the organization. Cost savings are ongoing, and continue to positively impact the bottom line of the company long after the project has been ‘repaid’.

A full Life Cycle Costing financial analysis is both more realistic, and more powerful. Life Cycle Costing looks at the financial benefits of a project over its entire lifetime. Electrical equipment may not need replacing for 10 years or more, so Life Cycle Costing would consider such things as the longer life of the equipment, maintenance cost savings, and the potential increased cost of replacement parts. In these cases, the time value of money is an important part of the investment analysis. Simply stated, money received in the future is less ‘valuable’ than money received today. When evaluating long-term projects, cash gained in the future must therefore be discounted to reflect its lower value than cash that could be gained today.

1.7.3 The Cost of Power Quality Problem Prevention

The costs associated with power quality prevention need to be included with the acquisition cost of sensitive equipment so that the equipment can be protected from disturbances. Installation costs must also be factored into the purchase of a major electrical product. Th e design and commissioning of data centres is a specific example. The costs that should be considered include:

  • Site preparation (space requirements, air conditioning, etc.)
  • Installation
  • Maintenance
  • Operating costs, considering efficiency for actual operating conditions
  • Parts replacement
  • Availability of service on equipment
  • Consulting advice (if applicable)
  • Mitigating equipment requirements

The cost of purchasing any mitigating equipment must be weighed with the degree of protection required. In a noncritical application, for instance, it would not be necessary to install a UPS system to protect against power interruptions.

Power supply agreements with customers specify the responsibilities of both the supplier and the customers with regard to costs.


For very large electrical devices, even if no power quality problems are experienced within the facility, steps should be taken to minimize the propagation of disturbances which may originate and reflect back into the utility distribution system. Many jurisdictions regulate the compatibility of electrical loads in order to limit power quality interactions.

Voltage Notching and Distribution Systems – Large Induction Motor Drive

Published by Electrotek Concepts, Inc., PQSoft Case Study: Voltage Notching and Distribution Systems – Large Induction Motor Drive, Document ID: PQS0320, Date: July 18, 2003.


Abstract: This case describes voltage notching associated with large adjustable speed drives. The notching is a normal characteristic of a phase-controlled rectifier but this paper illustrates problems that can occur on systems with low short circuit levels where the voltage notching can excite the natural frequency of the distribution system and cause significant distortion in the supply voltage. The notching characteristics and the interaction with the distribution system frequency response characteristics are described, along with possible solutions, An example problem and the corresponding solution associated with a large 6000 hp ASD is presented.

INTRODUCTION

Adjustable speed ac and dc drives are used with very large motors (e.g. 1,000-20,000 hp) for a variety of reasons. The drives can result in significantly improved efficiency when the driven load is variable. For large motor applications on weak systems, the drives may be required for motor starting to avoid high inrush currents.

Adjustable speed ac drives (ASDs) 1000 hp and larger typically use phase-controlled rectifiers (SCRs) and a large dc link inductor to supply a relatively constant dc current to the inverter. This is known as a current source inverter (CSI) configuration. The input rectifier may be configured as a six pulse, twelve pulse, or even higher pulse number rectifier, depending on harmonic control requirements. For dc drive applications, phase-controlled rectifiers are used to supply the dc current directly to the dc motor.

The voltage notching discussed in this paper is caused by the commutating action of the controlled rectifier. Whenever the current is commutated from one phase to another, there is a momentary phase-to-phase short circuit through the rectifier switching devices (SCRs, in this case). For a six pulse converter, this happens six times each cycle. The voltage notch is defined by its duration and its depth. The duration (commutation period) is determined by the source inductance to the drive and the current magnitude. The depth of the notch is reduced by inductance between the observation point and the drive (e.g. isolation transformer or choke inductance). An example waveform illustrating simple notches resulting from a drive operation is shown in Figure 1.

Figure 1 – Voltage Notches caused by Converter Commutation
PROBLEM DESCRIPTION

On most systems, problems with voltage notching can be minimized by applying sufficient isolation reactance at the drive. This limits the notch magnitude on the source side of the isolation reactance. However, on some systems, the notches that appear at the system level can still be significant. If there is not much resistive load on a system like this, the notches can excite the natural frequency of the distribution system (determined by the capacitance of lines, cables, and capacitor banks in parallel with the system source inductance) and cause significant distortion in the voltage waveform.

Numerous papers have described the voltage notching phenomena in industrial facilities and sizing isolation reactance to limit the notching effect on other loads [1-5]. However, there has been little literature describing the potential for voltage notching to excite natural frequencies of the distribution system. The high frequency oscillations that result can cause problems with communication interference and sensitive customer loads. This paper describes the concern and possible solutions using an example where a problem was encountered. The methodology for evaluating these problems and the solutions implemented should be valuable to anyone else encountering this problem.

It is important to note that the notching problem described should only exist with large adjustable speed drives with current-source inverter configurations or with dc drives. With other types of ASDs that use voltage source inverters (e.g. pulse width modulation), the rectifier does not have a constant dc current that needs to be commutated from one switching device to another. It is this current being commutated that that essentially looks like an injection of a disturbing current into the distribution system.

LARGE INDUCTION MOTOR DRIVE

The example system is illustrated by the one line diagram in Figure 2. The 25kV distribution system is supplied through a 10 MVA transformer from the 144kV transmission system. The customer causing the notching problems has a 6000 hp induction motor supplied through an adjustable speed drive. This drive is at a 4.16kV bus supplied through a 7.5 MVA transformer. Harmonic filters (5th, 7th, and 11th) are included to control the lower order characteristic harmonics of the six pulse drive.

Another customer on a parallel feeder supplied from the same 25kV bus has motor loads at both 4.16kV (800 hp motor) and 480 volts. The 800 hp motor includes surge capacitors for transient protection. The customer also has power factor correction capacitors at the 480 volt bus. These lower voltage surge capacitors and power factor correction capacitors have the potential to magnify the oscillations which occur on the distribution system.

Operation of the 6000 hp motor and drive resulted in significant oscillations on the 25kV supply system. These oscillations caused clocks to run fast at the customer with the 6000 hp motor (clocks were fed separately from the 25kV system) and failure of surge capacitors on the 800 hp motor at the customer located on the parallel feeder.

Figure 2 – Oneline Diagram for the System

Figure 3 illustrates the measured waveforms on the 25kV supply system. The oscillations have a primary frequency component near the 60th harmonic. In this case, the natural frequency is the result of the line capacitance from approximately 12 km of overhead line in parallel with the system source inductance. Note that the oscillations are excited six times per cycle corresponding to the six-pulse operation of the drive.

System Frequency Response

A model was developed using the Electromagnetic Transients Program (EMTP) to evaluate the magnification at the surge capacitor location and to evaluate possible solutions to the problem. First of all, the steady state frequency response of the system was simulated to illustrate the natural frequency that can excite the oscillations illustrated above. Figure 4 shows the voltage on the 25kV system as a function of a 1 amp source at the 4.16kV bus where the drive is located. The system resonance just above the 60th harmonic is apparent in the figure. Note also the lower order series and parallel resonances caused by the harmonic filters.

Figure 3 – Voltage Waveform and Spectrum on 25kV System
Figure 4 – Voltage vs. Frequency at 25kV Bus

Effect of Customer Low Voltage Capacitors

Next, the actual adjustable speed drive and motor load were represented to reproduce the notching oscillations observed in the measurements. The worst notching problems are associated with a firing angle at about 70% load. The simulated waveform for the 25kV bus voltage is shown in Figure 5 below. The oscillations at each commutation point are in good agreement with the measurement results.

Figure 5 – Simulated 25kV Voltage with Drive Operating

The model was then used to evaluate the voltage waveforms at the customer bus located on the parallel feeder. Figure 6 illustrates the voltage waveform at the 4.16kV bus where the 800 hp motor surge capacitors cause magnification of the oscillations. The potential for problems at this location is quite evident. The surge capacitor failures typically occurred during startup of the drive when the firing angles went through this worst case condition. Figure 7 shows the waveform at the 480 volt bus where the power factor correction capacitors damp out the high frequency oscillation. The power factor correction capacitors are much larger than the surge capacitors and result in a much lower resonant frequency. No problems were encountered with loads on the 480 volt bus.

Figure 6 – Simulated Voltage at Surge Capacitor
Figure 7 – Simulated Voltage at Power Factor Correction Capacitors

Possible Solutions

A number of possible solutions to the high frequency oscillation problem were evaluated. These included:

  1. A larger choke inductance at the input to the adjustable speed drive. This approach could be effective if the choke impedance was included as part of the drive’s initial design. As a retrofit, it is impractical because the size required would cause voltage regulation problems at the drive.
  2. Larger surge capacitors at the 800 hp motor of the parallel customer. This approach is feasible to protect the individual motor and surge capacitors of concern. However, large surge capacitors would be required and they do not eliminate the oscillations on the 25kV system that are the source of the problem. Note that the surge capacitors were removed as a temporary solution for the parallel customer.
  3. Modification of the filtering at the adjustable speed drive to include a high pass filter instead of just tuned branches at the 5th, 7th, and 11th. This approach proved to be ineffective because the high pass filter cannot provide sufficient damping at the higher frequency resonance.
  4. Addition of a capacitor bank on the 25kV system. This approach has the advantage of being the least expensive and the most practical to implement. Simulations show that this solution can be effective.

Effect of a 25kV Capacitor Bank

Adding a capacitor bank to the 25kV system changes the system frequency response to prevent the high frequency oscillation shown on the previous waveforms. However, the capacitor bank creates a new system parallel resonance at a lower frequency that could result in magnification of the lower order harmonic components created by the adjustable speed drive.

The first capacitor bank size tried was 1200 kVAr. This created a resonance that magnified the thirteenth harmonic component on the system if the power factor correction capacitors at the parallel customer were out of service. Figure 8 gives the measured voltage on the 25kV system for this condition. Note that the notching oscillation problem is solved (no high frequency components) but the thirteenth harmonic component in the voltage is approaching 5%.

Figure 8 – Voltage on 25kV System with 1200 kVAr Capacitor bank

After examination of the system frequency response with the drive filters and the existing load power factor correction capacitors, the capacitor size was increased to 2400 kVAr to solve the thirteenth harmonic resonance problem. Figure 9 illustrates the frequency response at the 25kV bus for a 1 amp source located at the 4.16kV drive location.

Figure 9 – Frequency Response on 25kV System with 2400 kVAr Capacitor Bank

With a 2400 kVAr capacitor bank, all of the system resonances that could cause magnification are located below the eleventh harmonic and are at frequencies that are not characteristic harmonics of the drive. Figure 10 gives the measured voltage waveform and harmonic spectrum with the 2400 kVAr capacitor operational. The voltage distortion is less than 2% with the 2400 kVAr capacitor in service.

Figure 10 – Voltage on 25kV System with 2400 kVAr Capacitor Bank
SUMMARY

The case study illustrates the characteristics of high frequency oscillations that can result from the commutation notches of large adjustable speed ac or dc drives operating on systems with relatively low short circuit levels.

The system oscillations can be magnified at customer locations where low voltage capacitors exist. Small capacitors, such as motor surge capacitors can be a particular problem. Even capacitors in the power supplies for electronic loads or smaller adjustable speed drive rectifiers can be affected by these oscillations.

The problem can be solved by careful selection of a capacitor size for the primary distribution system. The capacitor should not introduce a new resonance at one of the characteristic harmonics of the adjustable speed drive. The interaction of the proposed capacitor with other system capacitors and harmonic filters must be evaluated.

REFERENCES

1.J.C. Read, “The Calculation of Rectifier and Converter Performance Characteristics,” Journal of the IEE, vol. 92, pt. II, 1945, pp 495-509.

2.E.F. Christensen, et. al., “Analysis of Rectifier Circuits,” AIEE Transactions, vol. 63, 1944, pp. 1048-1058.

3.R.A. Adams, et. al., “Power Quality Issues Within Modern Industrial Facilities, “IAS Textile Film and Fiber Meeting, Atlanta, GA., 1990.

4.D.A. Jarc and R.G. Schieman, “Powerline Considerations for Variable Frequency Drives, “ IEEE Transactions on IAS, vol. 1A-21, no. 5, 1985.


RELATED STANDARDS
IEEE Standard 519

GLOSSARY AND ACRONYMS
ASD: Adjustable Speed Drive
CSI: Current Source Inverter

Power Quality Standards

Published by Pacific Gas and Electric Company (PG&E)


IEEE Standard 141-1993, Recommended Practice for Electric Power Distribution for Industrial Plants, aka the Red Book. A thorough analysis of basic electrical-system considerations is presented. Guidance is provided in design, construction, and continuity of an overall system to achieve safety of life and preservation of property; reliability; simplicity of operation; voltage regulation in the utilization of equipment within the tolerance limits under all load conditions; care and maintenance; and flexibility to permit development and expansion.

IEEE Standard 142-1991, Recommended Practice for Grounding of Industrial and Commercial Power Systems, aka the Green Book. Presents a thorough investigation of the problems of grounding and the methods for solving these problems. There is a separate chapter for grounding sensitive equipment.

IEEE Standard 493-1997, Recommended Practice for Design of Reliable Industrial and Commercial Power Systems, aka the Gold Book. The fundamentals of reliability analysis as it applies to the planning and design of industrial and commercial electric power distribution systems are presented. Included are basic concepts of reliability analysis by probability methods, fundamentals of power system reliability evaluation, economic evaluation of reliability, cost of power outage data, equipment reliability data, examples of reliability analysis. Emergency and standby power, electrical preventive maintenance, and evaluating and improving reliability of the existing plant are also addressed.

IEEE Standard 519-1992, Recommended Practices and Requirements for Harmonic Control in Electrical Power Systems. This guide applies to all types of static power converters used in industrial and commercial power systems. The problems involved in the harmonic control and reactive compensation of such converters are addressed, and an application guide is provided. Limits of disturbances to the AC power distribution system that affect other equipment and communications are recommended. This guide is not intended to cover the effect of radio frequency interference.

IEEE Standard 1100-1999, Recommended Practice for Powering and Grounding Sensitive Electronic Equipment, aka the Emerald Book. This is the first revision of the original edition in 1992. Recommended design, installation, and maintenance practices for electrical power and grounding (including both power-related and signal-related noise control) of sensitive electronic processing equipment used in commercial and industrial applications.

IEEE Standard 1159-1995, Recommended Practice for Monitoring Electric Power Quality. Monitoring of electric power quality of AC power systems, definitions of power quality terminology, impact of poor power quality on utility and customer equipment, and the measurement of electromagnetic phenomena are covered. Key chapters include: Monitoring objectives, Measurement instruments, monitor application techniques, and interpreting monitoring results.

IEEE Standard 1250-1995, Guide for Service to Equipment Sensitive to Momentary Voltage Disturbances. Computers, computer-like products, and equipment using solid- state power conversion have created entirely new areas of power quality considerations. There is an increasing awareness that much of this new user equipment is not designed to withstand the surges, faults, and reclosing duty present on typical distribution systems.

Momentary voltage disturbances occurring in ac power distribution and utilization systems, their potential effects on this new, sensitive, user equipment, and guidance toward mitigation of these effects are described. Harmonic distortion limits are also discussed.

IEEE Standard 1346-1998, Recommended Practice for Evaluating Electric Power System Compatibility with Electronic Process Equipment. A standard methodology for the technical and financial analysis of voltage sag compatibility between process equipment and electric power systems is recommended. The methodology presented is intended to be used as a planning tool to quantify the voltage sag environment and process sensitivity. It shows how technical and financial alternatives can be evaluated. Performance limits for utility systems, power distribution systems, or electronic process equipment are not included.

All the above IEEE standards are available from The Institute of Electrical and Electronics Engineers, Inc.

Their web address is http://www.standards.ieee.org

SEMI F-47-1999, Standard for Definition and Measurement of Equipment Reliability, Availability, and Maintainability defines the sag ride through capability.

SEMI F-42-1999, Test Method for Semiconductor Processing Equipment Voltage Sag Immunity defines the test methodology to confirm compliance to the standard.

SEMI standards are available from Semiconductor Equipment and Materials International (SEMI), 805 East Middlefied Road, Mountain View, CA 94043. The web address is http://www.semi.org/.

UL 1449 second edition, 1998. Underwriters Laboratories, Inc. standard 1449 is a safety, construction, and performance standard for transient voltage surge suppressors. The second edition revision includes withstand for loss of neutral condition without damage to the suppressor. UL local address is 1655 Scott Boulevard, Santa Clara, CA 95050-4169. Telephone: (408) 985-2400.

Web address: http://ulstandards info net.ul.com

NFPA 70-1999, National Electrical Code. Published by the National Fire Protection Association, Batterymarch Park, Quincy, MA 02269. Available in most book stores. The NEC is basically a safety code to protect electrical distribution circuits from faults and overloads. It is not a performance code.

ANSI C84.1-1995, Electric Power Systems and Equipment – Voltage Ratings. Published by NEMA, National Electrical Manufacturers Association, 1300 North 17th Street, Suite 1847, Rosslyn, Virginia 22209. Telephone: (703) 841-3200. This voluntary standard was first approved in 1954 as a joint effort by the Edison Electric Institute and the NEMA to recommend voltage ratings for both electric systems and equipment to promote compatibility. ANSI stands for American National Standards Institute. This ANSI standard establishes the steady state voltage delivery window of +/- 5% at the point of delivery.  It also recommends a tolerance window of +6% and -13% for end use equipment. The standard also establishes a tolerance window for voltage unbalance of +/-3%.

NEMA MG 1- 1998, Motors and Generators. National Electrical Manufacturers Association, 2101 L Street, N.W. Washington DC 20037. This standard gives technical specifications used by manufacturers. Power quality concerns that can be referenced include: voltage and current unbalance tolerance, over and under voltage tolerance, electrical starting characteristics, and insulation values.

NEMA Standards Publication No. LS1-1992, Low Voltage Surge Protective Devices.
This is a good standard for quality construction of the device.


Source URL: https://www.pge.com/includes/docs/pdfs/mybusiness/customerservice/energystatus/powerquality/pqstandards.pdf

Power Quality Issues in Solar Converters: A Review

Published by J. R. Maglin & R. Ramesh, Department of Electrical and Electronics Engineering, Anna University, Chennai-25, India, E-mail: rramesh@annauniv.edu, Tel: +91-9444217600
Published in European Journal of Scientific Research
ISSN 1450-216X Vol.61 No.2 (2011), pp. 321-327
http://www.eurojournals.com/ejsr.htm


Abstract

The main objective of this paper is to identify the problems associated with solar converters in the solar power system due to the involvement in more number of power electronics components. The main objective of this work is to study of the behaviors of the solar PV systems and the power quality issues in converters. Harmonics are created by the switching system of the power electronic circuit and can cause damage to power equipment on the utility side and sensitive loads on the customer side.

Keywords: Converters, Inverters, PV, Power quality

1. Introduction

Government promotion of renewable energy sources has led to several large scale solar power plants in India. India receives solar energy in the region of 5 to 7 kWh/m2 for 300 to 330 days in a year. This energy is sufficient to set up 20 MW solar power plant per square kilometer land area. With about 300 clear, sunny days in a year, India’s theoretical solar power reception, on only its land area, is about 5 Petawatt-hours per year (PWh/yr) (i.e. 5 trillion kWh/yr or about 600 TW). The daily average solar energy incident over India varies from 4 to 7 kWh/m2 with about 1500–2000 sunshine hours per year (depending upon location), which is far more than current total energy consumption. For example, assuming the efficiency of PV modules were as low as 10%, this would still be a thousand times greater than the domestic electricity demand(in India) projected for 2015. The amount of solar energy produced in India is less than 1% of the total energy demand. The grid interactive solar power as of December 2010 was merely 10 MW. Government-funded solar energy in India only accounted for approximately 6.4 MW-yr of power as of 2005. However, as of October 2009, India is currently ranked number one along with the United States in terms of installed solar power generation capacity.

In those installations, a large amount of relatively low power inverters is connected to a common AC low voltage bus and high voltage distortion levels have been reported although the single inverters comply to the harmonic emission standard.

2. Role of Power Electronic Components in Solar Power System

Grid-connected PV systems are currently being widely installed in many of the developed countries [1]. In addition to their environmental benefits, PV systems have a number of technical and economical benefits. They can be operated to decrease the losses and improve the voltage profile of the feeder to which they are connected [2], [3]. One of the main characteristics of PV systems is the high variability of their output power. The variability stems from the fact that these systems are static, and thus, any instantaneous change in the irradiance reaching the PV arrays leads to a corresponding change in their output power. The time frame for the short-term fluctuations in irradiance is in the order of seconds to few minutes [4], [5]; thus, some studies have considered the fluctuations in the PV power to be within the same time frame [6], [7]. However, other studies have recommended the use of 10-min irradiance data when studying the power fluctuations generated from PV systems [8], [9].

This is especially suitable for systems with ratings in the order of tens of megawatts that extend over a large land area, such as the 10-MW PV plant in Pocking, Germany [10]. A recent report published by the North American Electric Reliability Corporation showed that the output power of existing large PV systems, with ratings in the order of tens of megawatts, can change by 70% in a five to ten-min time frame [11]. It should be noted that for a number of small systems that are distributed over a large land area, the resulting combined fluctuations are much less due to the smoothing effect [12], [13]. Also, the fluctuation in the power of these systems can lead to unstable operation of the electric network prior to the fault conditions, high power swings in the feeders [14]. However, PV power fluctuates depending on weather conditions, season, and geographic location and may cause problems like voltage fluctuation and large frequency deviation in electric power system operation [15],[16],[17]. To date, it has not been necessary for small PV generators to provide frequency regulation services to the power system. In the future, with an increasing penetration of PV generation, their impact upon the overall control of the power system will become significant [18]. This will lead a situation where the PV generators will be required to share some of the duties, such as load frequency control.

The increasing number of renewable energy sources and distributed generators requires new strategies for the operation and management of the electricity grid in order to maintain or even to improve the power-supply reliability and quality. The power-electronic technology plays an important role in distributed generation and in integration of renewable energy sources into the electrical grid, and it is widely used and rapidly expanding as these applications become more integrated with the grid-based systems. During the last few years, power electronics has undergone a fast evolution, which is mainly due to two factors. The first one is the development of fast semiconductor switches that are capable of switching quickly and handling high powers. The second factor is the introduction of real-time computer controllers that can implement advanced and complex control algorithms. These factors together have led to the development of cost-effective and grid-friendly converters. Regardless of the power ratings of the alternative energy generation unit, it has to be converted to a suitable form by utilizing power electronic converters. In this paper[19], new trends in power-electronic technology for the integration of renewable energy sources and energy-storage systems are presented. Therefore, power electronics is vital to the future energy systems and process of green industrialization.

3. Power Quality Issues in Converters

Typical power electronic converters arrangements for PV systems are shown [20].Authors [21] discussed the many sources of nonlinearity in power electronics systems. Authors demonstrated with an analytical and experimental result and proved that complex nonlinear phenomena such as sub harmonics, quasi periodicity and chaos can arise in even the simplest power electronic systems. Switched mode dc-dc converters inherently produce ripple at the switching frequency and its harmonics. The unwanted signal which appears at both the input and the output is undesirable for electromagnetic compatibility. Filtering must generally be employed to reduce it to an acceptable level [22].Switched-mode DC-DC converters are nonlinear and time-varying systems. In unsteady nonlinear systems a variety of strange effects are observed, including sub harmonics, quasi periodic oscillation, intermittency, and chaotic behavior, apparently random motion. Because closed loop buck converters are strongly nonlinear system, plenty of nonlinear phenomena may occur at operation, which will result in the instability of the system [23]. Lupco V. Karadzino and David C. Hamill [21] highlighted that all switching converters have some stray inductance in series with their diodes, so we expect the phenomena to be widespread, especially as switching frequencies are pushed ever higher. The various power qualities such as voltage and frequency profiles, THD in voltages and currents and voltage and current unbalance factors have been measured for renewable energy using a power quality analyzer [25].

4. Power Quality Issues in Inverters

With the increase of the renewable energy penetration to the grid, power quality (PQ) of the medium to the low voltage power transmission system is becoming a major area of interest. Most of the integration of renewable energy system to the grid takes place with the aid of power electronics converters. The main purpose of the power electronic converters is to integrate the distributed generation (DG) to the grid in compliance with power quality standards. However, high frequency switching of inverters can inject additional harmonics to the system, creating major PQ problems if not implemented properly [26]. Bosman[27] experimentally showed that a distorted grid voltage can significantly influence the harmonic content of the current injected by the inverter. In this paper, Photovoltaic connected to grid is used as power supply to the load [28]. A laboratory setup was established to perform the measurement. Approximately 70-80% of all power quality related problems can be attributed to faulty connections and/or wiring [29]. Power frequency disturbances, electromagnetic interference, transients, harmonics and low power factor are the other categories of PQ problems that are related to source of supply and types load [30].

Though the output of a PV panel depends on the solar intensity and cloud covers, the PQ problems not only depends on irradiance but also are based on the overall performance of solar photovoltaic system including PV modules, inverter, filters controlling mechanism etc. Studies presented in [31], show that the short fluctuation of irradiance and cloud cover play an important role for low voltage distribution grids with high penetration of PV. Therefore special attention should be paid to the voltage profile and the power flow on the line. It also suggests that voltage and power mitigation can be achieved in super capacitors which result in an increase of about 20% in the cost of the PV system. Voltage swell may also occur when heavy load is removed from the connection. Concerning DG, voltage disturbance can cause the disconnection of inverters from the grid and therefore result in loss of energy. Also long term performance of grid connected PV system shows a remarkable degradation of efficiency due to the variation of source and performance of inverter [32]. The PV array can be single or a string of PV panels either in series or parallel mode connection. Centralized or decentralized mode of PV systems can also be used and the overview of these PV Inverter-Grid connection topologies along with their advantages and disadvantages are discussed in [33]. These power electronic converters, together with the operation of non-linear appliances, inject harmonics to the grid. In addition to the voltage fluctuation due to irradiation, cloud cover or shading effects could make PV system unstable in terms of grid connection. Therefore this needs to be considered in the controller design for the inverter [34], [35]. In general grid connected PV inverter is not able to control the reactive and harmonic currents drawn from non-linear loads. An interesting controlling mechanism has been presented in [36] where a PV system is used as an active filter to compensate the reactive and harmonic as well as injecting power to the grid. This system can also operate in standalone mode.

5. Power Quality Issues in Grid Connected Solar Power System

The general solar power system is shown in figure.1. The major components include boost converters and inverters.

Figure 1: Basic Block Diagram

Converter − A boost converter is a DC-DC converter with an output voltage greater than the source voltage. The aim is to analyze and design the high efficient modified converters to extract maximum power from solar PV panels.

Inverter − Multilevel inverters offer high power capability, associated with lower output harmonics and lower commutation losses. The new topology has a significant reduction in the number of power devices and capacitors required to implement a multilevel output. Additionally, the dedicated modulator circuit required for multilevel inverter operation will be implemented using a control circuit, reducing overall system cost and complexity.

Controller − The embedded controller will fetch the input from the sensor and give command to the motor to run in order to tackle the change in the position of the sun. And also controller monitors the various electrical parameters and generates the control signal to solve the power quality issues.

Power quality is certainly a major concern in the present era; it becomes especially important with the introduction of sophisticated devices, whose performance is very sensitive to the quality of power supply. Modern industrial processes are based a large amount of electronic devices such as programmable logic controllers and adjustable speed drives. The electronic devices are very sensitive to disturbances and thus industrial loads become less tolerant to power quality problems such as voltage dips, voltage swells, and harmonics. The distortion in the quality of supply power can be introduced /enhanced at various stages; however, some of the primary sources of distortion [24] can be identified as Power Electronic Devices, IT and Office Equipments, Arcing Devices, Load Switching, Large Motor Starting, Embedded Generation Electromagnetic Radiations and Cables Storm and Environment Related Causes etc. Authors presented [38] a survey of the techniques for reduction of harmonics. Fundamental ways are given to reduce harmonics by means of active and passive methods. Especially active ways are focused on, because they can be integrated into power electronic converters. Beside their prime task of converting power, these converters have thus the potential to deliver an ancillary service, namely: active harmonic reduction. Authors proposed [39] a hybrid active filter for the damping of harmonic resonance in industrial power systems. The hybrid filter consists of a small rated active filter and a 5th-tuned passive filter. The active filter is characterized by detecting the 5th harmonic current flowing into the passive filter. Experimental results obtained from a 20-kW laboratory model verify the viability and effectiveness of the hybrid active filter proposed. Walid and Kazerani [54] investigated the methods that can be used to reduce the fluctuations in the power generated from large PV systems. The authors suggested to use the of battery storage systems , use of dump load and curtailment of the generated power by operating the power-conditioning unit of the PV system below the maximum power point to reduce the fluctuations in large PV system. And also authors examined the economic aspects of using different methods for smoothing the output power of large PV systems. Authors [47] presented a grid-connected photovoltaic (PV) system with direct coupled power quality controller (PQC). The proposed PV system used an inner current control loop and outer feedback control loops to improve grid power quality and maximum power point tracking (MPPT) of PV arrays.

6. Conclusion

This paper has provided a brief summary of solar PV systems and power quality issues in grid connected power system. This paper has also presents a summary of converts and inverters in solar power system and its power quality issues. Suitable control techniques are also discussed briefly. The intention of the authors was simply to provide groundwork to readers interested in looking back on the evolution of power quality issues in PV systems, and to consider where to go from here.

References

[1] Trends in photovoltaic applications: Survey report of selected IEA countries between 1992 and (2008). [Online]. Available: http://www.iea-pvps.org/.
[2] B. H. Chowdhury and A. W. Sawab, “Evaluating the value of distributed photovo1aic generations in radial distribution systems,” IEEE Trans.Energy Convers., vol. 11, no. 3, pp. 595–600, Sep. 1996.
[3] N. Srisaen and A. Sangswang, “Effects of PV grid-connected system location on a distribution system,” in Proc. IEEE Asia Pac. Conf. Circuits Syst. 2006, 4–7 Dec., pp. 852–855.
[4] W. Jewell and T. Unruh, “Limits on cloud-induced fluctuation in photovoltaic generation,” IEEE Trans. Energy Convers., vol. 5, no. 1, pp. 8–14, Mar. 1990.
[5] A. Woyte, R. Belmans, and J. Nijs, “Fluctuations in instantaneous clearness index: Analysis and statistics,” Solar Energy, vol. 81, no. 2, pp. 195–206, Feb. 2007.
[6] W. T. Jewell and R. Ramakumar, “The effects of moving clouds on electric utilities with dispersed PV generation,” IEEE Trans. Energy Convers., vol. EC-2, no. 4, pp. 570–576, Dec. 1987.
[7] A. Woyte, V. Van Thong, R. Belmans, and J. Nijs, “Voltage fluctuations on distribution level introduced by photovoltaic systems,” IEEE Trans.Energy Convers., vol. 21, no. 1, pp. 202–209, Mar. 2006.
[8] G. Vijayakumar, M. Kummert, S. Klein, and W. Beckman, “Analysis of short-term solar radiation data,” Solar Energy, vol. 79, pp. 495–504, 2005.
[9] C. Craggs, E.M. Conway, and N. M. Pearsall, “Statistical investigation of the optimal averaging time for solar irradiance on horizontal and vertical surfaces in the U.K,” Solar Energy, vol. 68, pp. 179–187, 2000.
[10] Solar Server, “The world’s largest photovoltaic solar power plant is in Pocking,” [Online]. Available: http://www.solarserver.com/solarmagazin/anlage_0606_e.html.
[11] North American Electric Reliability Corp. (Apr. 2009). Accommodating High Levels of Variable Generation [Online]. Available:http://www.nerc.com/files/IVGTF_Report_041609.pdf
[12] E. Wiemken, H. G. Beyer, W. Heydenreich, and K. Kiefer, “Power characteristics of PV ensembles: Experiences from the combined power production of 100 grid connected pv systems distributed over the area of germany,” Solar Energy, vol. 70, no. 6, pp. 513–518, 2001.
[13] K. Otani, J. Minowa, and K. Kurokawa, “Study on areal solar irradiance for analyzing a really totalized PV systems,” Solar Energy Mater. SolarCells, vol. 47, pp. 281–288, 1997.
[14] Y. T. Tan and D. S. Kirschen, “Impact on the power system of a large penetration of photovoltaic generation,” in Proc. IEEE Power Eng. Soc.Gen. Meet, Jun. 24–28, 2007, pp. 1–8.
[15] S. Yanagawa, T. Kato, K. Wu, A. Tabata, and Y. Suzuoki, “Evaluation of LFC capacity for output fluctuation of photovoltaic generation systems based onmulti-point observation of insolation,” in Proc. IEEE Power Eng. Soc. Summer Meeting, 2001, pp. 1652–1657.
[16] A. Woyte, V. V. Thong, R. Belmans, and J. Nijs, “Voltage fluctuations on distribution level introduced by photovoltaic systems,” IEEE Trans.Energy Convers., vol. 21, no. 1, pp. 202–209, Mar. 2006.
[17] H. Asano, K. Yajima, and Y. Kaya, “Influence of photovoltaic power generation on required capacity for load frequency control,” IEEE Trans.Energy Convers., vol. 11, no. 1, pp. 188–193, Mar. 1996.
[18] Y. T. Tan, D. S. Kirschen, and N. Jenkins, “A model of PV generation suitable for stability analysis,” IEEE Trans. Energy Convers., vol. 19,no. 4, pp. 748–755, Dec. 2004.
[19] J. M. Carrasco, L. G. Franquelo, J. T. Bialasiewicz, E. Galvan, R. C. P. Guisado, Ma. A. M. Prats, J. I. Leon, and N. Moreno-Alfonso, “Powerelectronic systems for the grid integration of renewable energy sources: a survey,” IEEE Trans. Ind. Electron., vol. 53, no. 4, pp. 1002 1016, Jun. 2006.
[20] M. Elbuluk and N.R.N. Idris The Role Power Electronics in Future Energy Systems and Green Industrialization 2nd IEEE International Conference on Power and Energy (PECon 08), December 1-3, 2008, Johor Baharu, Malaysia.
[21] Lupco V. Karadzinov and David C. Hamill “DH Phenomenon in DC/DC Converters”.
[22] David C Hamill “ An effiecient active ripple filter for use in dc-dc conversion” IEEE transactions on aerospace and electronic systems vol 32, no, 3 1996 pp.1077-1084.
[23] Wang Yuanbin “Research on Chaos in Switching Dc-Dc Converters” 2009 Second International Conference on Intelligent Computation Technology and Automation pp 91-94.
[24] John Stones and Alan Collinsion “Introduction to Power Quality” power engineering journal 2001 pages: 58 -64.
[25] Manoj Kumar M.V and Rangan Banerjee Power Quality of Renewable Isolated Power Systems – A Case study 5th International Conference on Industrial and Information Systems, ICIIS 2010, Jul 29 – Aug 01, 2010, India.
[26] S.K.Khadem, M.Basu and M.F.Conlon, “Power Quality in Grid Connected Renewable Energy Systems: Role of Custom Power Devices”, International Conference on Renewable Energies and Power Quality (ICREPQ’10), Granada (Spain), 23rd-25th March 2010.
[27] A.J.A. Bosman, Harmonic modeling of Solar inverters and their interaction with the distribution grid, Master thesis publication of the Eindhoven University of Technology (TUE). Department of Electrical Engineering. Electrical Power Systems, 2006.
[28] M. Anwari, , M. Imran Hamid, M. I. M. Rashid, and Taufik, Power Quality Analysis of Grid- Connected Photovoltaic System with Adjustable Speed Drives.
[29] S.M.Halpin, L.L.Grigsby, “The Electric Power Engineering Handbook,CRC Press LLC (2001),pp.15.4
[30] C.Sankaran, “Power Quality”, CRC Press (2002), pp.12-13.
[31] J.D.Mondol, Y.Yohanis, M.Smyth, B.Norton, “ Long term Performance Analysis of a Gridconnected Photovoltaic System in Northern Ireland”, Energy Conv & Mang,2006,Vol.47,pp.2925-2947.
[32] F.Blaabjerg, Z.Chen, S.B.Kjaer, “ Power Electronics as Efficient Interface in Dispersed Power Generation Systems”, IEEE Transactions on Power Electronics 2004, Vol.19 (4), pp.1184- 1194.
[33] R.Teodorescu, F.Blaabjerg, M.Liserre, U.Borup, “ A New Control Structure for Grid connected PV Inverters with Zero Steady-State Error and Selective harmonic Compensation,” in Proc.PESC2004, pp.1742-1747.
[34] X.Yuan, W.Merk, H.Stemmler, J.Allmeling, “ Stationary Frame Generalized Integrators for Current Control of Active Power Filters with Zero Steady-State Error for Current Harmonics of Concern Under Unbalanced and Distorted Operating Conditions” IEEE Transactions on Industry Applications 2002, Vol.38 (2), pp.523-532.
[35] H.Callega, H.Jimenez, “Performance of a Grid-connected PV System used as Active Filter,” Energy Conv & Mang, 2004, Vol.45, pp.2417-2428.
[36] G.Chicco, J.Schlabbach, F.Spertino, “Experimental Assessment of the Waveform distortion in Grid-connected Photovoltaic installations”, Solar Energy, 2009, Vol.:83, pp.1026-1039.
[37] P.J.M. Heskes J.M.A. Myrzik W.L. Kling (2008) Survey of Harmonic Reduction Techniques Applicable as Ancillary Service of Dispersed Generators Young Researchers Symposium, February 7-8, 2008, Technical University of Eindhoven, The Netherlands.
[38] Fujita.H.Yamasaki.T.;Akagi.H.(2000) A hybrid active filter for damping of harmonic resonance in industrial power systems IEEE Transactions on Power Electronics Volume 15, Issue 2, pp:215 – 222.
[39] Sung-Hun Ko and Seong-Ryong Lee, Hooman Dehbonei and C.V. Nayar A Grid Connected Photovoltaic System with Direct Coupled Power Quality Control IEEE 2006 pp 5203-5208.

High Neutral-to-Ground Voltages

Published by Electrotek Concepts, Inc., PQSoft Case Study: PQ Investigation at a Battery Facility, Document ID: PQS0401, Date: March 30, 2004.


Abstract: An office complex was experiencing continual operational problems with some of their electronic equipment not protected by power conditioning equipment. The equipment would periodically exhibit strange behavior.

An infrared heat detector was used to locate loose wiring connections, and once these connections were fixed, the neutral-to-ground voltages disappeared as well as the equipment problems.

This case presents the results of measurements and analysis of electronic equipment problems.

PROBLEM STATEMENT

An office complex was experiencing continual operational problems with some of their electronic equipment not protected by power conditioning equipment. The equipment would periodically exhibit strange behavior.

What’s Been Done So Far

The facility engineer has contacted the utility and the utility could not correlate any of the equipment problems with any power system faults or other events. He concludes that the problem must be internally generated.

DEVELOP MONITORING PLAN

A thorough monitoring plan was developed to characterize both disturbance events and harmonic distortion levels, since the cause of the problems were unknown.

A disturbance analyzer was installed at the service entrance to determine if voltage variations such as sags or transients were causing the equipment problems. Figure 1 shows an example of disturbance event that was recorded. During the monitoring period, many neutral-to-ground impulses and surges were recorded at the service entrance. No voltage sags or other events were recorded.

Figure 1 – Disturbance Monitoring Results

A spectrum analyzer was also installed at the service entrance to record harmonic distortion levels. Both the voltage and current distortion levels (Figure 2) were very low and should not be causing any equipment problems.

Figure 2 – Harmonic Distortion Results
STUDY METHODOLOGY

Both harmonic distortion and voltage sags have been ruled out as possible causes of equipment problems. Determining the causes of the neutral-to-ground impulses and identifying possible methods to control these impulse levels will probably solve the equipment problems.

SUMMARY

Over the years, vibrations, thermal stresses and building improvements lead to loose connections in wire terminations. On current-carrying conductors, loose connections lead to arcing and sparking and result in high frequency transients. On neutrals, loose connections result in abnormally high or low voltages and result in an unstable reference for highly sensitive electronics.

An infrared heat detector was used to locate loose wiring connections, and once these connections were fixed, the neutral-to-ground voltages disappeared as well as the equipment problems.

REFERENCES

Grounding and Shielding in Facilities, R. Morrison and W. H. Lewis, John Wiley and Sons, Inc., 1990.


RELATED STANDARDS
IEEE Standard 1159

GLOSSARY AND ACRONYMS
CVT: Constant Voltage Transformer
CBEMA: Computer and Business Equipment Manufacturers Association

Power Quality: A 25-Year History and What’s Next

Published by Tom Key, EPRI PEAC, Knoxville, TN, Email: tkey@epri-peac.com, 2003


Power Quality Case Studies – Understanding compatibility issues
DPQ Project – Benchmarking system power quality
Advancements in power quality monitoring and managing power quality monitoring information – PQView
Tools for power quality analysis – PQ Diagnostic System
Power Quality Services – Is it a business or a customer service?


The DPQ Project benchmarked PQ on distribution systems in the US
Many utilities followed with extensive benchmarking projects for their individual systems.  This continues to be a priority.
This also resulted in tools and indices for benchmarking – Reliability Benchmarking Methodology and PQView.
Another way of showing the same data..  This includes durations which are the result of fault clearing times.


Internal facility problems dominate the issues – Wiring and grounding problems, Connections, Internal switching concerns, Load variations and, harmonics affecting the facility voltage
Some utility issues – Capacitor switching concerns, Harmonic resonance, Voltage sags and momentary interruptions due to faults, Voltage variations (flicker)
All power quality issues come down to economics.
Finding the most cost effective way to solve problems and identifying the investments that are economically justified require a systems approach to the economic analysis.
This is a significant area of research – how much do power quality problems cost?
How much should utilities invest in improving power quality vs investments from customers in improving immunity?
Many utilities experimented with PQ programs as profit-making service opportunities.
For a variety of reasons, most of these did not succeed.
SEMI F47 Provides a template for development of standards that can improve the performance of equipment in critical industries
 : Utilities, Manufacturers, End Users
Now working with other industries to develop similar approaches to improve compatibility.: Automotive initiative is under way right now, Textiles, Hospitals, Plastics, Petrochemical etc.
Standards development is ongoing. 
The emphasis right now is trying to bring an international perspective to standards.
What are the compatibility levels?
How should we measure and document PQ?
How should limits be applied to equipment, customers, the supply system?
Power quality must be a business.
All investments must be justified.
Regulations must be developed to support flexibility in implementation of power quality solutions at all levels of the system.
Power quality standards become international
PQ Monitoring is everywhere
Power quality management becomes part of system operations
Planning for power quality
Providing flexible levels of power quality to meet customer needs
Expert systems to identify problems use power quality monitoring information
Power quality MUST be a business
The whole system will be monitored.
These systems will be part of systems operation and system maintenance programs.
The monitoring systems can be the basis of future premium power service offerings, distributed generation performance, customer system performance, etc.
The monitoring systems will integrate equipment for many applications (relays, meters, controls, etc.)
Intelligent applications will be built off the voltage and current monitoring.
All power quality parameters that can impact customer and system operation will be tracked continuously.
The information will be used as part of overall system performance evaluation and prioritizing expenditures to improve performance.
PQView provided the capability to analyze large volumes of information.
PQWeb set the stage for sharing information in the easiest manner – the web.
The opportunity to provide flexible levels of power quality requires innovations in the regulation of utilities and technology implementations to achieve the flexible levels of power quality.
Smart monitoring systems will help us operate the power system, identify problems and fix the problems faster and more efficiently.
Fault location, Equipment problems, System efficiency etc.

Quality and Reliability are not POINT values
System level indices need to move down to substation/feeder level in a probabilistic framework to better define consumer risk.

PQ Investigation at a Battery Facility

Published by Electrotek Concepts, Inc., PQSoft Case Study: PQ Investigation at a Battery Facility, Document ID: PQS0402, Date: March 30, 2004.


Abstract: This case study presents the results of a power quality investigation at a battery manufacturing facility. The facility had been experiencing a high rate of motor failures and was experiencing problems with its computer control system. Ground noise caused by the ungrounded 480 V system and ground loops was part of the problems identified with the computer control system. A ground fault on the 480 V system was found and removed. The installation of harmonic filters reduced the THD from 19% down to 2%. Some of the motor failures were attributed to the basic nature and risks associated with an ungrounded 480 V system.

INTRODUCTION

There are concerns about the power distribution system at a typical Battery Facility. Plant personnel perceive a high failure rate of motors, and problems experienced by the installation of a new system to control battery formation are the most immediate concern. This case study addresses the following issues:

  • Formation Computer Control
  • Grounding of the Distribution System
  • Harmonic Distortion
FORMATION ROOM COMPUTER CONTROL

The computer control for the formation room at the current facility has encountered past operational difficulties. A similar system was installed in a sister plant successfully. The following problems occurred with the new system at the current facility:

  • Formation room attendants did not trust the system, and a high number of batteries were rejected for improper formation.
  • Temperature indications, when compared with manual readings, were often in error +/-10 degrees, and sometimes in error by 50 degrees. The errors were intermittent, with no consistent pattern.
  • Current indications that often read low, causing the rectifier unstable operation.

The problems with the system are due to the following factors:

  • Lack of ownership for the problem of getting the system corrected. Recently a plant engineer has been added there to address this concern.
  • Ground noise caused by the ungrounded 480V system.
  • A shared common reference that becomes distorted by noise.
  • Inherent lack of accuracy in the Hall Effect sensor boards. Bench tests have shown that under laboratory-type conditions, the best accuracy achievable is on the order of +/-5%.
  • Electromagnetic interference to the current signals caused by their proximity to the rectifier reactors.
  • Ground loops, exasperated by the installation of a new driven-ground rod at the UPS powering the wall-mounted computers.
  • The 30V wiring insulation on the temperature probes failing, and coming into contact with the 300V rectifier circuits. This is in evidence by burned insulation found, and by monitoring which showed a 300V offset (dc) on the ground system.

To date, the following steps have been taken to improve the system:

  • A ground fault was isolated from the power system.
  • A recorder was used to check the accuracy of the signals going to the wall computers.
  • Filter capacitors installed on the Analog Input Boards to the controller, to correct the noise on the current signals.
  • The driven-ground rod at the UPS was removed from the system.
  • The temperature probes and their associated shield wires were isolated from the system.
  • A BMI-8800 Power Disturbance Recorder was installed on the power feed to the wall computers, to monitor for ground noise.
Figure 1 – Powering Arrangements for the Wall Computers

Figure 1 shows how the wall computers are powered. The system lacks a ground reference point — a single point where all ground wires are connected from. The system would be improved by powering each wall computer from a dedicated circuit, each with an individual ground connection. The improved system would have ground connections run with separate wires that are all tied to a common reference point inside the breaker panel. The common reference point would be a ground bus designed for such a purpose (often a 1/4” copper plate is used).

Figure 2 – Current Sensor Board with Shared Signal Return

Figure 2 depicts the current sensor board. The board is used for eight Hall Effect transducers to monitor the current of eight circuits. The board is designed with a signal common for all the signal transducers. Bench tests indicate that the transducers appear to be accurate within 0.5%. However, those tests show that the signal common causes the reference to be corrupted, such that the accuracy of this board is only within about 5%, and the errors are not consistent.

An improved design of this board would have separate commons for all of the eight signals. Twisted-pair, shielded cable would offer the best immunity for electromagnetic and electric field interference. The shield of the cable should be grounded at both ends, to ensure the integrity of an alternative path (rather than through the signal conductors) for electromagnetic interference. The shield of the cable should be tied to the grounding of enclosures, etc., and not to the logic common. Where possible, the logic common of the system should be isolated from the safety grounding system.

Table 1 – Measurements Taken with a Fluke 41 Hand-held Harmonics Meter

11:00 AM1:00PM5:20PM6:30PM
UPS Input Voltage240V 2%THD236V 1.8%THD234V 2.2%THD
UPS Input Voltage (L-Ns)117.8/117.8118/118117.2/117.2
UPS Output Voltage235V 0.7%THD235V 3.2%THD235V 6.5%THD
UPS Output Voltage (L-Ns)111.5/121.6115/119116.3/118.3
Common-Earth Voltage0.1V0.0V0.1V
Ground Wire to Transformer Ground Current0.16A 40%THD0.16A 29%THD0.18A 27%THD0.18A 26%THD
Ground Wire to UPS (1) Ground Current0.16A 33%THD0.19A 30%THD0.20A0.19A 25%THD
Ground Wire to UPS (2) Ground Current0.19A 23%THD0.2A 24%THD0.26A 40%THD0.27A 40%THD
Ground Wire to Wall Units Ground Current0.07A0.08A0.14A0.14A 35%THD
UPS Input Current3.11A 6.5%THD3.85A 6.9%THD6.12A 12%THD6.12A 12%THD
UPS Output Current0.05A2.0A 120%THD5.64A 101%THD5.62A 100%THD

The measurements in Table 1 were taken with the system in an isolated state. The high amount of harmonic distortion in the UPS output current is normal for computer switch mode power supplies. The amount of harmonic distortion in the ground currents is indicative of zero sequence (chiefly third harmonic) frequencies present — and also is not unusual. In general, the currents flowing through the grounding system were seen to be negligible. These measurements were taken after the ground rod was disconnected from the system. If the ground rod were reconnected to the system, it is possible it would attract other fault current from the plant, generating more noise on the signal reference.

Should difficulties arise in the future, the currents in the ground wires should be checked. The values in Table 1 provide a reference. For example, if the temperature probes are reconnected, it is possible a fault in one of them could cause ground current to flow, and a noisy data reference. Such a problem might be discovered by a relatively high amount of current flowing through the ground wires.

Figure 3 – Power Disturbance Analyzer Connections

A BMI power disturbance analyzer was connected to the system as shown in Figure 3. The purpose of this connection was to determine if there was noise on power (channels 1-2) and the data common signal (channels 3-4). Also the analyzer provides “time stamping” of any disturbances that might be correlated with any operation difficulties of the system.

Table 2 summarizes some of the early results from the disturbance analyzer. The levels recorded should be considered normal. It is important to note that the signal common-to-earth voltage remained at a very low level. Should a ground fault interfere with the signal common, this should show up on this measurement.

Table 2 – Power Disturbance Analyzer Measurement Results

Feb 1
5:00-6:00 pm
Feb 1
6:00-7:00PM
Feb 2
9:00-12:00Noon
UPS IN 240
RMS
Noise
228.1-235.9V
0.0-0.9Vpk
227.6-234.9V
0.1-0.9Vpk
229-233.9V
0.1-0.2Vpk
UPS OUT 240
RMS
Noise
229.5-236.4V
0.1-1.8Vpk
230.0-236.4V
0.1-0.9Vpk
233.3-234.8V
0.1-0.1Vpk
UPS OUT 120
RMS
Noise
114.5-117.4V
0.1-1.0Vpk
113.8-117.2V
0.1-0.9Vpk
115.7-116.2V
2.7-3.1Vpk
Common-Earth
RMS
Noise
0.0-0.2V
0.3-1.1Vpk
0.1-0.2V
0.3-0.9Vpk
0.0-0.1V
0.1-0.2Vpk
HARMONICS

During the shutdown of Thanksgiving 1993, harmonic filter capacitors were installed on the 480V mains. Currently the harmonic distortion typically found in the plant is about 2% THD, which is well within the IEEE Standard 519 recommended guideline of 5%.

Prior to the installation of the filters, the harmonic distortion on the system was reported to be as high as 19%, dominated by the 5th harmonic frequency. These conditions were clearly caused by the Bitrode rectifiers in combination with the power factor correction. The power factor correction is required for voltage support. The Bitrode rectifiers are a six-pulse design, which would be expected to generate high amounts of 5th, 7th, 11th, and 13th harmonic frequencies. These past conditions would have exceeded the amount of harmonic voltage distortion (generally thought to be around 10% THD) that can cause electric motors to run at higher temperatures, and may have weakened the insulation of some of the motors at the facility.

UNGROUNDED DISTRIBUTION SYSTEM

The system at the Plant utilizes a 480V, three-wire ungrounded power system. Although the system is intentionally ungrounded, a reference to ground normally exists due to distributed capacitance between the phases and ground, and also due to the presence of the ground detection lights. Normally, this will allow each phase to be 277V above ground. When one phase of the three-wire system comes into contact with ground, while some capacitive charging current may flow, there is no substantial fault current. This condition causes one of the phases becomes grounded, while the other phases rise to 480V above ground. Additionally, this condition can also lead to an arcing ground fault, which has the potential to cause damaging overvoltage conditions.

Several of the drawbacks of ungrounded power systems are described in the book, Industrial Power Systems Handbook, edited by Donald Beeman, 1955 McGraw-Hill. In one particular instance cited in the book, a plant failed 40-50 motors during a two-hour period due to an arcing fault. In that instance a test instrument revealed voltages above 1200V phase-to-ground on a 480-volt system.

The ANSI/IEEE Std 141-1993 Recommended Practice for Electric Power Distribution for Industrial Plants makes the following statements (page 365):

“It is generally conceded that this practice (ungrounded systems) introduces potential hazards to insulation in apparatus supplied from the ungrounded system.”

“Because of the capacitance coupling to ground, the ungrounded system is subject to dangerous overvoltages (five times normal or more) as a result of an intermittent contact ground fault (arcing fault) or a high inductive reactance connected from phase to ground or phase to phase”

Accumulated operating experience indicates that, in general-purpose industrial power distribution systems, the overvoltage incidents associated with ungrounded operation diminish the useful life of insulation in such a way that electric circuit and machine failures occur more frequently than they do on grounded systems.”

It is possible to ground the 480-volt power system. Since the 480-volt system originates at a single bus in the substation, it would be possible to apply a single grounding transformer there. The required size of the grounding transformer would be approximately one-tenth the size of the overall transformer supply. However, ground fault protection would also be required at the switchgear, at a cost which has been estimated to be around $100,000.

The building schematics show the existing switchgear connected to a ground grid, while the new switchgear panel in the substation is connected to separate earth electrodes. Improved lightning performance would result from bonding both earth connections together. One method of doing this would be to ensure they are both connected to the ground grid.

The 300-volt dc circuits for the battery formation process are also ungrounded. However, none of the potential overvoltage situations possible with the ac system exist with the dc system. The ungrounded dc system has the support of years of operating without serious injury to personnel, and should be continued.

SUMMARY

The difficulties with the formation computer system are primarily due to the following factors:

  • Lack of electrical isolation between the input sensors (temperature and current)
  • Noise on the grounding system due to arcing faults.
  • Inherent inaccuracies present in the original design.
  • Grounding of the reference signals that does not originate at a “single point.”

The following measures have already been undertaken to improve the performance of the formation computer controls:

  • The signals from the current sensors are filtered.
  • A ground fault removed from the power system
  • The temperature probes are isolated from the system.
  • The driven ground rod at the UPS has been eliminated

Specific recommendations to consider for improvement of the formation control system:

  • Run a separate power circuit and ground wire to each process computer. Have each of the 12 ground wires connected to a common ground bus (1/4” copper plate or similar) and make sure this ground bus is tied to building steel, and to the ground lug at the 480V bus duct.
  • Tie the shield (of the cable from the current sensor board) to ground at both ends. This will restore the electromagnetic shielding. Do not connect it directly to data common. Assure it has good contact with building steel, via conduit, etc.

Although the ungrounded power system causes some overvoltage conditions that occasionally cause motors to fail, it is probably not justifiable to expend $50-100k to change it. The harmonic distortion levels at the plant are currently acceptable.

REFERENCES

Industrial Power Systems Handbook, edited by Donald Beeman, 1955 McGraw-Hill.


RELATED STANDARDS
IEEE Standard 519
ANSI/IEEE Standard 141-1993 Recommended Practice for Electric Power Distribution for Industrial Plants

GLOSSARY AND ACRONYMS
IEEE: Institute of Electrical and Electronics Engineers
THD: Total Harmonic Distortion

ITI (CBEMA) Curve Application Note

Published by Information Technology Industry Council (ITI), 1250 Eye Street NW Suite 200, Washington DC 20005, 202-737-8888, http://www.itic.org


The ITI (CBEMA) Curve, included within this Application Note, is published by Technical Committee 3 (TC3) of the Information Technology Industry Council (ITI, formerly known as the Computer & Business Equipment Manufacturers Association). It is available at http://.www.itic.org/technical/iticurv.pdf.

1) SCOPE
The ITI (CBEMA) Curve and this Application Note describe an AC input voltage envelope which typically can be tolerated (no interruption in function) by most Information Technology Equipment (ITE). The Curve and this Application Note comprise a single document and are not to be considered separately from each other. They are not intended to serve as a design specification for products or AC distribution systems. The Curve and this Application Note describe both steady-state and transitory conditions.

2) APPLICABILITY
The Curve and this Application Note are applicable to 120V nominal voltages obtained from 120V, 208Y/120V, and 120/240V 60Hz systems. Other nominal voltages and frequencies are not specifically considered and it is the responsibility of the user to determine the applicability of these documents for such conditions.

3) DISCUSSION
This section provides a brief description of the individual conditions which are considered in the Curve. For all conditions, the term “nominal voltage” implies an ideal condition of 120V RMS, 60Hz. Seven types of events are described in this composite envelope. Each event is briefly described in the following sections, with two similar line voltage sags being described under a single heading. Two regions outside the envelope are also noted. All conditions are assumed to be mutually exclusive at any point in time, and with the exception of steady-state tolerances, are assumed to commence from the nominal voltage. The timing between transients is assumed to be such that the ITE returns to equilibrium (electrical, mechanical, and thermal) prior to commencement of the next transient.

3.1) Steady-State Tolerances
The steady-state range describes an RMS voltage which is either very slowly varying or is constant. The subject range is +/- 10% from the nominal voltage. Any voltages in this range may be present for an indefinite period, and are a function of normal loadings and losses in the distribution system.

3.2) Line Voltage Swell
This region describes a voltage swell having an RMS amplitude of up to 120% of the RMS nominal voltage, with a duration of up to 0.5 seconds. This transient may occur when large loads are removed from the system or when voltage is supplied from sources other than the electric utility.

3.3) Low-Frequency Decaying Ringwave
This region describes a decaying ringwave transient which typically results from the connection of powerfactor-correction capacitors to an AC distribution system. The frequency of this transient may range from 200Hz to 5KHz, depending upon the resonant frequency of the AC distribution system. The magnitude of the transient is expressed as a percentage of the peak 60Hz nominal voltage (not the RMS value). The transient is assumed to be completely decayed by the end of the half-cycle in which it occurs. The transient is assumed to occur near the peak of the nominal voltage waveform. The amplitude of the transient varies from 140% for 200Hz ringwaves to 200% for 5KHz ringwaves, with a linear increase in amplitude with increasing frequency. Refer to Figure 1 for an example of a typical waveform.

Figure 1 – Typical Low Frequency Decaying Ringwave

3.4) High-Frequency Impulse and Ringwave
This region describes the transients which typically occur as a result of lightning strikes. Wave shapes applicable to this transient and general test conditions are described in ANSI/IEEE C62.41-1991. This region of the curve deals with both amplitude and duration (energy), rather than RMS amplitude. The intent is to provide an 80 Joule minimum transient immunity.

3.5) Voltage Sags
Two different RMS voltage sags are described. Generally, these transients result from application of heavy loads, as well as fault conditions, at various points in the AC distribution system. Sags to 80% of nominal (maximum deviation of 20%) are assumed to have a typical duration of up to 10 seconds, and sags to 70% of nominal (maximum deviation of 30%) are assumed to have a duration of up to 0.5 seconds.

3.6) Dropout
A voltage dropout includes both severe RMS voltage sags and complete interruptions of the applied voltage, followed by immediate re-application of the nominal voltage. The interruption may last up to 20 milliseconds. This transient typically results from the occurrence and subsequent clearing of faults in the AC distribution system.

3.7) No Damage Region
Events in this region include sags and dropouts which are more severe than those specified in the preceding paragraphs, and continuously applied voltages which are less than the lower limit of the steady-state tolerance range. The normal functional state of the ITE is not typically expected during these conditions, but no damage to the ITE should result.

3.8) Prohibited Region
This region includes any surge or swell which exceeds the upper limit of the envelope. If ITE is subjected to such conditions, damage to the ITE may result.

ITI (CBEMA) Curve (Revised 2000)

ITI (CBEMA) Curve (Revised 2000)

Flickering Lights

Published by Electrotek Concepts, Inc., PQSoft Case Study: Flickering Lights Wiring and Grounding Case Study, Document ID: PQS0403, March 30, 2004.


Abstract: This case study concerns a residential electrical system. The homeowners were experiencing light flicker when loads were energized and de-energized in their home.

INTRODUCTION

Residential electric systems are served from single-phase transformers employing a spilt secondary winding, often referred to as a single-phase 3-wire system. This type of transformer is used to deliver both 120 volt and 240-volt single-phase power to the residential loads. The primary of the transformer is often served from a 12kV to 15kV distribution system by the local utility. Figure 1 illustrates the concept of a split phase system.

Figure 1 – Residential Split-Phase Electric Service

When this type of service is operating properly, 120 volts can be measured from either leg to the neutral conductor. Due to the polarity of the secondary windings in the transformer, the polarity of each 120-volt leg is opposite the other, thus allowing a total of 240 volts between each leg as illustrated. The proper operation of this type of system is dependent on the physical connection of the neutral conductor or center tap of the secondary winding. If the neutral connection is removed, 240 volts will remain across the two legs, but the line to neutral voltage for either phase can be shifted, causing either a low or high voltage from line to neutral.

Most loads—lighting, televisions, microwaves, home electronics, etc.—in a residential dwelling are operated from 120 volts. However, there are a few major loads that incorporate the use of the 240 volts available. These loads include electric water heaters, electric stoves and ovens, heat pumps, etc.

THE PROBLEM

In this case, there were problems in the residence that caused the homeowner to question the integrity of the power system serving his home. On occasion, the lights would flicker erratically when the washing machine and dryer were operating at the same time. When large single-phase loads were operated, low power incandescent light bulb intensity would flicker.

Measurements were performed at several 120-volt outlets throughout the house. When the microwave was operated, the voltage at several of the 120-volt outlets would increase from 120 volts nominal to 128 volts. The voltage would return to normal after the microwave was turned off. The voltage would also increase when a 1500-Watt space heater was operated. It was determined that the voltage would decrease to approximately 112 volts on the leg from which the large load was served. After the measurements confirmed suspicions of high and low voltages during heavy load operation, finding the source of the problem was the next task at hand.

The hunt began at the service entrance to the house. A visual inspection was made of the meter base & socket after the meter was removed by the local utility. It was discovered that one of the neutral connectors was loose. While attempting to re-tighten this connector, the connector fell off of the meter socket into the bottom of the meter base (see Figure 2). Could this be the cause of the flickering voltage? Let’s examine the effects of the loose neutral connection.

Figure 2 – Photograph of Meter Base

Figure 3 and Figure 4 will be referred to several times during this discussion. Under normal conditions with a solid neutral connection (Figure 3), load current flows through each leg and is returned to the source through the neutral conductor. There is very little impedance in either the hot or the neutral conductor; therefore, no appreciable voltage drop exists.

When the neutral is loose or missing, a significant voltage can develop across the neutral connection in the meter base, as illustrated in Figure 4. When a large load is connected across Leg 1 to N and the other leg is lightly loaded (i.e. Leg 1 to N is approximately 10 times the load on Leg 2 to N), the current flowing through the neutral will develop a voltage across the loose connection. This voltage is in phase with the voltage from Leg 1 to N’ (see Figure 4) and the total voltage from Leg 1 to N will be 120 volts. However, the voltage supplied to any loads connected from Leg 2 to N’ will rise to 128 volts, as illustrated in Figure 4. The total voltage across the Leg 1 and Leg 2 must remain constant at 240 volts. It should be noted that the voltage from Leg 2 to N will be 120 volts since the voltage across the loose connection is 180 degrees out of phase with the Leg 2 to N’ voltage.

Therefore, with the missing neutral connection, the voltage from Leg 2 to N’ would rise causing the light flicker. This explains the rise in voltage when a large load was energized on the system.

Figure 3 – Diagram Illustrating the Effects of Solid Neutral Connection
Figure 4 – Diagram Illustrating the Effects of Loose Neutral Connection
THE SOLUTION

The solution in this case was simple – replace the failed connector.

SUMMARY

Over time the neutral connector had become loose. This loose connection caused heating, which in turn caused the threads on the connector to become worn, and the connector failed. After replacing the connector in the meter base, the flickering light phenomena disappeared.

On systems of this type, if a voltage rise occurs when loads are energized; it is a good indication that the neutral connection may be loose or missing.


RELATED STANDARDS
IEEE Standard 1100-1999 – Power and Grounding Electronic Equipment
IEEE Standard 142-1991 – Grounding of industrial and Commercial Power Systems
The National Electric Code (NEC) – Current Revision

GLOSSARY AND ACRONYMS
Neutral: A system or circuit conductor that is intentionally grounded. Also known as the “grounded” conductor.
KV: One kV is equal to one thousand volts.

Power Quality Standards, Problems and their Solutions

Published by Vedant S. Samudre, Department of electrical, electronics & power, Jawaharlal, Nehru Engineering College, Aurangabad, Maharashtra, India
Published in International Journal of Engineering Sciences & Research Technology (IJESRT)
Website: www.ijesrt.com
Samudre* et al., 5(12): December, 2016
DOI: 10.5281/zenodo.192584


ABSTRACT

Power quality is one of the major concerns and emerging issues in the present era. With increasing quantities of non-linear loads being added to electrical systems, it has become necessary to investigate the power quality issues as all electrical devices are prone to failure when exposed to one or more power quality problems. This paper highlights power quality problems, effect of power quality problems in different apparatuses and methods for its correction. This paper will be very much helpful for engineers, technicians, designers, researchers and system operators as it is necessary for them to become familiar with power quality issues.

KEYWORDS: Power quality (PQ), Standards, Problems.

INTRODUCTION

Power quality problem in the power system has gained importance since the late 1980s. The interest in Power Quality (PQ) is related to all three parties concerned with the power i.e. utility companies, equipment manufacturers and electric power consumers. Problems affecting the electricity supply that were once considered tolerable by the electric utilities and users are now often taken as a problem to the users of everyday equipment. Understanding power quality can be confusing at best. There have been numerous articles and books concerning power quality [1]. There are two terms known in power systems about the quality of power: Good power quality and poor power quality. Good power quality can be used to describe a power supply that is always available, always within the voltage and frequency tolerances and has a pure noise-free sinusoidal wave shape to all equipment, because most equipment was designed on that basis [4]. Unfortunately, most of the equipment that is manufactured also distorts the voltage [3] on the distribution system, leading to what is known as poor power quality. And thus affecting other equipment that was designed with the expectation of consistent undistorted voltage, and are thus sensitive [2] to power disturbances resulting in reduced performance and will cause equipment miss operation or premature failure. The cost of power quality problems can be very high and include the cost of downtimes, loss of customer confidence and, in some cases, equipment damage.

MATERIALS AND METHODS

Why power quality is important?

Along with technology advance, the organization of the worldwide economy has evolved towards globalization and the profit margins of many activities tend to decrease. The increased sensitivity of the vast majority of processes (industrial, services and even residential) to PQ problems turns the availability of electric power with quality a crucial factor for competitiveness in every activity sector. The most critical areas are the continuous process industry and the information technology services. [5] The performance of electronic devices is directly linked to the power quality level. Quality phenomenon or power quality disturbance can be defined as the deviation of the voltage and the current from its ideal waveform.. Faults at either the transmission or distribution level may cause voltage sag or swell in the entire system or a large part of it. Also, under heavy load conditions, a significant voltage drop may occur in the system. Voltage sag and swell can cause sensitive equipment to fail, shutdown and create a large current unbalance. These effects can incur a lot of expensive from the customer and cause equipment damage. So , in order to provide uninterrupted power to the service sectors as well as others for economic growth and prevent equipment damage with varying voltage level and frequency, undoubtedly power quality improvement is utmost important.

Power quality standards

Power quality is a worldwide issue and its related standards [6] being used by researchers, designer and practitioner to improve power quality are given below:

IEEE 519

IEEE 519-1992, Recommended Practices and Requirements for Harmonic Control in Electric Power Systems, established limits on harmonic currents and voltages at the point of common coupling (PCC), or point of metering [7,20]. The limits of IEEE 519 are intended to:
1) Assure that the electric utility can deliver relatively clean power to all of its customers
2) Assure that the electric utility can protect its electrical equipment from overheating, loss of life from excessive harmonic currents, and excessive voltage stress due to excessive harmonic voltage. Each point from IEEE 519 lists the limits for harmonic distortion at the point of common coupling (PCC) or metering point with the utility. The voltage distortion limits are 3% for individual harmonics and 5% THD. All of the harmonic limits in IEEE 519 are based on a customer load mix and location on the power system.

IEEE 519 Standard for Current Harmonics:

  • General Distribution Systems [120V- 69 kV]: Below current distortion limits are for odd harmonics. Even harmonics are limited to 25% of the odd harmonic limits [7, 9, and 11]. For all power generation equipment, distortion limits are those with ISC/IL<20.ISC is the maximum short circuit current at the point of coupling “PCC”.IL is the maximum fundamental frequency 15-or 30- minutes load current at PC.
  • General Sub-transmission Systems [69 kV-161 kV]: The current harmonic distortion limits apply to limits of harmonics that loads should draw from the utility at the PCC. Note that the harmonic limits differ based on the ISC/IL rating, where ISC is the maximum short circuit current at the PCC, and I is the maximum demand load current at the PCC.

Table no. 1: Current distortion limit for harmonics.

ISC/ILh<1111≤h<1717≤h≤2323≤h<25TDD (%)
<204.02.01.50.65
20-507.03.52.51.08
50-100104.54.01.512
100-1000125.55.02.015
>1000157.06.02.520

IEEE Standard For Voltage Harmonics:

The voltage harmonic distortion limits apply to the quality of the power. For instance, for systems of less than 69 kV, IEEE 519 requires limits of 3 percent harmonic distortion for an individual frequency component and 5 percent for total harmonic distortion.

Table no. 2: Voltage distortion limit for harmonics.

Bus VoltageIndividual Vh (%)THDV (%)
V<69 kV3.05.0
69≤V<161 kV1.52.5
V≥161 kV1.01.5

IEC 61000-3-2 and IEC 61000-3-4 (formerly 1000-3-2 and 1000-3-4)
IEC 61000-3-2 (1995-03)
It specifies limits for harmonic current emissions applicable to electrical and electronic equipment having an input current up to and including 16 A per phase, and intended to be connected to public low-voltage distribution systems. The tests according to this standard are type tests. [8, 15, 19]

IEC/TS 61000-3-4 (1998-10)
It specifies to electrical and electronic equipment with a rated input current exceeding 16 A per phase and intended to be connected to public low-voltage ac distribution systems of the following types:

  • nominal voltage up to 240 V, single-phase, two or three wires;
  • nominal voltage up to 600 V, three-phase, three or four wires
  • nominal frequency 50 Hz or 60 Hz

These recommendations specify the information required to enable a supply authority to assess equipment regarding harmonic disturbance and to decide whether or not the equipment is acceptable for connection with regard to the harmonic distortion aspect. The European standards, IEC 61000-3-2 & 61000-3-4, placing current harmonic limits on equipment, are designed to protect the small consumer’s equipment. The former is restricted to 16 A; the latter extends the range above 16 A.

IEEE Standard 141-1993, Recommended Practice for Electric Power Distribution for Industrial Plants A thorough analysis of basic electrical-system considerations is presented. Guidance is provided in design, construction, and continuity of an overall system to achieve safety of life and preservation of property; reliability; simplicity of operation; voltage regulation in the utilization of equipment within the tolerance limits under all load conditions; care and maintenance; and flexibility to permit development and expansion.

IEEE Standard 142-1991, Recommended Practice for Grounding of Industrial and Commercial Power Systems This standard presents a thorough investigation of the problems of grounding and the methods for solving these problems.[9,12]

IEEE Standard 446-1987, Recommended Practice for Emergency and Standby Power Systems for Industrial and Commercial Applications This standard is recommended engineering practices for the selection and application of emergency and standby power systems.[12]

IEEE Standard 493-1997, Recommended Practice for Design of Reliable Industrial and Commercial Power Systems

The fundamentals of reliability analysis as it applies to the planning and design of industrial and commercial electric power distribution systems are presented. Included are basic concepts of reliability analysis by probability methods, fundamentals of power system reliability evaluation, economic evaluation of reliability, cost of power outage data, equipment reliability data, and examples of reliability analysis. Emergency and standby power, electrical preventive maintenance, and evaluating and improving reliability of the existing plant are also addressed.[10,12,13,14]

IEEE Standard 1100-1999, Recommended Practice for Powering and Grounding Sensitive Electronic Equipment

Recommended design, installation, and maintenance practices for electrical power and grounding (including both power-related and signal-related noise control) of sensitive electronic processing equipment used in commercial and industrial applications. [12, 14]

IEEE Standard 1159-1995, Recommended active for Monitoring Electric Power Quality

As its title suggests, this standard covers recommended methods of measuring power-quality events. Many different types of power-quality measurement devices exist and it is important for workers in different areas of power distribution, transmission, and processing to use the same language and measurement techniques. Monitoring of electric power quality of AC power systems, definitions of power quality terminology, impact of poor power quality on utility and customer equipment, and the measurement of electromagnetic phenomena are covered.[11,14,16,17,18]

CLASSIFICATION OF POWER SYSTEM DISTURBANCES

Power quality problems occur due to various types of electrical disturbances. Most of the EPQ disturbances depend on amplitude or frequency or on both frequency and amplitude. Based on the duration of existence of EPQ disturbances, events can divided into short, medium or long type. The disturbances causing power quality degradation arising in a power system and their classification mainly include:

Interruption/under voltage/over voltage

These are very common type disturbances.
During power interruption, voltage level of a particular bus goes down to zero. The interruption may occur for short or medium or long period. Under voltage and over voltage are fall and rise of voltage levels of a particular bus with respect to standard bus voltage. Sometimes under and over voltages of little percentage is allowable; but when they cross the limit of desired voltage level, they are treated as disturbances. Such disturbances are increasing the amount of reactive power drawn or deliver by a system, insulation problems and voltage stability.

Voltage/current unbalance

Voltage and current unbalance may occur due to the unbalance in drop in the generating system or transmission system and unbalanced loading. During unbalance, negative sequence components appear.

Transients

Transients may generate in the system itself or may come from the other system. Transients are classified into two categories: dc transient and ac transient.AC transients are further divided into two categories: single cycle and multiple cycles. [21, 22]

Voltage sag

It is a short duration disturbance. [23] During voltage sag, r. m. s. voltage falls to a very low level for short period of time.

Voltage swell

It is a short duration disturbance. During voltage sag, r. m. s. voltage increases to a very high level for short period of time.

Harmonic

Harmonics are the alternating components having frequencies other than fundamental present in voltage and current signals. There are various reasons for harmonics generation like non linearity, excessive use of semiconductor based switching devices, different design constrains, etc. Harmonics have adverse effects on generation, transmission and distribution system as well as on consumer equipment’s also. Harmonics are classified as integer harmonics, sub harmonics and inter harmonics. Integer harmonics have frequencies which are integer multiple of fundamental frequency, sub harmonics have frequencies which are smaller than fundamental frequency and inter harmonics have frequencies which are greater than fundamental frequencies. Among these entire harmonics integer and inter harmonics are very common in power system. Occurrence of sub harmonics is comparatively smaller than others. Sometimes harmonics are classified: time harmonics and spatial (space) harmonics. Obviously their causes of occurrence are different. Harmonics are in general are not welcome and desirable. Harmonics are assessed with respect to fundamental. Monitoring of harmonics with respect to fundamental is important consideration in power system application For this purpose different distortion factor with respect to the fundamental have been introduced.

Flicker

It is undesired variation of system frequency.

Ringing waves

Oscillatory disturbances of decaying magnitude for short period of time is known as ringing wave. It may be called a special type transient. The frequency of a flicker may or may not be same with the system frequency.

Outages

It is special type of interruption where power cut has occurred for not more than 60s.

POWER QUALITY SOLUTIONS

Power conditioning devices

Following devices play a crucial role in improving power quality strategy.

Transient Voltage surge suppressor (TVSS)

It provides the simplest and least expensive way to condition power. These units clamp transient impulses (spikes) to a level that is safe for the electronic load. Transient voltage surge suppressors are used as interface between the power source and sensitive loads, so that the transient voltage is clamped by the TVSS before it reaches the load. TVSS usually contain a component with a nonlinear resistance (a metal oxide varistor or a Zener diode) that limits excessive line voltage and conduct any excess impulse energy to ground. [24]

Filter

Filters are categorized into noise filters, harmonic filters (active and passive) etc. [25] Noise filters are used to avoid unwanted frequency current or voltage signals (noise) from reaching sensitive equipment. This can be accomplished by using a combination of capacitors and inductances that creates a low impedance path to the fundamental frequency and high impedance to higher frequencies, that is, a low-pass filter. Harmonic filters are used to reduce undesirable harmonics. Passive filters consist in a low impedance path to the frequencies of the harmonics to be attenuated using passive components (inductors, capacitors and resistors)

Motor generator set

They are usually used as a backup power source for a facility’s critical systems such as elevators and emergency lighting in case of blackout. However, they do not offer protection against utility power problems such as over voltages and frequency fluctuations. Motor generators are consists of an electric motor driving a generator with coupling through a mechanical shaft. This solution provides complete decoupling from incoming disturbances such as voltage transients, surges and sags.

Isolation transformer

Isolation transformers [26] are used to isolate sensitive loads from transients and noise deriving from the mains. The particularity of isolation transformers is a grounded shield made of nonmagnetic foil located between the primary and the secondary. Any noise or transient that come from the source in transmitted through the capacitance between the primary and the shield and on to the ground and does not reach the load. Isolation transformers reduce normal and common mode noises, however, they do not compensate for voltage fluctuations and power outages. [26]

Fig 1: Noise attenuation by isolation transformer

Voltage regulators

Voltage regulators are normally installed where the input voltage fluctuates, but total loss of power is uncommon. There are three basic types of regulators:

  • Tap changers: Designed to adjust for varying input voltage by automatically transferring taps on a power transformer.
  • Buck boost: Utilize similar technology to the tap changers except transformer is not isolated.
  • Constant voltage transformer (CVT): It is completely static regulator that maintains nearly constant output voltage during large variation in input voltage.

Uninterrupted power supply (UPS)

UPS systems provide protection in the case of a complete power interruption (blackout). They should be applied where “down time” resulting from any loss of power is unacceptable. UPS are designed to provide continuous power to the load in the event of momentary interruptions. They also provide varying degrees of protection from surges, sags, noise or brownouts depending on the technology used. [24]

There are three major UPS topologies each providing different levels of protection:

  • Offline UPS: Low cost solution for small, less critical, stand-alone application such as PLC, personal computers and peripherals. Advantages of offline UPS are high efficiency, low cost and high reliability.
  • Line interactive UPS: These UPS provides highly effective power conditioning plus battery backup. Advantages are good volume regulation and high efficiency. Disadvantages are noticeable transfer time and difficulty in comparing competing units.
  • True Online UPS: It provides the highest level of power protection, conditioning and power availability. Advantages includes the elimination of any transfer time and superior protection from voltage fluctuation.
Fig 2: Offline UPS system
Fig 3: Online UPS system

Dynamic Voltage Regulator (DVR)

A dynamic voltage restorer (DVR) acts like a voltage source connected in series with the load. The output voltage of the DVR is kept approximately constant voltage at the load terminals by using a step-up transformer and/or stored energy to inject active and reactive power in the output supply through a voltage converter. [27]

Fig 4: Dynamic Voltage Regulator.

Unified Power Quality Conditioner (UPQC)

The UPQC employs two voltage source inverters (VSI) that is connected to a dc energy storage capacitor .A UPQC, combines the operations of a Distribution Static Compensator (DSTATCOM) and Dynamic Voltage Regulator (DVR) together. This combination allows a simultaneous compensation of the load currents and the supply voltages, so that compensated current drawn from the network and the compensated supply voltage delivered to the load are sinusoidal and balanced. [28]

Fig 5: Basic structure of UPQC

Thyristor based switch

The static switch is a versatile device for switching a new element into the circuit when voltage support is needed. To correct quickly for voltage spikes, sags, or interruptions, the static switch can be used to switch in capacitor, filter, alternate power line, energy storage system etc. It protects against 85% of the interruptions and voltage sags. [28]

Static VAR compensator (SVC)

Static VAR compensators (SVC) use a combination of capacitors and reactors to regulate the voltage quickly. Solid-state switches control the insertion of the capacitors and reactors at the right magnitude to prevent the voltage from fluctuating. It is normally applied to transmission networks to counter voltage dips/surges during faults. [24]

Fig 6: Static VAR Compensator (SVC)
CONCLUSION

An extensive review of work done power quality issues has been presented to provide a clear perspective on various aspects of the power quality to the researchers and engineers working in this field. To overcome the negative impact of poor power quality on equipment and businesses, suitable power quality equipment can be invested.

REFERENCES

[1] “Details of equipment sensitivity,” http://www.powerquality.com/pqpark/pqpk1052.hm
[2] A. Rash, “Power quality and harmonics in the supply network: a look at common practices and standards,” in Proc. On MELECON’ 98, Vol.2, pp.1219-1223, May1998
[3] R.C. Sermon, “An overview of power quality standards and guidelines from the end-user’s point-of-view,” in Proc. Rural Electric Power Conf., pp. 1-15, May 2005
[4] IEC 61000-4-30, “Testing and measurement techniques – Power quality measurement methods,” pp. 19, 78, 81, 2003
[5] Ferracci, P., “Power Quality”, Schneider Electric Cahier Technique no. 199, September 2000.
[6] S. Khalid et al “Power quality issues, problems, standards & their effects in industry with corrective means” International Journal of Advances in Engineering & Technology(IJAET),vol-1,issue 2, pp 1-11,May 2011.
[7] IEEE, “IEEE Recommended Practices and Requirements for Harmonic Control in Electrical Power Systems,” IEEE Std. 519-1992, revision of IEEE Std. 519-1981
[8] IEC, Electromagnetic Compatibility, Part 3: Limits- Sect.2: Limits for Harmonic Current Emission,” IEC 1000-3-2, 1st ed., 1995
[9] V. K. Dhar, “Conducted EMI Analysis—A Case Study,” Proceedings of the International Conference on Electromagnetic Interference and Compatibility ‘99, December 6–8, 1999, pp. 181–186.
[10] IEEE, “IEEE Guide for Service to Equipment Sensitive to Momentary Voltage Disturbances,” IEEE Std. 1250–1995.
[11] IEEE, “IEEE Recommended Practice for Evaluating Electric Power System Compatibility with Electronic Process Equipment,” IEEE Std. 1346-1998.
[12] IEEE Std 446-1987, “IEEE Recommended Practice for Emergency and Standby Power Systems for Industrial and Commercial Applications,”
[13] IEEE Std 1250-1995, “IEEE Guide for Service to Equipment Sensitive to Momentary Voltage Disturbances,” Art 5.1.1, Computers.
[14] IEEE 100, The Authoritative Dictionary of IEEE Standard Terms, seventh edition, 2000, p. 234.
[15] Mohan, Underland and Robbins, Power Electronics, John Wiley and Sons, 1995.
[16] R. C. Dugan, M. F. McGranaghan, S. Santosa, and H. W. Beaty, Electrical Power Systems Quality, 2nd edition, McGraw-Hill, 2002.
[17] Blajszczak, G. Antos, P, “Power Quality Park – Idea and feasibility study,” Proc. Of Electric Power Quality and Supply Reliability Conference (PQ), 16-18 June, pp 17 – 22, 2010.
[18] S.Khalid, B.Dwivedi, “A Review of State of Art Techniques in Active Power Filters and Reactive Power Compensation,” National Journal of Technology, No 1, Vol. 3, pp.10-18, Mar. 2007.
[19] Alexander Kusko, Marc T. Thompson, “Power Quality in Electrical Systems, McGraw-Hill, New York, 2007.
[20] J. G. Boudrias, “Harmonic Mitigation, Power Factor Connection, and Energy Saving with Proper Transformers and Phase Shifting Techniques,” Proc. Of Power Quality Conference, ‘04, Chicago, IL
[21] Bollen, M.H.J., Styvaktakis, E., Yu-HuaGu, I.: Categorization and analysis of power system transients. IEEE Trans. Power Deliv. 20(3), 2298–2306 (2005)
[22] Herath, C., Gosbell,V., Perera, S.:A transient index for reporting power quality (PQ) surveys. Proceedings CIRED 2003, pp. 2.61-1–2.61-5. Bercelona, Spain (2003)
[23] Djokic, S.Z., Desmet, J., Vanalme, G., Milanovic, J.V., Stockman, K.: Sensitivity of personal computer to voltage sags and short interruption. IEEE Trans. Power Deliv. 20(1), 375–383 (2005)
[24] Marty Martin, “Common power quality problems and best practice solutions,” Shangri la Kuala Lumpur, Malaysia 14. 1997
[25] Singh, B., AL Haddad K., Chandra, A., “A review of active filters for power quality improvement,” IEEE Trans. Ind. Electron., Vol. 46, pp 960–970, 1999
[26] Arrillaga, J., Watson N.R., Chen, S., Power system quality assessment, John Wiley and Sons, 2000.
[27] Sabin D.D., Sundaram, A., “Quality enhances reliability”. IEEE Spectrum, Feb. 1996. 34 41.
[28] Anurag Agarwal, Sanjiv Kumar, Sajid Ali, “A Research Review of Power Quality Problems in Electrical Power System”. MIT International Journal of Electrical and Instrumentation Engineering, Vol. 2(2), pp. 88-93, 2012.