Published by Pavan Babu Bandla 1, Indragandhi Vairavasundaram 1, Yuvaraja Teekaraman 2, Ramya Kuppusamy 3 and Srete Nikolovski 4,*
1School of Electrical Engineering, Vellore Institute of Technology, Vellore 632014, India
2MOBI-Mobility, Logistics and Automotive Technology Research Centre, Vrije Universiteit Brussel, 1050 Brussels, Belgium
3Department of Electrical and Electronics Engineering, Sri Sairam College of Engineering, Bangalore 562106, India
4Power Engineering Department, Faculty of Electrical Engineering, Computer Science and Information Technology, University of Osijek, 31000 Osijek, Croatia
*Author to whom correspondence should be addressed.
Abstract
Voltage sag is one of the most significant power quality problems in the industry and has a significant impact on induction motor safety and stability. This paper analyzes the characteristics of voltage dips in power systems and induction motors with a special emphasis on balanced dips with the help of virtual grids (regenerative grid simulator), as per IEC 61000-4-11. Three phase induction motors with 3.3 kW, 16 A coupled to a DC generator with 3.7 kW, and 7.8 A rated are considered for the test analysis. This paper aids in the development of an induction motor to achieve improved precision by taking different voltage sags into account. The experimental results benefit the design modifications of induction motors at industrial and other commercial levels of consumers regarding major power quality issues and the behavior of the induction motors. A proposed modification employing ANSYS is provided to further examine the precise performance of induction motors during sag events.
Keywords: power quality; voltage sag; induction motor; grid emulator; ANSYS
1. Introduction
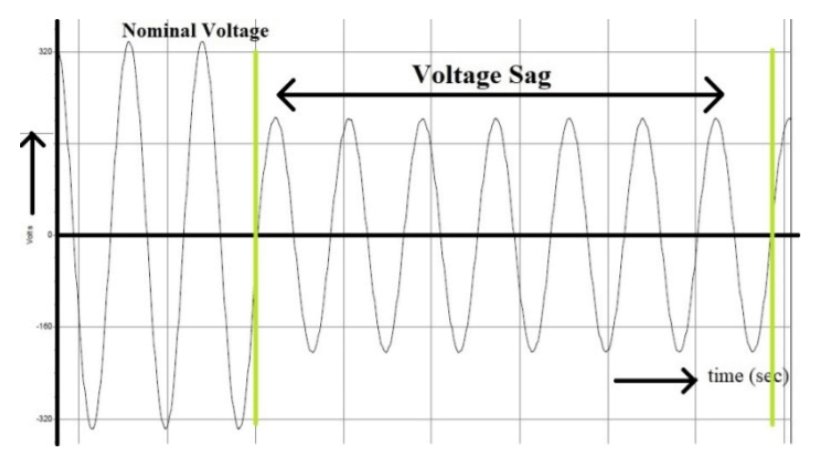
Voltage sags are thought to be responsible for between 92–98 percent of all outages caused by power supply problems [1]. As a result, it’s critical to precisely analyze the impact of voltage sags. In the conventional sag characterization technique, voltage sags are characterized by their magnitude and duration. During the sag, the magnitude is defined as a percentage of the remaining voltage (as shown in Figure 1). The duration of the sag in this example is the time between the start and end of the sag. In recent years, one of the most critical concerns that electrical engineers have been aware of is power quality. Various power quality issues, such as voltage sags, voltage distortions, voltage imbalances, and voltage fluctuations, are frequent in power systems, wreaking havoc on generators, transformers, and industrial and home loads [2,3]. The induction motor is one of the most common industrial loads that are affected by power quality issues. Using low-quality voltage to power induction motors results in additional losses, overheating, and a drop in efficiency.
Voltage sag is a common occurrence in transmission and distribution systems [4]. Short circuits, overloads, or the starting of powerful motors cause voltage sag, which is a short-term drop in the root mean square (RMS) voltage. Voltage sags are gaining popularity as a result of their negative impact on sensitive equipment. Even if the voltage dips below 90% of the specified voltage for more than a few cycles, such equipment can trip. Furthermore, voltage sags are caused by faults that occur hundreds of kilometers away [5-8]. Even if the voltage sag is not as severe as an interruption, the overall damage caused by sags is larger than that caused by interruptions since there are much more voltage sags than interruptions.
2. Methodology to Test the Sag Conditions Analysis of Sag Conditions
2.1. Regenerative Grid Simulator
A regenerative grid simulator may be used to modify essential parameters in order to replicate a reliable distribution grid/network conditions and settings, as illustrated in Figure 2. In single and three phase modes, variations in voltage amplitude, frequency, voltage dips, and phase angle are all maintained [9-12]. Simulating balanced and unbalanced situations (three phases) is simple. This simulator also satisfies IEC regulatory requirements 61000-4-11, which is a requirement for the AC supply [13-15]. The measurement accuracy of the Regenerative Grid Simulator are: Voltage—0.2% + 0.2% F.S, Current (RMS)—0.4% + 0.3% F, Current (Peak)—0.4% + 0.6% F.S, and Power—0.4% + 0.4% F.S.

2.2. Computer Control
The graphical user interface (GUI) was created with the goal of making the regenerative grid simulator setup as easy as possible. The soft panel (GUI) is installed in a computer that also has data recording functions, allowing many measurements to be reported and saved at the same time.
2.3. Load
For the distribution network, there are three phases—3.3 kW, 16 A with a DC generator as a load with 3.7 kW, and a 7.8 A induction motor are connected. There is also a power analyzer/fluke, since electronic power conversion designs should have high accuracy measurements to analyze and explain the incremental efficiency gains in devices.
2.4. Measurement
A power analyzer or fluke was formerly used to take accurate measurements and display repeated oscilloscope and particular shot events, like turn on and transients. The Oscilloscope utilized was different. The measurement setup’s complexity and configuration time are both decreased. The measurement accuracy for the power analyzer are: basic accuracy (50/60 Hz)—0.05% of reading and best power accuracy (50/60 Hz)—0.1% of reading.
2.5. Test Process
One of four types of communication interfaces (GPIB, RS232, USB, and LAN) is chosen initially for communication between the PC and the AC source. The communication protocol is entered into the main window after it is set. The voltage and frequency parameters, as well as the sinusoidal output waveform, should all be set to the proper values. Phase edit selection can be used to adjust the output voltage in three phases for ease of usage. Various power quality tests may be performed in the PC window, with the results being recorded using the power analyzer.
3. Analysis of Sag Conditions
Figure 3 represents the hardware experimental setup for analyzing the single-phase sag in one of three phases, and symmetrical voltage sags in an induction motor at different stages.

3.1. Regenerative Grid Supply with Voltage Sag
In order to meet the Micro Grid test standards, the 61,800 Regenerative Grid Simulator can simulate various test scenarios such as voltage distortion, frequency fluctuations, and so on. Most crucially, the 61,800 series product’s regenerative functionality allows it to absorb power generated by the Discrete Generator (DG) on the micro grid and feed it back to the main grid as shown in Figure 4.
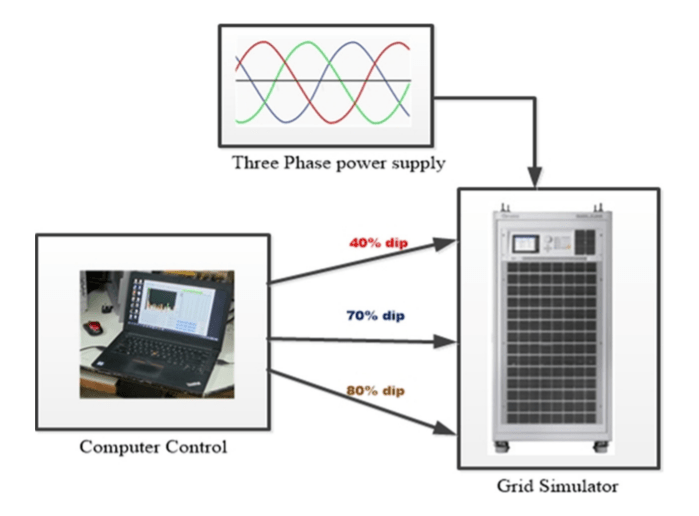
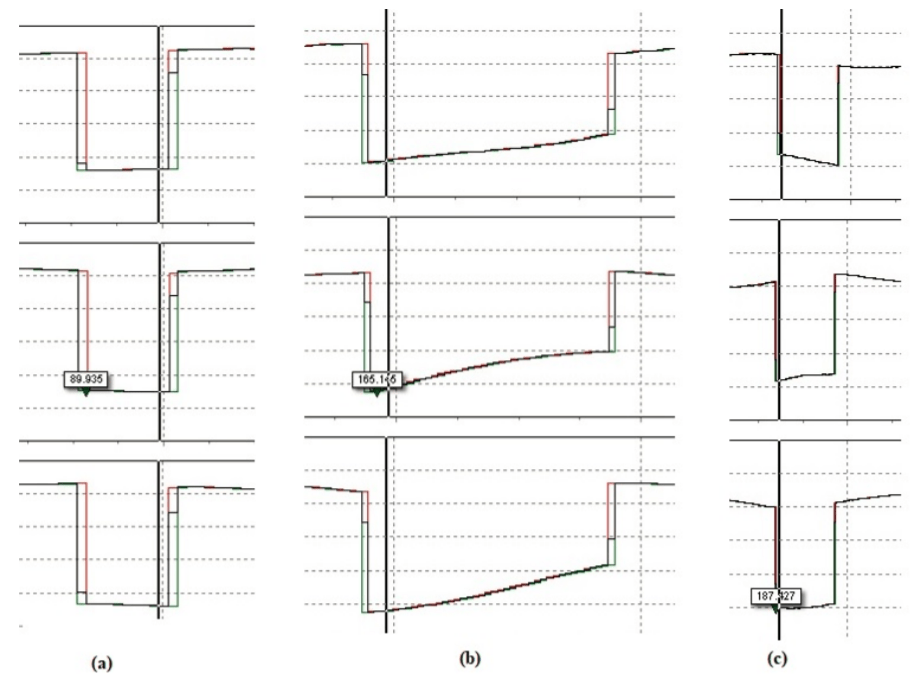
Figure 5 represents the voltage sag created in the regenerative simulator as per the IEC-61000 std through the soft panel. These sags are tested under 40%, 70%, and 80% dips, which are created and repeated a number of times in order to assess the behavior.

3.2. Induction Motor under Voltage Sag
Figure 6 represents the test setup of the DC generator-coupled induction motor when subjected to a single-phase sag in one of the three phases of the AC supply, which was created in the regenerative grid simulator. The tested results under loaded conditions with and without neutral connection are tabulated in Table 1 and Table 2.

Table 1. Induction motor under loaded conditions [neutral connected].

Table 2. Induction motor under loaded conditions [neutral not connected].
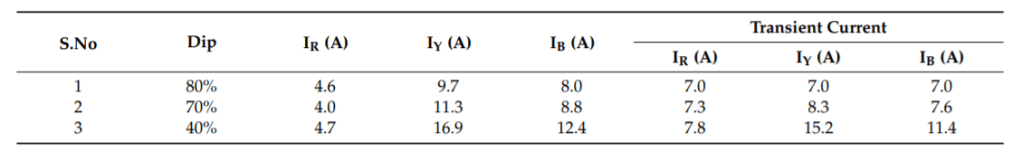
Figure 7 and Figure 8 represent the THD values of the current and voltage of the induction motor, respectively, during the single-phase sag conditions (neutrally connected) under no load conditions. Figure 9 and Figure 10 represent the same motor under the same conditions, but under loaded conditions.


3.3. Three Phase Sag
Generally balanced (symmetrical) voltage sags are caused by three-phase faults anywhere in the system for any short duration [16-19], as shown in Figure 11. In this approach, with the regenerative grid simulator, the three-phase sag is created and fed to the DC generator-coupled induction motor and is shown in Figure 12, Figure 13, Figure 14 and Figure 15. As discussed in Section 4, the test is carried out with neutral and without neutral connections under no load and full load conditions. The results obtained are tabulated in Table 3 and Table 4.
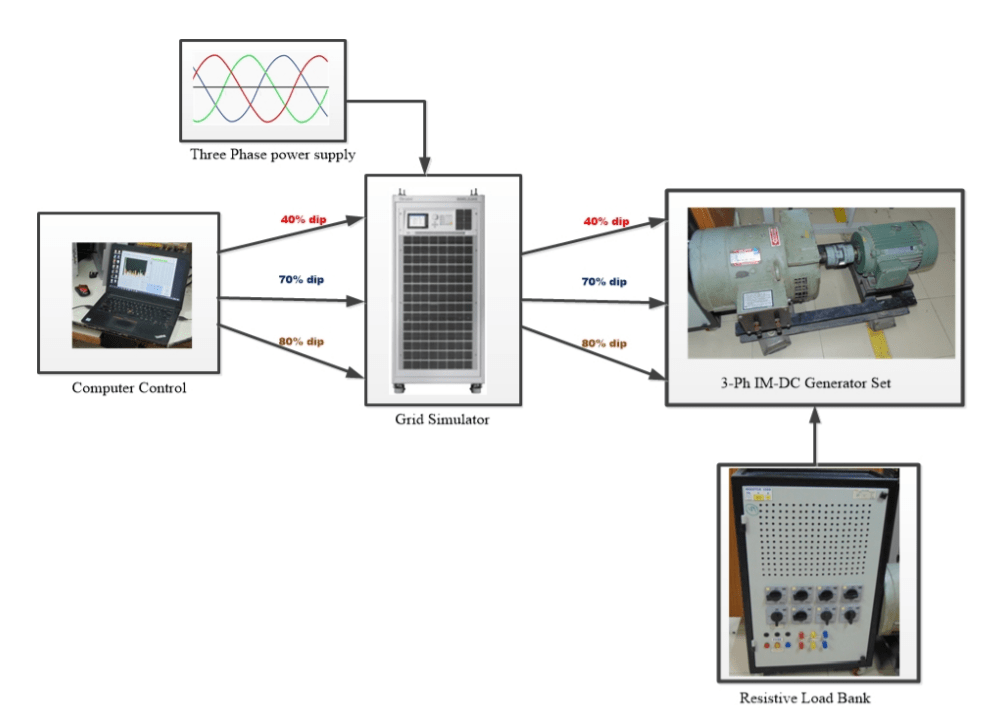


Table 3. Induction motor under loaded conditions [neutral not connected].
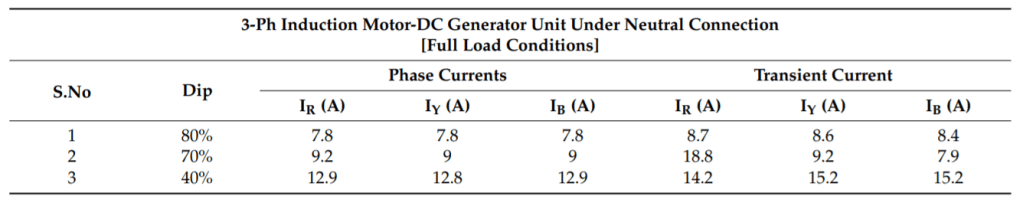
Table 4. IM-DC generator set under loaded conditions [neutral not connected].
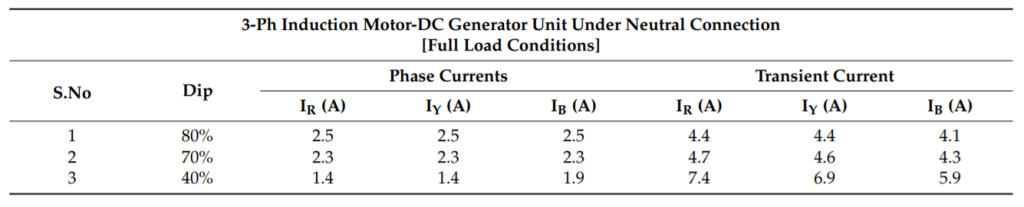
Figure 16 represents the three-phase symmetrical voltage sag at 40%, 70%, and 80% when fed to a three phase—3.3 kW and 16 A with a DC generator as a load via a regenerative grid simulator. The measurement summaries are given below:
Voltage (Nominal): 239 V
Current (Nominal): 40 A
Frequency (Nominal): 50 Hz
Number of events: Normal: 2, Detailed: 12
Power measurement method: Unified
Type of cable: Copper
Harmonic scale: %H1
Mode of THD: THD 40
DPF mode/Cos φ: Cos φ
Table 5 represents the symmetrical sag test on a three phase, 415 V, 5 Hp, 7.8 A induction motor when delta connected under loaded conditions, and star connected under loaded conditions with and without neutral connections, respectively.
Table 5. Delta connected three-phase induction motor under loaded conditions.

Table 6 represents the results of star connected(non-neutral) three phase—7 kW, 7.8 A induction motor under loaded conditions, which are tested with a 40%, 70%, and 80% sag. Under 40% sag, the load can be maintained up to 2.8 kg, which leads to a huge rise of the line current. Under 70% sag, the load can be maintained up to 3 kg, which leads to a huge rise of the line current. Under 80% sag, the load can be maintained up to 3.2 kg, which leads to a huge rise of the line current.
Table 6. Star connected (non-neutral) three-phase induction motor under loaded conditions.
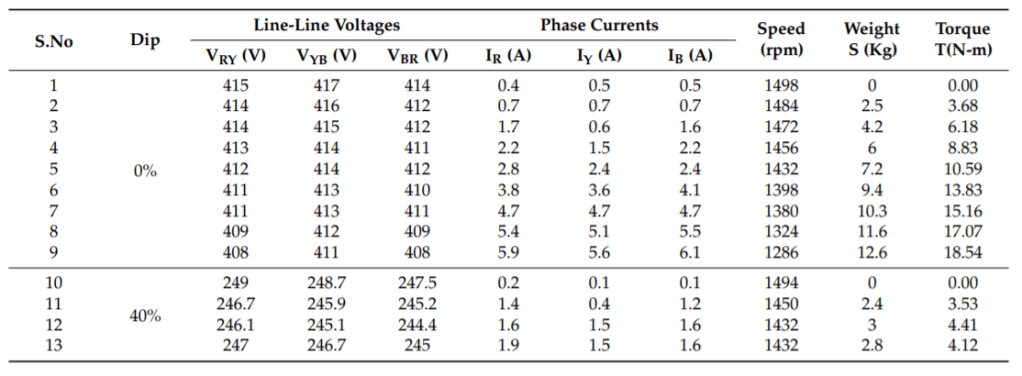

Table 7 represents the results of star connected (neutral) three phase—3.7 kW, 7.8 A induction motor under loaded conditions, which are tested with a 40%, 70%, and 80% sag. Under 40% sag, the load can be maintained up to 2.1 kg, which leads to a huge rise of the line current. Under 70% sag, the load can be maintained up to 2 kg, which leads to a huge rise of the line current. Under 80% sag, the load can be maintained up to 2.4 kg, which leads to a huge rise of the line current.
Table 7. Star connected (neutral) three-phase induction motor under loaded conditions.

4. Design Modifications of the Induction Motor Using ANSYS
The ANSYS is the most widely used tool in the industry for developing and analyzing electric motors. It enables for rapid and exact electromagnetic, thermal, and mechanical analysis of an electric machine over its complete operating range (Figure 17). This product was designed and manufactured in close collaboration with competent electric machine designers. This design carried out in the ANSYS simulation on the basis of the standard parameters of the induction motor and the properties of the modelled induction machine are mentioned below:
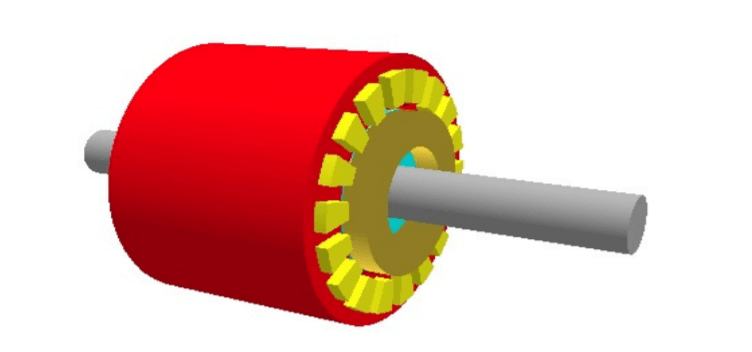
(a) Machine Geometry
Stator parameters
Slot Number: 18
Stator Lamination Diameter: 130
Stator Bore: 80
Width of Tooth: 7
Depth of Slot: 18
Tip depth of Tooth: 1
Slot opening: 3
Tip angle of Tooth: 30
Rotor Parameters
Rotor Bars: 26
Pole Number: 4
Bar opening and Depth [T]: 1.5
Bar Tip angle [T]: 20
Rotor Tooth Width [T]: 4
Bar Depth [T]: 10
Bar Connections Radius [T]:1.33
Air gap: 1
Shaft Dia: 25
(b) Input Data (Materials)
Figure 18 represents the database of the materials, which are mostly chosen, and an update of this database is also available. Below are the properties of the materials and the weights on which the cost estimates can be based if the price per unit is known.

(c) Machine Winding
Figure 19 represents the winding of the induction motor, and the properties are mentioned below:

Lap winding: 50 turns
Throw: 4
Parallel paths: 1
Winding Layers: 2
Path type: Central
5. Simulation Results
For any motor type, the analytic single load point and no-load point tests are automatically computed. Torque speed/breakdown torque/locked rotor only AC mains (voltage driven) situations have characteristics/acceleration. Figure 20 represents the (a) speed vs. RMS current, (b) speed vs. torque, (c) speed vs. losses, and (d) speed vs. power characteristics of the induction motor with the suggested design modifications.

6. Conclusions and Future Scope
This paper aids in the development of an induction motor to achieve improved precision by taking different voltage sags into account. Suggested modifications in the design parameters using ANSYS are provided to further examine the precise performance of induction motors during voltage sag events. Since balanced voltage sag is the major sag event, this study focuses solely on this mechanism. The experimental results benefit the design modifications of induction motors at industrial and other commercial levels of consumers regarding major power quality issues and behavior of the induction motors. This paper analyzes the characteristics of voltage dips in power systems and induction motors with a special emphasis on balanced dips, with the help of the virtual grid (regenerative grid simulator) as per IEC 61000-4-11. With regards to future study, the design modifications corresponding to each voltage sag process supports the industrial and other commercial levels of consumers.
Author Contributions: For the authors confirm contribution to the paper as follows: P.B.B.; study con conceptualization, design, and validation. I.V.; formal analysis, investigation, resources, and data curation. P.B.B.; writing—original draft and Simulation preparation. Y.T.; writing—review and editing. R.K. and S.N.; visualization and Supervision. All authors have read and agreed to the published version of the manuscript.
Funding: This research received no external funding.
Institutional Review Board Statement: Not applicable.
Informed Consent Statement: Not applicable.
Conflicts of Interest: The authors declare no conflict of interest.
References
- Huang, A.; Xiao, X.; Wang, Y. Evaluation Scheme of Voltage Sag Immunity in Sensitive Industrial Process. IEEE Access 2021, 9, 66398–66407. [Google Scholar] [CrossRef]
- Hasan, S.; Muttaqi, K.M.; Sutanto, D. Application of the Automatic Segmented Hilbert Huang Transform Method for the Evaluation of the Single-Event Characteristics of Voltage Sags in Power Systems. IEEE Trans. Ind. Appl. 2021, 57, 1882–1891. [Google Scholar] [CrossRef]
- Cunha, M.F.; Jacobina, C.B.; de Freitas, N.B. Grid-Connected Induction Motor Using a Floating DC-Link Converter under Unbalanced Voltage Sag. IEEE Trans. Ind. Appl. 2021, 57, 1609–1618. [Google Scholar] [CrossRef]
- Liu, J.; Zhao, C.; Xie, Z. Power and Current Limiting Control of Wind Turbines Based on PMSG under Unbalanced Grid Voltage. IEEE Access 2021, 9, 9873–9883. [Google Scholar] [CrossRef]
- Cheerangal, M.J.; Jain, A.K.; Das, A. Control of Rotor Field-Oriented Induction Motor Drive during Input Supply Voltage Sag. IEEE J. Emerg. Sel. Top. Power Electron. 2021, 9, 2789–2796. [Google Scholar] [CrossRef]
- Paul, D.; Goswami, A.K.; Kumar, S.; Jain, S.; Pandey, A. Propagation of Voltage Sag Considering Different Winding Connections: Impact on the Healthiness of Transformers. IEEE Trans. Ind. Appl. 2020, 56, 6186–6196. [Google Scholar] [CrossRef]
- Han, Y.; Feng, Y.; Yang, P.; Xu, L.; Xu, Y.; Blaabjerg, F. Cause, Classification of Voltage Sag, and Voltage Sag Emulators and Applications: A Comprehensive Overview. IEEE Access 2020, 8, 1922–1934. [Google Scholar] [CrossRef]
- Serrano-Fontova, A.; Torrens, P.C.; Bosch, R. Power Quality Disturbances Assessment during Unintentional Islanding Scenarios. A Contribution to Voltage Sag Studies. Energies 2019, 12, 3198. [Google Scholar] [CrossRef]
- Ma, L.; Tian, D.; Liu, T.; Gao, S.; Dong, P. An Evaluation Method for Bus and Grid Structure Based on Voltage Sags/Swells Using Voltage Ellipse Parameters. IEEE Access 2021, 9, 101959–101971. [Google Scholar] [CrossRef]
- Zhang, L.; Bollen, M.H.J. Characteristic of voltage dips (sags) in power systems. IEEE Trans. Power Deliv. 2002, 15, 827–832. [Google Scholar]
- Alipoor, J.; Doroudi, A.; Ghaseminezhad, M. Detection of the Critical Duration of Different Types of Voltage Sags for Synchronous Machine Torque Oscillation. Energy Power Eng. 2012, 04, 117–124. [Google Scholar] [CrossRef]
- Mendes, A.; Cardoso, A.J.M. Performance analysis of three-phase induction motor drives under inverter fault conditions. In Proceedings of the 4th IEEE International Symposium on Diagnostics for Electric Machines, Power Electronics and Drives, 2003, SDEMPED 2003, Atlanta, GA, USA, 24–26 August 2003; pp. 205–210. [Google Scholar]
- Programmable Automated Test Equipment. Available online: https://www.chromausa.com (accessed on 1 January 2021).
- Electronic Design, Test Automation and Measurement Equipment. Available online: https://www.keysight.com (accessed on 1 January 2021).
- Gallo, D.; Landi, C.; Luiso, M.; Fiorucci, E. Survey on Voltage Dip Measurements in Standard Framework. IEEE Trans. Instrum. Meas. 2013, 63, 374–387. [Google Scholar] [CrossRef]
- Thakur, P.; Singh, A.K. Unbalance Voltage Sag Fault-Type Characterization Algorithm for Recorded Waveform. IEEE Trans. Power Deliv. 2013, 28, 1007–1014. [Google Scholar] [CrossRef]
- Li, Y.; Mao, C.; Zhang, B.; Zeng, J. Voltage Sag Study for a Practical Industrial Distribution Network. In Proceedings of the 2006 International Conference on Power System Technology, Chongqing, China, 22–26 October 2006; pp. 1–4. [Google Scholar]
- Janda, M.; Makki, Z.; Konicek, P. Calculation of the vibration induction motor using the finite element method. In Proceedings of the 16th International Conference on Mechatronics—Mechatronika 2014, Brno, Czech Republic, 3–5 December 2014; pp. 526–529. [Google Scholar]
- Electromagnetic Compatibility (EMC)Part 4–11: Testing and Measurement Electromagnetic Compatibility (EMC)Part 4–11: Testing and Measurement Techniques Voltage Dips, Short Interruptions and Voltage Variations Immunity Tests; IEC Standard 61000-4-11; International Electrotechnical Commission: London, UK, 2004.
Article Source: Energies 2022, 15(1), 57; https://doi.org/10.3390/en15010057, https://www.mdpi.com/1996-1073/15/1/57/htm
