Published by Keaton A. Wheeler, Anthony W. Bowers, Charlie H. Wong, Jonathan Y. Palmer and Xue Wang, Primary Engineering and Construction, Saskatoon/Kelowna, Canada
{kwheeler, abowers, cwong, jpalmer & swang}@primaryeng.com
Published in: 2018 IEEE Electrical Power and Energy Conference (EPEC)
Date of Conference: 10-11 Oct. 2018
DOI: 10.1109/EPEC.2018.8598358
Abstract— This paper conducts a load and power quality analysis on a 3-feeder distribution system with a cryptocurrency mining system connected. The study includes power factor and harmonic distortion analysis of actual measured 15-minute data over three days in conjunction with measurements of startup and steady state waveforms to determine the load profile of a cryptocurrency mine when connecting to the electrical grid. In addition, comments are made on the effect of the substation transformer. In the context of this paper, multiple load levels are investigated through a thorough analysis of a sample test system. The effects of the cyptocurrency mine are then quantified through comparison to standards indicated in IEEE Std. 519.
Index Terms — Cryptocurrency mine, power quality, load analysis.
I. INTRODUCTION
Modern power systems are aiming to deliver economic and reliable power to various customers connecting to the grid. The load characteristics associated to these customers can affect utility networks through their interconnection. Power quality (PQ) is one of the most important indicators of safety and efficiency required to be considered when connecting independent facilities to the electrical grid. Most utility company has a specified guideline for interconnection systems, including factors such as total harmonic distortion (THD), individual harmonic currents and voltages and power factors [1]-[2]. In cases where the consumer’s load does not meet these criteria, mitigation factors are required to be employed to meet all the interconnection requirements. These interconnection requirements exist to prevent unnecessary burden on the utility grid and prevent detrimental operation on other energy users.
When connecting a customer-owned facility to the electrical grid, two key factors that are of interest to the utility are power demand and power quality. Power demand is of interest as loads absorb real and reactive power from the network which can result in changes in the existing operational behaviors of the grid when significant energy demands are present. A load analysis may be mandated by the utility when there is limited information available on a certain type of load. Based on the reactive power characteristic of the load, the utility may require power factor correction via methods such as capacitive power compensation to mitigate detrimental effects or reduce burden on the network [1]-[2].
The level of harmonics is another parameter which utilities will consider when a new load is being connected to the network. When new loads are nonlinear in nature they can affect the sinusoidal characteristics of existing current and voltage waveforms thereby introducing harmonics into the network, affecting the operation of electrical equipment [3]-[4]. Different utility companies tend to develop local standards for interconnecting customers. IEEE Std. 519 [3] has been employed by many utilities to quantify limits that are required to maintain power quality while also offering determination methods. Therefore, in this paper, IEEE Std. 519 is used to quantify the power quality of a system connecting with cryptocurrency mine.
Cryptocurrencies are defined as peer-to-peer digital exchange systems which then generate and distribute currency units [5]. Transactions are verified through a process known as “mining”. The concept of cyptocurrency mining can be explained as a process where digital currency is verified (confirms the transaction amount and that the seller originally owned the currency) and added to the blockchain (an electronic ledger) [6]. This verification process is completed using specialized computing devices to solve computationally difficult mathematical problems to be able to create a new block on the chain. The resulting creation of the block rewards the creator with newly created cryptocurrency units and transaction fees [6]. Due to the fast-growing market for cryptocurrencies [7], facilities dedicated to the mining process are beginning to be constructed and connected to the electrical grid. These facilities connect thousands of individual processing units together with the same purpose of creating blocks in the chain, resulting in significant energy demands on the electrical grid [8].
As evident in the literature, an understanding of load electrical characteristics in the context of energy demand and power quality is essential to dictating whether additional infrastructure requirements will need to be employed by the consumer. Through a literature survey, it is apparent that no power quality or loading analysis has been reported on cryptocurrency mines despite their growing prevalence in grid energy demands. As a result, in this paper a cryptocurrency mine is analyzed to determine loading profiles and power quality using measured data. Relevant parameters are calculated and compared to interconnection standards to offer insights into how these mines will affect the electrical grid.
II. THE APPROACH
A. System Under Study
The system utilized in the studies of this paper is depicted in Fig. 3. The system consists of three distribution feeders which are constructed with four switching cubicles while servicing three unit substation transformers per switching cubicle. This gives a total of 36 unit substation transformers (12 per feeder) and 12 switching cubicles (4 per feeder). All feeders and unit transformers are assumed to be the same. The point of common coupling (PCC) is the location where the transmission network connects to the substation transformer. The system nominal frequency is 60 Hz.

Cryptocurrency mining systems include many individual processing units which are connected to perform a transaction verification purpose. At the time of this analysis, the AntMiner s9 was one of the most efficient hardware’s available on the market for the purposes of cryptocurrency mining [9]. Each AntMiner can be considered to be the smallest power consuming component in one cryptocurrency mining system. A simplified mining system setup is shown in Fig. 2. The loading characteristics would be determined by the accumulated loading profile of individual AntMiner units. For cooling purposes, induction motor-based fans are installed in the facility housing the processing units. These fan loads can be assumed to be 5 MVA operating at a lagging power factor of 0.8. It is assumed that the building fan load is distributed evenly among all the unit substation transformers and all AntMiner units are distributed evenly amongst the three phases.
As shown in Fig. 1, The distribution feeder consists of 500 meters of Hawk 477 kcmil ACSR conductor. The short circuit current of the network is 2.95 kA at the PCC on the high voltage side of the transformer. Conductor data is available in the Appendix.
B. Power Quality and Load Analysis Test Setup
In order to determine how the processor loads behave electrically, an ION 7650 PQ meter capable of sampling at 1028 samples/cycle was connected to ten AntMiner s9 processing units with the default firmware framework employed. It should be noted that the ten AntMiner units were connected in parallel with one another.

The meter was wired in a single-phase mode as outlined in Fig. 3. It should be noted that the neutral current transformer (CT) was not used as the loads were connected directly across the phase conductors resulting in no neutral current flow [10].

Utilizing the test setup depicted in Figs. 2 and 3, 15-minute data and waveform captures were logged for three full days while the 10 processing units were running. This data included information on real time energy demand and power quality.
III. POWER DEMAND ANALYSIS FOR A CRYPTOCURRENCY MINE
To determine the load demand and power factor associated with the processing units, three days of 15-minute data was accumulated while the PQ meter was connected to 10 AntMiner s9 units.
Due to the accumulated data, it can be observed that in 99.3% of all logged values, the power factor was between 0.994 and 0.995 leading. It should be noted that the power factor was observed at lower levels only during processing unit startup conditions. Due to this observation, when conducting the remaining studies in this paper, the processing units were assumed to have a power factor of 0.994 leading.
In the context of power demand; it can be determined that the peak power consumption was 1.595 kVA. As can be observed in the load distribution depicted in Fig. 4, the load demand of the processing units is between 1.55 and 1.6 kVA in 66.2% of logged values. In addition, it is above 1.5 kVA in 98.26% of all cases. Again, it should be noted that the power demand was lower only during startup conditions. As a result, the power consumption was taken as 1.6 kVA per processing unit for all studies conducted in this paper.
Occurrence of load demand intervals

A. Power Factor Analysis
To determine the expected power factor of the system under study, four different load levels were selected with a constant fan load to demonstrate how the power factor changes according to mine size. The load levels used in this case study can be expressed in Table I.
TABLE I: PROCESSING UNITS WITH CORRESPONDING LOAD LEVELS
| # of Units | Load Level (MVA)/unit sub | Power factor (lead) |
|---|---|---|
| 1302 | 2.187 | 0.994 |
| 1128 | 1.908 | 0.994 |
| 954 | 1.630 | 0.994 |
| 781 | 1.354 | 0.994 |
In addition to the processing units, a fan load of 0.139 MVA with a lagging power factor of 0.8 is assumed to be present on each unit substation transformer.
As depicted in Section II, there are a total of 36 unit substation transformers that are connected in parallel in the network. By superposition the total power demand of the system at the PCC can be observed as per Table II.
TABLE II: SYSTEM POWER DEMAND IN TERMS OF POWER FACTOR AND LOAD LEVEL
| Total Load Level (MVA) | Power factor | Leading/Lagging? |
|---|---|---|
| 78.72 | 0.9978 | leading |
| 68.71 | 0.9982 | leading |
| 58.70 | 0.9987 | leading |
| 48.75 | 0.9992 | leading |
Due to scaling of the power demand by the number of unit substation transformers in the network, the total power demand of the system can be determined.
TABLE III: SYSTEM POWER DEMAND
| System Load Demand (MVA) | System Power Demand (MW) | System Reactive Power Demand (MVAR) (capacitive) |
|---|---|---|
| 78.72 | 78.55 | 5.20 |
| 68.71 | 68.58 | 4.11 |
| 58.70 | 58.62 | 3.01 |
| 48.75 | 48.72 | 1.92 |
As can be observed in Table III, the load from the system is expected to be capacitive in nature. This result is significant in that it has the potential to prevent utilities from requiring private facilities owners from adding capacitive compensation to attain power factor correction. In addition, observation of Table II makes it apparent that the power factor only changes marginally when varying the load demand of the system while keeping fan loads constant. This highlights that the system’s power factor is influenced by the level of fan load utilized in the network. As a result, it can be inferred that most cryptocurrency mining facilities would not be required to employ methods such as capacitive compensation in the context of power factor correction.
An additional key consideration from this finding is there is an indication, due to its capacitive nature, that the processing unit loads may be prone to harmonic resonant conditions when combining the system impedance along with the overall network impedance. Although outside of the scope of this paper, this is significant as the processing units may be subject to significant resonant conditions and thus causing a detrimental effect on their operation [11]-[12].
IV. POWER QUALITY ANALYSIS OF A CRYPTOCURRENCY MINE
To ascertain the power quality effects of the processing units utilized in the system under study, the voltage and current waveforms of ten of the AntMiner s9’s were captured in real time during startup and steady state. The startup waveform is depicted in Fig. 5.

As can be observed in Fig.5, the startup voltage appears to not suffer from distortion. This is to be expected as the processing units were connected directly to a power supply rather than through a distribution conductor which would be present in the actual system. The current waveform suffers from distortion, this can be attributed to the processing unit’s power supply circuitry. As per the measured data, this waveform begins to appear like the steady state within a 15-minute timeframe.
The steady state current and voltage waveforms of the ten AntMiner s9 units is depicted in Fig. 6

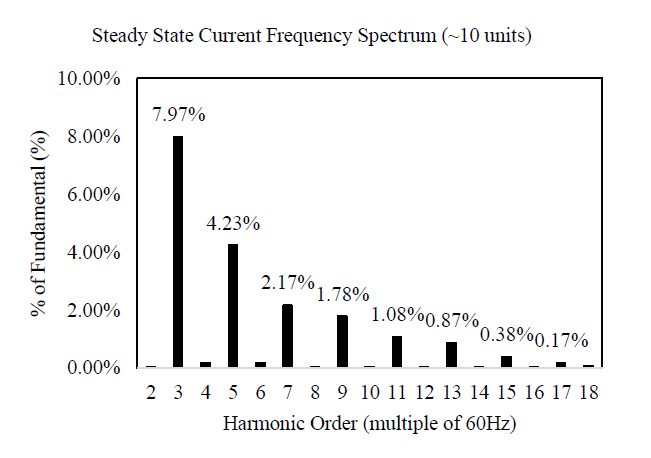
As can be seen in Fig. 6, it is apparent that there is a notching phenomenon occurring at the zero crossing of the current waveform. This indicates that the current waveform is subject to harmonic distortion. Taking the fast Fourier transform (FFT) of the current signal at a sampling frequency of 256 samples/cycle, the current harmonic spectrum demonstrated in Fig. 7 is obtained.
It should be noted that Fig. 7 only displays up to the 18th harmonic however harmonics were factored into calculations in this paper up to the order of 34. As can be observed in Fig. 7, the individual harmonics with the greatest magnitude are harmonics 3, 5, 7 and 9 with percentages of 7.97, 4.23, 2.17 and 1.78 percent respectively.
In order to determine the THD from the individual current harmonics, (1) is utilized as defined by references [3]-[4]:
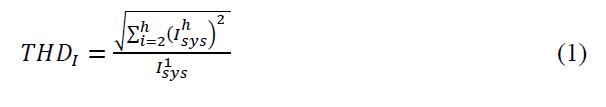
Where THDI is the total harmonic distortion of the current, Isys is the system nonlinear load current in Amps, Iload is the total system load current in Amps and h is the harmonic number.
As indicated in Fig. 1, the substation transformer in the system under study has a delta to wye grounded configuration. Therefore, the triplen harmonics will circulate in the delta winding of the transformer and thus will not be observed in the transmission system [4]. The THD levels experienced by the system for both the voltage and current will be lower than when there is no delta winding in the configuration. For the purposes of comparison, the THD levels are calculated to account for triplen filtering but are also given for the topology where triplen filtering does not occur.
Utilizing (1) in conjunction with the harmonic distortions indicated in Fig. 7 with the network loading profiles yields a current THD at the PCC with the following values:
TABLE IV: PCC CURRENT THD FOR THE NETWORK UNDER STUDY
| Load Level (MVA) | 78.72 | 68.71 | 58.70 | 48.75 |
| Current THD (%) (no triplen filtering) | 9.045 | 8.958 | 8.842 | 8.681 |
| Current THD (%) (with triplen filtering) | 4.732 | 4.686 | 4.626 | 4.541 |
With the knowledge of the current harmonic levels, it is possible to determine the voltage harmonics on the network from the given measured PQ data. Utilizing calculation methods outlined in reference [4] whereby the impedance is determined at each harmonic level and multiplied by the harmonic current, the individual voltage harmonics can be determined for the system under study:
TABLE V: PCC INDIVIDUAL VOLTAGE HARMONICS FOR THE NETWORK UNDER STUDY
| Harmonic Number | Load Level (MVA) | Load Level (MVA) | Load Level (MVA) | Load Level (MVA) |
|---|---|---|---|---|
| 78.72 | 68.71 | 58.70 | 48.75 | |
| 3 | 2.32% | 2.01% | 1.70% | 1.39% |
| 5 | 2.05% | 1.78% | 1.50% | 1.23% |
| 7 | 1.47% | 1.27% | 1.08% | 0.88% |
| 8 | 1.55% | 1.35% | 1.14% | 0.93% |
It should be noted that the Table V only indicates the worst of the voltage harmonics. With the knowledge of the voltage harmonic levels, the THD can be determined using (2).

Where THDV is the total harmonic distortion of the voltage and Vsys is the system voltage.
TABLE VI: PCC VOLTAGE THD FOR THE NETWORK UNDER STUDY
| Load Level (MVA) | 78.72 | 68.71 | 58.70 | 48.75 |
| Voltage THD (%) (no triplen filtering) | 4.623 | 4.005 | 3.387 | 2.773 |
| Voltage THD (%) (with triplen filtering) | 3.514 | 3.045 | 2.575 | 2.108 |
As can be observed in Tables IV and VI, the THD for both the voltage and current is significantly changed when accounting for triplen filtering due to the connection topology of the transformer.
A factor that would need to be considered during the design stage of any cryptocurrency mine project would be heating of the transformer due to harmonics. This heating factor can be assessed by using the k-factor which is defined in (3) [13]:

The k-factor weights the harmonic load currents in accordance with their effects on transformer heating. The k-factor will be 1.0 when a purely linear load is present. This is of interest when creating specifications for transformers, particularly in the context of substations. A k-factor rating greater than the calculated value from the load for a transformer will mitigate degradation associated to heating effects of harmonics. Utilizing the data obtained in conjunction with (3), the k-factor calculated for the network given in Fig. 1 can be determined as:
𝑘−𝑓𝑎𝑐𝑡𝑜𝑟 = 1.218
In the case of the system under study indicated in Fig. 1, the ratio of the three-phase short circuit current to the load current is indicated in Table VII:
TABLE VII: SHORT CIRCUIT OVER LOAD CURRENT RATIO OF THE SYSTEM
| Load Level (MVA) | 78.72 | 68.71 | 58.70 | 48.75 |
| Isc/Iload | 10.28 | 11.76 | 13.72 | 16.46 |
As can be observed in Table VII, the short circuit over load current ratio is below 20 in all calculated cases.
IEEE Std. 519 quantifies a measure for power quality when loads and generation sources connect to the utility network. As per Table VII, the short circuit over load ratio is always less than 20. As such the limits expressed in Table VIII can be applied from IEEE Std. 519.
It should be noted that the individual harmonic values in Table VIII should be 25 percent of the specified values for even harmonics. As per IEEE Std. 519 the voltage harmonics should be limited to a maximum of 1 percent for individual values and 1.5 percent for voltage THD for system voltages above 138 kV.
TABLE VIII: CURRENT HARMONIC LIMITS
| Harmonic Number | Less than 11 | 11 to 17 | 17 to 23 | 23 to 35 |
| Harmonic current limit (%) | 4.0 | 2.0 | 1.5 | 0.6 |
| Current THD limit (%) | 5.0 | 5.0 | 5.0 | 5.0 |
Observation of Fig. 7 and Table IV in conjunction with harmonic requirements outlined in IEEE Std. 519 [3] give the following observations:
- The THD of the current is below the prescribed maximum of 5% when triplen filtering occurs.
- The THD of the current is above the prescribed maximum of 5% when no triplen filtering takes place.
- The third (7.97%) and fifth harmonic (4.23%) current is above the prescribed 4% maximum. If the system under study were to connect to a utility that requires the consumer to meet IEEE Std. 519 then the third and fifth harmonic would be required to be filtered. In the case of the third harmonic, installing a transformer at the substation with a delta winding would be adequate to filter the triplen harmonic.
Through observation of results in Tables V and VI in conjunction with voltage harmonic requirements outlined in IEEE Std. 519 [3] the following conclusions can be drawn for a system voltage of 161 kV:
- The THD is above the prescribed maximum of 1.5% when triplen filtering does or does not occur.
- Several individual voltage harmonics are above the prescribed minimum of 1%.
Through observation of results obtained in conjunction with IEEE Std. 519, it is apparent that the connection topology of the transformer is required when determining the harmonic effects employed on the system. Furthermore, in the case of the AntMiner s9 processing units, when a delta winding is not present in the substation transformer the current harmonics propagating back into the grid can be as high as 9%, nearly double that of the recommended levels outlined in the literature. Furthermore, it can be observed that the harmonic voltages are consistently higher than the recommendations outlined in IEEE Std. 519.
A potential solution to the excessive harmonics would be to use a higher quality power supply that is capable of both power factor correction and harmonic filtering although this is outside the scope of investigations in this paper.
Although IEEE Std. 519 indicates its own recommended harmonic distortion maximums, individual utilities may indicate their own values. In this case it is imperative that these levels be understood and communicated to stakeholders when attempting to connect a cryptocurrency mine to the network.
V. CONCLUSION
This paper conducts a load and power quality analysis on a cryptocurrency mine using AntMiner s9 processing units. Startup and steady state voltage and current waveforms are presented in conjunction with three days of 15-minute data to determine the power demand and harmonic distortion of the processing units.
Results indicate that the expected power factor of the processing units is in excess of 0.99 with a leading characteristic. This is significant in that it may mean that consumers wishing to connect a cryptocurrency mine to the utility network may not be mandated to install power factor compensation equipment such as capacitor banks. This, from an economic system operation and feasibility standpoint, can be critical as it can dictate the expectations of the utility on the customer.
Furthermore, it can be observed that the cyptocurrency processing units have a nonlinear characteristic and are subject to harmonic distortion. Results indicate that triplen filtering via delta windings in the transformer should be present to prevent high THD levels when significant load demand is present. In addition, it can be observed that despite triplen filtering, individual harmonics may exceed standard prescribed maximums. As a result, it can be determined that a PQ and load analysis, such as the one conducted in this paper, should be mandated by utilities to ensure that power quality conditions are met by facility owners wishing to connect to the grid.
Considering the rapid rise of occurrence of cryptocurrency mines in utility grids, the results and considerations discussed in this paper offer significant practical value in the context of network expansion planning.
ACKNOWLEDGMENT
The authors would like to acknowledge and thank DMG Blockchain Solutions Inc. for providing the AntMiner s9 units and supporting the research conducted in these studies.
APPENDIX A
TABLE A.I
CONDUCTOR DATA
| Conductor | R1 (Ω/km) | L1 (Ω/km) |
| Hawk 477 kcmil ACSR | 0.120 | 0.267 |
REFERENCES
[1] FortisBC, “Facility Connection Requirements,” September 2016. [Online]. Available: https://www.fortisbc.com/Electricity/ CustomerService/TransmissionServices/Documents/FortisBC_Facility_Connection_Requirements.pdf. [Accessed February 2018].
[2] SaskPower, “Electric Service Requirements,” November 2017. [Online]. Available: http://www.saskpower.com/wp-content/uploads/Guide-ElectricalInspections-ServiceRequirements.pdf. [Accessed: February 2018].
[3] IEEE Recommended Practice and Requirements for Harmonic Control in Electric Power Systems, IEEE Std. 519, 2014.
[4] M.A. Masoum and E.F. Fuchs, Power Quality in Power Systems and Electrical Machines, 2nd ed., London: Elsevier Inc., 2015.
[5] U. Mukhopadhyay, A. Skjellum, O. Hambolu, J. Oakley, L. Yu and R. Brooks, “A Brief Survey of Cryptocurrency Systems,” in IEEE Conference on Privacy, Security and Trust, pp. 745-752, Auckland, 2017.
[6] I. Eyal, “The Miner’s Dilemma,” in IEEE Symposium on Security and Privacy, San Jose, 2015.
[7] R.C. Phillips and D. Gorse, ” Predicting Cryptocurrency Price Bubbles Using Social Media Data and Epidemic Modelling,” in IEEE Symposium on Computational Intelligence, Honolulu, 2017.
[8] Digiconomist, Bitcoin Energy Consumption Index. 2018, [Online]. Available: https://digiconomist.net/bitcoin-energy-consumption. [Accessed: March 2018].
[9] N. Drake. (2018, January). “Best ASIC devices for Bitcoin mining in 2018,” TechRadar. [Online]. Available: https://www.techradar.com/ news/best-asic-devices-for-bitcoin-mining-in-2018. [Accessed: March 2018].
[10] Schneider Electric, “PowerLogic ION7550/ION7650 Energy and power quality meter User Guide,” 2009. [Online]. Available: http://www2.schneider-electric.com/resources/sites/ SCHNEIDER_ELECTRIC/content/live/FAQS/31000/FA31689/es_ES/ION7650%20Third%20Party%20protocols%20(70002-0248-06).pdf. [Accessed: January 2018].
[11] S.S. Rangarajan, E.R. Collins and J.C. Fox, “Harmonic Resonance Repercussions of PV and Associated Distributed Generators on Distribution Systems,” in IEEE North American Power Symposium, Morgantown, 2017.
[12] N.D. Rao, S.I. Sporea and A.Sawma, “Analysis of Resonance Problems and Harmonic Filter Design in Power Factor Correction Capacitor Applications,” in IEEE Canadian Conference on Electrical and Computer Engineering, Waterloo, 1998.
[13] IEEE Recommended Practice for Establishing Liquid-Filled and Dry-Type Power and Distribution Transformer Capability When Supplying Nonsinusoidal Load Currents, IEEE Std. C57.110, 2008.
