Published by Electrotek Concepts, Inc., PQSoft Case Study: Electric Arc Furnace Modeling for Voltage Flicker Evaluation, Document ID: PQS0313, Date: April 16, 2003.
Abstract: A steel manufacturer is planning to add a second arc furnace to their existing facility. Concerns are raised as to whether the additional furnace will cause levels of voltage flicker that might possibly affect neighboring loads. A complete time-domain model of the existing and proposed arc furnace along with a flicker meter are developed in EMTP and the results gathered are used to evaluate system changes that will be needed prior to installation of the second furnace.
INTRODUCTION
Background
A steel manufacturer has a steel making facility supplied from a 230kV switchyard. This facility currently operates a single arc furnace and a rolling mill. The steel manufacturer plans to start up a second furnace and the utility has agreed to make a number of system changes to improve the supply to the facility. The changes will be made at the 230kV switchyard that supplies the plant.
These changes are needed to meet the 230kV circuit breaker rating limitations and to improve system performance.
The steel manufacturer is fed from the 230kV switchyard through a 2.5 mile 230kV transmission line. Currently, there is one 57 MW ac furnace in operation at the steel mill. However, plans are to start the second 57 MW furnace in the near future. Flicker measurements were performed previously with the stronger system and one furnace in operation. RMS flicker levels were in the range 0.2-0.3%. With both furnaces operating and the reduced short circuit capacity, there is a significant concern that flicker levels could be objectionable for other customers supplied from this part of the transmission system. The study is designed to evaluate expected flicker levels with the planned system configuration and the possibility of both furnaces operating simultaneously.
Approach
Evaluation of arc furnace flicker requires an accurate representation for the arc furnace loads. The major difficulty in the furnace modeling is to accurately characterize the electric arc. Even in the same stage of a melting cycle, the arcing voltage and the equivalent arc resistance may change significantly, ranging from a momentary open circuit status to a momentary short circuit status. This arcing variation depends closely on the materials to be melted and is highly random in nature. It has been found that this arcing change does not obey any uniform distribution.
In this case study, arc furnace loads are represented using Transient Analysis of Control Systems (TACS) modeling capability of the Electromagnetic Transients Program (EMTP). A variable arc length is characterized using the band limited white noise method. Consequently, the equivalent arc resistance varies continuously as a random function of time. With the incorporated electrode lifting and lowering controls, an average arc voltage and the furnace heating power are controlled by a preset furnace operation voltage.
Electrotek used different bandpass filters and random signal magnitude functions to characterize ac arcing resistance. A trial and error method was used to determine properties of the bandpass filters and magnitude functions for the arc characterization. In this study, the flicker is evaluated against different conditions (system supply strength), with either a single furnace operation or two furnace operation.
In order to perform a sensitivity analysis, an EMTP TACS flicker meter module was developed. This EMTP TACS flicker meter module reads a simulated voltage waveform at a specified system location during each time step of the simulation, performs the flicker calculation, and outputs instantaneous voltage flicker (DV(t)/|V|) as a part of simulation results.
Simplified Flicker Evaluation Procedures
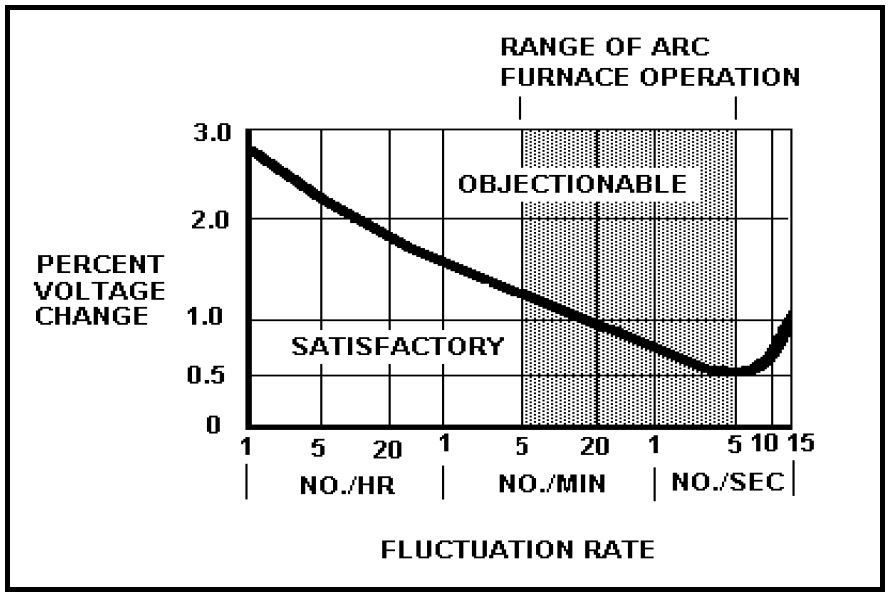
Empirical results from other arc furnace installations can be used as an initial check of possible flicker concerns at the steel manufacturing facility. gives curves developed from a number of different arc furnace measurements around the world. The curves show where flicker is likely to be a problem in terms of the short circuit capacity at the point of common coupling. The curves are only applicable for single furnace operation. However, an equivalent flicker level for multiple furnaces can be estimated using the following relationship:

Pst is the short term flicker severity output from a flickermeter according to the IEC standards. For two furnaces of the same size, the flicker level with both furnaces operating should be about 26% greater than the flicker level for one furnace.
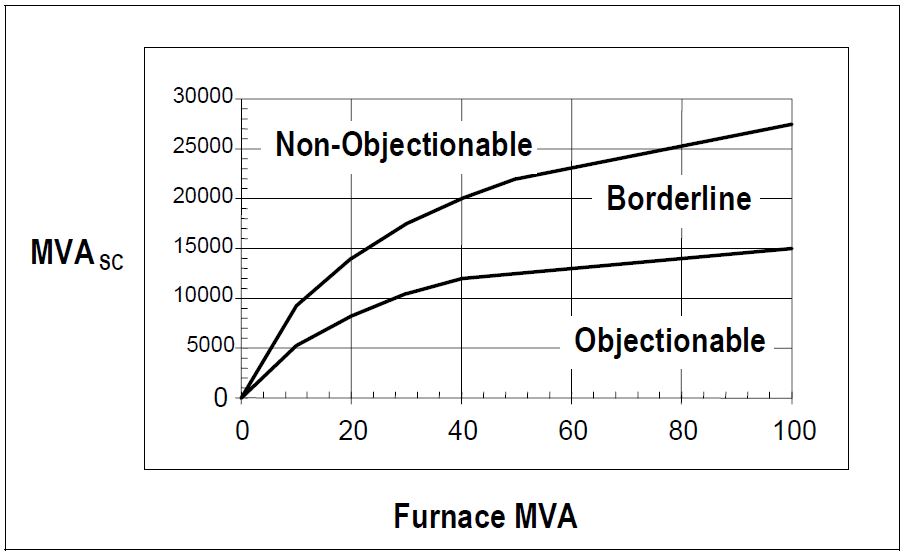
Applying the curves of Figure 1 to the steel manufacturing configuration, we can estimate that a single furnace operation (approx. 80 MVA) will become objectionable at a short circuit capacity of about 14000 MVA and may be noticeable with a short circuit capacity as high as 25000 MVA. Previous measurements and actual experience at a short circuit level of 21576 MVA have shown no problem.
With two furnaces (equivalent size of 80×1.4=112 MVA), objectionable flicker can be expected for a short circuit capacity of about 16000 MVA (extrapolation). The expected short circuit capacities at the 230kV switchyard after system modifications will be somewhat less than this value, indicating potential problems.
EMTP MODEL DESCRIPTION
Steel Manufacturer Power Supply System
The steel manufacturer is supplied by the utility system from a 230kV switchyard through a 2.5 mile 230 kV transmission line. The steel mill loads consist mainly of two 57 MW ac arc furnaces and the rolling mill. The power circuit of the steel mill is schematically shown in the oneline diagram given in Figure 2.
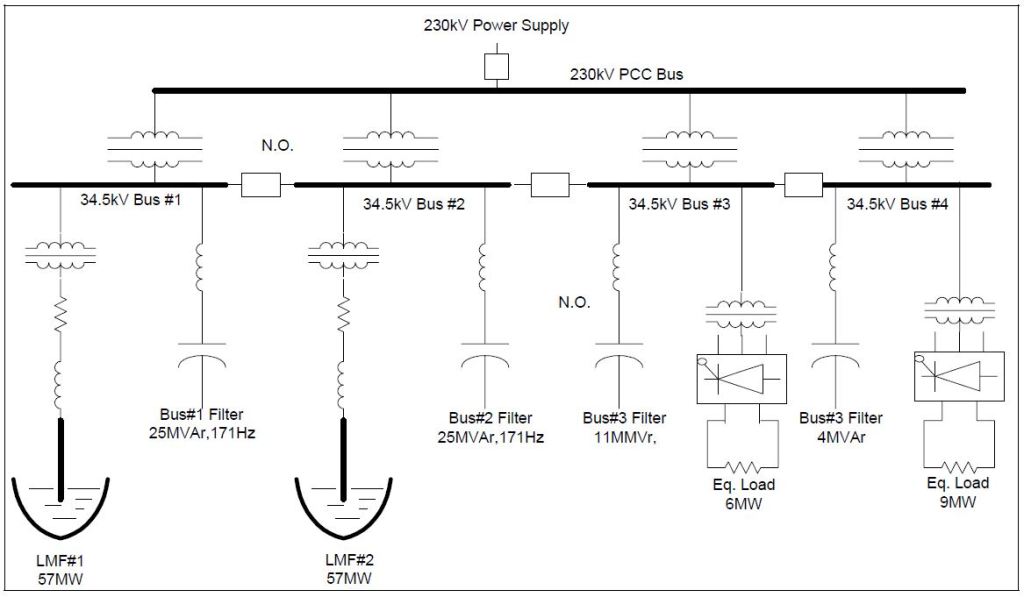
Two 60 MVA, 230/34.5kV, Delta-Wye, power transformers are used to supply the melt shop that includes two 57 MW ac arc furnaces. Each of these furnaces has its own 60 MVA, 33kV/728-240V, delta-Wye step-down transformer and a 34.5kV, 25 MVAr harmonic filter. The filter is tuned at 171 Hz. The melt shop auxiliary and rolling mill is supplied separately by two 20 MVA, 230/34.5kV transformers with the same winding connections. The major loads of these transformers are SCR-based dc drives supplied at either 500V or 600V. For simplification, these drives are grouped according to their supply voltages and are equivalently represented in the EMTP model by one 6 MW and one 9 MW drive as shown below. The drives are assumed to be operated at 30 degree firing angle. The 4 MVAr and 11 MVAr power factor correction/ harmonic filter units are connected at 34.5kV buses as shown.
EMTP Component Models
Important components of the system model are described in this section. This section focuses on the models for the arc furnaces and the controls, as well as the metering for flicker.
AC Arc Furnace Model
For an ac arc, three variation rules were applied.
The first cause of variations is associated with the 120 Hz current zero crossings. For a constant arc length, the arc voltage Varc(t) changes with the magnitude of the instantaneous current, Iarc(t). For a positive half cycle of the arc current, the arc voltage can be expressed by:
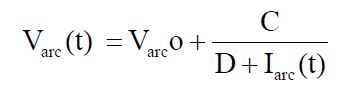
where
Varco – a constant, unit length arc voltage threshold when iarc(t) increase
C – a constant, in unit of Watts, C=Cp when di/dt >0 and C=Cn when di/dt <0
D – a constant, in unit of Amp, D=Dp when di/dt >0 and D=Dn when di/dt<0
The voltage shape for the negative half cycle is symmetrical to the positive half cycle with respect to the origin. This is a deterministic rule mainly responsible for characteristic harmonic distortion.
The second rule affecting the furnace arc is electrode lifting and lowering control. It is also referred to as electrode voltage regulation. The principle of ac voltage regulation is shown in Figure 3.
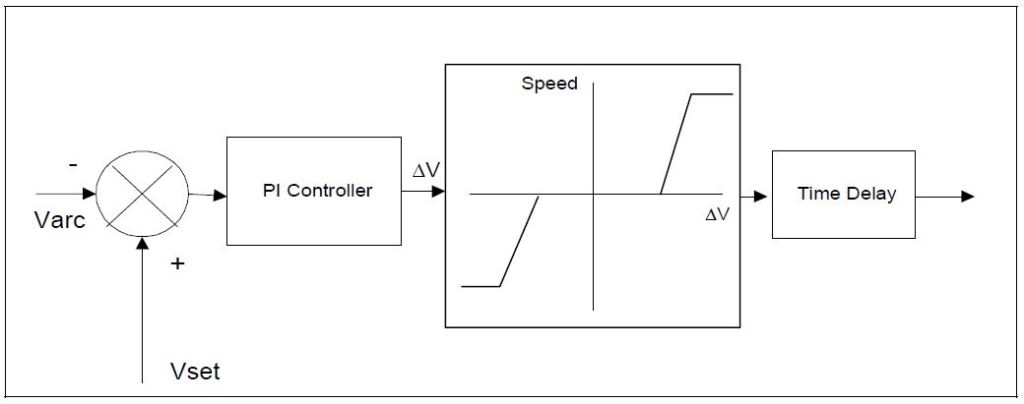
With a constant voltage across a unit length of arc, a desired total arc voltage is adjusted by changing the length of the arc. An appropriate operation voltage is obtained by lifting or lowering the movable positive electrode with respect to the fixed negative electrode. As a result, the distance between the tips of the electrodes changes, resulting in a different range of arcing voltage variation. At different melting stages, the furnace heating power is adjusted by changing the arc voltage. With constant supply system impedance, this voltage change results in arc current change and arc power change. A long arc operation tends to give a high operation power factor. A short arc operation results in a low power factor.
The third rule applied is a random time variation of the arc length. For any given ac furnace arc voltage setting and distance between the tips of the electrodes, the actual arc length changes randomly with time. The factors which directly affect this random change include the physical distance between the tip of the electrode and the materials to be melted, characteristics of the materials, status of melting, and many others related to furnace design and operation conditions. As a result, the magnitude of these random changes can be dramatic; ranging from a bolted short circuit to an open circuit.
Based on the results of many studies over several decades, it is now commonly believed that the variations of an electrical arc do not obey any standard distribution rule. Namely, the arc length changes in a completely random fashion. To properly represent such a random arc change, in this study, a band-limited white noise method is used. The principle of this method is shown in Figure 4.
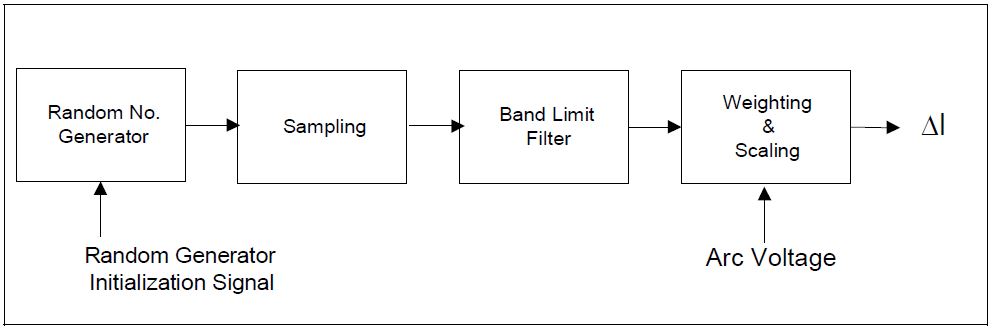
The procedure to model the random variation portion of the arc length consists of four steps:
- Generate a random number between 0 and 1 at each simulation time step
- Set up an appropriate sampling scheme so that the time step effects on the generated random signal are removed
- Process the sampled random signal through a bandpass filter so that only signals within a considered frequency range are able to pass to the next processing stage. A typical range of frequencies characteristic of the arc variations is 4 Hz to 14 Hz.
- Apply proper scaling and weighting functions which characterize the different disturbance magnitude at different melting stages. In this stage, a preset dc arc voltage is used as an input to the weighting function.
The effective arc length obtained through this procedure can be expressed by
L=Lo*(1-ΔL)
where
Lo is the desired arc length calculated by the electrode regulation control logic for a given dc voltage setting value.
With all the above factors considered, the arc voltage can be structured as
Va=kVao(Ia)
where
Vao is the arc voltage corresponding to the reference length, Lo. Coefficient k is the ratio of the threshold arc voltage corresponding to a length L, Vat(L), to that relevant to the reference length, Vat(Lo).
Since the relationship between threshold voltage and arc length can be expressed as
Vat=A+B*L
then, k is given by
k=Vat(L)/Vat(Lo)=(A+BL)/(A+BLo)
where
L is the arc length in cm, A is a constant taking into account the sum of anode and cathode voltage drops (40 volts), and B represents the voltage drop per unit arc length (10 volts/cm).
With the random nature included, k is
k(t) = (A+BL(t))/(A+BLo(t)) = 1-Br(t)Lo(t)/(A+B*Lo(t))
where
r(t) is a random number generated at time=t with magnitude ranging from 0 to 1
These furnace characteristics are implemented in EMTP TACS.
Power Meter Module
The power meter module is developed to read out active power, reactive power, apparent power, along with displacement and true power factor directly at a desired monitoring location of the simulated system. The metering module is for a 60 Hz system. Single phase circuit quantities are calculated first. Three phase quantities are obtained by taking an average of the three phases.
Flicker Meter Module
A voltage flicker calculation module was developed for this study using EMTP TACS capabilities. The method used to separate voltage flicker from its 60 Hz carrier voltage is outlined in Section 6 of the CEA research Report: “Contract NO 042 T 178, Analysis of Flicker from Arc Furnaces.” This reported study was completed in 1983 by Ontario Hydro. In this report, instantaneous voltage flicker is obtained through a signal processing procedure of four steps:
- Voltage signal full-wave rectification
- 120 Hz notch filter
- 30 Hz low-pass filter
- DC voltage buckoff
In the module developed for this study, a minor modification on this procedure was made. As a result, the actual signal processing is illustrated in Figure 5.

FLICKER ANALYSIS
Summary of System Conditions Studied
Simulations were performed for a variety of different system conditions and furnace operating conditions. The objective is to evaluate the range of flicker variations that are likely and the sensitivity of these variations to the possible system configurations and the arc furnace operation.
There were three different power supply alternatives simulated. The various system conditions in combination with the possible arc furnace operating conditions resulted in twelve cases for the study (3 system options times two source strengths defining the range for each option times two different furnace operating conditions).
Summary of Expected Flicker Levels
Summaries of the cases are provided in Table 1 and Table 2. These tables include the maximum magnitudes of the instantaneous flicker, using the ΔV/V (peak) and rms flicker calculation methods. Previous measurements at the steel manufacturing facility (without the new line) showed un-weighted rms flicker levels in the range 0.25-0.30 %. The results in Table 2 show good agreement with these measurement results. The simulations include a 2-second window with arc variations designed to represent the worst part of the melt cycle. Therefore, the cases with two arc furnaces operating simultaneously are actually simulating two furnaces operating in the initial melt period when the arc is the most unstable.
The percentage values given in the summary tables for the ΔV/V values are in percent of the peak line-to-ground voltage. That is, they represent the maximum deviation in the fluctuation divided by the nominal peak line-to-ground voltage. The unweighted rms values are based on a 30 Hz reference frequency and are rms values expressed in percent of the nominal rms line-to-ground voltage. The rms calculation is based on a sliding window with a period equal to about 33 msec over the two seconds of the voltage fluctuation waveform. The maximum rms value over this time period is presented in the tables.
Table 1 – Summary of Flicker Simulation Results at the 230kV Customer Bus
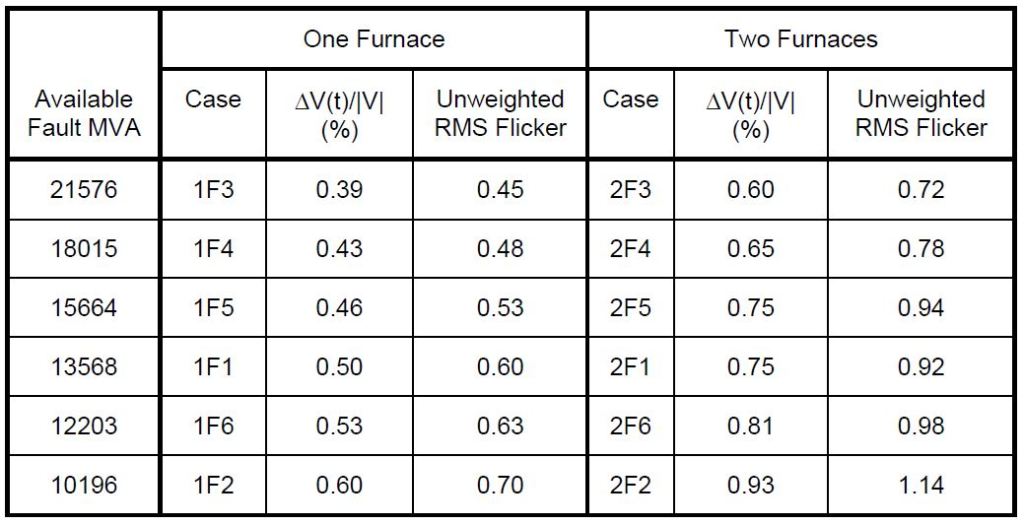
Table 2 – Summary of Flicker Simulation Results at the 230kV Utility Switchyard
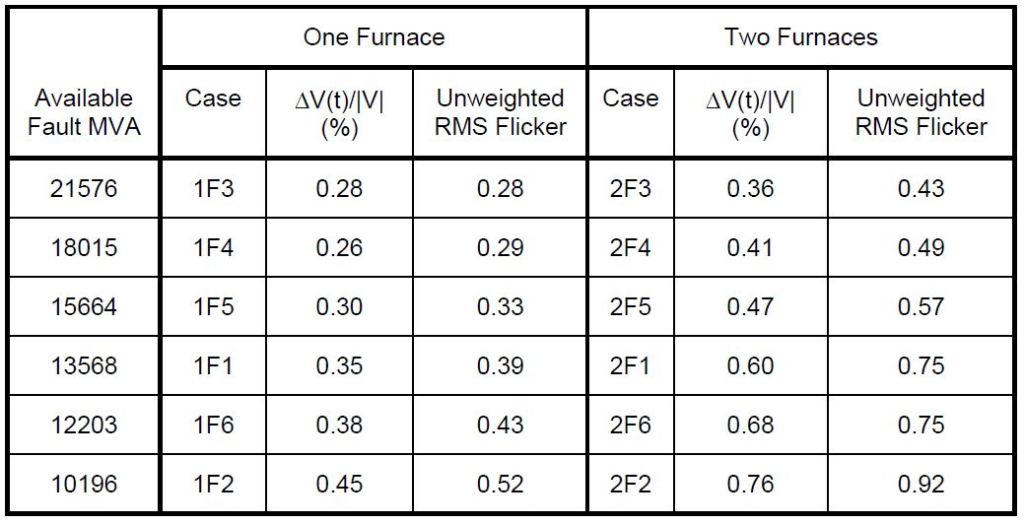
With primary components in the range 1-10 Hz, a flicker level less than 0.5% is generally considered to be acceptable. The results at the 230kV switchyard indicate that flicker levels are acceptable for one furnace operation almost all the way down to the worst case short circuit level simulated. The flicker levels are higher at the steel manufacturer’s 230kV bus but there are no other customers supplied from this point at the present time.
For two-furnace operation, the worst case rms flicker levels are acceptable as long as the short circuit level at the 230kV switchyard is about 16000 MVA. Lower short circuit capacities at the 230kV switchyard could result in objectionable flicker levels for worst case furnace operating conditions (two furnaces in the initial bore down period of the melt).
The increase in flicker levels due to the second furnace ranged from 50-70%. This is somewhat higher than the 40% often quoted but this is probably due to the conservative nature of these cases where worst case conditions are simulated for both furnaces at the same time. This comparison is based on the ratio of maximum values for the 2-second period. A comparison of the average values over the same period will give less conservative results.
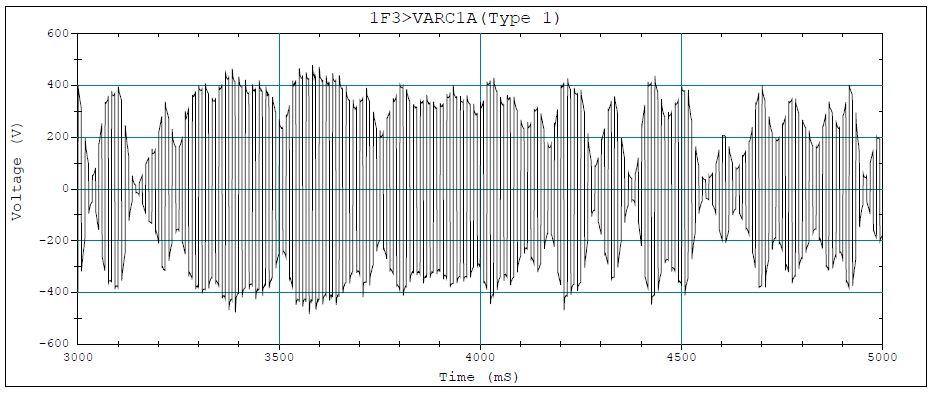
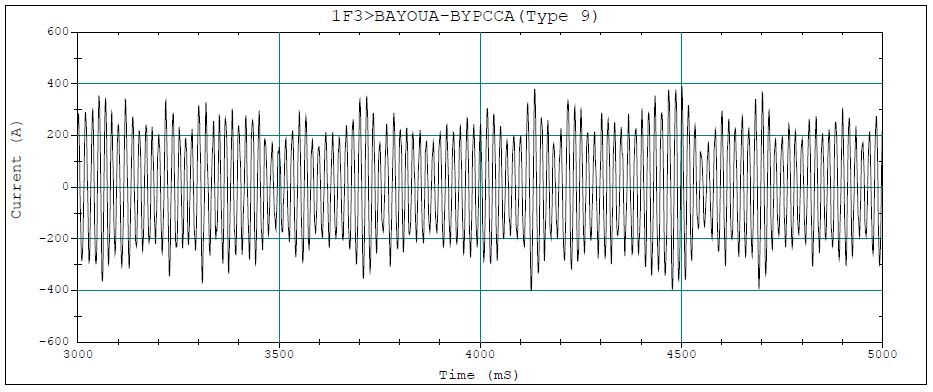
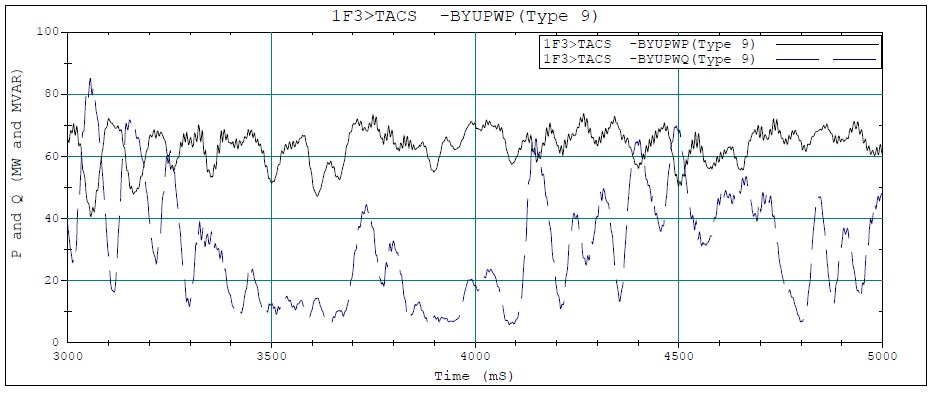
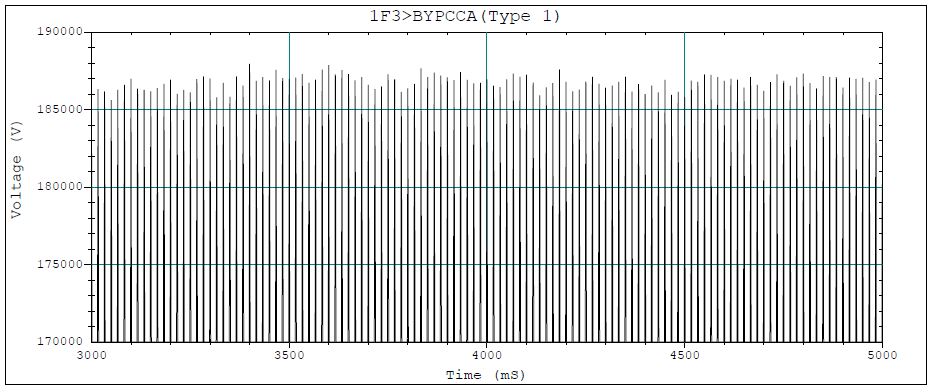
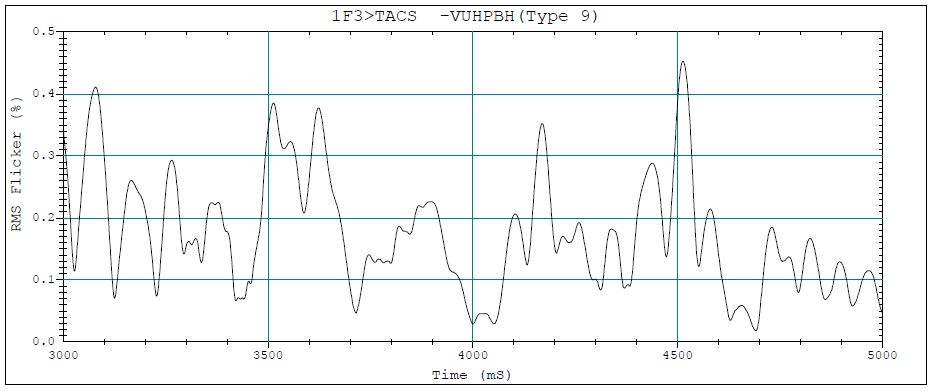
Typical Waveforms of Interest
This section provides example waveforms of Case 1F3 illustrating the simulations and the results.
A few observations are worth noting from these waveforms.
- The instantaneous and rms flicker plots show significant variations. The maximum value can be significantly higher than a value averaged over a 1 or 2 second period. The maximum flicker values have been used for evaluation in this study. This should be considered a conservative approach.
- The frequency spectrum of the flicker is concentrated in the range 1-12 Hz but it is difficult to pick out a dominant frequency. This means that the simplified calculation approaches for sine waves and square waves cannot be applied at all for these waveforms. The concentration below 12 Hz is typical of arc furnace variations without a static var system. These variations are in the range that has the most potential to cause complaints.
- The frequency spectrum of the flicker shifts somewhat with two furnaces operating. In this case, the dominant components are in the range 8-12 Hz, rather than the 1-5 Hz range for one furnace. However, this is still in the range that can cause problems.


SUMMARY
An EMTP-based arc furnace model was developed for evaluation of flicker concerns associated with supplying a steel manufacturer as they go to two furnace operation and as system changes are implemented that will affect the short circuit capacity at the 230kV substation supplying the plant. The model includes a dynamic arc representation which is designed to be characteristic of the most dynamic stages of the arc furnace melting cycle (worst flicker conditions). The flicker calculations with this model were found to have excellent agreement with previous flicker measurements with one furnace operating and a short circuit capacity of 21576 MVA at the substation. Flicker simulations were then performed to evaluate a variety of different possible system strengths with both one and two furnace operation.
The primary flicker measure used for this study is the unweighted rms value of the fluctuation envelope, expressed as a percentage of the rms line-to-ground voltage magnitude. It is desirable to keep this unweighted rms flicker level below 0.5% based on the fact that arc furnace fluctuations are usually in the most sensitive region defined on the flicker curve.
(shows supply voltage variations, ΔV, in percent and the rate of their occurrence).
The Figure 14 shows the variations of the unweighted rms flicker with the short circuit capacity at the utility substation for both one and two furnace operation. Flicker should not be a problem at the substation for one furnace operation all the way down to the minimum short circuit capacity possible (10196 MVA). However, with two furnaces operating simultaneously in the most dynamic portion of the melt cycle, flicker levels can be expected to increase substantially. It should be noted that these should be considered worst case flicker levels, such as the level that will not be exceeded more than 0.1% of the time.
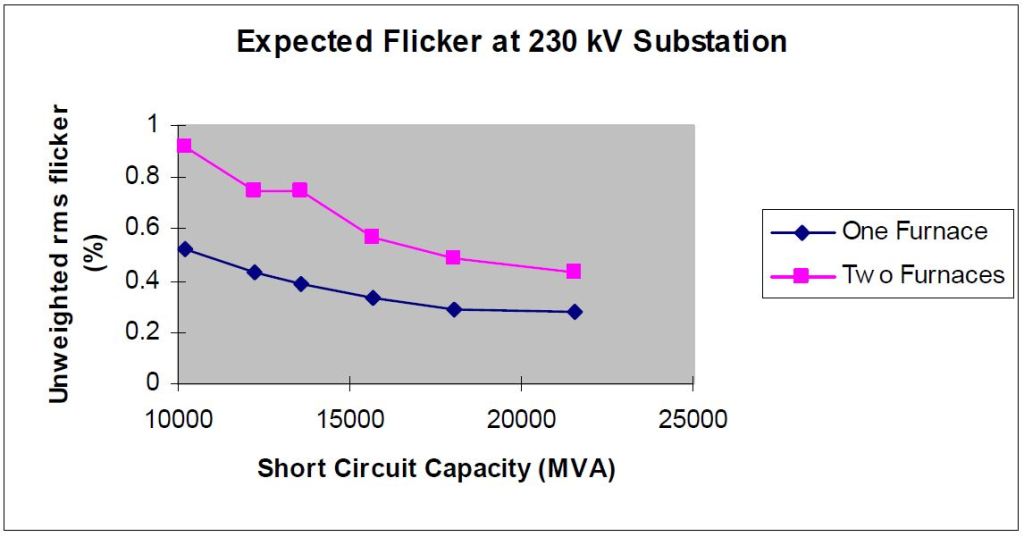
Another important result of the simulations is the frequency spectrum of the flicker. With only one furnace operating, the frequency components of the flicker are spread over the range 1-12 Hz with some concentration in the range below 5 Hz. This agrees quite well with the previous measurement results where all the dominant components were below 5 Hz. This frequency spectrum becomes more concentrated in the range 8-12 Hz with two furnace operation. The higher frequency components with two furnace operation may provide some benefit because the weighting associated with the perception of flicker results in slightly higher allowable levels above 10 Hz (see flicker sensitivity curve above).
Accounting for the higher frequency components in the flicker with two furnaces operating, unweighted rms flicker levels up to about 0.7% should not cause complaints. With these criteria, flicker complaints should not be expected with two furnace operation unless the short circuit capacity is less than about 13000 MVA.
Based on these observations, it is suggested that the two furnace operation be permitted and monitoring be performed to evaluate actual flicker levels over time. These flicker levels can be correlated with any customer complaints in the area. If any problems are encountered, two possible approaches can be adopted to resolve the problem:
- A static var system can be installed. Two different static var systems could be installed on the two furnace buses or the buses could be tied together and a single SVC installation designed. The single SVC installation would be much more economical. The size required is estimated to be about 85 MVAr.
- The furnace operation procedures can be modified to prevent synchronizing of the melt cycles. If the two furnaces are not in the initial melt stage or are not loading scrap into the melt at the same time (this happens 2-3 times per melt cycle), there should not be any flicker problem associated with the two furnace operation. Some staggering of the melt cycles is probably beneficial from a production point of view anyway. If this approach is feasible, it would seem to be the preferred solution.
RELATED STANDARDS
IEEE Std. 519, “IEEE Recommended Practices and Requirements for Harmonic Control in Electrical Power Systems.”
GLOSSARY AND ACRONYMS
EMTP: Electromagnetic Transient Program
PCC: Point of Common Coupling
SVC: Static-Var Compensator
TACS: Transient Analysis of Control Systems
TCR: Thyristor Controlled Rectifier
THD: Total Harmonic Distortion
Voltage Flicker: Observable changes in light as a result of voltage fluctuations
