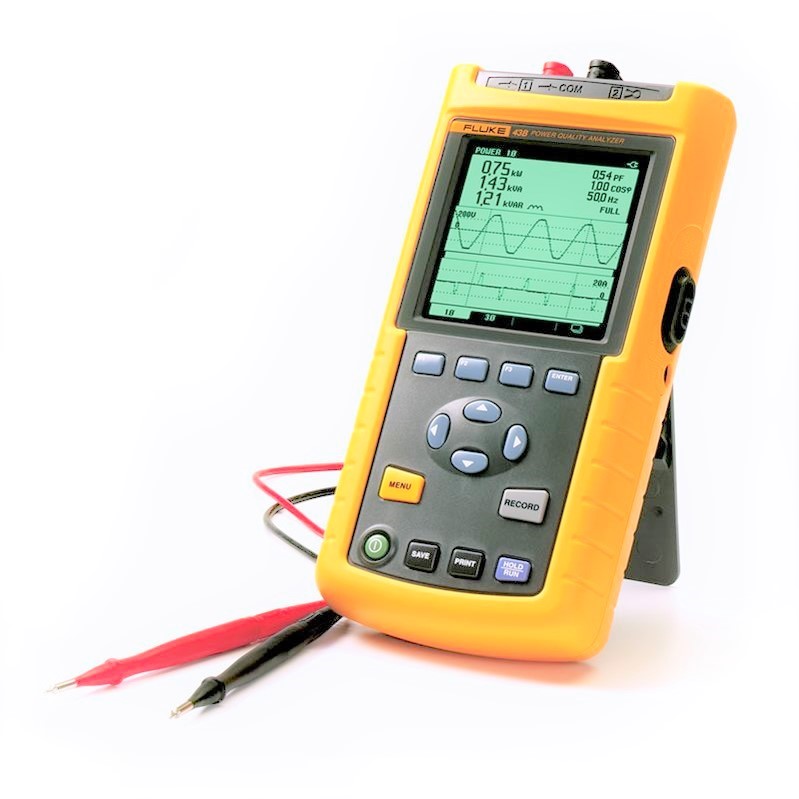
This section provides easy-to-do measurements which you can perform almost anywhere. Begin with these examples to get started with the Fluke 43B.
Note: It is a good idea to reset the Fluke 43B before you start a new application. This way, you always start from the same setup.
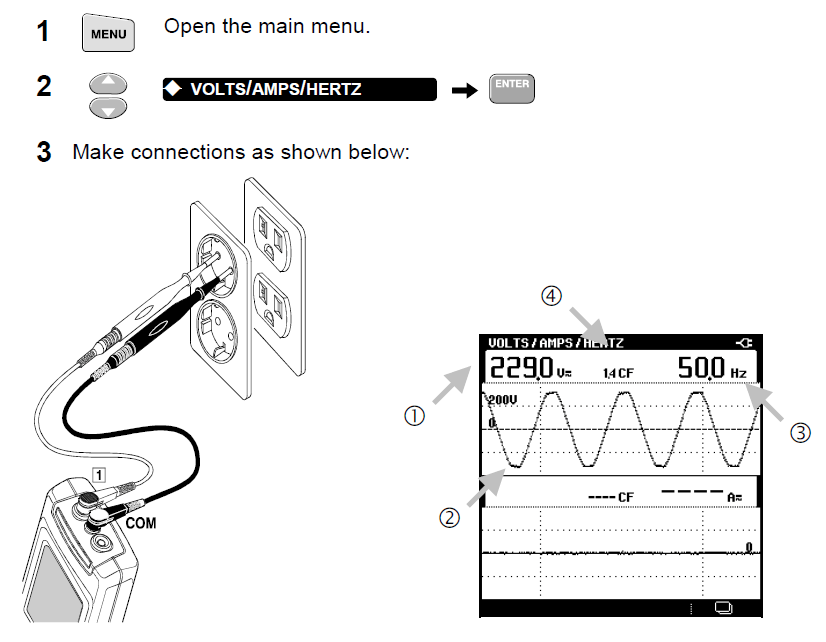
Measuring Line Voltage
Determine whether the voltage level, voltage waveform, and frequency from an outlet are correct.
The rms voltage should be close to the nominal voltage, for example 120V
or 230V.
The waveform should be smooth and sinusoidal.
The frequency should be close to 50 or 60 Hz.
The Crest Factor CF is an indication of the amount of distortion. A high Crest factor means high distortion.
Note: Nominal voltages and frequencies differ by country.
Measuring Current
Determine how the current from an outlet is supplied to a load, in this example, a hair dryer.
When the hair dryer is turned on, the current from the outlet increases.
Notice that without test leads connected, the Fluke 43B measures the frequency of the current signal.
Line Voltage and Current Simultaneously
Measuring Line Voltage and Current
Determine the influence of the load current on the voltage.
The rms voltage should stay within reasonable limits.
The current increases when the copier is warming up or making a copy.
Note: In stead of a copier, you can also use other loads of 1000W or more.
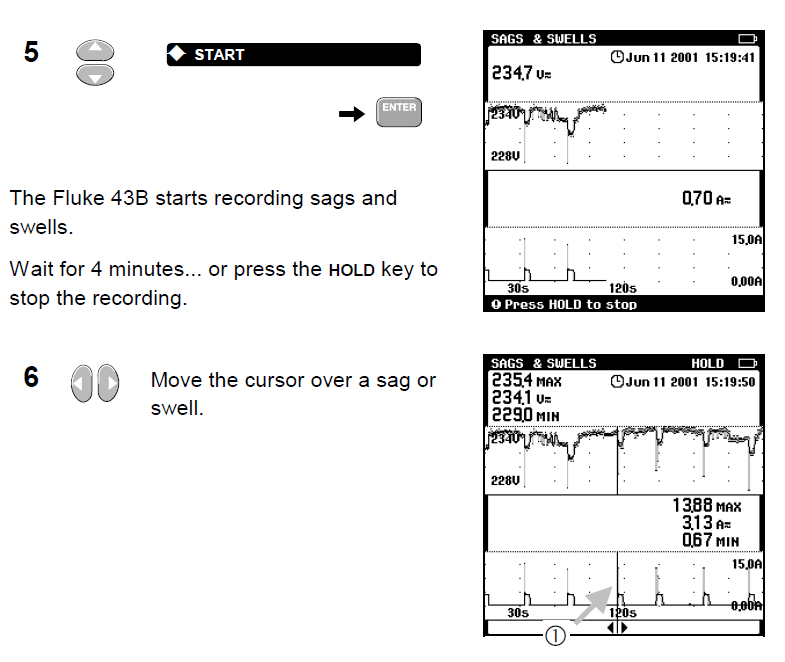
Recording Line Voltage and Current
By recording the voltage and current, you can establish a possible relation between the two. For recording voltage and current, always use SAGS & SWELLS. Basically it does the same as the RECORD key, but it can record faster fluctuations. Use the RECORD key for all other combinations of readings you want to record.
Use the copier again and proceed as follows:
Choosing shorter recording times makes it easier to see details of events on the screen.
1.In this example, the high peak current from the copier caused the voltage to drop (voltage sag).
In general, if you find voltage sags, the next step is to look for devices which may cause them. Poor connections or long conductors increase the effect.
Testing Continuity
Check whether a fuse is broken or open by checking continuity. In general, you can check any circuit for open connection.
When the Fluke 43B beeps and shows a beep-icon, the fuse is closed.
When the Fluke 43B shows OL (Over Load), the fuse is open.
Note: When the resistance is high (>30Ω), an open circuit is indicated, otherwise the circuit is considered to be closed (0 – 30Ω).
Measuring Resistance
Measure the resistance of a relay coil (or a resistor)
Observe the resistance. A typical reading on the display should be between about 150 and 500Ω. If the reading seems too high, test a known good device and compare the measured values of both devices.
Measuring Capacitance
Measure the capacitance of a capacitor (≤ 500 μF).
Observe the capacitance. The display shows the measured value of the capacitor. Compare the measured value with the value indicated on the capacitor.
Testing a Diode
Check a diode in both forward direction and reverse direction. Useful for checking whether the diodes in a rectifier are still intact
Observe the voltage in forward direction (A). It should read about 0.5V. Now turn the diode in reverse direction (B) and look at the display again.
The Fluke 43B should display OL (Over Load), indicating a very high resistance. If not, the diode is faulty and should be replaced
Power quality standards exist to guide the interconnection requirements of large wind and solar plants. IEEE guidelines exist for flicker and harmonics, while IEC guidelines exist for the measurement criteria of power quality phenomena and the characterization of wind turbine equipment. There are also some uniform guidelines for low voltage ride through (LVRT) of large plants. The presentation gives an overview of these standard and requirements, and also suggests some application guidelines not covered in the standards themselves.
Index Terms— Power system harmonics, wind power plants, wind turbines, flicker, low voltage ride through.
List of Acronyms
CSP
Concentrated Solar Plants
CP
Cumulative Probability
CP95%
CP 95% Level
LGIA
Large Generator Interconnection Agreement
PCC
Point of Common Coupling
PES
IEEE Power and Energy Society
PV
Photovoltaic
TDD
Total Demand Distortion
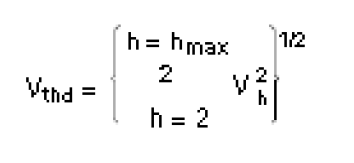
THD
Total Harmonic Distortion
UWIG
Utility Wind Integration Group (now UVIG)
UVIG
Utility Variable Integration Group (formerly UWIG)
WPP
Wind Power Plant
I. Introduction
Utility scale wind and solar power plants can be characterized as systems that are 20MW or more of output, and have a transmission system interconnected at a voltage greater than 69kV. Smaller and more dispersed systems have a lower production output and are connected on distributions systems with a voltage lower than 69kV.
Power quality is the study of compliance when various systems will operate properly on the power system, and that they will not interfere with the operation of other devices on the system. Power quality disturbances include outages, voltage variations (high or low), and waveform distortions. The power quality issues of wind and solar plants depend upon the type of facility and its power conversion technology.
II. Types of Wind Turbine Generators
Typically wind turbine generators do not utilize conventional line-connected synchronous machines, but rather other machine designs. The evolution of the wind turbine design has allowed for the capture of greater power over more variable wind conditions. The type of wind turbine generator is important in evaluating their power quality characteristics. The Western Coordinating Council was instrumental in developing various stability models, where different wind turbine types were introduced [1]. The IEEE Wind and Solar Plant Collector WG has also published a paper on wind turbine types [2].
The Type 1 wind turbine generator utilizes an induction motor. It operates near synchronous speed, with a minor amount of speed variation from the slip of the motor. The operation of this machine has been described as being like “blowing on a fan”.
The Type 2 wind turbine generator utilizes a wound rotor induction generator. The rotor terminals are brought external to the motor via slip rings, and the rotor resistance is controlled. This configuration allows a higher slip and a wider speed control range than available with the Type 1 wind turbine generator.
Type 1 and Type 2 wind turbine generators consume reactive power, so these turbines include power factor correction. These power factor correction capacitors are an important resonance consideration when a harmonic study is performed.
Type 3 wind turbine generators are also commonly referred to as the Doubly-Fed Assynchronous Generator (DFAG) or as a Doubly-Fed Induction Generator (DFIG). In this configuration the rotor is separately powered through a double-conversion power electronic bridge. The power delivered by the machine is the net result of both power circuits. The advantage of the Type 3 wind turbine is controllability of the machine over a wide-speed range, and the ability to control power factor from leading to lagging as required by the grid. Typically the power conversion in the rotor circuit is about 30% of the overall capacity of the machine.
Type 4 wind turbine generator utilizes full power conversion via voltage source inverters. The generator operates at the mechanical optimum speed, while the inverters convert the power back to line frequency.
Type 3 and Type 4 wind turbine generators utilize power electronics, so harmonics are usually monitored and studied. It is important to realize that these inverters utilize PWM style controls, so that the current harmonics to the grid should be low (Ithd<5%) in either case.
III. Types of Solar Power Plants
Concentrated solar plants (CSP) concentrate sunlight from lenses or mirrors with tracking systems to focus a large area of sunlight into a small beam. The concentrated heat is then used as a heat source at a central tower generates steam which powers a conventional synchronous machine.
Photovoltaic (PV) systems convert light into DC power using solar cells. Individual cells are connected into arrays, where the DC power is converted through an inverter for connection to the power grid. Large PV inverters utilize PWM style controls, and the harmonic issues are very similar to Type 4 wind turbine generators.
IV. Compliance with Harmonic Standards
In the United States, IEEE Std 519 [3] is the important standard for governing the harmonics considerations of wind power plants although certain limitations apply. Article 9.7.6 of the Standard Large Generator Interconnection Agreement (LGIA), used by many electric reliability organizations, requires generating facilities to limit excessive harmonic distortion in accordance with IEEE Std 519. The application of the IEEE Std 519 limits to wind plants is an area of practice that is evolving. Fundamentally, it is important to realize that the current limits in the recommended practice do not apply to harmonic currents that are absorbed by the wind plant from the background harmonic source of the grid. Series resonance from the collector cable capacitance can easily result in an idle wind power plant absorbing more harmonic current than prescribed by the IEEE Std 519 recommended limits.
Facility compliance is evaluated at the point of common coupling (PCC), and although individual wind turbines may be certified as IEEE Std 519 compliant, the aggregate facility may not meet emission limits. Section 10 of IEEE Std 519 outlines the current distortion limits for individual and total harmonics for various grid voltages as a function of a facilities ratio of short circuit current to the maximum fundamental load current. The current distortion is based upon the maximum demand load current (fundamental frequency). This percentage calculation is referred to as the Total Demand Distortion (TDD). It is often convenient to convert the current limits from percentage values to Amperes, allowing direct comparison with measured values. An example of harmonic current limits at a wind power plant (WPP) is given in Table I.
Table I. Harmonic Current Limits at a WPP Interconnection
The maximum current harmonics for interconnecting distributed resources with electric power systems are given in IEEE Std 1547 [4]. The limits indicated for distributed resources are the same as those for large loads specified in IEEE Std 519.
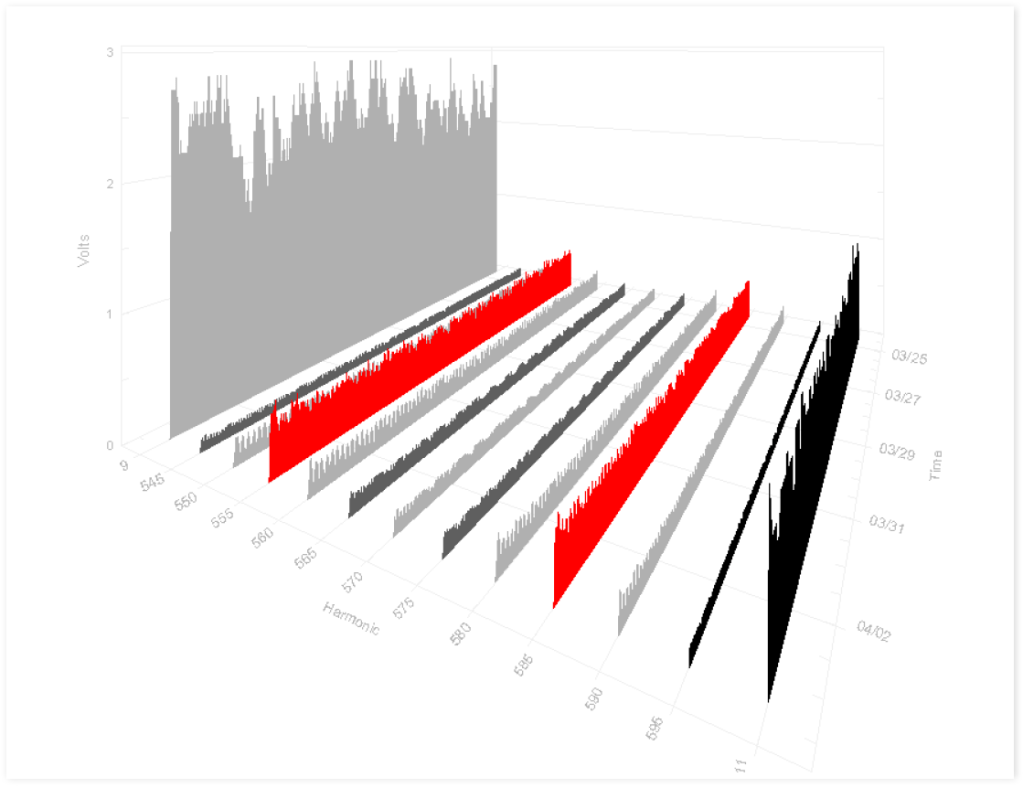
IEC 61000-4-30 [5] prescribes a standard approach for measuring harmonics, where 200 ms windows are used. The data are then aggregated into 10 minute intervals. The 10 minute average values should be used for comparison against the recommended limits. An example trend of the 5th harmonic current at the point of interconnection is given in Figure 1.
Fig. 1. Example trend showing the 5th harmonic current at a wind power plant point of interconnection (10 minute average values)
Additionally, voltage distortion limits are also set forth in Table 11.1 of IEEE Std 519 for the corresponding interconnection bus voltage. However, some sites will have harmonic voltage background levels that will exceed these limits, even when the WPP is not in service. The actual voltage distortion contribution from the WPP may be difficult to assess, as the background and WPP harmonic generation will vary over time. The current distortion (Individual harmonics and TDD) may be the most practical measurement for compliance.
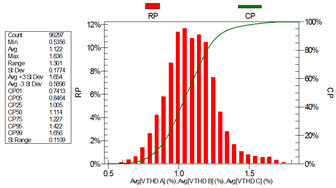
When limits are exceeded, they should be evaluated on a statistical basis. The limits should be met by the value that provides a cumulative probability level of 95%. Figure 2 shows an example case that can be considered as compliant, as the limit is met by more than 95% of the measured values. The data block in Fig. 3 statistically represents the same data as in the harmonic voltage trend, shows that the cumulative probability 95% level (CP95%) is 1.42% VTHD, which meets the recommended limit.
Fig.2. Trend of the harmonic voltage distortion at a wind power plant interconnection
Fig. 3. Statistical analysis of harmonic voltage distortion measurements
V. Voltage Variation Ride Through
In the U.S. a common requirement is now for Zero Voltage Ride Through (ZVRT) for a three-phase fault for 9 cycles (0.15sec), however these requirements are relaxed for turbines installed before 2008, requiring LVRT to 0.15pu voltage for 9 cycles [6]. Some regions have also begun to adopt overvoltage ride through recommendations for turbine wind plants.
Solar plants are only now becoming large enough to be challenged to meet voltage variation ride through requirements. Traditionally, the smaller systems utilized inverter controls that would idle at the first instance of a system disturbance to prevent islanding. Large scale plants will require new inverter control systems that enable operation during voltage sags and swells.
VI. Flicker Requirements
Flicker is a variation in the system ac voltage, which can result in observable changes in light output and in some cases become annoying and objectionable. In a solar plant the important cause of flicker is a cloud that can cause an abrupt change in the irradiance and power output of the facility. In a wind farm flicker is caused by variations in wind turbine generator (WTG) power output due to variation in wind speed, blade pitching, tower shadowing, wind shear or gradient, and WTG start and stop operations.
The IEEE Std 1453 [7] has essentially adopted the IEC 61000-4-15 [8] to provide uniformity to internationally standards. While the methodology is uniform to the international measurements practice, the results will be comparable to the old “GE Curve” contained in the IEEE Std 141 [9].
Flicker is only a concern for interconnections to “weak” systems, such as distribution interconnections in areas of the system where fault currents are very low. The Utility Wind Integration Group (UWIG) has documented this phenomenon very well for wind facilities [10].
VII. IEC Guidelines
The IEC 61400-21 [11] provides manufactures practices for the measurement and specification of the power quality characteristics of turbine equipment. A companion document, the IEC 61400-22 [12] provide commissioning agencies practices for conformity evaluations on site installations.
VIII. Conclusion
This paper has an overview of power quality standards for wind and solar power plants. With the exception of some recent standards such as the IEEE Std 1547, IEC 61400-21, and IEC61400-22, most of the standards were generally not written with consideration given to renewable energy plants. Therefore, the standards need to be applied with consideration given to the newer challenges of these technologies. Also, new applications guidelines need to be developed.
In particular, the IEEE Working Group on System Impacts and Interconnection Requirements of Wind and Solar Power Plants is currently active in this important work. The working group is tackling a variety of issues and it always welcomes interested parties who can help formulate practices and standards. To participate in this working group’s activities, please see: http://grouper.ieee.org/groups/td/interconnect/
IX. References
“Development and Validation of WECC Variable Speed Wind Turbine Dynamic Models for Grid Integration Studies”, M. Behnke, A. Ellis, Y. Kazachkov, T. McCoy, E. Muljadi, W. Price, J. Sanchez-Gasca, AWEA Windpower 2007.
Characteristics of Wind Turbine Generators for Wind Power Plants, IEEE PES Wind Plant Collector System Design WG, IEEE PES General Meeting, Calgary 2009.
IEEE Std 519-1992, “Recommended Practices and Requirements for Harmonic Control in Electric Power Systems”.
IEEE 1547-2003 “Standard for Interconnecting Distributed Resources with Electric Power Systems”.
IEC 61000-4-30:2008 Electromagnetic compatibility (EMC) – Part 4-30: Testing and measurement techniques – Power quality measurement methods.
FERC Order no. 661-A, “Interconnection for Wind Energy,” Docket No. RM05-4-001, December 2005.
IEEE 1453-2004 “IEEE Recommended Practice for Measurement and Limits of Voltage Flicker on AC Power Systems”.
IEC 61000-4-15:2010, Electromagnetic compatibility (EMC) – Testing and measurement techniques — Flicker meter – functional and design specifications
IEEE 141-1993 “IEEE Recommended Practice for Electric Power Distribution for Industrial Plants”.
Assessing Power System Quality using Signal Processing Techniques
Published by Math H.J. Bollen1, Irene Y.H. Gu2, Surya Santoso3, Mark F. McGranaghan4, Peter A. Crossley5, Moisés V. Ribeiro6, and Paulo F. Ribeiro7
Source: IEEE Signal Magazine, 2009
Signal processing has been used in many different applications, including electric power systems. This is an important category, since a wide variety of digital measurements is available and data analysis is required to deliver diagnostic solutions and correlation with known behaviors. Measurements are taken at numerous locations, and the analysis of data applies to a variety of issues in
power quality (PQ) and reliability
power system and equipment diagnostics
power system control
power system protection.
This article focuses on problems and issues related to PQ and power system diagnostics, in particular those where signal processing techniques are extremely important. PQ is a general term that describes the quality of voltage and current waveforms. PQ problems include all electric power problems or disturbances in the supply system that prevent end-user equipment from operating properly. Examples of voltage and current variations that can result in PQ problems include voltage interruptions, long- and short-duration voltage variations, steady-state harmonics and inter-harmonics, and transient electromagnetic disturbances. There are many different types of equipment used to capture and characterize PQ variations—PQ monitors, digital fault recorders, digital relays, various power system controllers, and other intelligent electronic devices (IEDs). Signal processing techniques are used in the recording of PQ variations as well as the analysis of events and conditions. This article creates an awareness of PQ issues in the signal processing community and provides an overview of the signal processing techniques that can be used to understand and solve the PQ problems experienced in the power systems community.
MOTIVATION AND ISSUES OF INTEREST
PQ RESEARCH
Research in PQ has traditionally been motivated by the need to supply distortion- and disturbance-free voltages to the end-user loads [1], [2] so that these loads operate properly. Voltage and current disturbances in the power system are a normal part of system operation, but these disturbances can cause incorrect operation of customer equipment. Characterizing these incompatibilities requires an understanding of the disturbances themselves and their possible impact on customer equipment. Devices to measure and characterize the disturbances (PQ monitors) have been widely used and have helped create new research opportunities that use the measured voltages and currents to indicate possible equipment and system problems (referred to as equipment diagnostics).
To further develop applications in both power quality and diagnostics, research activities have been focused on
the need for simple, fast, and efficient characterization of
the voltage and current variations that can affect sensitive customer equipment
the processing of voltage and current variations to understand how electronic equipment can be a source of waveform distortion (e.g., “transients” and “harmonics)
the need for continuous, online monitoring of power line signals in order to classify the precise disturbance type and possibly identify the source of the disturbance
the development of PQ monitoring instruments that not only capture disturbances but also distinguish between events and variations and can apply the appropriate processing to those measured signals that contain events
the processing of voltage and current waveforms to correlate with equipment and system problems (such as insulator failures, cable failures, splice failures, and tree contacts)
the processing of voltage and current waveforms to locate the source of variations or events (e.g., the cause of harmonics or the location of the fault).
Such requirements may involve sophisticated signal processing techniques that make use of signal decomposition, modeling, parametric estimation, and identification algorithms [3]–[6].
PQ VARIATIONS AND EVENTS
The operational voltage waveform in an ac utility power system has a nearly sinusoidal shape with a stable magnitude and nominal frequency (50 Hz or 60 Hz). For low-voltage equipment, the nominal voltage is 120 V in North America and 230 V in Europe. The current waveform reflects the system voltage and the load characteristics. For a balanced three-phase power system, there is about 120º difference in the phase between any two voltages or currents. The ideal case, designed for the optimal use of resources, is to have the frequency and voltage equal to the nominal values and a constant current in phase with the voltage. In the ideal case, voltages and currents are both sinusoidal.
However, actual voltage and current waveforms usually deviate from their nominal values. If the parameters (e.g., magnitude and frequency) are time-varying and deviate from their nominal values, it is referred to as a voltage variation (or a frequency variation). Any power problem that is manifested in voltage, current, or frequency deviations and results in the failure or incorrect operation of customer equipment is a PQ problem. PQ disturbances consist of two different types: PQ variations and PQ events (or events and variations for short) [6]. These two types require different types of processing.
PQ variations are small and gradual deviations from the nominal voltage. A few previously mentioned disturbances, such as waveform distortion, voltage variations, and frequency variations, are examples of PQ variations. Other examples are three-phase unbalance (deviation from the ideal phase angles and/or ideal magnitudes in a three-phase system) and voltage flicker (changes in voltage magnitude at a subsecond time scale, leading to light flicker in incandescent lamps). In what follows, one may notice that our definitions of particular PQ variations are strongly related to the way that the disturbances are quantified. Most PQ disturbances are related to minor deviations.
In some cases, however, large deviations occur in the voltage or current waveforms. Such PQ disturbances are called PQ events. The most severe and best-known example of a PQ event is a supply interruption or outage, in which the voltage is zero for longer than a few seconds. Other examples are voltage dips (a reduction in voltage magnitude that lasts between several tens of milliseconds and several seconds) and a voltage transient (a significant deviation from the sinusoidal waveform with a duration of less than about 10 ms).
It is worth noting that processing events and variations requires different signal processing techniques. Before discussing new approaches for signal processing in these applications, a review of existing techniques is given.
RESEARCH IN PQ HAS TRADITIONALLY BEEN MOTIVATED BY THE NEED TO SUPPLY DISTORTION- AND DISTURBANCE-FREE VOLTAGES TO THE END-USER LOADS.
CHARACTERIZATION OF PQ VARIATION
Most PQ variations are characterized by computing waveform features over a predefined time interval. Examples of standardized time intervals are 200 ms, 3 s, 1 m, 10 min, and 2 h.
An international standard (IEC 61000-4-30 [7]) exists that prescribes the way in which features are calculated, including the time interval over which these features are calculated. For example, voltage magnitude variations are quantified by the root mean square (rms) voltage calculated over a 200-ms window (or more precisely, ten cycles of the fundamental frequency in a 50-Hz system and 12 cycles in a 60-Hz system). Voltage unbalance, waveform distortion, and flicker are calculated over the same interval. For each time interval of data, the calculated features correspond to a voltage variation, unbalance, or some other type of variation in the specified time interval. However, many types of PQ variations can be present at the same time and cannot be separated. New variations are defined by introducing new features or combining existing features. A well-known example is flicker severity, which combines the calculated weighted average of voltage magnitude and its calculated change over the frequency range from 1 to 30 Hz. This results in a measure of flicker perceived by the human eye when this type of voltage fluctuation is applied to an incandescent lamp. The flicker severity measured over each 200-ms interval is then combined to yield values associated with a longer interval, e.g., one week or even one year.
Another example of PQ variations is the distortion of voltage or current waveforms by the introduction of harmonics and inter-harmonics. This type of distortion is often caused by certain loads that have nonlinear voltage-current characteristics (electronic equipment with power supplies is a classic example). Classic symptoms of harmonics are distorted voltage waveforms, transformer overheating, and blown capacitor fuses. Distortion that is not at integer multiples of the fundamental frequency is also possible for certain types of loads (e.g., arc furnaces and cyclo-converters); this type of distortion is referred to as interharmonics. Inter-harmonics are often difficult to quantify since they have rather low magnitude and tend to drift over time. They affect systems that are prone to resonance, especially those with low damping or a high Q factor.
The definition and computation of PQ variations are well standardized and documented [7]–[9]. Although there are many opportunities for additional applications in processing these variations, the main focus of this article involves measuring, characterizing, and analyzing PQ events. The methods for processing the quasi-stationary segments of PQ events, to be discussed in a later section, can also be used for processing PQ variations.
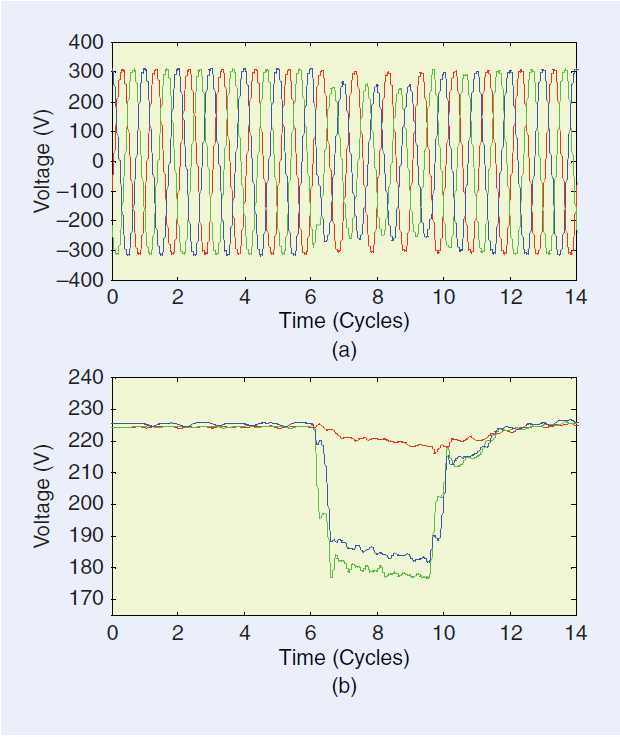
[FIG1] Typical example of a voltage-dip event due to a fault: (a) waveforms of the three phase-to-neutral voltages and (b) rms voltage as a function of time, measured in a 230-V network.
CHARACTERIZATION OF PQ EVENTS
The characterization of PQ events usually takes place in two stages. The first stage, referred to as triggering or event detection, is concerned with detecting the instant in time or triggering point at which an event starts. This stage distinguishes between a large and small deviation from the ideal voltage waveform. The second stage is characterization, in which the severity and duration of an individual event is quantified.
The characteristics of voltage dips, swells (short-duration increases in voltage magnitude), and interruptions are defined in the international standard on PQ measurements [7]. For example, in a voltage dip event (i.e., a drop in voltage magnitude), the voltage magnitude is quantified by the timedependent rms magnitude values: Each rms value is calculated from a one-cycle window of data where one cycle of power-system frequency is equal to 1/50 or 1/60 s. The process is repeated after shifting forward the data window with a half-cycle overlap. Once the rms magnitude values drop below a predefined threshold (often set as 90% of the nominal voltage), a voltage dip is detected. This detection often triggers additional operations (e.g., storage of the waveform over a certain time duration). Hence, triggering often refers to detecting the start (or end) of an event. A dip is typically quantified using one voltage value (or “magnitude”) and one duration value. Figure 1 shows the waveforms of a voltage dip event and the corresponding rms curves. The three colors correspond to the three phase-to-neutral voltages in a three-phase system. Note the difference in magnitude for the three voltages, the sharp drop and rise of the voltage magnitude, the slow decay in magnitude in between the sharp changes, and the slow recovery after the sharp rise. The sharp drop in voltage magnitude corresponds to the initiation of the fault; the sharp rise corresponds to the clearing of the fault.
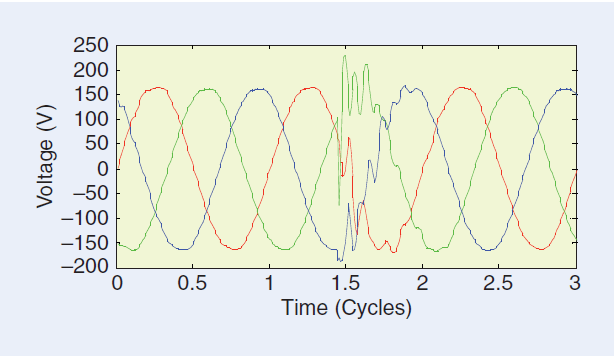
Triggering and characterization of transients are usually more complicated. So far, there are no international standards for this. Figure 2 gives an example of a transient voltage event measured in a three-phase system. The event shows a sudden initiation, oscillations with the same frequency but different amplitude in the three voltages, and a slow decay without a clear ending instant.
The definition of events for currents is somewhat more complicated, as the current magnitude changes over a much wider range of values than that of the voltage. However, once appropriate triggering methods are chosen, the definition of current events is straightforward. An overcurrent (i.e., when the current magnitude exceeds a predefined percentage) is an example of a current event. When an event trigger is detected, it is normal practice to record both the voltages and currents associated with the event since these quantities are very interrelated.
[FIG2] Example of a transient event measured in a 120-V network. This is a typical example of a capacitor-energizing transient.
EVENT DETECTION AND SEGMENTATION
AIM OF DETECTION AND SEGMENTATION
The first step in characterizing a PQ event is the detection of the event. This involves triggering (i.e., determining the starting and ending points). Event segmentation can then be used to partition the event into segments. Two types of event segments are usually determined, transition segments and event segments. Since the triggering points are closely related to the segment boundaries, event detection and event segmentation can be treated as two aspects of a single issue from a signal processing viewpoint, even though their applications and the manner of their implementation can be very different. In power system applications, event detection is often used for online triggering of a recording and thus for capturing the event. On the other hand, event segmentation usually takes place afterwards, during further analysis of the captured recording. Event detection can also be important for power system protection applications, where an event type is recognized in real time and the necessary steps are taken to isolate the area experiencing the event from the rest of the system or other remedial actions are performed.
An important issue for event detection and segmentation is the time resolution used for the estimation. Most detection and segmentation methods require some signal samples or a window of samples (e.g., for calculation of rms quantities or to apply bandpass filters) for estimating starting and ending points (the boundary points of the segment). Hence, there is an uncertainty in a detected point within a certain time interval, which is governed by the uncertainty principle. Roughly put, the longer the data window, the lower the time resolution for the detected points.
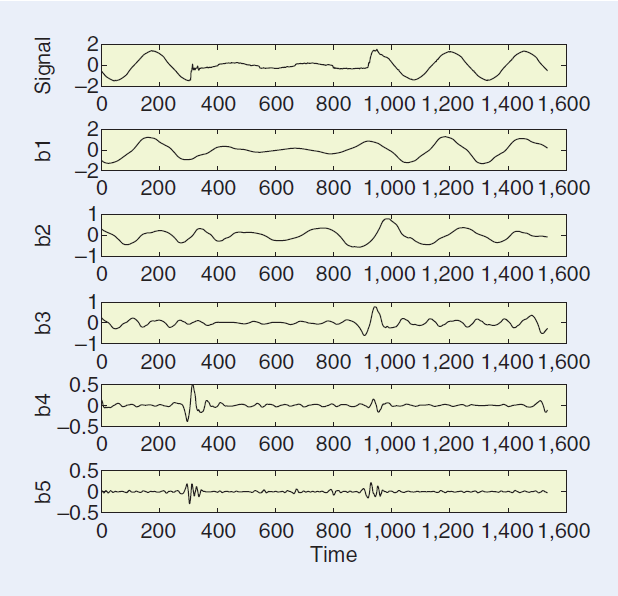
Detection and segmentation of events from signal waveforms is related to finding the quasi-stationary and nonquasi-stationary (or nonstationary, for short) part of the signals at a given time scale. The part of the signal before the nonstationary portion consists of either variations or nominal signals. Once the signal becomes nonstationary, further analysis needs to be performed. It is also worth noting that a signal that is nonstationary at a longer time scale could contain several quasi-stationary segments at a shorter time scale. For example, in Figure 3, the signal from cycles 5–25 is nonstationary in terms of a long time scale, but the signal from cycles 6–15 is quasi-stationary in a shorter time scale. For event segmentation, one is interested in finding nonstationary parts at a shorter time scale.
Event segmentation [10] consists of breaking an event into transition segments and event segments. In signal processing terms, segmentation is related to finding groups of data segments that possess similar properties. This is rather similar to image segmentation, in which an image is partitioned into several homogenous regions, and speech segmentation, in which a speech signal is divided into vowels and consonants. Event segmentation aims at partitioning the signal into quasi-stationary parts and nonstationary parts based on the physical state of the power systems. A transition segment is a segment where the signal is nonstationary, e.g., where there is a change in voltage or current magnitudes between two steady states. The duration of an estimated transition segment depends on the segmentation method applied. The transition segment should in all cases include the instant at which a change between two steady states takes place. The interval between the two nearest transition segments is an event segment, where the signal is quasi-stationary. The quasi-stationary segment before the first transition segment is a pre-event segment, while the quasi-stationary segment after the last transition segment is a post event segment. Transition segments are typically related to events or actions in the power system such as fault initiation, developing fault, fault clearing, and opening or closing of switches (to switch a line, transformer, capacitor, or other element). In Figure 3, the transition segments correspond to fault initiation, fault development to a three-phase fault, fault clearing by the circuit breaker on one side of the faulted line, and fault clearing by the circuit breaker on the other side of the faulted line.
[FIG3] Example of event segmentation from a voltage waveform recording. The segmentation results in a detected time interval (from 4.8 to 25 cycles), consisting of four transition segments (marked in yellow) and three event segments between the pairs of transition segments. Further, the segment before the first transition segment (the pre-event segment), and the segment after the last transition segment (the postevent segment) are segments related to the nominal states; they are thus excluded from the segmented event.
METHODS OF DETECTION AND SEGMENTATION
As mentioned before, triggering and segmentation both involve the detection of a deviation from the quasi-stationary character of a voltage or current signal. Therefore, the same kind of signal processing tools are used for segmentation and for triggering. The segmentation of an event is equivalent to finding transition segments. Three basic approaches exist for detecting transition segments [6].
■ The first approach, containing the simplest methods, involves calculating a number of time-dependent waveform features, typically the time-dependent rms voltage and current magnitudes. The transition segments are then detected by comparing the change in magnitude with a predetermined threshold. Although this method only requires simple signal processing, it turns out to be remarkably efficient for most measurement recordings. The triggering method employed for voltage dips, swells, and interruptions, in the vast majority of existing instruments, uses the rms voltage.
■ The second approach is to use high-pass or bandpass filters, followed by detecting step changes or oscillations. An event in a power system often results in a fast change in voltage (or current) and high-frequency oscillations. A high-pass filter can be used to detect such changes and oscillations. Many studies have been conducted, especially using wavelets, and are common in the literature. Wavelet filters are known to be effective in detecting multiscale singular points, and triggering points are usually related to significant sudden changes or singularities in the signal waveform. Since wavelet-filtered signals show all multiscale singular points of a signal waveform, some postprocessing is required to identify the triggering points (i.e., the starting and ending points). An advantage of using wavelet filters is their ability to automatically find the best resolution scale for detecting the triggering points (see the example in Figure 5). However, there is no reason to restrict this approach to the use of wavelet filters, as other high-pass filters may perform equally well for detection or segmentation. An analog or digital high-pass filter is typically used in existing instruments to detect transients.
■ The third approach makes use of parametric methods, where a signal model (e.g., a damped sinusoidal model or autoregressive model) is used. Depending on the algorithms used, a recorded data sequence may be divided into blocks, and the model parameters in each block may be estimated. This can be accomplished using estimation of signal parameters via rotational invariance techniques (ESPRIT), multiple signal classification (MUSIC), or autoregressive (AR) modeling. Alternatively, iterative algorithms may be used without dividing data into blocks (e.g., using Kalman filters). The so called residuals (model errors), which indicate the deviation between the original waveform and the waveform generated by the estimated model, are then calculated. As long as the signal is quasi-stationary, the residual is small; however, for a sudden change in the signal, e.g., a transition, the residual values become large. Residual values can therefore be used to detect transition segments. Each of these methods has advantages and disadvantages.
An important requirement for further study is to evaluate and compare the performance of different methods for real disturbance recordings. It is important to realize that the final aim is to detect the instant at which a change in the power system takes place. The different methods should therefore be evaluated for their ability to correctly detect and localize these changes; they should be compared in terms of time resolution, the detection rate, and the false alarm rate of the detected points. The classic tradeoff between the detection rate, false alarm rate, and time resolution may play an important role here.
EVENT CHARACTERIZATION
It is worth emphasizing that the basic purpose of event characterization is to find common features that are likely to be related to specific underlying causes in power systems. It is not difficult to detect the occurrence of an event, e.g., a voltage dip, from the signal waveform; however, finding the underlying cause of a dip (whether it results from faults, transformer energizing, or some other phenomenon) is the main aim in event characterization. Thus, event characterization is directly related to event analysis and feature extraction.
It is important to distinguish between the characterization of event segments (where signals are quasi- stationary) and the characterization of transition segments and transients (where signals are nonstationary). From the signal processing viewpoint, characterizing event segments is related to analyzing and extracting features from quasi- stationary signals, an area for which general signal processing theories, methodologies, and algorithms are relatively well established. Event characterization requires joint efforts from the power engineering and signal processing communities, with the former providing specific knowledge about power systems, types of events, and their most relevant features and the latter developing automatic methods. Characterizing transition segments and transients, however, is related to analyzing nonstationary signals, an area where most signal processing research is still limited to finding solutions to specific problems; knowledge of and insight into the power system is also limited. Later in this article we shall briefly review some methods that are used for analyzing and characterizing transition segments (transients). We will then review the state-of-the-art signal processing methods currently used in power engineering research for the analysis and characterization of event segments (the quasi-stationary part of the event). These methods can also be applied to PQ variations that are quasi-stationary in nature.
TRANSIENTS AND TRANSITION SEGMENTS
Research on the analysis and classification of power system transients is still developing. Even though the analysis and characterization of transition segments has not been a major area of focus, it will be critical for event analysis and underlying cause identification. The limited research is mainly due to short data lengths, a lack of understanding of the underlying power system changes, and the lack of generic nonstationary signal processing methods. Advancements in measurement equipment and data management are dramatically increasing the availability of transient events for analysis. This should spur increased development of analytical tools so this data can be used for the intelligent management of the power system, which means being able to automatically process and classify these events.
There are many different types of transients. However, many of them still must be analyzed and understood before appropriate mathematical models can be applied. Challenges for power system experts include 1) understanding and interpreting the high-frequency band of the disturbances, especially distinguishing whether the high-frequency band of the signal was caused by a power system disturbance or by interference from the measurement environment, and 2) modeling power system behavior during fast transitions by using circuit theory and power system modeling. Unfortunately, only a small portion of transients could be modeled up to now (e.g., damped sinusoids). One example of this type of model is that developed for capacitor switching transients. The solution, however, is still constrained by the condition in the signal processing model: when the ESPRIT or MUSIC technique [11] is used, it requires that all sinusoids be present throughout the entire data window under analysis. If sinusoidal components start from different time instants, the algorithm may yield some frequencies that are not related to the corresponding power system event [12]. Obviously, more research and modeling are needed for power system transient analysis. The ESPRIT and MUSIC methods will be discussed in a later section, as they have also been applied to the analysis of quasi-stationary segments.
SIGNAL PROCESSING METHODS FOR QUASI-STATIONARY DATA SEGMENTS
It should be emphasized that the methods described here can be used to both 1) characterize the waveform in event segments of PQ events and 2) quantify PQ variations. Since both types of signals are quasi-stationary, the same signal processing principles can be applied.
FILTERS FOR REMOVING FUNDAMENTAL VOLTAGE/CURRENT
This preprocessing is often required before beginning an analysis and characterization of the signal. For analyzing disturbances, the dominant fundamental 50 Hz or 60 Hz voltage/current can be considered as strong noise (often it is more than 10 dB stronger than the signal). This could affect the accuracy of signal component analysis for frequencies near the fundamental frequency. The most frequently used filters are the notch filter and other high-pass filters (for instance, McClellan linear-phase finite-impulse response high-pass filters [13]).
TIME-FREQUENCY DECOMPOSITION OF THE SIGNAL BY TRANSFORMS AND SUBBAND FILTERS
Decomposition of a one-dimensional signal into two dimensional time-frequency components allows one to observe the changes of individual components as a function of time. Hence, a further characterization of the dynamics of the components is possible, e.g., monitoring the changes of harmonic components over time and detecting the triggering points of the event.
SHORT-TIME FOURIER TRANSFORM
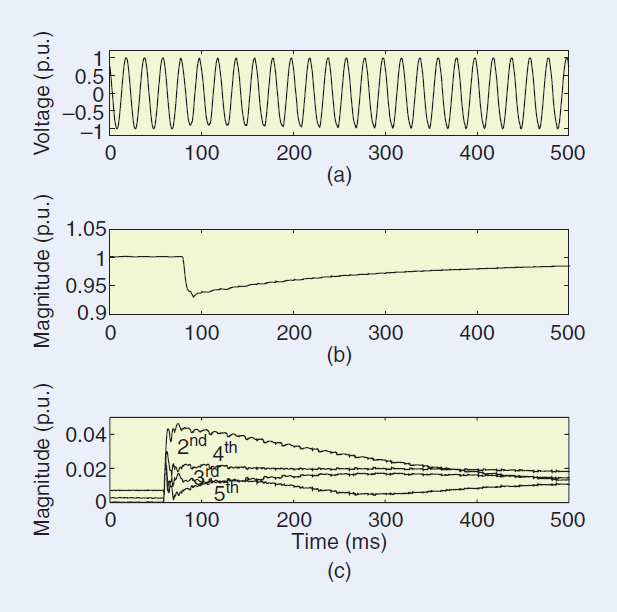
Choosing a signal decomposition method is often dependent on the application. In many power engineering applications, harmonic-related analysis is of interest. In such a case, short time Fourier transform (STFT) [14] offers time-frequency signal decomposition that is equivalent to applying a set of equal-bandwidth subband filters. Essential parameters that require fine-tuning for power system applications include the center frequencies and bandwith of subband filters: the center frequencies of equivalent bandpass filters should be set at the harmonic frequencies. This can be adjusted by zero-padding the windowed data before applying the fast Fourier transform (FFT). The filter bandwidth is determined by the size of the analysis data window. It is essential that only one or a few harmonics be allowed in each passband. There needs to be a tradeoff, however, between the time resolution of sub band filters and the number of harmonics allowed in each passband, i.e., the bandwidth of the filter. Further, to reduce the artifact of fluctuations in decomposed components caused by applying a window to the periodic signal, the window size is set to be one or an integer number of voltage/current fundamental cycles. Figure 4 shows an example of the magnitudes of the third, fifth, and seventh odd harmonics after applying STFT to a voltage dip recording. One can observe the harmonic contents and their changes before, during, and after the dip. The harmonic distortion increases slowly during the dip, especially in the third band. Further, the distortion is somewhat lower after the dip than before the dip. Although the window of L=256 leads to a low time resolution, the frequency resolution is relatively high: the output of each bandpass filter has a weighted average of three harmonics (within 3-dB bandwidth).
[FIG4] Pseudofundamental and harmonic voltage magnitudes obtained from the complex bandpass filter outputs using STFT (Hamming window L = 256). From top to bottom: input waveforms containing a voltage sag; magnitudes from the complex subband filters centered at fundamental and the third, fifth, and seventh odd harmonics. The original voltage dip signal is from IEEE project group 1159.2, where the sampling rate is 15,360 Hz (or 256 samples per 60-Hz cycle).
DISCRETE WAVELET TRANSFORMS
The dyadic discrete wavelet transforms (DWTs) [15] also decomposes signals into frequency-dependent components. It is equivalent to applying a set of subband filters with an octave bandwidth relation, however. The DWTs is an excellent tool for automatically detecting multiscale singularities in a signal. This is particularly useful for detecting the triggering points in events. It is worth mentioning that DWTs is not suitable for harmonic related disturbance analysis. Due to the octave bandwidth relation in the wavelet filters, implying more harmonics in a higher frequency band, the number of harmonics in each subband cannot be freely adjusted. Figure 5 shows an example where the outputs of the DWTs are used to detect the starting and ending positions of a voltage dip: the dip starting location is clearly visible in the output of the fourth band, and the dip end location is clearly visible in the third band.
There exist many applications in power engineering that use wavelets [16]. Whether to choose STFT or wavelets is dependent on the applications. For harmonic-based analysis, STFT is more suitable. For detecting triggering points, wavelets are more effective [17], [18].
[FIG5] Example of detecting triggering points from the outputs of multiscale wavelet filters (using Daubechies wavelets = db4 and seven scale levels in Matlab Wavelet Toolbox). From top to bottom: the original signal containing a voltage dip (same as that used in Figure 4) and the outputs from the first five subbands.
OTHER TRANSFORMS
Many other subband filters or transforms are used for signal decomposition. For example, power engineers sometimes use the S-transform [19] for event analysis [20]. The simplest S-transform can be viewed as a two-band filter bank related to Haar wavelet transform, where the two filter outputs are related to the sum and the difference of two neighboring signal samples, respectively. Further study of Cohen’s class of time-frequency distributions [61], where the short-time Fourier transform is a special case of Cohen’s class, is also worthwhile. This class has been applied successfully to transient signal analysis [62].
THIS ARTICLE CREATES AN AWARENESS OF PQ ISSUES IN THE SIGNAL PROCESSING COMMUNITY.
METHODS FOR ANALYZING EVENTS
A common issue in event analysis is the estimation of some quantity of interest. In terms of harmonic and inter-harmonic based distortion analysis, the parameters of interest are the number of dominant harmonics/inter-harmonics, their frequencies and magnitudes, the severity of each distortion component as a function of time, and the starting point as well as the duration of the distortion. This is related to estimating time-dependent frequencies, magnitudes, phases and damping factors, and some index values, such as the total harmonic distortion (THD). In terms of dip and swell events, the parameters of interest could include the beginning and ending time of the event and the percentage of voltage dip or swell during the event. Other relevant parameters, depending on the applications, could include the localization of the distortion sources. Depending on the application, real-time estimation could be required. Issues such as accuracy, complexity, and speed could also be of concern.
TWO BASIC METHODS: TIME-DEPENDENT RMS AND FFT
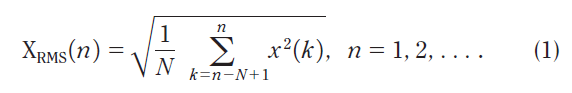
The rms is widely used in applications such as protection, monitoring, event detection, and event classification by power engineers. A time-dependent rms value is computed for each window of voltage/current waveform data x(k),
The window is then shifted forward, and a new computation is repeated. This results in a time-dependent curve, referred to as rms voltage/current. Although an rms curve is very basic and simple, power engineers often use it as a basis of comparison with other methods.
The data window size for computing the rms is usually one or a few cycles of the power system fundamental. It is worth noting that rms voltages over any multiple of a half-cycle window will be the same if the waveform is ideal (i.e., symmetric and strictly periodic). However, in the presence of high distortion, the size of window N significantly affects the resulting rms. This could be misleading if the size of the window is unknown. Figure 6 shows the rms of voltage waveforms using a one-cycle sliding window and a half-cycle sliding window, respectively.
The voltage dip caused by transformer saturation has different rms magnitudes for the two windows. This is due to the variations (increase and decrease) of voltage amplitude within one cycle as the transformer enters and exits the saturation (saturation effects often involve dynamic DC offsets that will result in this kind of impact on the half-cycle rms). The half- cycle rms provides better time resolution and captures the variation in voltage magnitude. Note that the half-cycle window calculation may generate (artificially) deeper dips than the one-cycle rms calculation. Since the one-cycle calculation operates as an averaging filter, the resulting rms voltage is smoother.
FFT is another basic method extensively used by power engineers. For this method, a relatively large window size containing the data of interest is selected, and FFT is then applied to the data. The FFT spectrum is commonly used for detecting dominant harmonics, inter-harmonics, and their related magnitudes. Despite the basic and simple nature of the method, power engineers often use the FFT result as a reference for other methods.
NONPARAMETRIC METHODS: STFT AND SUBBAND FILTERS
Nonparametric methods can be used to estimate the amplitude and the phase of power system fundamental and harmonic/inter-harmonic components. STFT, wavelets, and subband filters have been used for generating time-dependent waveforms of pseudoharmonics [17]. For more efficient design, [21] uses a set of subband filters centered at odd harmonic frequencies, while a set of subband filters centered at even harmonic frequencies is obtained by first inserting the single sideband (SSB) modulation that shifts the frequency by f0 before applying the same set of subband filters. Since the signal components within each band are inseparable, the output is the average of the signal components within the band. The waveform of individual harmonics can be obtained only when the filter bandwidth is sufficiently narrow. However, when choosing the bandwidth, there is a tradeoff between the bandwidth and the time resolution required for the analysis. This is limited by the uncertainty principle, which states that the product of time resolution and frequency resolution remains a constant. For inter-harmonics within the signal bandwidth, the possible number of frequencies is infinite. Therefore, these methods usually cannot be applied to inter-harmonic analysis.
[FIG6] The rms voltage versus times computed from measured voltage waveforms that captured a transformer saturation event from a distribution system. (a) Original voltage waveforms and (b) rms versus time, obtained using a sliding window of one cycle (dashed line) and half a cycle (solid line)
PARAMETRIC METHODS BASED ON DAMPED SINUSOIDAL MODELS AND ESPRIT/MUSIC
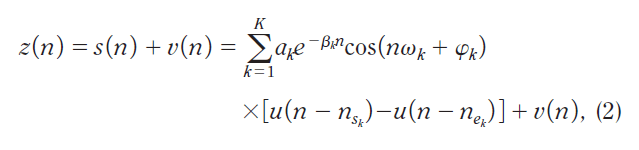
Parametric methods can be used for analyzing both harmonic and inter-harmonic components. Once a good model is found for the signal, a much higher frequency resolution can be achieved compared to nonparametric methods. For harmonic/interharmonic–related analysis, a damped sinusoidal model is suitable for modeling some types of transients and disturbances, especially those involving switching of capacitive elements of the power system (e.g., cables or capacitor banks) or other switching operations that have the same impact on these capacitive elements (e.g., fault clearing). In this model type, a data sequence is regarded as summed damped sinusoids in white noise:
where nsk and nek denote the beginning and the ending time instant of the kth sinusoid, u(n)is the unit step sequence, ak ≥ 0 is the amplitude, ωk is the harmonic frequency in radians, Φk is the initial phase, βk is the damping factor, and v(n) is zero-mean white noise.
Assuming all sinusoids exist within the analysis time window (i.e., nsk = ns, nek = ne), then the step sequence u(•) can be removed from (2), yielding
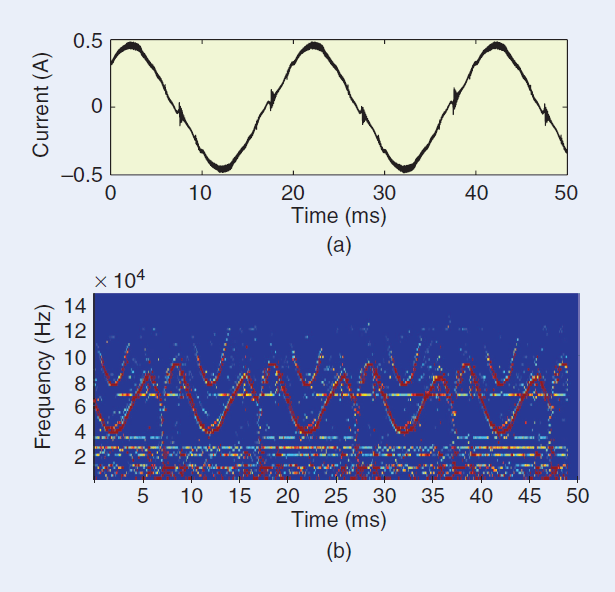
[FIG7] Example of the sliding-window ESPRIT for analyzing time dependent sinusoids. A 200-ms current sequence, with a sampling rate of 1 MHz (20,000 samples per 50-Hz cycle) was obtained from a fluorescent lamp with high-frequency ballast. The interest is the waveform distortion influencing the frequency band above 20 kHz. A high-pass filter of order 500 is applied for prefiltering, with a cutoff frequency of 10 kHz and a transition bandwidth of 10 kHz. (a) The original current sequence (a) and (b) the spectrogram obtained from the sliding-window ESPRIT. The size of the sliding window is 500 samples (0.5 ms) with 20% window overlap, the number of sinusoids is K = 12, and the total dimension of signal and noise subspaces is 200.
In such a case, model parameters can be estimated using ESPRIT or MUSIC [11]: the former is a signal subspace-based method, while the latter is a noise subspace-based method. It is worth mentioning that if this assumption does not hold, using ESPRIT or MUSIC may result in artificial frequency estimates that do not relate to the power disturbance event. For estimating parameters in (3), a two-step process is usually applied: first, the frequencies and damping factors are estimated using ESPRIT or MUSIC. Then, the least squares (LS) method is used to estimate the amplitudes and initial phases of sinusoids. ESPRIT and MUSIC are both suitable for analyzing stationary signals. The advantage of the method is that the frequencies can be located anywhere, including harmonics and inter-harmonics. This is rather useful, especially for analyzing inter-harmonics. Its disadvantage is that the number of sinusoids should be specified in advance before running the algorithm, while in reality this is usually unknown. An application example is using the damped sinusoidal model to analyze transients caused by capacitor switching. ESPRIT is useful in estimating the frequencies of capacitor switching transients [12] under the constraint that all frequency components be included within the analysis window (but the number of frequency components is often unknown before the analysis).
If the data is nonstationary, one may divide the data sequence into overlapping blocks and apply a sliding-window ESPRIT and LS to each block of data before shifting the analysis window forward. In the sliding-window ESPRIT [22], it is more essential to observe the dynamics of sinusoids as a function of time than to observe individual values. Some postprocessing is therefore necessary to trace the frequencies of harmonics and inter-harmonics and to remove spurious frequencies due to the use of a fixed number of prespecified sinusoids. Figure 7 shows an example of a sliding-window ESPRIT applied to a current sequence containing the disturbance from fluorescent lamps [23].
PARAMETRIC METHODS BASED ON STATE-SPACE MODELS AND KALMAN FILTERS
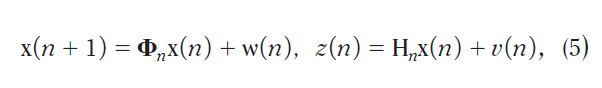
Another model for harmonic/inter-harmonic–related analysis is the use of state-space models and Kalman filters. Kalman filters have been extensively used in power system applications [24]–[27]. If one assumes that the frequencies of harmonics are known, then the task is to estimate the time-dependent signal components (or magnitudes and initial phases) under the sinusoid model
To formulate the state-space model
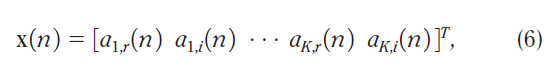
state variables are defined as the real and imaginary part of the sinusoids:
where ak,r(n) = ak (n)cosΦk, ak,i(n) = ak(n)sinΦk are the real and the imaginary parts of the kth signal component, respectively, and are related to the magnitude and the initial phase by
Afterwards, the matrix values in the state and observation equations in (5) can be obtained. For example, assume a signal consists of the fundamental (k = 1) and first few harmonics (k=2…K-1). Further, assuming a constant power system fundamental frequency between two consecutive samples, ω0(n) = ω0 (n+1), we can obtain the matrices in (5) as
where Δt = 1/fs is the sample interval. To avoid model errors affecting the harmonic estimates, a higher model order than the actual number of interest, K, is usually set.
Figure 8 shows an example of the estimated voltage fundamental and the first four harmonics from the Kalman filter. Other examples of parametric methods include the extended Prony’s method for online harmonic content monitoring and disturbance tracking [28]–[30] and the Hilbert transform for estimating the frequencies and other parameters of transients [31]. Some comparisons between the classical methods of harmonic state estimation (e.g., FFT) and other more “advanced” estimation methods (e.g., wavelet transforms, Kalman filters, Prony’s method) [32] have been performed. It has been concluded that due to the inherent assumption in the classical methods that discounts the interharmonics, the nonclassical filtering and signal modeling approaches are more suited for harmonic state estimation and tracking [33]–[35].
PHYSICALLY BASED MODELS FOR DISTURBANCE RECORDINGS
The choice of signal processing methods often requires an understanding of the properties of the system in which the signal originates. This was already mentioned before as an important requirement in the development of characterization and classification methods. In this subsection, three examples will be presented where the choice of transforms is strongly influenced by the understanding of the physical properties of the power system.
[FIG8] Estimated voltage fundamental and harmonics from the Kalman filter, where the model order was set to N = 20. (a) Original waveforms of a disturbance sequence containing transformer saturation. (b) Estimated voltage fundamental in time. (c) Estimated first four harmonics in time.
SYMMETRICAL-COMPONENT TRANSFORMATION AND VOLTAGE DIPS
A characterization method for voltage dips due to faults in three-phase systems was proposed in [2]. This method was based on the way in which dips originate and propagate through the power system. Using this dip classification, a method was developed in [36] to determine the type of dip from the recorded voltage waveforms. The type of dip in turn gives important information about the type of fault (e.g., whether it is a single-phase or two-phase fault). The classification method developed in [36] is based on the so called symmetrical-component transformation. From the three complex voltages in the three-phase system, the positive- sequence, negative-sequence, and zero-sequence voltages are obtained:
where Va = VaejΦa is the complex magnitude for phase a, va(n) √2 Vacos(ω0n+ Φa) is the instantaneous voltage, a = ej2π/3 corresponds to a phase angle shift of 120°, and va(n) = Re{Vaejω0n} is the complex form of va(n) Components in phases b and c are defined in the same way as those in phase a. Further, V0 corresponds to the zero sequence, V1 to the positive sequence, V2 to the negative sequence, and Vi = ViejΦi , i = 0, 1, 2. In physical terms, the positive-sequence voltage is the component used for the energy transfer between generators and consumers; the negative-sequence and zero-sequence components indicate unbalance between the three voltages; and the negative-sequence component propagates all the way from the fault to the equipment terminals, whereas the zero sequence component is in many cases blocked by transformers.
The dip types can be characterized by using the positive sequence voltage V1 and the negative-sequence voltage V2, based on fault modeling in electric power systems. The classification method is one of those discussed in the section below concerned with the classification of events according to their underlying causes.
CLARKE TRANSFORM AND TRANSIENTS
A disadvantage of the symmetrical-component transformation discussed above is that it is based on complex voltages and currents. It is thus not suitable for the analysis of transient disturbances. Instead, the so-called Clarke transform [60] is used for the analysis of transients in three-phase power systems. The Clarke transform relates phase-to-neutral voltages and component voltages through the following matrix expression:
The three components are referred to as the alpha component, beta component, and zero-sequence component. The method in [60] also includes finding the dominant Clarke component. The various signal processing methods (such as event detection, segmentation, and frequency extraction) can then be applied to the dominant Clarke components instead of the phase-to neutral voltages.
HILBERT TRANSFORM AND TRANSIENT MODELING
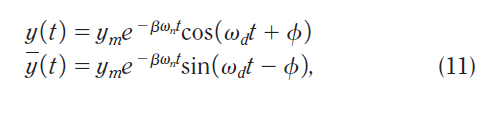
The damping factor and oscillation frequencies of capacitor switching transients are determined by the new natural resonant frequencies in the power system after the capacitor switching event occurs. It is possible to estimate the damping factors and frequencies of a power system distribution capacitor bank switching event by modeling the system as state space equations and subsequently finding the characteristic equation of a second-order system transfer function. For quadratic damping, the decaying transient y(t)and its Hilbert transform are related by
where the decaying magnitude a(t) = yme-βωnt is the envelope of the Hilbert transform [31].
CLASSIFICATION OF EVENTS ACCORDING TO THEIR UNDERLYING CAUSES
The classification of PQ disturbances is not in itself new; both IEEE 1159 and EN 50160 define methods for classification of events into dips, swells, short and long interruptions, under and over-voltages, and transients. The South-African standard NRS 048.2 and [44] further classify voltage dips into events of differing severity. In all cases, very simple classification criteria are utilized that are purely based on residual voltage and the duration of the event. Recent developments of interest are the use of advanced classification methods and classification based on the origins or underlying causes of events. The latter is also referred to as the extraction of additional information from event recordings. Such classifiers may also be used for power system diagnoses and power system protection.
CHOICE OF CLASSES
Numerous papers on automatic classification of voltage disturbances have been published in the last few years. These fall roughly into two groups:
1) Classification of event waveforms, with typical classes including “voltage dips,” “interruptions,” and “transients.” This type of work has its importance for the development of classification tools but has limited practical value, as standard methods are available.
2) Classification of events based on their origins, with typical classes including “faults,” “transformer energizing,” and “capacitor energizing.” This type of work has huge practical value.
DIFFERENT METHODS
The classification methods used and under development can be divided roughly into the following three groups:
■ Visual inspection. Power system experts commonly use this method in practice to classify the origins of disturbances.
■ Rule-based systems. These are often implemented as expert systems that distinguish between different classes of events based on their origins. One example is an expert system for classification of voltage dips and interruptions based on their origins [37]. The system is able to distinguish among nine classes and has been applied to a large set of measured recordings from a medium-voltage distribution system.
■ Statistically based methods. These are based on using various advanced signal processing techniques. Artificial neural networks (ANNs)—often combined with feature extraction from a set of wavelet filters and fuzzy logic for decision making—are the most commonly used methods in the literature. Examples of ANNs include a waveform-based classification system [38] and a system that distinguishes between transformer energizing and motor starting [39]. Another ANN-based system for identifying the origins of events was presented in [40]. More recently, statistical learning theory–based support vector machines have been used in a classification system [41]. The latter two classifiers were tested by using large amounts of measured voltage recordings. Classification systems based on multiple hypothesis tests, customer-oriented approaches, and other hybrid approaches have also been proposed [42]–[45].
EVENTS AND THEIR CLASSIFICATION
The classification of events, as with classification systems in other application areas, includes the basic steps of selecting features and designing the classifier [46]. Roughly speaking, defining features is heavily dependent on the knowledge of power engineering specialists, while extracting features and designing good classifiers mainly require signal processing and pattern recognition expertise.
ADVANCEMENTS IN MEASUREMENT EQUIPMENT AND DATA MANAGEMENT ARE DRAMATICALLY INCREASING THE AVAILABILITY OF TRANSIENT EVENTS FOR ANALYSIS.
SELECTION OF FEATURES
Defining and extracting good features is an essential step towards a successful event classification. This usually requires excellent knowledge of power systems. Features are sometimes extracted without considering the specific nature of power disturbance signals, for instance by 1) using the outputs from transforms and subbands, including DFT, STFT, wavelets, and other time-frequency signal decomposition methods, and 2) using second-order and higher-order statistics such as rms, energy, and cumulants. But without further processing (e.g., using shape of rms, triggering points, or disturbance energy variation in certain frequency ranges), these features offer little potential to ferret out the underlying power system phenomena. We are more interested in selecting features that relate the common physical phenomena in each event type to characteristics in the measured signals. Such an approach includes
■ using features related to the rules (e.g., phenomena related to transformer energizing or capacitor switching and the different shapes of their rms curves) and heuristics based on power specialist experience
■ using physical phenomenon–related features and statistical classification systems
■ using features associated with the parameters in the corresponding signal models (typically, different signal models should be applied to event segments and transition segments).
It should be noted that finding typical features for each specific type of event remains an open research area for electric power engineering.
DIMENSIONALITY OF FEATURE VECTORS
Features selected by power engineering specialists are likely to be partially correlated. Since there are many efficient methods in pattern recognition for decorrelating features and reducing feature dimensions, correlation of initially selected features usually does not impose a problem for the classification system. However, without feature optimization, high dimensionality of feature vectors usually requires more training data and is associated with a more complex classification system. A too high dimensionality could result in “over-fitting” of a classification system if insufficient training data is used, which leads to a poor generalization performance on the test data. The more complex classification system could be linked with a practical implementation problem and prevent possible real-time applications. Great interest and effort have been put into devising powerful pattern recognition techniques. However, these techniques often fail to consider the reduction of complexity and improved performance of the classification system as a whole.
CLASSIFICATION SYSTEMS FOR LOW-, MEDIUM- AND HIGH-VOLTAGE NETWORKS
It is worth mentioning that low-, medium- and high voltage electrical networks present different sets of single and multiple-event disturbances. As a result, the design of classification techniques for each voltage level has to take into account the specific characteristics of these networks. For instance, the sets of disturbances in the high-voltage transmission and low- voltage distribution systems differ considerably.
SINGLE-EVENT AND MULTIPLE-EVENT DISTURBANCES AND SEGMENTATION
Many classification systems developed so far consider disturbance recordings, each containing a single underlying cause (or single-event disturbance). However, multiple-events could be present in a single recording, e.g., a voltage dip followed by tripping of a protective device. For multiple-event disturbances, it is essential that segmentation be applied so that a data sequence can be partitioned into several transition and event segments and each can be analyzed separately [10].
PERFORMANCE OF CLASSIFICATION SYSTEMS
Some classification systems are able to reach an average accurate classification rate of above 95%. It is worth noting that the performance of a classifier is not only related to the classification rate but is also linked with the total number of event types that a system is able to classify and the use of real, measured data or merely of synthetic data. A system tested only on synthetic data has very limited practical use.
IDENTIFICATION OF UNDERLYING CAUSES OF DISTURBANCES
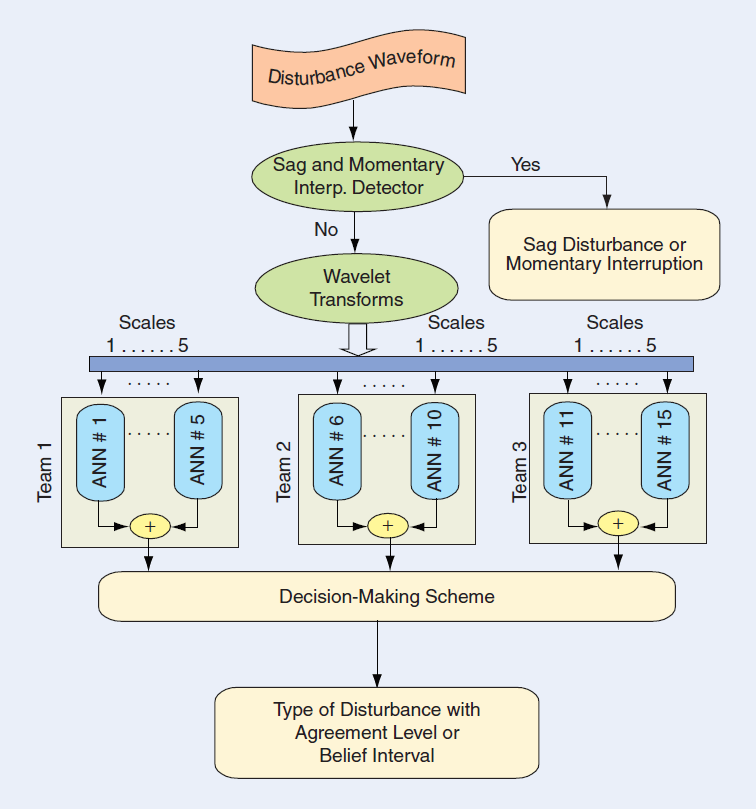
For a given disturbance waveform recording (either the voltage or the current) captured by power system monitoring equipment, it is usually simple and straightforward to find out the corresponding disturbance types, e.g., voltage dips (or sags), swells, interruptions, and transients. The required signal processing is very limited. Also, such analysis is of minor interest to power engineering communities. The main issue of concern is to find the underlying causes of disturbances in the power system. This requires both power system and signal processing knowledge. Such a process, referred to as event-based classification, includes a few basic processing blocks, as shown in Figure 9.
[FIG9] Block diagram of an event-based classification system.
A PHYSICAL UNDERSTANDING OF THE POWER SYSTEM IS IMPORTANT IN THE DEVELOPMENT OF SUITABLE CLASSIFICATION METHODS.
Before sending the signal waveforms to the “segmentation” block, some preprocessing to the signal may be required. The preprocessing is typically done based on requirements by power engineers, for example, removing or reducing the fundamental voltage or current to enhance the signal of interest (i.e., the distortion and disturbance to the fundamental). The segmentation block includes partitioning the data into event segments and transition segments and finding triggering points (the beginning and ending points of an event). Achieving these goals typically requires some signal processing, from simple signal processing to more complex signal decomposition and modeling. The “feature extraction” block is mainly a task for power engineers, where knowledge of power systems is essential for defining good features. For example, good features for distinguishing between a transformer-energizing event and a motor-starting event can be obtained by examining the following power system phenomena: Starting a motor takes the same amount of current from all three phases, which results in the same voltage drop in all three phases. Energizing a transformer, however, causes different saturations in the three phases, which leads to different voltage drops for each phase. Hence, one feature that can be used to differentiate between these two events would be the balancing of three-phase rms voltages. Further, the current waveform is sinusoidal for motor starting but nonsinusoidal for transformer energizing. The latter implies more harmonic distortions in both the current and the voltage. Another feature would thus be the harmonic distortions in rms voltages or currents. The “classification” block (or classification of the underlying causes of disturbances) mainly requires signal processing knowledge. This may include selecting the type of classifiers and designing a classifier capable of yielding good generalization performance for a test data set, adding newly learned event types, and producing a high confidence level for the classification according to the requirements specified by power engineering experts. The purpose of classifiers is to interpret causes, origins, and locations; to diagnose; or to gain more knowledge about unknown types of disturbances. All these stages require the use of effective signal processing methods.
CLASSIFICATION OF UNDERLYING CAUSES OF DISTURBANCES: DETERMINISTIC VERSUS STATISTICAL APPROACHES
Designing a proper classification system is usually considered a signal processing task. Therefore, we shall only briefly describe a few typical approaches and trends currently studied for classification of power disturbances through examples. It should be emphasized that these examples are far from complete and the aim is to facilitate further research.
RULE-BASED EXPERT SYSTEMS FOR CLASSIFICATION
An expert system utilizes deterministic approaches for classification. The heart of an expert system is a set of rules, where the “real intelligence” from human experts of power systems is translated into the “artificial intelligence” in computers. The performance of classification is therefore heavily dependent on the selected rules (often, a set of if-then rules) and the inference engine that performs the reasoning of rules. It is also important to include a knowledge base editor so that these rules are updated or checked.
The advantage of expert systems is that they do not require training data for the classifier as they use rules made by human experts. Therefore, if one has very limited training data available, an expert system is clearly a good choice. The main disadvantage of expert systems is that they usually require a set of fixed value thresholds to make a binary (i.e., yes or no) decision after applying the rules.
As an example, an expert system [37] was used to classify events according to nine underlying causes (energizing, nonfault interruption, fault interruption, transformer saturation due to fault, induction motor starting, step change, transformer saturation followed by protection operation, single-stage dip due to fault, and multistage dip due to fault) of voltage disturbances obtained from the measurements of a medium-voltage distribution system. Figure 10 shows the tree-structured inference process used for classifying the underlying causes. The expert system has yielded a classification rate of approximately 97% from a total of 962 measured disturbance recordings. A separate investigation has found that the same expert system using features and rules extracted from the time-dependent rms curves can handle many event types with similar classification performance [47].
[FIG10] A tree-structured inference process for classifying the underlying causes of power system disturbances.
THE MAIN ISSUES OF CONCERN ARE TO FIND THE UNDERLYING CAUSES OF DISTURBANCES IN THE POWER SYSTEM
ANN-BASED CLASSIFICATION
ANNs have been an important tool and the most frequently studied method so far for the statistically based classification of power system disturbances. Classification using ANNs has been shown to be a good alternative when a sufficient amount of training data is available. Interest in ANNs for PQ and power systems applications arises from the following theoretical aspects [48]:
■ ANNs are data-driven, self-adaptive methods that can adjust themselves to the data without any explicit specification of the functional or distributional form for the underlying models.
■ ANNs approximate any function with any required accuracy after sufficient training. Since any classification procedure seeks a functional relationship between the group membership and the attributes of the signal, accurate identification of this underlying function is clearly important.
■ ANNs are associated with nonlinear mappings; this makes them flexible in modeling complex real-world relationships.
■ANNs are able to estimate posterior probabilities, which provide the basis for establishing classification rules and performing statistical analysis.
The disadvantages of ANN classifiers include the lack of underlying mathematical models and interpretations, difficulty in determining the optimal number of neurons and layers, the uncertainty as to whether the system converges after a certain training period, and whether the classifier is over-fitted to the training data. Despite these setbacks, ANN-based classifiers can perform satisfactorily with “proper” training.
A good example of such a classifier is a wavelet-based ANN classification system, as shown in Figure 11 [40]. In this system, each disturbance recording is first fed into a set of subband filters using wavelets with five scales. This results in a set of time-dependent signal components. The scheme is then carried out in the wavelet domain using a set of subneural networks for classifying six disturbance types, including low-frequency capacitor switching, high-frequency capacitor switching, ideal voltage fundamental sinusoid waveform, impulse transient, voltage dip, and short interruption. The outcomes of the networks are then integrated using a decision-making scheme such as a simple voting scheme or the Dempster-Shafer theory of evidence. With such a configuration, the classifier is also capable of providing a degree of belief for the identified disturbances. The total number of recordings used for system training and testing is 1,199. The classification rate is 92.3% for the first four types of disturbances, where 10.8% of recordings are rejected as ambiguous, and 98.5% for the last two types of disturbances.
[FIG11] Block diagram of the wavelet-based neural classifier that includes the sag and momentary detector.
MORE TECHNIQUES NEED TO BE DEVELOPED FOR DETECTION AND ANALYSIS OF NONQUASI-STATIONARY SIGNALS
SUPPORT VECTOR MACHINE–BASED CLASSIFICATION
A support vector machine (SVM) classifier is another statistically based approach, with statistical learning theory as its mathematical foundation. SVM classifiers are increasingly popular in many application areas. An SVM classifier first maps the input space (either spanned by signals or by features of signals) nonlinearly into a high-dimensional feature space, where the classes are more likely to be linearly separable. An SVM classifier minimizes the generalization errors on the test set instead of the training set. Further, the classification error is linked with the complexity of the classifier (controlled by the Vapnik- Chervonenkis theory and the structural risk minimization principle), which a designer can choose [49]–[51]. Designing an SVM classifier can be formulated mathematically as solving a constrained optimization problem. The solution can be obtained from solving a convex quadratic programming problem [52]. One important feature of SVMs is the utilization of kernel functions (to satisfy Mercer’s condition [53]), so that only inner products of feature vectors are used. Most applications choose to use the existing set of kernel functions, since finding new and best kernel functions for SVMs is a nontrivial task. Conceptually, finding the best classifier can be considered as maximizing the margins to the separating hyperplanes of classes (or maximizing the shortest distance between the separating hyperplane using the support vectors from the related training classes).
The advantages of SVM classifiers include, among others, being able to control the complexity of classifiers, a theoretically guaranteed upper bound for classification error, storing only a small percentage of feature vectors (i.e., support vectors) instead of entire feature vectors from the training set, and automatically determining the parameters through training. When one has a large amount of disturbance recordings, an SVM classifier is an excellent choice.
A simple example is an SVM classification system that contains several sub-SVMs [41]. Only five different types of three-phase voltage dips are classified: dips caused by single phase-to-ground fault, phase-to-phase fault, three-phase fault, double phase-to-ground fault, and transformer saturation. Simple features are used. For each three-phase data recording, a feature vector of size 72 is used (24 feature components per phase). For each phase, the feature components include 20 rms values by equal distance sampling, starting from the triggering point of the disturbance; the magnitudes of the second, fifth, and ninth harmonics; and the total harmonic distortion with respect to the power system fundamental. Since dips due to faults have a rectangular rms shape, the number of synchronized drops in the three-phase rms can be used to classify the fault type from among the four different types of faults given above. Further, dips caused by faults and by transformer energizing can be distinguished by examining whether the rms voltage has a gradual (i.e., nonrectangularly shaped) recovery or a fast (i.e., rectangularly shaped) recovery. The former is caused by the transform saturation and the latter by the fault. Using the second harmonic as a feature is motivated by the fact that relatively high even harmonics (especially the second) are produced as the transformer enters and exits saturation. Further, two odd harmonic magnitudes (the fifth and ninth) are used to indicate the disturbance in the low- and high-frequency bands. The classifier has a tree structure (as shown in Figure 12) consisting of several sub-SVM classifiers. This is determined according to the number of transition segments in each recording (from the segmentation procedure). The system has yielded an average classification rate of 96%. More interestingly, the system is able to maintain a similar classification performance when using training data and test data from two different types of power networks from two different European countries.
Although SVM-based classification has been shown to be promising, more studies should be conducted. For example, it would be interesting to extend such a classification system so that it could accommodate a large number of classes (i.e., underlying disturbance cause types). Further, evaluating the performance (e.g., the generalization error, complexity, false alarm rate, number of support vectors, and effective kernel functions) and adding confidence indicators to the classification results of such a large classification system would be important. It would also be interesting to compare SVM-based and ANN-based classification systems.
[FIG12] A tree-structured SVM classifier, containing multiple SVM subclassifiers, is used for the classification of the underlying causes of disturbances. N 5 5 was used in this system.
FURTHER RESEARCH AND POTENTIAL APPLICATIONS FOR POWER ENGINEERING AND SIGNAL PROCESSING
As mentioned before, the objective of this article is not to present signal processing or artificial intelligence techniques, it is to describe some potential applications and current developments as well as the challenges involved in the application of signal processing to power system disturbances. Signal processing techniques turn raw PQ measurements into a much more valuable commodity: information that can help us to understand and relate the disturbances and power system/ load problems. This may lead to the diagnosis and mitigation of PQ problems.
SIGNAL PROCESSING FOR ONLINE PQ MONITORING
As utilities and industrial customers have expanded their PQ monitoring systems, the data management, analysis, and interpretation functions have become the most significant challenges in the overall PQ monitoring effort [54]. There are two basic streams in PQ data analysis: offline and online analysis. Offline analyses, described in the previous sections, are mainly suitable for system performance evaluation, problem characterization, and system diagnosis and maintenance where rapid analysis and dissemination of analysis results are not required. For online analysis, results are helpful when actions must be taken immediately (e.g., determining fault locations from voltage and current waveforms). Online analysis is also useful in limiting large amounts of data transfers over limited communication channels. For instance, online analysis within a substation can result in significant savings in data transfers by identifying disturbance causes that warrant actual transfer of data to a central system. For other causes, a summary of the event characteristics may be sufficient. Some examples of the signal processing involved in online analysis are the following:
■ Analysis of rms variations, including tabulations of voltage dips and swells, magnitude-duration curves or scatter plots, and computation of rms-related indices. Signal processing techniques can be used to quantify voltage dip and swell performance (e.g., duration and depth). Furthermore, signal processing techniques in conjunction with the load equipment models can be used to predict the impact of voltage dips on sensitive equipment.
■ Analysis of steady-state conditions, which includes trends of rms voltages and currents, negative- and zero-sequence unbalances, real and reactive power, and harmonic distortion levels and individual harmonic components. Statistics, such as minimum, maximum, average, standard deviation, count, and cumulative probability levels can be temporally aggregated and dynamically filtered. Using such steady-state data, statistical signal processing can be used to predict the performance or the health of voltage regulators on distribution circuits.
■ Analysis of harmonics, where users can calculate voltage and current harmonic spectra, perform statistical analysis of various harmonic indices, and monitor trending over time. Such analyses can be very useful in identifying excessive harmonic distortions on power systems as a function of system characteristics (resonance conditions) and load characteristics.
■ Analysis of transients, which includes statistical analysis of maximum voltage, transient durations, and transient frequencies. Such results can reveal switching problems with equipment such as capacitor banks.
■Correlation of PQ levels or energy use with other important parameters (e.g., relating voltage dip performance and lightning flash density).
■ Equipment performance as a function of PQ levels (equipment sensitivity reports).
Online (or nearly real-time) PQ data assessment results are available immediately for rapid dissemination. Users can then take immediate actions upon receiving the notifications. An excellent example of online analysis is locating a fault on a distribution circuit. Signal processing techniques would be used to extract and analyze voltage and current waveforms. The analysis would reveal the fault location, and this information would then be disseminated quickly to the line crew [55]–[57].
POTENTIAL APPLICATIONS
Some future signal processing applications from the power engineering point of view are listed next.
INDUSTRIAL PQ MONITORING APPLICATIONS
■ Energy and demand profiling, with identification of opportunities for energy savings and demand reduction.
■ Harmonic evaluations to identify transformer loading concerns, sources of harmonics, problems indicating misoperation of equipment (such as converters), and resonance concerns associated with power factor correction.
■ Unbalance voltage profiling to identify impacts on three phase motor heating and loss of life.
■ Voltage dip impact evaluation to identify sensitive equipment and possible opportunities for process ride-through improvement.
■ Power factor correction evaluation to identify proper operation of capacitor banks, switching concerns, and resonance issues and to optimize performance in order to minimize electric bills.
■ Motor-starting evaluation to identify switching problems and monitor inrush current and protection device operation.
■ Profiling of voltage variations (flicker) to identify load switching and load performance problems.
■ Short-circuit protection evaluation to evaluate proper operation of protective devices based on short-circuit current characteristics, time-current curves, and so forth.
POWER SYSTEM PERFORMANCE ASSESSMENT AND BENCHMARKING
■ Trending and analysis of steady-state PQ parameters (voltage regulation, unbalance, flicker, harmonics) for performance trends, correlation with system conditions (capacitor banks, generation, loading, and so on), and identification of conditions that need attention.
■ Evaluation of steady-state PQ with respect to national and international standards. Most of these standards involve specification of PQ performance requirements in terms of statistical PQ characteristics.
■ Voltage dip characterization and assessment to identify the cause of dips (transmission or distribution) and to characterize the events for classification and analysis (including aggregation of multiple events and identification of subevents for analysis with respect to protective device operations).
■ Capacitor switching characterization to identify the source of the transient (up-line or down-line), locate the capacitor bank, and characterize the events for database management and analysis.
■ Performance index calculation and reporting for system benchmarking purposes and for prioritization of system maintenance and improving investments.
■ Locating faults. This is one of the most important benefits of monitoring systems. It can dramatically improve response times for repairing circuits and also identify problem conditions related to multiple faults over time in the same location.
■ Capacitor bank performance assessment. Smart applications can identify fuse blowing, can failures, switch problems (restrikes and reignitions), and resonance concerns.
■Voltage regulator performance assessment to identify unusual operations, arcing problems, regulation problems, and so forth. This can be accomplished with trending and associated analysis of unbalance, voltage profiles, and voltage variations.
■Distributed generator performance assessment. Smart systems should identify interconnection issues, such as protective device coordination problems, harmonic injection concerns, islanding problems, and so forth.
■ Incipient fault identification. Research has shown that cable faults and arrester faults are often preceded by current discharges that occur weeks before the actual failure. This is an ideal expert system application for the monitoring system.
■ Transformer loading assessment. This can evaluate transformer loss-of-life issues related to loading and can also include harmonic loading impacts in the calculations.
■ Feeder breaker performance assessment to identify coordination problems, proper operation for short circuit conditions, nuisance tripping, and so forth.
FUTURE DIRECTIONS
PQ monitoring is rapidly becoming an integral part of general distribution system monitoring, as well as an important customer service. Electric power utilities are integrating PQ and energy management monitoring, evaluation of protective device operation, and distribution automation functions. PQ information should ideally be available throughout the company via an intranet and should be made available to customers for evaluation of facility power-conditioning requirements.
PQ information should be analyzed and summarized in a form that can be used to prioritize system expenditures and to help customers understand the system’s performance. Therefore, PQ indices should be based on customer equipment sensitivity. The system average rms variation frequency index (SARFI) indices for voltage dips are excellent examples of this concept.
PQ encompasses a wide range of conditions and disturbances. Therefore, the requirements for the monitoring system can be quite substantial. Table 1 summarizes the basic requirements as a function of the different types of PQ variations [5].
The information from PQ monitoring systems can help improve the efficiency of operating the system and the reliability of customer operations. These are benefits that cannot be ignored. The capabilities and applications for PQ monitors are continually evolving.
[TABLE 1] SUMMARY OF MONITORING REQUIREMENTS FOR DIFFERENT TYPES OF PQ VARIATIONS.
THE OBJECTIVE OF THIS ARTICLE IS TO DESCRIBE SOME POTENTIAL APPLICATIONS AND CURRENT DEVELOPMENTS AS WELL AS THE CHALLENGES INVOLVED IN THE APPLICATION OF SIGNAL PROCESSING TO POWER SYSTEM DISTURBANCES.
FURTHER SIGNAL PROCESSING CHALLENGES AND REQUIREMENTS
Some signal processing issues require further research. These include:
■ Event-based classification systems. Further research on efficient and fast classification systems with the aim of finding underlying causes of disturbances is needed. This has a large application potential, for diagnosis and even for protection applications if real-time processing can be achieved.
■ Transient analysis . Research is needed in model-based transient analysis and in finding the underlying causes of transients. Currently only a few types of transients have been modeled under some constraints.
■ Modeling and understanding the spectra of disturbance recordings in the high-frequency range, e.g., the high-frequency content as it relates to the underlying causes events and the noise related to the measuring environment.
■ Fault locations. From the measurements, finding the locations where particular faults originated. This should also include self-clearing faults that can be more difficult to locate due to high impedance and/or arcing characteristics.
■ Determining the source of quasi-stationary voltage variations (flicker) based on characteristics of the voltage variations and characteristics of customer load variations or other parameters that may correlate with the voltage variations [57]–[59].
■ Modeling three-phase unbalanced disturbances.
■ Analysis of harmonic distortion signals to determine the source of the harmonics in complex networks that can magnify and modify the harmonic content.
CONCLUSIONS
This article presents some of the challenges in applying signal processing techniques to PQ disturbance recordings. Our main emphasis is on the automatic analysis of PQ events. The distinction between the quasi-stationary and the non-quasi-stationary part of PQ signals was used as the basis for discussion. Many techniques are currently available for the analysis of quasi-stationary PQ signals, whereas more techniques need to be developed for detection and analysis of nonquasi-stationary signals.
Several methods for analysis of quasi-stationary signals were discussed. Those methods may be applied to quasi-stationary segments of PQ events but also to PQ variations.
Automatic classification of PQ events requires employing various signal processing methods. Such classification methods should be aimed at extracting the information related to the underlying phenomena in the power system that resulted in these PQ disturbances. We also show that a physical understanding of the power system is important in the development of suitable classification methods.
Although the main emphasis of the article is on PQ events, they are not the only possible signal processing application of interest to the power engineering community. We therefore give an extensive list of other issues for which advanced signal processing tools may provide solutions.
The exciting new applications and challenges of signal processing for PQ analysis, highlighted here, should help to further bridge the gap between the power engineering and signal processing communities.
REFERENCES
[1] R. C. Dugan, M. F. McGranaghan, S. Santoso, and H. W. Beaty, Electrical Power Systems Quality, 2nd ed. New York: McGraw-Hill, 2003. [2] M. H. J. Bollen, Understanding Power Quality Problems: Voltage Sags and Interruptions. Piscataway, NJ: IEEE Press, 2000. [3] I. Y. H. Gu and E. Styvaktakis, “Bridge the gap: signal processing for power quality applications,” Elect. Power Syst. Res. J., vol. 66, no. 1, pp. 83–96, 2003. [4] M. H. J. Bollen, I. Y. H. Gu, P. G. V. Axelberg, and E. Styvaktakis, “Classification of underlying causes of power quality disturbances using deterministic and statistical signal processing methods,” EURASIP J. Adv. Signal Process. (Special Issue on Emerging Signal Processing Techniques for Power Quality Applications), 2007. [5] M. F. McGranaghan and S. Santoso, “Challenges and trends in analyses of electric power quality measurement data,” EURASIP J. Adv. Signal Process. (Special Issue on Emerging Signal Processing Techniques for Power Quality Applications), 2007. [6] M. H. J. Bollen and I. Y. H. Gu, Signal Processing of Power Quality Disturbances. Hoboken, NJ: Wiley–IEEE Press, 2006. [7] Power Quality Measurement Methods, IEC 61000-4-30, IEC, 2003. [8] Flickermeter—Functional and Design Specifications, IEC 61000-4-15, 1997. [9] EN 50160, Voltage Characteristics of Electricity Supplied by Public Distribution Networks, CENELEC, Brussels, Belgium, 1999. [10] E.Styvaktakis, Automating Power Quality Analysis, Ph.D. dissertation, Dept. of Signals and Systems, Chalmers Univ. Technology, Gothenburg, Sweden, 2002. [11] M. H. Hayes, Statistical Digital Signal Processing and Modeling. New York: Wiley, 1996. [12] M. H. J. Bollen, E. Styvaktakis, and I. Y. H. Gu, “Categorization and analysis of power system transients,” IEEE Trans. Power Deliv., vol. 20, no. 3, pp. 2298–2306, 2005. [13] Signal Processing TOOLBOX for Use with MATLAB. The MATH WORKS Inc., Natick, MA, 2005. [14] A. V. Oppenheim and R. W. Schafer, Digital Signal Processing. Englewood Cliffs, NJ: Prentice-Hall, 1974. [15] S. Mallat, A Wavelet Tour of Signal Processing, 2nd ed. New York: Academic, 1999. [16] S. Chen and H. Y. Zhu, “Wavelet transform for processing power quality disturbances,” EURASIP J. Adv. Signal Process (Special Issue on Emerging Signal Processing Techniques for Power Quality Applications), 2007. [17] S. Santoso, W. M. Grady, E. J. Powers, J. Lamoree, and S. C. Bhatt, “Characterization of distribution power quality events with Fourier and wavelet transforms,” IEEE Trans. Power Deliv., vol. 15, no. 1, pp. 247–254, 2000. [18] Y. H. Gu and M. H. J. Bollen, “Time-frequency and time-scale domain analysis of voltage disturbances,” IEEE Trans. Power Deliv., vol. 15, no. 4, pp.1279–1284, 2000. [19] R. G. Stockwell, L. Mansinha, and R. P. Lowe, “Localization of the complex spectrum: The S transform,” IEEE Trans. Signal Process., vol. 44, no. 4, pp. 998–1001, 1996. [20] P. K. Dash, B. K. Panigrahi, D. K. Sahoo, and G. Panda, “Power quality disturbance data compression, detection, and classification using integrated spline wavelet and S-transform,” IEEE Trans. Power Deliv., vol. 18, no. 2, pp. 595–600, 2003. [21] C. Duque, P. M.Silveira, T. Baldwin, and P. F. Ribeiro, “Novel method for tracking time-varying power harmonic distortions without frequency spillover,” in Proc. IEEE Power Engineering Soc. General Meeting, July, 2008, pp. 1–6. [22] I. Y. H. Gu and M. H. J. Bollen, “Estimating interharmonics by using sliding window ESPRIT,” IEEE Trans. Power Deliv., vol. 23 , no. 1, pp. 13–23, 2008. [23] E. O. A. Larsson, C. M. Lundmark, and M. H. J. Bollen, “Distortion of fluorescent lamps in the frequency range 2–150 kHz,” in Proc. IEEE Int. Conf. Harmonics and Quality of Power, Cascais, Portugal, Oct. 2006, pp. 1–6. [24] H. Ma and A. A. Girgis, “Identification and tracking of harmonic sources in a power system using a Kalman filter,” IEEE Trans. Power Deliv., vol. 11, no. 3, pp. 1659–1665, 1996. [25] V. M. M. Saizm and J. B. Guadalupe, “Application of Kalman filtering for continuous real time tracking of power system harmonics,” Proc. Inst. Elect. Eng. Gener. Transmission Distrib., vol. 144, no. 1, pp. 13–20, 1997. [26] K. K. C. Yu, N. R. Watson, and J. Arrillaga, “An adaptive Kalman filter for dynamic harmonic state estimation and harmonic injection tracking,” IEEE Trans. Power Deliv., vol. 20, no. 2, pp. 1577–1584, 2005. [27] J. A. Macias and A. Gomez, “Self-tuning of Kalman filters for harmonic computation,” IEEE Trans. Power Deliv., vol. 21, no. 1, pp. 501–503, 2006. [28] Z. Hu, J. Guo, M. Yu, Z. Du, and C. Wang, “The studies on power system harmonic analysis based on extended Prony method,” in Proc. Int. Conf. Power System Technology, Oct. 2006, pp. 1–8. [29] S. R. Naidu, F. F. Costa, “A novel technique for estimating harmonic and inter-harmonic frequencies in power system signals,” in Proc. 2005 European Conf. Circuit Theory and Design, 2005, vol. 3, pp. 461–464. [30] A. Bracale, G. Carpinelli, D. Lauria, Z. Leonowicz, T. Lobos, and J. Rezmer, “On some spectrum estimation methods for analysis of nonstationary signals in power systems. Part I. Theoretical aspects,” in Proc. 11th Int. Conf. Harmonics and Quality of Power, Sept. 2004, pp. 266–271. [31] K. Hur, S. Santoso, and I. Y. H. Gu, “On empirical estimation of utility distribution damping parameters using power quality waveform data,” EURASIP J. Adv. Signal Process. (Special Issue on Emerging Power Quality Applications), 2007. [32] E. A. Feilat, “Detection of voltage envelope using Prony analysis-Hilbert transform method,” IEEE Trans. Power Deliv., vol. 21, no. 4, pp. 2091–2093, 2006. [33] I. Kamwa, R. Grondin, and D. McNabb, “On-line tracking of changing harmonics in stressed power systems: Application to Hydro-Quebec network,” IEEE Trans. Power Deliv., vol. 11, no. 4, pp. 2020–2027, 1996. [34] T. Lobos, J. Rezmer, and H.-J. Koglin, “Analysis of power system transients using wavelets and Prony method,” in Proc. IEEE Porto Power Tech. Conf., Sept. 2001, vol. 4. [35] M. Meunier and F. Brouaye, “Fourier transform, wavelets, Prony analysis: tools for harmonics and quality of power,” in Proc. 8th Int. Conf. Harmonics and Quality of Power, Oct. 1998, vol. 1, pp. 71–76. [36] L. Zhang and M. H. J. Bollen, “Characterization of voltage dips in power systems,” IEEE Trans. Power Deliv., vol. 15, no. 2, pp. 827–832, 2000. [37] E. Styvaktakis, M. H. J. Bollen, and I. Y. H. Gu, “Expert system for classification and analysis of power system events,” IEEE Trans. Power Deliv., vol. 17, no.2, pp. 423–428, 2002.[38] Z.-L. Gaing, “Wavelet-based neural network for power quality disturbance recognition and classification,” IEEE Trans. Power Deliv., vol. 19, no. 4, pp. 1560–1568, 2004. [39] T. X. Zhu, S. K. Tso, and K. L. Lo, “Wavelet-based fuzzy reasoning approach to power-quality disturbance recognition,” IEEE Trans. Power Deliv., vol. 19, no.4, pp. 1928–1935, 2004. [40] S. Santoso, E. J. Powers, W. M. Grady, and A. C. Parsons, “Power quality disturbance waveform recognition using wavelet-based neural classifier,” IEEE Trans. Power Deliv., vol. 15, no. 1, pp. 222–235, 2000. [41] P. G. V. Axelberg, I. Y. H. Gu, and M. H. J. Bollen, “Support vector machine for classification of voltage disturbances,” IEEE Trans. Power Deliv., vol. 22, no. 3, pp. 1297–1303, 2007. [42] C. A. Duque, M. V. Ribeiro, F. R. Ramos, and J. Szczupak, “Power quality event detection based on the divide and conquer principle and innovation concept,” IEEE Trans. Power Deliv., vol. 20, no. 4, pp. 2361–2369, 2005. [43] I. Y. H. Gu, N. Ernberg, E. Styvaktakis, and M. H. J. Bollen, “Statistical-based sequential method for fast online detection of fault-induced voltage dips,” IEEE Trans. Power Deliv., vol. 19, no. 2, pp. 497–504, 2004. [44] J. F. L. van Casteren, J. F. G. Cobben, J. H. R. Enslin, W. T. J. Hulshorst, W. L. Kling, and M. D. Hamoen, “A customer oriented approach to the classification of voltage dips,” in Proc. CIRED Conf., 2005. [45] J. Barros and E. Perez, “Automatic detection and analysis of voltage events in power systems,” IEEE Trans. Instrum. Measure., vol. 55, no. 5, pp. 1487–1493, 2006. [46] R. O. Duda, P. E. Hart, and D. G. Stork, Pattern Classification, 2nd ed. New York: Wiley, 2001. [47] E. Styvaktakis, M. H. J. Bollen, and I. Y. H. Gu, ‘Automatic classification of power system events using rms voltage measurements,” in Proc. IEEE Power Eng. Soc. Summer Meeting, vol. 2, Chicago, IL, July 2002, pp. 824–829. [48] W. R. A. Ibrahim and M. M. Morcos, “Artificial intelligence and advanced mathematical tools for power quality applications: A survey,” IEEE Trans. Power Deliv., vol. 17, no. 2, pp. 668–673, 2002. [49] J. Shawe-Taylor and N. Cristianini, Kernel Methods for Pattern Analysis. Cambridge, U.K.: Cambridge Univ. Press, 2004. [50] C. J. C. Burges, “A tutorial on support vector machines for pattern recognition,” Data Mining Knowl. Discovery, vol. 2, pp. 121–167, 1998. [51] K. R. Muller, S. Mika, G. Rätsch, K. Tsuda, and B. Schölkopf, “An introduction to kernel-based learning algorithms,” IEEE Trans. Neural Netw., vol. 12, no. 2, pp. 181–202, 2001. [52] D. P. Bertsekas, Nonlinear Programming. Belmont, MA: Athena Scientific, 1995. [53] J. Shawe-Taylor and N. Cristianini, Kernel Methods for Pattern Analysis. Cambridge, U.K.: Cambridge Univ. Press, 2004. [54] A. M. Gargoom, N. Ertugrul, and W. L. Soong, “A comparative study on effective signal processing tools for power quality monitoring,” in Proc. 2005 European Conf. Power Electronics and Applications, Sept. 2005. [55] S. Santoso, R. C. Dugan, J. Lamoree, and A. Sundaram, “Distance estimation technique for single line-to-ground faults in a radial distribution system,” in Proc. IEEE Power Engineering Society Winter Meeting, 2000, vol. 4, pp. 2551–2555. [56] E. Styvaktakis, M. H. J. Bollen, and I. Y. H. Gu, “A fault location technique using high frequency fault clearing transients,” IEEE Power Eng. Rev., vol. 19, no. 5, pp. 58–60, 1999. [57] P. G. V. Axelberg, M. H. J. Bollen, and I. Y. H. Gu, “Trace of flicker sources by using the quantity of flicker power,” IEEE Trans. Power Deliv., vol. 23, no. 1, pp. 465–471, Jan. 2008. [58] A. A. Girgis, J. W. Stephens, and E. B. Makram, “Measurement and prediction of voltage flicker magnitude and frequency,” IEEE Trans. Power Deliv., vol. 10, no. 3, pp. 1600–1605, 1995. [59] T. K. Abdel-Galil, E. F. El-Saadany, and M. M. A. Salama, “Online tracking of voltage flicker utilizing energy operator and Hilbert transform,” IEEE Trans. Power Deliv., vol. 19, no. 2, pp.861–867, 2004. [60] M. H. J. Bollen and I. Y. H. Gu, On the analysis of voltage and current transients in three-phase power systems, IEEE Trans. Power Deliv., vol. 22, no. 2, pp. 1194–1201, Apr. 2007. [61] L. Cohen, Time-Frequency Analysis. Englewood Cliffs, NJ: Prentice-Hall, 1995. [62] Y.-J. Shin, E. J. Powers, M. Grady, and A. Arapostathis, “Power quality indices for transient disturbances,” IEEE Trans. Power Deliv., vol. 21, no. 1, pp. 253–261, Jan. 2006.
AUTHORS
1Math H.J. Bollen (math.bollen@ieee.org) is a manager for power quality and EMC with STRI AB, Sweden, and guest professor at EMC-on-Site, Luleå University of Technology, Skellefteå, Sweden. He received the M.S and Ph.D. degrees from Eindhoven University of Technology, The Netherlands, in 1985 and 1989, respectively. Before joining STRI AB in 2003 he was post-doc at Eindhoven University of Technology, Eindhoven, The Netherlands; lecturer at the University of Manchester Institute of Science and Technology, United Kingdom; and professor in electric power systems at Chalmers University of Technology, Gothenburg, Sweden. His research experience covers power quality, reliability, and other aspects of power system design and operation. He has written several fundamental papers and two textbooks on power quality. He is a Fellow of the IEEE.
2Irene Y.H. Gu (irenegu@chalmers.se) received the Ph.D. degree from Eindhoven University of Technology, The Netherlands, in 1992. She was a research fellow at Philips Research Institute IPO, The Netherlands, and Staffordshire University, United Kingdom, and a lecturer at the University of Birmingham in the U.K. from 1992 to 1996. Since 1996, she has been with the Department of Signals and Systems, Chalmers University of Technology, Sweden, where she has been professor of signal processing since 2004. Her current research interests include signal processing of power system disturbances, signal and image processing theories and applications, and machine vision. She is a Senior Member of the IEEE.
3Surya Santoso (ssantoso@mail.utexas.edu) received the M.S.E. and Ph.D. degrees in electrical and computer engineering from the University of Texas at Austin in 1994 and 1996, respectively. He rejoined the University of Texas at Austin as an assistant professor in 2003. Prior to joining the university, he was a consulting engineer with Electrotek Concepts Inc., Knoxville, Tennessee, for seven years. His primary research interests include the development of intelligent systems for analyzing raw PQ measurement data, power system modeling and studies, and wind power. He coauthored the book Electric Power Systems Quality. He is a Senior Member of the IEEE.
4Mark F. MacGranaghan (mmcgranaghan@epri.com) received the B.S.E.E. and M.S.E.E. degrees from the University of Toledo, Ohio and the M.B.A. degree from the University of Pittsburgh, Pennsylvania. Currently, he is vice president of consulting services at EPRI PEAC, Knoxville, Tennessee. He is coauthor of the book Electrical Power Systems Quality. He has been influential in developing IEEE and international standards for harmonic limits on power systems and within facilities. He helped to achieve coordination between the IEEE and IEC in a wide range of PQ standards development activities. He has taught seminars and workshops on PQ issues and power system analysis to electric utility engineers from around the world. He is a Member of the IEEE.
5Peter A. Crossley (p.crossley@manchester.ac.uk) received the B.S. degree from the University of Manchester Institute of Science and Technology and the Ph.D. degree from the University of Cambridge, both in the United Kingdom, in 1977 and 1983, respectively. Currently, he is professor of power systems at the University of Manchester. He was involved in the design and application of digital protection relays and systems for 25 years, first with GEC in the U.K. and then with ALS TOM Protection and Control, Staf ford, U.K., the University of Manchester Institute of Science and Technology, and the Queen’s University of Belfast, U.K. He is a Member of the IEEE.
6Moisés V. Ribeiro (moviribeiro@yahoo.com.br) received the M.S. and Ph.D. degrees in electrical engineering from the University of Campinas, Brazil, in 2001 and 2005, respectively. He was a visiting researcher at University of California, Santa Barbara, in 2004 and post-doc and visiting professor at Federal University of Juiz de Fora, Brazil, in 2005 and 2006, respectively. He is currently an assistant professor at Federal University of Juiz de Fora. His research interests include computational intelligence, digital and adaptive signal processing, power quality, power line communication, sensor networks, and digital communications. He is a Member of the IEEE.
7Paulo F. Ribeiro (pribeiro@calvin.edu) received the B.S. degree in electrical engineering from the Federal University of Pernambuco, Brazil, completed the electric power systems engineering courses with Power Technologies Inc. He received the Ph.D. degree from the University of Manchester, United Kingdom. Currently, he is a professor of engineering at Calvin College, Grand Rapids, Michigan. He is active in IEEE and IEC working groups on power quality. His research interests include power electronics, power quality, system modeling and simulation, and signal processing applied to power systems. He is a Fellow of the IEEE.
All System Earthing Arrangements (SEA) provide equivalent protection of life and property. However each has certain advantages and inconveniences in other terms that may be important for a given installation.
In both commercial and industrial applications, needs change, and it is becoming increasingly important to choose the right system earthing arrangement, according to rigorously defined working practices, in order to ensure the cohabitation of “high and low currents” and satisfy the operator’s requirements.
Following a review of the risks related to installation insulation faults affecting the safety of persons and equipment, this Technical Guide describes the three types of system earthing defined by standards IEC 60364 and NF C 15.100. Each system earthing arrangement is examined in terms of safety and availability, as well as for its protection against overvoltages and electromagnetic disturbances.
Changing Needs
Today, the three system earthing arrangements, defined by standards IEC 60364 and NF C 15.100, are:
the TN system
the TT system
the IT system.
All three systems have the same final purpose as regards protection of persons and equipment: control of insulation fault effects. They are considered as equivalent with respect to the protection of persons against indirect contact. The same is not necessarily true for the dependability of the LV electrical installation regarding:
availability of the electrical power supply
maintenance of the installation.
These calculable parameters are becoming increasingly important in industrial and commercial premises.
Causes of Insulation Faults
In order to ensure protection of persons and continuity of operation, the conductive wires and live parts of an electrical installation are “insulated” from the earthed exposed conductive parts.
Insulation involves:
separation by insulating materials
separation by linear clearances in gases
(e.g. in air) or by creepage distances along insulators (e.g. to prevent flashover on electrical switchgear).
Insulation is characterised by specific voltages which, in accordance with standards, apply to new products and equipment: insulation voltage (highest voltage on system) lightning impulse withstand voltage (1.2/50 μs impulse wave) power frequency withstand voltage (2U + 1000 V/1 min).
Example for an LV switchboard of the Prisma type:
insulation voltage: 1000 V
impulse voltage: 12 kV.
When commissioning a new installation, produced in accordance with standard working practices with products manufactured as per standards, the risk of an insulation fault is extremely low. However, this risk increases with time. This is because the installation is subjected to a variety of aggressions which are responsible for insulation faults. Below are a few examples:
during installation:
mechanical deterioration of a cable insulator
during operation:
dust with a varying degree of conductivity
the thermal ageing of insulators due to excessive temperature caused by:
the climate
too many cables in a duct
an insufficiently ventilated cubicle
harmonics
overcurrents…
the electrodynamic forces developed during a short-circuit which may damage a cable or reduce a clearance
switching and lightning surges
50 Hz voltage surges caused by MV earth faults and affecting LV equipment.
Normally, it is a combination of these primary causes which results in an insulation fault.
This fault can be either:
a differential mode fault (between the live conductors) in which case it becomes a short-circuit
or a common mode fault (between live conductors and the exposed conductive parts or earth). A fault current, referred to as a common mode or zero-sequence fault (MV), then flows in the protection conductor (PE) and/or in the earth.
System earthing arrangements in LV are mainly concerned by common mode faults which occur most frequently in loads and cables.
Risks Linked to the Insulation Fault
Whatever its cause, an insulation fault is a risk to life property and the availability of electrical power: all this comes under the heading of dependability.
Risk of electric shock
A person (or animal) subjected to an electrical voltage, is electrified.
Current
Effects on the human body
1A
Cardiac arrest
75mA
Irreversible cardiac fibrillation threshold
30mA
Respiratory paralysis threshold
10mA
Muscular contraction (tetanisation)
0.5mA
Very slight sensation
The effects of alternating (50 to 60 Hz) current on the human body
Protection of persons against the dangerous effects of electrical current takes top priority; the risk of electric shock must therefore be taken into account before the rest.
Risk of fire
Should this risk materialise, it can have serious consequences for persons and equipment. Many fires are caused by an excessive temperature rise at a specific time or an electrical arc generated by an insulation fault.
The higher the fault current, the greater the risk. This risk also depends on the degree of the fire or explosion risk on the premises.
Risk of unavailability of electrical power
Control of this risk is becoming increasingly important. This is because if the faulty part is automatically disconnected in order to eliminate the fault, the results are:
a risk for people, for example:
sudden loss of lighting
shutdown of vital equipment
an economic risk due to production loss. This risk must particularly be controlled in process industries for which restarting can be long and costly.
Moreover, if the fault current is high:
the damage, in the installation or the loads, can be serious and increase repair costs and time
the circulation of high fault currents in the common mode (between the system and earth) can also disturb sensitive devices, particularly if they are part of a “low current” system which is geographically spread out with galvanic links.
Finally, on de-energisation, the appearance of overvoltages and/or electromagnetic radiation phenomena can cause malfunctioning or even deterioration of sensitive equipment.
A Few Reminders
Terminology
In this chapter the electric shock and electrocution risks are specified for the various system earthing arrangements, as defined by the International Electrotechnical Committee in standard IEC 60364.
The system earthing arrangement in LV characterises the earthing of the secondary of the HV/LV transformer and the earthing of the exposed conductive parts of the installation. Identification of the types of system earthing arrangements is thus defined by 2 letters:
the first letter for connection of the transformer neutral (2 possibilities):
T for “earthed”
I for “unearthed” (or “isolated”)
the second letter for the type of connection of the exposed conductive parts of the installation (2 possibilities):
T for “directly” earthed
N for “connected to earthed neutral” at the origin of the installation.
The combination of these two letters gives three possible configurations:
Transformer neutral
Exposed conductive parts
If T
T or N
If I
T
i.e. TT, TN and IT.
Terminology (cont.)
(1) ECP: exposed conductive part.
Note 1: The TN system, according to IEC 60364 and standard NF C 15-100, has several sub-systems:
TN-C: if the N neutral and PE conductors are combined (PEN)
TN-S: if the N neutral and PE conductors are separate
TN-C-S: use of a TN-S downstream of a TN-C (the opposite is forbidden).
Note that the TN-S is compulsory for systems with conductors of a cross-section y 10 mm2 Cu.
Note 2: Each system earthing arrangement can be applied to an entire LV electrical installation. However, several arrangements can jointly exist in the same installation.
Example of a simplified earth leakage current (Id) calculation
TT In the presence of an insulation fault, the fault current Id is limited for the most part by the earthing resistances (if the earthing connections for the exposed conductive parts and for the neutral are not combined). This fault current induces a fault voltage in the load earthing resistances. Since the earthing resistances are normally low and of the same order of magnitude (≅10Ω), this voltage of around Uo/2 is dangerous. The part of the installation concerned by the fault must therefore be automatically disconnected by an RCD.
TN In the presence of an insulation fault, the fault current Id is only limited by the impedance of the fault loop cables. For 230/400 V systems, this voltage of the order of Uo/2 (if RPE = Rph) is dangerous as it is greater than the limit safety voltage, even in dry environments (UL = 50V). The installation or part of the installation must then be immediately and automatically de-energised by an RCD. As the insulation fault is similar to a phase-to-neutral short-circuit, breaking is performed by the overcurrent protection devices.
IT Behaviour on the 1st fault
Since the neutral is unearthed, there is no flow of a fault current Id. Voltage is not dangerous, and the installation can therefore be kept in operation
As the IMD (Insulation Monitoring Device) has detected this 1st fault, it must be located and eliminated before a 2nd fault occurs.
Behaviour on the 2nd fault
The fault concerns the same live conductor: nothing happens and operation can continue
The fault concerns two different live conductors. The double fault is a short-circuit (as in TN). Breaking is performed by the overcurrent protection devices.
TT This system sustains the “earth fault” … but limits the consequences by implementing residual current devices which detect the earth fault before it becomes a short-circuit. This is the principle of the TT “directly earthed neutral” systems which allow the addition of extra outgoers by simply combining them with an RCD.
It is the safety champion!
In this case, as for short-circuits, the only contribution that can be made to availability is to enhance discrimination by installing several stages of earth leakage protection in order to reduce breaking to the smallest part of the system.
Note that RCDs are: v built into or added to the circuit breaker and switch with the 0.5 to more than 100 A Multi 9 range
built into the circuit breaker with the 100 to 630 A Vigi module
built into the circuit breaker with the insulation monitoring module
with separate toroid with the 100 to 6300 A Vigirex devices which indicate absence of auxiliary supply source without causing tripping (avoids resets), and also warn the user of the insulation drop without causing tripping, by means of an early warning contact which is activated at half of the displayed threshold. For example: set at 300 mA, it warns the user at 150 mA.
TN When a fault occurs, this system causes tripping of the SCPD (short-circuit protective device) to provide protection. This fault is similar to a short-circuit (very low fault loop impedance) and is thus violent and destructive. The circuit breaker therefore trips on the 1st fault.
This is the principle of the TN systems with exposed conductive parts connected to the neutral earthing point and which do not require additional protection devices such as RCDs or IMDs. It is thus the installation economy champion! This principle quickly becomes costly in the event of modifications or extensions, and is hard on installations due to short-circuit effects on cables and loads, as well as voltage drops which can disturb computers, MN undervoltage releases, motors, …
In order to limit the consequences of the fault to the part of the system concerned, current, time and energy discrimination methods must be implemented.
When the fault loop impedance is poorly controlled, it may be necessary to add additional protection of the residual current type. The NEC (National Electrical Code) requires earth-fault protection of TN-S systems by GFP (ground fault protection) devices or low-sensitivity RCDs. Moreover, the use of medium-sensitivity RCDs (300 mA) can also reduce the risk of fire by eliminating stray currents.
An extensive choice of 1P/3P/4P circuit breakers provides a perfect solution from 1 to more than 6300 A with the following ranges:
Multi 9
Compact
Masterpact
IT This system renders the fault inoffensive. It consists of attacking the cause rather than the effect by limiting the fault current to a few mA. In an IT unearthed neutral or impedant neutral system, as the fault is not dangerous, there is no need to trip and operation can continue.
It is the electrical power availability champion!
However, leaving an earth fault on such a system would mean leaving a direct link between the system and the earth, as before. In this case, the appearance of a 2nd fault creates a dangerous current which must cause tripping of the same kind as in the TT and TN system earthing arrangements.
For this reason, this type of unearthed neutral system is only advantageous if real insulation faults are detected as soon as they appear by the Vigilohm System range which automatically and immediately detects faults on outgoers, including transient faults (which users particularly dread). This is the function of the XM200 IMD with the XD301 detectors (1 outgoer) or XD312 detectors (12 outgoers) combined with closed A toroids.
In order to meet the needs of sites with the most exacting availability requirements, Schneider Electric offers products designed to measure resistance and capacitance outgoer by outgoer.
These products communicate this information locally and via the supervision system, and make it possible to implement preventive maintenance so as never to be subjected to the earth fault. These protection devices are: XM300C, XD308C, XL308, XL316, and the local XAS, XL1200, XL1300, XTU300 interfaces according to the installation configuration.
Switchgear
System Earthing Arrangement Choice Criteria
Their performance is evaluated according to the five criteria listed below:
protection against electrical shocks
protection against electrical fires
continuity of supply
overvoltage protection
protection against electromagnetic
disturbances.
A summary of the properties of each system earthing arrangement results in the following technical comparison.
Protection against electrical shocks
All the system earthing arrangements guarantee equal protection against electrical shocks provided that they are implemented and used according to standards.
Protection against the risk of electrical fires.
In the TT and IT system earthing arrangements, when the first insulation fault occurs, the current generated by this fault is low or very low respectively, and the risk of fire is slight. On the other hand:
in the event of a full fault, the current generated by the insulation fault is high in the TN type system earthing arrangements, and the resulting damage is serious.
in the event of an impedant fault, the TN system earthing arrangements implemented without residual current devices do not provide sufficient protection, and use of the TN-S system earthing arrangement combined with residual current devices is recommended.
in normal operation, the TN-C system earthing arrangement presents a higher risk of fire than the others.
This is because the load unbalance current permanently flows through not only the PEN conductor but also the devices connected to it: metal frameworks, exposed conductive parts, shieldings, etc.
When a short-circuit occurs, the energy lost in these stray trajectories considerably increases. For this reason the TN-C system earthing arrangement is forbidden on premises where there is a risk of fire or explosion.
Continuity of supply
Choice of the IT system earthing arrangement avoids all the harmful consequences of the insulation fault:
the voltage sag
the disturbing effects of the fault current
damage to equipment
opening of the faulty outgoer.
If this system earthing arrangement is used correctly, the second fault is highly unlikely.
Note: it is always a combination of measures that helps ensure continuity of supply: dual power supply sources, UPS, discrimination of protection devices, IT system earthing arrangement, maintenance department, etc.
Overvoltage Protection
Protection may be necessary in all system earthing arrangements. Choice of the right protection must take site exposure and the type and activity of the establishment into account. It is then necessary to determine the number and quality of necessary equipotential zones in order to implement the protection devices required (surge arresters, etc.) on the lines of the various incoming and outgoing electrical systems.
Remarks:
the IT system earthing arrangement more often requires the use of surge arresters
no system earthing arrangement completely does away with these measures
in the IT system earthing arrangement, protection against overvoltages due to MV faults must be provided by a surge limiter.
Protection Against Electromagnetic Disturbances
Any system earthing arrangement can be chosen:
for all differential mode disturbances
for all disturbances (common or differential mode) with a frequency greater than a MHz.
The TT, TN-S and IT system earthing arrangements can thus satisfy all electromagnetic compatibility criteria. However, it should be noted that the TN-S system generates more disturbances during the insulation fault, as the fault current is higher.
On the other hand, the TN-C and TN-C-S system earthing arrangements are not recommended, as in these systems a permanent current due to load unbalance flows through the PEN conductor, the exposed conductive parts and the cable shieldings. This permanent current creates disturbing voltage drops between the exposed conductive parts of the sensitive equipment connected to the PEN. The presence of 3rd order multiple harmonics has considerably amplified this current in modern installations.
(1) In the event of an insulation fault. (2) All electromagnetic disturbances: • external: faults on HV distribution system, switching surges, lightning surges, etc. • internal: insulation fault currents, harmonics in LV installations.
Choice of System Earthing Arrangement and Conclusion
The common aim of the three system earthing arrangements internationally used and standardised by the IEC 60364 is maximum dependability.
As regards protection of persons, all 3 system earthing arrangements are equivalent provided that all installation and operating rules are complied with.
Given the specific characteristics of each system earthing arrangement, it is impossible to make a choice without considering installation and operating needs.
This choice must be the result of joint deliberation between the user and the system designer (electrical consultants, contractor, …) on:
the installation characteristics
operating conditions and requirements.
It is pointless trying to operate an unearthed neutral system in part of an installation which, by its very nature, has a low insulation level (a few thousand ohms): old and extended installations, installations with external lines…
Likewise, it would be a contradiction in industry where continuity of supply and productivity are essential and fire risks high, to choose a multiple earthed neutral system.
How to Choose the Right System Earthing Arrangement
First and foremost, do not forget that all three system earthing arrangements can exist side by side in the same electrical installation. This is a guarantee that the best solution for safety and availability needs will be found for every case.
You must then ensure that the choice of system earthing arrangement is not recommended or imposed by standards or legislation (decrees, ministerial orders).
You then need to dialogue with the user in order to identify his needs and means:
need for continuity of supply
whether or not there is a maintenance department
risk of fire.
Generally speaking:
continuity of supply and a maintenance department: the solution is an IT system
continuity of supply and no maintenance department: there is no completely satisfactory solution: prefer a TT system for which discrimination on tripping is easier to implement and which minimises damage compared with a TN system.
Extensions are easy (no calculations)
continuity of supply is not essential and there is a competent maintenance department: prefer a TN-S system (rapid repairs and extension according to rules)
continuity of supply is not essential and there is no maintenance department: prefer a TT system
risk of fire: IT if there is a maintenance department, and use a 0.5 A RCD, or TT
Take the special features of the system and loads into account:
very extensive system or with a high leakage current: prefer TN-S
use of replacement or standby power supplies: prefer TT
loads sensitive to high fault currents (motors): prefer TT or IT systems
loads with low natural insulation (furnaces) or with a large HF filter (large computers): prefer a TN-S system
supply of control and monitoring systems: prefer an IT (continuity of supply) or TT system (enhanced equipotentiality of communicating devices).
Conclusion
Using only one system earthing arrangement is not always the best choice. In many cases it is thus preferable to implement several system earthing arrangements in the same installation.
As a rule, a “radial” installation, with careful identification of priority loads and use of standby sources or uninterruptible power supplies, is preferable to a tree-structured monolithic installation.
We hope this technical guide has furthered your knowledge of system earthing arrangements and that it will enable you to optimise the dependability of your installations.
Interharmonics are frequency components at noninteger harmonics of the line frequency. The proliferation of large DC-converter variable speed drives and wind/solar inverter generation has led to an increase in interharmonic levels. Troubleshooting the resulting problems requires measurements and terminology that go beyond “simple” harmonics. This whitepaper covers the definitions and meaning behind the terminology for interharmonics, as defined by the IEC 61000-4-7 standard.
DEFINITION
By definition, if each cycle of a distorted waveform is identical, then there can be only integer harmonics of the fundamental frequency present. To be identical every cycle, each frequency component must go through an integer multiple of repetitions in a single cycle; otherwise, there would be a fractional bit left over at the end of a cycle, and the succeeding cycle would be different.
Unfortunately, many loads are not simple nonlinear systems, and frequency components that are not multiples of the line frequency may be present. There are several mechanisms that can cause this:
1.Direct injection of non-synchronous signals – e.g. power line carrier or mains signaling systems, where the injected voltage or current isn’t related to the 60Hz line frequency
2.Mechanical vibration of large motors, pumps, etc., where the vibration is translated electrically as a variation in load current or back EMF. If the motor is a VFD which already has harmonics, mechanical vibration can modulate each harmonic, resulting in interharmonics around each harmonic.
3.Beating and other interference effects from an AC->DC->AC system, or where two different AC systems are combined. Again, VFDs are a culprit , where the DC bus voltage is converted to a varying motor drive frequency. Interties to inverter-based generation from solar or wind farms can also be a source of interharmonics.
4.Non-synchronous loads such as arc welders where the instantaneous impedance is time varying in ways unrelated to the driving AC voltage.
To characterize this wide set of possibilities, IEC 61000-4-7 defines a standard method of measuring the frequency spectrum of the voltage and current signals. The spectrum is divided in to 5 Hz bands, and the magnitude of each component is computed over a 12 cycle sampling window (60Hz / 5Hz = 12. Any frequency that’s a multiple of 5Hz will have an integer number of period in a 12 cycle window). Thus, every block of 12 cycles is decomposed into a summation of sine waves with frequencies at 60Hz, 65Hz, 70Hz, 75Hz, etc. up until the highest frequency measured (3115 Hz with most recorders that measure to the 51st harmonic). Every 12th frequency is a multiple of 60Hz, and is technically not an interharmonic– 120Hz, 180Hz, etc. are the 2nd, 3rd, etc. harmonics.
Figure 1. Powerline carrier meter reading system operates at 555Hz and 585Hz– right at two interharmonic frequencies (highlighted in red).
If there are no interharmonics present in the waveform, each of the 12 cycles will be identical, and only the fundamental and possibly the harmonics will be nonzero. If interharmonics are caused by injection of power line carrier signals or other narrowband sources, only the interharmonics at those frequencies will be non-zero. For example, a popular powerline carrier meter reading system operates at 555Hz and 585Hz (between the 9th and 10th harmonics), right at two interharmonic frequencies. They are clearly visible in the interharmonic graph of Figure 1 (highlighted in red), and are much lower in amplitude than the 9th or 11th harmonics, but higher than any interharmonics between those harmonics.
IEC 61000-4-7 defines the raw interharmonics as the frequency components every 5Hz, excepting the integer multiples of 60Hz (which are harmonics, not interharmonics). It goes further to define harmonic and interharmonic groups and subgroups. These are combinations of harmonics and interharmonics. Groups are used to aggregate harmonics and interharmonics to avoid recording hundreds of separate frequencies when not needed, and subgroups are used as refined aggregations.
Figure 2. Groups and subgroups
HARMONIC GROUPS
A harmonic group is a combination of a specific harmonic and the surrounding interharmonics. There is a harmonic group for each harmonic. In Figure 2, the harmonic group for the 4th harmonic (240Hz) is shown. The 6 interharmonics to the left and 6 interharmonics to the right of 240Hz are combined with the harmonic itself with an RMS summation. This gives an aggregate RMS value for all components in that 60Hz-wide band centered around the 4th harmonic. (Technically, the outermost interharmonics – 210Hz and 270Hz in this case, are divided in half before summing, to avoid double-counting them with adjacent harmonic groups.) The harmonic group value represents the total signal in that entire region, and corresponds to the “regular” harmonic value for a system that computes harmonics with just a single cycle of the waveform (e.g. ProVision when it performs a harmonic analysis on a selected cycle of waveform capture data).
Harmonic groups provide a well-defined means for measuring frequency content with 60Hz resolution when finer detail isn’t needed. If no interharmonics are recorded, it’s better to use harmonic groups vs. raw 5Hz-wide harmonics, to avoid missing content outside the harmonic bands. If the interharmonics are low, then the harmonic group values will be the same as the raw harmonic values.
INTERHARMONIC GROUPS
An interharmonic group is a combination of all interharmonic values between two specific harmonics. The top right of Figure 2 shows the interharmonic group between the 4th and 5th harmonic. The RMS sum of all 11 interharmonics gives the interharmonic group value. Interharmonic groups are normally referenced by the harmonic to the “left” in the spectrum, so this would be the 4th interharmonic group.
Interharmonic groups are useful for recordings where interharmonics are suspected, but it’s not practical to record every possible 5Hz band. By using interharmonic groups, only 51 values are recorded for each channel instead of 51×12 = 612 values. Often the specific interharmonic frequency isn’t important (or isn’t even constant), so 5Hz resolution may not be needed. The key factor is that the harmonic spectral lines are excluded from the group, so the reading is only from interharmonic energy.
HARMONIC SUBGROUPS
Harmonic subgroups are formed by taking the RMS sum of a harmonic and the adjacent interharmonics. In Figure 2, the 4th harmonic subgroup is shown as the combination of the 235Hz, 240Hz, and 245Hz components. Harmonic subgroups are useful when the interharmonic cause is a modulation of the main current waveform. For example, a large VFD may produce harmonics due to rectification of the input voltage to a DC bus. If the motor load were constant, only harmonics would likely be present. Vibration due to mechanical imbalance can cause variations in the load current, and in the time domain this causes successive cycles of the current waveform to differ. In the frequency domain, the harmonic values are modulated, or “smeared” into wider bands. In cases like this, the two interharmonics on either side of the main harmonic are closely related to the physical phenomenon causing the harmonic, and they can be considered sidebands of the harmonic rather than separate signals. This gives a 15Hz wide harmonic band.
Harmonic subgroups are often used in place of the raw narrow-band harmonics when a distinction between harmonic and interharmonic values are needed, but the 5Hz spacing is too narrow to properly measure the true harmonic values. If there’s no need to separate out the interharmonics, then full harmonic groups could be used instead of subgroups – they include a full 60Hz wide band, vs. the 15Hz harmonic group band.
INTERHAMRONICS SUBGROUPS
Finally interharmonic subgroups are defined as the RMS sum of the 9 interharmonics between to specific harmonics, not including the two interharmonics immediately adjacent to the harmonics. Figure 2 shows the interharmonic subgroup for the 4th harmonic – it skips 245Hz, and includes 250Hz through 290Hz, skipping 295Hz. The interharmonic subgroup is the complement to the harmonic subgroup – it includes only those interharmonics not present in the harmonic subgroup. If the harmonics are modulated or spread into a band wider than 5Hz, and interharmonic aggregations are needed, use interharmonic subgroups instead of full interharmonic groups. Doing so avoids counting what’s really a harmonic value into the interharmonic group.
RECORDING INTERHARMONICS
There’s usually no need to record interharmonic and harmonic groups and subgroups at the same time. In theory every individual 5Hz interharmonic and harmonic can be recorded, and all groupings could be made later, but recording over 600 values per channel often isn’t practical. In order of increasing detail (and higher memory usage), here’s a suggested progression for recording setup:
1.THD only – provides no breakdown on harmonic content, but can reveal if distortion may be a problem
2.Harmonic groups – 60Hz-spaced bands, useful for determining spectrum of distortion, no distinction between harmonics and interharmonics.
3.Harmonic subgroups + interharmonic subgroups (or harmonics plus interharmonic groups) – provides detail on harmonic vs. interharmonic sources
4.Raw harmonics + interharmonics – full 5Hz resolution throughout band of interest – provides maximum detail, but uses the most memory. If the region of interest has been narrowed down (e.g. between 3rd and 7th harmonics), memory requirements are lessened.
CONCLUSION
IEC 61000-4-7 defines a method for calculating harmonics and interharmonics based on a 12 cycle window, and then further defines several aggregations of those values. The groups are used to consolidate harmonics back into 60Hz wide bands, and interharmonics into 55 Hz wide bands without any finer detail, for rough characterizations. The subgroups are used to provide a wider band for harmonics, accounting for modulation due to load and system variations, and to avoid including harmonic sidelobes into interharmonic data. An understanding of these groupings is important for maximizing recorder memory, and avoiding having too much detail to analyze.
Interest in complete overcurrent device selectivity has increased due to the addition of selectivity requirements to articles 700, 701, and 708 of the National Electrical Code (NFPA70). Many users, both commercial and industrial, use fuses and circuit breakers simultaneously. Traditional Time- Current Curve (TCC) analysis is known to not fully communicate fuse selectivity; hence fuse manufacturers publish device ratio guidelines for selection of fuse type and sizes. Recent publications of selectivity tables by circuit manufacturers also demonstrate that traditional TCCs are often insufficient to fully communicate circuit breaker selectivity. Traditional TCCs can lead to incorrect conclusions regarding circuit breaker fuse selectivity, indicating more or less selectivity than may be possible. The authors will describe various methods for assessment of selectivity in systems using both fuses and circuit breakers together, with either device on the line side. The methods will demonstrate that selectivity above what TCCs demonstrate may be possible if devices are selected correctly, and that traditional TCC analysis, can also incorrectly demonstrate more selectivity than a more thorough analysis would predict. The methods lend themselves to analysis that a power system engineer can perform with published information or information that may be requested from manufacturers.
Total Selectivity in Mixed Circuit Breaker and Fuse Systems
In 2005 the NFPA added the following requirement to article 700.27, Emergency Systems, of NFPA 70-National Electrical Code (NEC): “Emergency system(s) overcurrent devices shall be selectively coordinated with all supply-side overcurrent protective devices.” The same requirement was added in the 2005 edition to article 701.18, Legally Mandated Standby Systems and in 2008 to the new article 708.54, Coordination. Though local and state jurisdictions are interpreting these requirements differently, many of the interpretations require that substantial portions of the power distribution system provide complete selectivity up to calculated bolted fault values for both utility and emergency generations sources. Similar requirements have existed previously in NEC article 620.62.
Traditional power distribution system design often ignored selective performance to such high levels of fault current due to considerations of safety, equipment, or conductor protection and the real or perceived difficulty in achieving such high levels of selective behavior. However, the stricter interpretations of the new NEC requirements do not allow for these considerations. Also, in many industrial and critical commercial systems it is not unusual for designers to desire and design for higher levels of selectivity. The more common solutions for complete selectivity are fully fused systems where circuit sizes and fuse types are selected to maximize selectivity, and the use of low-voltage power circuit breakers without instantaneous protection in low- voltage switchgear to achieve better selectivity at the main equipment level. Neither of these solutions may yield the most size- or cost-efficient initial-cost solution nor the best solution from a safety and maintenance perspective, but they may be the only perceived solution for a user designing for maximum selectivity. Furthermore, over the years many existing facilities have accumulated a variety of device types. Increasing interest in arc-flash protection may drive facility engineers to closely scrutinize the protection and selectivity achieved by their existing distribution systems in order to achieve maximum possible protection at the least sacrifice to system reliability.
Conventional Selectivity Assessment Using Time-Current Curves and Fuse Ratios
Traditional assessment of selectivity is based on the use of time-current curve (TCC) overlays. These have proven to be a useful tool to evaluate selectivity over the long-time and short- time operating ranges of the various types of overcurrent devices. For circuit breakers, the curves are also used to document the operation of overcurrent devices in the instantaneous range. However, when overcurrent devices operate faster than about one cycle, the TCC is a limited tool for accurately predicting device behavior. In systems where at least one device can operate in less than one cycle or the devices interact with each other, the RMS-drawn TCC may not be an accurate representation of device performance. When there is device interaction, a time-current curve that predicts how one device operates in isolation may no longer describe how the device operates as part of a system. This is one reason why TCCs are not usually drawn below 0.01 seconds and why coordination studies often reflect the peak or RMS equivalent of the fully asymmetric peak current on the time-current curve.
Molded-case circuit breakers usually are drawn showing instantaneous clearing times of 1.5 cycles or less. Over much of the instantaneous range these devices may be significantly faster than 1.5 cycles and may exhibit current-limiting behavior even if not marked as UL 489 current-limiting circuit breakers. Furthermore, though the TCC may be labeled in RMS amperes, the circuit breaker’s instantaneous trip system may be sensitive to peak amperes. That implies that faults of equal RMS value but different power factors or closing angles will be sensed by the circuit breaker trip system differently. Fuses are energy- based devices and hence they may also be affected by fault current asymmetry.
It is important to understand whether time-coordination studies are designed to determine selectivity or nonselectivity. Protective devices should reliably be as or more selective than indicated by analysis. However, a determination of lack of selectivity need not be as reliable. In other words, devices that seem not to be selective by analysis may be selective under some circumstances, but devices determined to be selective by the same analysis should be reliably selective under all reasonably expected conditions.
Fuse Operation
The UL 248-1 definition of current-limiting fuse is, “A fuse that, within a specified overcurrent range, limits the clearing time at rated voltage to an interval equal to or less than the first major or symmetrical current loop duration; and limits the peak current to a value less than the available peak current.” UL 248, Low Voltage Fuses, defines fuse performance by class including the maximum allowable peak let-through current (Ip), maximum allowable clearing I2t, and the maximum allowable threshold ratio. Threshold current is defined by UL 248 as “The lowest prospective RMS symmetrical current above which a fuse is current limiting.” UL 248 defines threshold ratio as “The threshold current divided by the fuse current rating. ”
Fuses are thermal energy–sensitive devices. If the fuse element reaches its design melting temperature, it will melt. For each fuse design, there is a minimum melting energy that is determined by the element material (typically copper or silver) and by the minimum element cross-section. I2t is a measure of thermal energy under fault conditions represented by equation (1) and defined in section V. Figure 1.1-18 depicts a current-limiting fuse element.
Fig. 1.1-18 Fuse elements.
Fuse minimum melting energy is valid for very short events in the range of 1ms or less, when there is minimal heat loss to the surrounding environment. The higher the available fault current, the faster the fuse element will melt. At lower available fault currents, more time is required to melt the element and hence more energy is required, due to the loss of some heat to the environment surrounding the notch area.
Fuse clearing I2t is equal to melting I2t plus arcing I2t. Fuse arcing I2t is dependent upon numerous external factors, including the instantaneous voltage during the time of arcing, the instantaneous current at the initiation of the arc, and the x/r ratio of the circuit. The type of fault is also a factor, as it will determine the number of fuses clearing the fault. For example, a single fuse clears a line-to-neutral fault, two fuses operating simultaneously clear a line-to-line fault. Under the latter conditions the two fuses share the line-to-line voltage and will yield a lower arcing I2t than if a single fuse were clearing the fault at line-to-line voltage.
Some fuse manufacturers may publish I t melting data. However, that data may not be optimized for use in selectivity analysis. If the melting data are used to determine whether a downstream device will allow enough energy for the upstream fuse to melt, it is important that the melting data furnished be a minimum level, not an average or maximum level. If published data are to be used for selectivity analysis, it is important to know if the data are minimum, maximum, or average for the parameter considered. In time-current curves, tolerance in time and current are demonstrated by the band’s width. When the time-current curve is shown as a line, it must be labeled as either a maximum or minimum characteristic. Other data, such as let-through tables or melt-energy tables, may not clearly identify whether the data are average, minimum, or maximum. All analyses must take tolerance into account.
Fuse Peak Let-Through Current
The di/dt at the initiation of the fault is the primary external factor determining the peak let-through current, Ip, passed by the fuse. Higher di/dt will result in higher peak current let-through. The maximum possible fuse Ip occurs at the maximum prospective fault current. Fuse Ip graphs are readily available from fuse manufacturers. Figure 1.1-19 represents the Ip of a 100 A Class J fuse (AJT100). The uppermost diagonal line, labeled as 2.3x RMS, represents the peak available current, assuming a power factor of 15%. The red line represents the maximum Ip of the AJT100 fuse.
Fig. 1.1-19. Fuse peak let-through.
Assessing selectivity, or the lack of it, between upstream and downstream fuses is common in the industry today. Time- current curves are compared to determine selectivity for events lasting longer than 0.01 s. If a separation is maintained between the total clearing curve of the downstream fuse and the minimum melting curve for the upstream fuse, the fuses are presumed to be selective.
As noted earlier, fuses are capable of melting and clearing in less than one-half cycle; i.e., less than 0.0083s at 60 Hz. Fuse melting and clearing I2t values must be compared to assess selectivity for fuses operating in their current-limiting range. The total I2t of the downstream fuse must be less than the melting I2t of the upstream fuse for selectivity for events lasting less than 0.01s. Fuse manufacturers provide guidelines documenting the minimum ratio in terms of fuse ampere rating that must be maintained between upstream and downstream fuses to assure selectivity under all overcurrent conditions.
Circuit Breakers
Two different types of physical mechanisms may cause current-limiting behavior in circuit breakers. The more limited behavior in most molded-case circuit breakers not designed to optimize current-limiting behavior derives from traditional contact arm construction. Magnetic repulsion forces are created at the point where the contacts touch due to the constriction of current. The constriction is caused by the contact material’s inherent roughness, which leads to conduction at only a few spots on the contact’s surface. As the current flows toward those spots on both contact surfaces, repulsive forces are created across the contacts. Mechanism spring forces should keep the contacts closed for currents within the circuit breaker’s operating range. At currents above the circuit breaker’s maximum instantaneous pickup, the repulsive forces may start to overcome the spring forces and the contacts may part temporarily, causing an arc voltage to develop. This action is called contact popping. The popping will have a current- and energy-limiting effect prior to the contact’s being driven to full opening by the magnetic or electronic unlatching mechanism. Popping does not normally cause contacts to latch open and is power factor and closing angle dependent, so the limitation caused by the popping is not normally shown on circuit breaker let-through curves or time- current curves.
A second design common in circuit breakers specifically designed to be current limiting is the reverse-current loop shown in Figure 1.1-20. In this design, current is routed through parallel contact arms so that opposing magnetic forces are formed. During high fault-current conditions, the magnetic repulsion forces quickly climb to values that force the contacts to overcome the spring forces holding them together, so they part from each other very quickly. This is described as blowing the contacts open.
Fig 1.1-20. Circuit breaker reverse-current loop.
Before the magnetic trip or other instantaneous trip initiates action to unlatch the circuit breaker, the repulsion forces may cause significant popping. The combination of forces acting directly on the contact arms and the instantaneous trip mechanism creates the circuit breaker’s instantaneous and current-limiting characteristics.
Because of these various mechanisms, circuit breakers are sensitive to the peak current and peak energy delivered over the first few milliseconds of a fault. Circuit breakers also limit the energy they allow to flow through the first few milliseconds of a fault and up to complete interruption. This creates the possibility that overcurrent devices above or below a current-limiting circuit breaker will react differently than if the prospective fault current was not being affected by the current-limiting device. The same effect that creates the dynamic system that impairs engineered series-rated systems can create a combination of devices with desirable selective behavior, not evident from traditional time- current curve analysis.
When a circuit breaker does not provide current-limiting behavior, an upstream fuse will be subject to the full magnitude of the fault current for the time shown on the circuit breaker’s time-current curve. For this combination of devices the traditional time-current curve is a suitable analytical tool to determine selectivity. If the fuse curve crosses the instantaneous foot of the circuit breaker curve, it is likely that the pair is more selective than the curve overlay shows, due to the conservative manner in which most circuit breaker curves are drawn. This is particularly true for circuit breakers with high withstand levels above the intersection of the fuse curve and the circuit breaker’s withstand rating. Popping behavior may provide some current- limiting behavior that may help provide additional selectivity.
Many circuit breakers employ magnetic trips or simple digital electronic trips. For this kind of sensing the instantaneous trip may be described as peak sensing. Because they are peak sensing, the trips are sensitive to the peak let-through of the overcurrent device below. Peak-sensing trips are set to the nominal RMS current setting times √2. This comes from the ratio of peak to RMS for a symmetrical sine wave. The analysis to determine selectivity is based on a comparison of the peak let- through current of the downstream device versus the pickup setting of the upstream device in peak amperes, for a given value of available RMS fault current.
Figure 1.1-21 shows a simple system composed of a circuit breaker above a fused switch. The minimum setting for the upstream circuit breaker to reliably predict selective behavior at maximum available fault current is determined from the downstream fuse’s peak let-through characteristics at the expected maximum fault current. Figure 1.1-22 shows the peak let- through current for several current-limiting fuses. The uppermost diagonal line represents the prospective peak current available at the fuse’s 15% test power factor. The lower diagonal line, √2 times RMS, is the range of available instantaneous pickup settings for circuit breakers. If the available bolted fault current (Ibf) at the fuse is 50,000 A, the 200 A class J fuse shown in Figure 1.1-21 will let through a peak current of ~14,000 A. Dividing the peak let-through current by the square root of 2 provides a value of ~10,000 A RMS. If the circuit breaker is set above 10,000 A, the pair will be reliably selective. For a 601 Class L fuse with 62,000 A available, the circuit breaker’s trip setting must be above 22,000 A to reliably maintain full selectivity. These derivations are shown on Figure 1.1-22 by the dashed line pairs drawn vertically up to the peak let-through curves and down from the √2 diagonal line.
Fig. 1.1-21. Circuit breaker above a current-limiting fuse with 50 kA prospective fault current.
Fig. 1.1-22. Peak current let-through for several current-limiting fuses.
Figures 1.1-23 and 1.1-24 show time-current curves for a 200 A class J fuse under an 800 A circuit breaker. The pair of devices shown is reliably selective up to 50 kA prospective fault current, as shown in Figure 7. This level of selectivity is based on the peak let-through analysis in Figure 5. A simple overlay, such as in Figure 6, may lead to the conclusion that setting the circuit breaker so that the instantaneous trip is higher than the RMS current at which the fuse crosses the 0.01 s axis on the TCC is enough to achieve selectivity. That ignores the fact that the circuit breaker considers peak, not RMS, current and may require very little peak current above threshold to trip. The pair of devices shown in Figure 6 is not reliably selective. The time- current curve is not sufficient to determine selectivity for this pair of devices. An understanding of the interaction between the sensing of the upstream circuit breaker and the downstream fuse’s current-limiting behavior is required. Testing comparing current-limiting and noncurrent-limiting devices has demonstrated that the peak let-through analytic technique is valid for determining selectivity between a current-limiting branch and a noncurrent-limiting peak sensing main.
Fig. 1.1-23. Circuit breaker and fuse with nonselective setting.
Fig. 1.1-24. Circuit breaker and fuse with selective setting
The ability of current-limiting circuit breakers and fuses to reduce thermal and mechanical stress as well as incident energy during an arc-flash event is well known. However, what is not well known is the selectivity improvement that the current- and energy-limiting performance enables. Efforts to express this have used selectivity tables for circuit breakers and fuse-ratio guidelines for current-limiting fuses. However, there is little information in the industry that indicates what selectivity is possible between these two types of current-limiting devices, other than what may be shown by traditional time-current curve analysis. This section presents the reasons why this selectivity is possible and a technique to evaluate it for circuit breaker above fuse combinations.
Figure 1.1-25 shows an upstream fuse and downstream current- limiting circuit breaker. Overlaying the time-current curve of the current-limiting circuit breaker and the melting time of the fuse is the traditional way to analyze these devices. Figure 1.1-25 also shows the time-current curve overlay for a 1600 A class L fuse and a 250 A current-limiting circuit breaker.
Fig. 1.1-25. Fuse above a current-limiting circuit breaker.
However, this type of evaluation treats the devices as static and independent; there are three dynamic characteristics of the combination that are not considered:
a. It is a series circuit, so any current- and energy-limiting by either device will affect both.
b. The device with the lowest current-limiting threshold and the fastest response will affect the current magnitude available to operate the less sensitive and slower device. The assumption is that the more sensitive and faster device is the downstream device.
c. The faster current-limiting device limits the let-through energy in addition to the let-through current. Because fuses require thermal energy to melt, the limitation caused by the downstream device has a major effect on the response of the fuse.
Current and Energy Limitations
Figure 1.1-26 shows the prospective current and the actual let- through current of the circuit breaker during a fault. As this figure shows, the let-through current and the clearing time are dramatically reduced from the fault’s prospective current. Because the two devices are in series, it is this let-through current that is seen by the fuse, not the full available bolted fault current. This also shows that the clearing time is also reduced to far less that the 0.025 s of the static TCC.
Fig. 1.1-26. Let-through peak and I2t energy waveform.
The thermal energy of this waveform, the area under the curve, is measured by the I2t and is calculated as
where I is in RMS terms and i is the instantaneous current.
As Equation 1 shows, the let-through energy is a function of the circuit breaker’s ability to limit peak current and its ability to limit the length of time the current flows. The energy limitation is a more significant contribution because it is a second-order term. The actual waveforms for three-phase devices interrupting a three-phase fault are more varied and complex. However, they will limit the peak current to values equal to or below that shown on published let-through curves. The actual interruption time may vary significantly and may be slightly longer than one-half of the power cycle. For any one phase, if the current lasts longer the peak will be smaller, if the I2t term does not exceed the maximum I2t defined by the device’s published curve. The current is significantly reduced and, hence, the let-through energy remains low regardless of the interrupting time.
Accounting for the Current Let-Through of the Downstream Circuit Breaker
Because the opening responses of fuses and circuit breakers respond to different system parameters, they are difficult to analyze comparatively. Circuit breaker response is primarily a function of current, while fuse response is primarily a function of thermal energy. Evaluating the device combination requires a technique that includes both variables and their interaction across the spectrum of prospective fault currents. The middle line and table in Figure 1.1-27 are the peak current let-through curve and values for a 250 A current-limiting circuit breaker as a function of the system’s prospective fault current. Because the upstream fuse responds to the reduced current allowed to flow by the downstream circuit breaker, it effectively operates on a smaller prospective fault current than the system’s prospective fault current above the circuit breaker. This is analogous to the way a larger and slower fuse responds to achieve selectivity above a smaller and faster fuse. This reduced let-through current becomes the prospective fault current for the upstream fuse, shown by the lower darker line in Figure 10. After converting the let-through current to a RMS value by dividing by the square root of 2, we may refer to it as the effective RMS current available to the fuse, Ie. A third designation, Isf, is used in the analysis of the devices in series. Isf is the prospective fault current that is required to generate the effective RMS of the series combination.
Fig. 1.1-27. Peak and effective let-through current.
The data for Isf are generated, with Isf as the dependent variable and Ie as the independent variable. This may also be considered a reverse let-through curve, with both terms expressed in RMS current, where the RMS prospective is a function of the peak-current let-through by the smaller current- limiting device. The data may be curve-fitted to create the equation for Isf = f(Ie). Equation 2 is the fit of the data.
Equation 2 is the system’s available fault current shifted by the peak let-through characteristics of the smaller downstream current-limiting circuit breaker. Equation 2 is used to calculate the larger system fault current needed to produce the RMS prospective current that determines the upstream fuse’s performance. This equation can be used to shift the current axis in an I2t melting curve of the upstream fuse to properly demonstrate the current the upstream fuse will see. It shifts the current of a circuit’s characteristic from the Ibf current to the Isf current needed to create the same let-through. Figure 1.1-28 shows the half-cycle I2t as a function of Ibf and Isf. For example, for the half-cycle I2t to reach a value of 5 million A2s, the bolted fault current has to be 14 kA. But for the I2t to reach the same value in the series circuit, the series circuit available current, Isf, has to be 90 kA.
Fig. 1.1-28. Half-cycle available I2t based on prospective fault current, Ibf, and effective fault current.
Fuse Response to I2t
Fuses respond to the I2t thermal energy flowing through the fuse element. When the I2t thermal energy is sufficient to melt the current-carrying element, the fuse starts to interrupt the fault current. The energy required to accomplish this is called the pre- arc energy or melting energy. Figure 12 shows the minimum melting I2t of the fuse as a function of Ibf and Isf. The I2t melt values are unchanged but are shifted to the effective RMS let-through current Isf. This shifts the melt curve from the bolted fault current to the series fault current.
The fuse will melt at a specific level of energy based on prospective fault current. By shifting the prospective fault current from Ibf to Isf, the “apparent” energy required increases. The fuse’s melt-energy characteristic, inclusive of the current-limiting effect of the downstream circuit breaker, is represented by the fuse-melting energy as a function of Isf. The graph demonstrates that in a system able to deliver a 50 kA bolted fault current, the fuse alone will melt at an I2t of 2.2 million A2s. But in the series combination, which is arrived at by the Isf transform of the current, the fuse apparent I2t melt energy is 2.8 million A2s. This is because for 50 kA available fault current, the downstream circuit breaker will only let through the equivalent of a 23 kA lt.
Fig. 1.1-29. A fuse’s required melt I2t as a function of Ibf and Isf.
This analysis is very conservative because the test power factor of the fuse is ignored. Fuses are tested at 15% power factor hence the peak prospective current is 2.31 times the RMS value of prospective current. Dividing the downstream circuit breaker’s peak let-through current by 2.31 instead of 1.41 yields a bigger Isf shift. This may be more in line with the device’s true performance, however it would be a less conservative conclusion.
Circuit Breaker Let-Through Energy and Selectivity Determination:
Because the fuse responds to energy, the circuit breaker let-through energy is used to evaluate the selectivity, not the circuit breaker’s clearing time. Figure 1.1-30 shows the let-through energy of the current-limiting circuit breaker superimposed on the fuse’s shifted and unshifted melt energy. Selectivity may be determined by comparing the circuit breaker’s let-through energy with the shifted melt energy required by the fuse.
The I2t let-through of the circuit breaker is not shifted because the let-through energy is a function of Ibf as perceived by the faster downstream limiting device, in this case the current-limiting circuit breaker. Figure 1.1-30 demonstrates this analysis for a specific combination of a 250 A current-limiting circuit breaker and a 1600 A current-limiting fuse. The analysis demonstrates that these devices should be selective for more than 90 kA prospective fault current. The same two devices demonstrated a potential selectivity of 15 kA based on traditional curve overlay, as shown in Figure 1.1-26 Based on a simple comparison of let-through energy and melt energy, selectivity up to 65 kA may be expected, but when the effect of the effective RMS shift is taken into account, predicted selectivity is over 90 kA.
Combining the shifted fuse melt curve with the circuit breaker let-through curve shows the energy-based selectivity of the combination, including the current-limiting effect of the downstream circuit breaker and the upstream fuse’s response to the limited prospective current it has available. This method provides a more accurate prediction of the selective behavior between a larger upstream current-limiting fuse and a smaller downstream current-limiting circuit breaker. The information used is the current- and energy-limiting characteristics of the circuit breaker and the pre-arc melt energy of the fuse. Fuse manufacturers do not commonly publish the pre-arc melt-energy curves for their fuses, but it may be available upon request.
Fig. 1.1-30. A fuse’s required melt energy as a function of Ibf and Ipf and the downstream circuit breaker’s let-through energy.
Advanced current-limiting circuit breakers may have three regions to their instantaneous trip. The leftmost region may be composed of an adjustable electronic trip with an advanced algorithm able to filter narrow-peak let-through currents. The rightmost region is where the circuit breaker contact assembly has enough energy from the fault current to quickly blow the contacts open and keep them open while the trip catches up and latches the mechanism in the open position. The middle transition region is where the circuit breaker contacts may pop or start to open due to magnetic forces, but the circuit breaker still relies on an electronic trip, magnetic trip, or other mechanical trip to fully open and unlatch the circuit breaker.
Figure 1.1-31 demonstrates the three regions in a 600 A circuit breaker with an adjustable advanced-algorithm electronic trip. The device shown uses an algorithm designed to filter narrow-peak let-through currents and hence may be set below the peak let-through of a downstream current-limiting device. The filtering algorithm section is identified by the gap below the curve. The flat-topped instantaneous portion between the adjustable section and the beginning of the sloped portion includes a region where the circuit breaker may trip because of the electronics or the mechanical trip mechanism. Which mechanism causes the circuit breaker to open depends on the closing angle, voltage, fault-current X/R ratio, and let-through characteristics of a downstream device that may be limiting fault current. The sloped portion to the right is the truly current-limiting portion of the curve. The clearing time is not material, as the circuit breaker may allow minimal current to flow for a few milliseconds, but the peak current and energy are limited regardless.
Fig. 1.1-31. TCC for a current-limiting molded-case circuit breaker showing separate regions for current limiting and filtering electronic tripping.
The trip system in the circuit breaker responds to both peak current and energy. Once the peak current is over the threshold, there has to be enough energy to move the trip mechanically to unlatch the breaker mechanism. In some breaker designs, the mechanical system is intentionally damped to reduce the sensitivity of the trip. This creates a portion of the fault current range for which the circuit breaker will not commit to a trip for a limited amount of time. With an understanding of how the trip operates, the circuit breaker can be analyzed as an energy- driven device over the range of fault currents. The shape of the curve drawn in Figure 1.1-31 is intended to alert the user that the circuit breaker behaves this way, but does not provide sufficient information for a complete selectivity analysis to be made. However the manufacturer will have sufficient information to perform selectivity analysis and generate selectivity tables for specific pairs of current-limiting devices where the downstream device may be a fuse or a circuit breaker, regardless of how the curve is drawn.
The analytical technique for determining selectivity for current-limiting circuit breakers above fuses is similar to that for fuses above circuit breakers. The analysis must be divided into two regions. In the leftmost region, the electronic trip filters the single peak allowed to flow by a current-limiting downstream device. The rightmost region represents the mechanical portion of the trip that may be analyzed as a pure energy device.
Figure 1.1-32 shows the commit energy representation for a molded-case circuit breaker with a waveform-recognition electronic trip and a mechanical trip. The flat section to the left is equivalent to two half-cycle sine waves at the threshold peak. This can be used to represent the peak filter algorithm in energy terms. The rising slope is a representation of the circuit breaker mechanical trip’s required commit energy. This is a simplification of the actual required energy, but it is sufficient to provide the required analytical tool. Note that the time the fuse takes to open is not part of the analysis. It is the energy the fuse lets through in the process that matters.
Fig. 1.1-32. Fuse let-through I2t and the circuit breaker’s I2t requirement.
Before the circuit breaker’s energy-based current-limiting region can be considered, the circuit breaker’s instantaneous trip must be set above where the fuse is reliably current and energy limiting for a three-phase event. The three horizontal lines represent the let-through I2t for three different sizes of class J fuses in a 480 V system. All three let less energy through than the circuit breaker’s mechanical system needs to commit. For high-level faults, all three fuses are probably selective with the circuit breaker’s mechanical system. However, in this case the potential overlap in the curves is at lower current levels. The three-phase behavior of the fuses in this region is typically not fully defined. Traditionally, the data of interest were for the highest available fault. Only the 200 A fuse, which is energy limiting at ~5000 A, meets the criterion of being reliably current limiting under the 6000 A threshold of the electronic trip. This energy-limiting threshold varies based on system voltage and is higher at 600 V. Fuse manufacturers commonly publish peak current let-through curves for their circuit breakers. However, this analysis requires the fuse manufacturer to provide the energy let-through value for the fuse at the application voltage and over a range of fault currents. This is typically constant energy after some prospective current level. Fuse manufacturers may be able to provide these data upon request.
Tests were designed to confirm that a current-limiting fuse provides selective protection above a current-limiting circuit breaker, as shown in Figure 1.1-30. The example analysis shown previously indicated that a 250 A current-limiting molded-case circuit breaker should be selective with a 1600 A class L fuse.
The overlay of characteristics shown in Figure 1.1-30 demonstrates that potential lack of selective performance occurs at high fault currents in the range of 90 to 100 kA. Without shifting the fuse melt-energy curve by the transform of the circuit breaker’s let- through, peak current selectivity may be limited to 65 kA. With the curve shift, selectivity should be at least 95 kA. Three-phase short-circuit tests where performed at 100 kA with a 20% power factor. Ten tests were done at various closing angles (closing angle is a measurement of the angular difference between when the fault is initiated and the voltage on phase A of the test circuit). In all ten cases the circuit breaker interrupted with no apparent damage to the fuse. Impedance tests on the fuses pre and post testing indicated no changes in fuse resistance.
Upstream Circuit Breaker, Downstream Fuse
A second set of tests was performed with a 600 A current- limiting circuit breaker on the line side of 200, 300, and 400 A class J time-delay, current-limiting fuses. This combination is shown in Figure 1.1-32. These particular combinations of devices show potential lack of selectivity at relatively low fault currents, where the fuse’s let-through current must be filtered by the circuit breaker’s electronic instantaneous trip. Sufficient data were not available from the fuse manufacturer to model fuse performance in the area around the fuse’s current-limiting threshold at 480 V. Hence, testing in this range of fault current was required. A total of 14 different tests were performed with the 200 A fuse at fault currents from 5 kA to 100 kA, at 20%– 50% power factor, and at various closing angles. In all cases, two or more fuses cleared properly and the circuit breaker did not trip. Some limited additional testing was performed with 300 and 400 A fuses at various low and high fault values. In all cases the fuses cleared properly and the circuit breaker did not trip. Though insufficient tests were performed with the larger fuses to make a definite determination, it is anticipated that the circuit breaker would be selective with fuses as large as 400 A.
Conclusions
The various techniques described provides methods for analyzing the selective capability of fuses and circuit breakers in systems in which either may be used above the other. Traditional time-current curve analysis is not sufficient for some of the combinations of devices, but other analyses based on an understanding of the let-through characteristics of the downstream device and the commit behavior of the upstream device, regardless whether either is a fuse or circuit breaker, allows insight into how the system of devices will operate. Understanding the system operation allows selection of the optimum assessment methods for every combination. Some of the analyses may be performed with published information, while others require more detailed understanding of the operation of both fuses and circuit breakers.
The analysis techniques presented here and the preliminary test validation of these techniques illustrate three important advancements in selectivity evaluation. First, that the limiting performance of downstream devices can be included analytically in selectivity studies. The traditional static time evaluation excludes this dynamic downstream limiting characteristic resulting in perceived selective or unselective results that are incorrect. Second, nontraditional measures, such as peak currents and I2t, can reliably be used to perform selectivity studies rather than solely using time. Third and most important, the limiting and trip-commit behavior of devices developed individually can be analytically combined for series combinations. This enables analysis of the series performance of the near-infinite combinations of upstream and downstream devices. The demonstrated methods can provide the industry with provable techniques to improve analysis of system reliability and protection using devices and information available to the industry today.
Fig. 1.1-33 Table of suggested assessment method versus line and load side device type
Manufacturers may have access to the detailed information and may be able to provide it to the interested user, or may be able to perform the analysis directly for the user interested in specific combinations. In either case, there are methods to move the industry past traditional analytical techniques that are not reliable in every case. And new techniques can be used to provide more reliable analyses, resulting in better protected, and more reliable power distribution systems.
*Mr. Nikola Zlatanov spent over 20 years working in the Capital Semiconductor Equipment Industry. His work at Gasonics, Novellus, Lam and KLA-Tencor involved progressing electrical engineering and management roles in disruptive technologies. Nikola received his Undergraduate degree in Electrical Engineering and Computer Systems from Technical University, Sofia, Bulgaria and completed a Graduate Program in Engineering Management at Santa Clara University. He is currently consulting for Fortune 500 companies as well as Startup ventures in Silicon Valley, California.
Sensitive electronic loads deployed today by users require strict requirements for the quality of power delivered to loads. For electronic equipment, power disturbances are defined in terms of amplitude and duration by the electronic equipment operating envelope. Electronic loads may be damaged and disrupted, with shortened life expectancy, by disturbances.
The proliferation of computers, variable frequency motor drives, UPS systems and other electronically controlled equipment is placing a greater demand on power producers for a disturbance- free source of power. Not only do these types of equipment require quality power for proper operation; many times, these types of equipment are also the sources of power disturbances that corrupt the quality of power in a given facility.
Power quality is defined according to IEEE Standard 1100 as the concept of powering and grounding electronic equipment in a manner that is suitable to the operation of that equipment. IEEE Standard 1159 notes that “within the industry, alternate definitions or interpretations of power quality have been used, reflecting different points of view.” In addressing power quality problems at an existing site, or in the design stages of a new building, engineers need to specify different services or mitigating technologies. The lowest cost and highest value solution is to selectively apply a combination of different products and services as follows:
Key services/technologies in the “power quality” industry:
Uninterruptible power supply (UPS) or motor-generator (M-G)set
Defining the Problem
Power quality problems can be resolved in three ways: by reducing the variations in the power supply (power disturbances), by improving the load equipment’s tolerance to those variations, or by inserting some interface equipment (known as power conditioning equipment) between the electrical supply and the sensitive load(s) to improve the compatibility of the two. Practicality and cost usually determine the extent to which each option is used.
Many methods are used to define power quality problems. For example, one option is a thorough on-site investigation, which includes inspecting wiring and grounding for errors, monitoring the power supply for power disturbances, investigating equipment sensitivity to power disturbances, and determining the load disruption and consequential effects (costs), if any. In this way, the power quality problem can be defined, alternative solutions developed, and optimal solution chosen.
Before applying power-conditioning equipment to solve power quality problems, the site should be checked for wiring and grounding problems. Sometimes, correcting a relatively inexpensive wiring error, such as a loose connection or a reversed neutral and ground wire, can avoid a more expensive power conditioning solution.
Sometimes this approach is not practical because of limitations in time; expense is not justified for smaller installations; monitoring for power disturbances may be needed over an extended period of time to capture infrequent disturbances; the exact sensitivities of the load equipment may be unknown and difficult to determine; and finally, the investigative approach tends to solve only observed problems. Thus unobserved or potential problems may not be considered in the solution. For instance, when planning a new facility, there is no site to investigate. There- fore, power quality solutions are often implemented to solve potential or perceived problems on a preventive basis instead of a thorough on-site investigation.
Another option is to buy power conditioning equipment to correct any and all perceived power quality problems without any on-site investigation.
Power Quality Terms
Power disturbance: Any deviation from the nominal value (or from some selected thresholds based on load tolerance) of the input AC power characteristics.
Total harmonic distortion or distortion factor: The ratio of the root-mean- square of the harmonic content to the root-mean-square of the fundamental quantity, expressed as a percentage of the fundamental.
Crest factor: Ratio between the peak value (crest) and rms value of a periodic waveform.
Apparent (total) power factor: The ratio of the total power input in watts to the total volt-ampere input.
Sag: An rms reduction in the AC voltage, at the power frequency, for the duration from a half-cycle to a few seconds. An undervoltage would have a duration greater than several seconds.
Interruption: The complete loss of volt- age for a time period.
Transient: A sub-cycle disturbance in the AC waveform that is evidenced by a sharp brief discontinuity of the waveform. May be of either polarity and may be additive to or subtractive from the nominal waveform.
Surge or impulse: See transient.
Noise: Unwanted electrical signals that produce undesirable effects in the circuits of control systems in which they occur.
Common-mode noise: The noise voltage that appears equally and in phase from each current-carrying conductor to ground.
Normal-mode noise: Noise signals measurable between or among active circuit conductors feeding the subject load, but not between the equipment grounding conductor or associated reference structure and the active circuit conductors.
Methodology for Ensuring Effective Power Quality to Electronic Loads
The power quality pyramid is an effective guide for addressing power quality problems at an existing facility. The framework is also effective for specifying engineers who are designing a new facility. Power quality starts with grounding (the base of the pyramid) and then moves upward to address the potential issues. This simple, yet proven methodology, will provide the most cost-effective approach. As we move higher up the pyramid, the cost per kVA of mitigating potential problems increase and the quality of the power increases (refer to Figure 1.4-11).
Figure 1.4-11. Power Quality Pyramid
1.Grounding
Grounding represents the foundation of a reliable power distribution system. Grounding and wiring problems can be the cause of up to 80% of all power quality problems. All other forms of power quality solutions are dependent upon good grounding procedures. The proliferation of communication and computer network systems has increased the need for proper grounding and wiring of AC and data/ communication lines. In addition to reviewing AC grounding and bonding practices, it is necessary to prevent ground loops from affecting the signal reference point.
2.Surge Protection
Surge protection devices (SPDs) are recommended as the next stage power quality solutions. NFPA, UL 96A, IEEE Emerald Book and equipment manufacturers recommend the use of surge protectors. The SPD shunt short duration voltage disturbances to ground, thereby preventing the surge from affecting electronic loads. When installed as part of the facility-wide design, SPDs are cost-effective compared to all other solutions (on a $/kVA basis).
The IEEE Emerald Book recommends the use of a two-stage protection concept. For large surge currents, diversion is best accomplished in two stages: the first diversion should be performed at the service entrance to the building. Then, any residual voltage resulting from the action can be dealt with by a second protective device at the power panel of the computer room (or other critical loads). Combined, the two stages of protection at the service entrance and branch panel locations reduce the IEEE 62.41 recommended test wave (C3–20 kV, 10 kA) to less than 200 V voltage, a harmless disturbance level for 120 V rated sensitive loads. If only building entrance feeder protection were provided, the let- through voltage will be approximately 950 V in a 277/480 V system exposed to induced lightning surges. This level of let-through voltage can cause degradation or physical damage of most electronic loads.
Wherever possible, consultants, specifiers and application engineers should ensure similar loads are fed from the same source. In this way, disturbance-generating loads are separated from electronic circuits affected by power disturbances. For example, motor loads, HVAC systems and other linear loads should be separated from the sensitive process control and computer systems. The most effective and economic solution for protecting a large number of loads is to install parallel SPDs at the building service entrance feeder and panel board locations. This reduces the cost of protection for multiple sensitive loads.
3.Voltage Regulation
Voltage regulation (i.e., sags or over- voltage) disturbances are generally site- or load-dependent. A variety of mitigating solutions are available depending upon the load sensitivity, fault duration/magnitude and the specific problems encountered. It is recommended to install monitoring equipment on the AC power lines to assess the degree and frequency of occurrences of voltage regulation problems. The captured data will allow for the proper solution selection.
4.Harmonics Distortion, Harmonics and Nonlinear Loads
Until recently, most electrical loads were linear. Linear loads draw the full sine wave of electric current at its 60 cycle (Hz) fundamental frequency—Figure 1.4-16 shows balance single-phase, linear loads. As the figure shows, little or no current flows in the neutral conductor when the loads are non- linear and balanced. With the arrival of nonlinear electronic loads, where the AC voltage is converted to a DC voltage, harmonics are created because of the use of only part of the AC sine wave. In this conversion from AC to DC, the electronics are turned on in the 60 cycle wave at a given point in time to obtain the required DC level. The use of only part of the sign wave causes harmonics. It is important to note that the current distortion caused by loads such as rectifiers or switch mode power supplies causes the voltage distortion. That voltage distortion is caused by distorted currents flowing through an impedance. The amount of voltage distortion depends on:
• System impedance • Amount of distorted current
Devices that can cause harmonic disturbances include rectifiers, thrusters and switching power supplies, all of which are nonlinear. Further, the proliferation of electronic equipment such as computers, UPS systems, variable speed drives, programmable logic controllers, and the like: non-linear loads have become a significant part of many installations. Other types of harmonic-producing loads include arcing devices (arc furnaces, fluorescent lights) and iron core storable devices (transformers, especially during energization).
Nonlinear load currents vary widely from a sinusoidal wave shape; often they are discontinuous pulses. This means that nonlinear loads are extremely high in harmonic content. Triplen harmonics are the 3rd, 9th, 15th,…harmonics. Further, triplen harmonics are the most damaging to an electrical system because these harmonics on the A-phase, B-phase and C-phase are in sequence with each other. Meaning, the triplen harmonics present on the three phases add together in the neutral, as shown in Figure 1.4-17, rather than cancel each other out, as shown in Figure 1.4-16. Odd non-triplen harmonics are classified as “positive sequence” or “negative sequence” and are the 1st, 5th, 7th, 11th, 13th, etc. In general, as the order of a harmonic gets higher, its amplitude becomes smaller a percentage of the fundamental frequency.
Figure 1.4-16. Balanced Neutral Current Equals Zero
Figure 1.4-17. Unbalanced Single-Phase Loads with Triplen Harmonics
Harmonic Issues
Harmonic currents perform no work and result in wasted electrical energy that may over burden the distribution system. This electrical overloading may contribute to preventing an existing electrical distribution system from serving additional future loads.
In general, harmonics present on a distribution system can have the following detrimental effects:
Overheating of transformers and rotating equipment.
Increased hysteresis losses.
Decreased kVA capacity.
Overloading of neutral.
Unacceptable neutral-to-ground voltages.
Distorted voltage and current waveforms.
Failed capacitor banks.
Breakers and fuses tripping.
Double or ever triple sized neutrals to defy the negative effects of triplen harmonics.
In transformers, generators and uninterruptible power supplies (UPS) systems, harmonics cause overheating and failure at loads below their ratings because the harmonic currents cause greater heating than standard 60 Hz current. This results from increased eddy current losses, hysteresis losses in the iron cores, and conductor skin effects of the windings. In addition, the harmonic currents acting on the impedance of the source cause harmonics in the source voltage, which is then applied to other loads such as motors, causing them to overheat. The harmonics also complicate the application of capacitors for power factor correction. If, at a given harmonic frequency, the capacitive impedance equals the system reactive impedance, the harmonic voltage and current can reach dangerous magnitudes. At the same time, the harmonics create problems in the application of power factor correction capacitors, they lower the actual power factor. The rotating meters used by the utilities for watthour and various measurements do not detect the distortion component caused by the harmonics. Rectifiers with diode front ends and large DC side capacitor banks have displacement power factor of 90% to 95%. More recent electronic meters are capable of metering the true kVA hours taken by the circuit.
Single-phase power supplies for computer and fixture ballasts are rich in third harmonics and their odd multiples.
Even with the phase currents perfectly balanced, the harmonic currents in the neutral can total 173% of the phase current. This has resulted in overheated neutrals. The Information Technology Industry Council (ITIC) formerly known as CBEMA, recommends that neutrals in the supply to electronic equipment be oversized to at least 173% of the ampacity of the phase conductors to prevent problems. ITIC also recommends derating transformers, loading them to no more than 50% to 70% of their nameplate kVA, based on a rule-of-thumb calculation, to compensate for harmonic heating effects. In spite of all the concerns they cause, nonlinear loads will continue to increase. Therefore, the design of nonlinear loads and the systems that supply them will have to be designed so that their adverse effects are greatly reduced. Table 1.4-4 shows the typical harmonic orders from a variety of harmonic generating sources.
Revised standard IEEE 519-1992 indicates the limits of current distortion allowed at the PCC (Point of Common Coupling) point on the system where the current distortion is calculated, usually the point of connection to the utility or the main supply bus of the system. The standard also covers the harmonic limits of the supply voltage from the utility or cogenerators.
Table 1.4-5. Low Voltage System Classification and Distortion Limits for 480 V Systems
Class
C
AN
DF
Special application General system Dedicated system
10 5 2
16,400 22,800 36,500
3% 5% 10%
Table 1.4-6. Utility or Cogenerator Supply Voltage Harmonic Limits
Voltage Range
23kV – 69kV
69kV – 138kV
>138kV
Maximum individual harmonic
3.0%
1.5%
1.0%
Total harmonic distortion
5.0%
2.5%
1.5%
Percentages are Vh / V1 x 100 for each harmonic and
It is important for the system designer to know the harmonic content of the utility’s supply voltage because it will affect the harmonic distortion of the system.
Table 1.4-7. Current Distortion Limits for General Distribution Systems (120– 69,000 V)
Maximum Harmonic Current Distortion in Percent of IL
Individual Harmonic Order (Odd Harmonics)
ISC/IL
<11
11≤ h <17
17≤ h <23
23≤ h <35
35≤ h
TDD
<20 20<50 50<100 100<1000 >1000
4.0 7.0 10.0 12.0 15.0
2.0 3.5 4.5 5.5 7.0
1.5 2.5 4.0 5.0 6.0
0.6 1.0 1.5 2.0 2.5
0.3 0.5 0.7 1.0 1.4
5.0 8.0 12.0 15.0 20.0
Harmonic Solutions
In spite of all the concerns nonlinear loads cause, these loads will continue to increase. Therefore, the design of nonlinear loads and the systems that supply them will need design so adverse harmonic effects are greatly reduced. Table 1.4-8 and depicts many harmonic solutions along with their advantages and disadvantages.
Table 1.4-8. Harmonic Solutions for Given Loads
5.Uninterruptible Power Systems (UPS)
The advent of solid-state semiconductors over 40 years ago, and their subsequent evolution to transistors, and the miniaturization of electronics into microprocessor over 25 years ago, has created numerous computation machines that assist us in every conceivable manner. These machines, and their clever configurations, whether they take the form of computers, appliance controls, fax machines, phone systems, computers of all sizes, server systems and server farms, emergency call centers, data processing at banks, credit companies, private company communication networks, government institutions and defense agencies, all rely on a narrow range of nominal AC power in order for these devices to work properly. Indeed, many other types of equipment also require that the AC electrical power source be at or close to nominal voltage and frequency. Disturbances of the power translate into failed processes, lost data, decreased efficiency and lost revenue.
The normal power source supplied by the local utility or provider is not stable enough over time to continuously serve these loads without interruption. It is possible that a facility outside a major metropolitan area served by the utility grid will experience outages of some nature 15–20 times in one year. Certain outages are caused by the weather, and others by the failure of the utility supply system due to equipment failures or construction interruptions. Some outages are only several cycles in duration, while others may be for hours at a time. In a broader sense, other problems exist in the area of power quality, and many of those issues also contribute to the failure of the supply to provide that narrow range of power to the sensitive loads mentioned above. Power quality problems take the form of any of the following: power failure, power sag, power surge, undervoltage, overvoltage, line noise, frequency variations, switching transients and harmonic distortion.
Regardless of the reason for outages and power quality problems, the sensitive loads cannot function normally without a backup power source, and in many cases, the loads must be isolated from the instabilities of the utility supply and power quality problems and given clean reliable power on a continuous basis, or be able to switch over to reliable clean electrical power quickly. Uninterruptible power supply (UPS) systems have evolved to serve the needs of sensitive equipment and can supply a stable source of electrical power, or switch to backup to allow for an orderly shutdown of the loads without appreciable loss of data or process. In the early days of main- frame computers, motor-generator sets provide isolation and clean power to the computers. They did not have deep reserves, but provided extensive ride-through capability while other sources of power (usually standby emergency engine generator sets) were brought to serve the motor-generator sets while the normal source of power was unstable or unavailable.
UPS systems have evolved along the lines of rotary types and static types of systems, and they come in many configurations, and even hybrid designs having characteristics of both types. The discussion that follows attempts to compare and contrast the two types of UPS systems, and give basic guidance on selection criteria. This discussion will focus on the medium, large and very large UPS systems required by users who need more than 10 kVA of clean reliable power.
*Mr. Nikola Zlatanov spent over 20 years working in the Capital Semiconductor Equipment Industry. His work at Gasonics, Novellus, Lam and KLA-Tencor involved progressing electrical engineering and management roles in disruptive technologies. Nikola received his Undergraduate degree in Electrical Engineering and Computer Systems from Technical University, Sofia, Bulgaria and completed a Graduate Program in Engineering Management at Santa Clara University. He is currently consulting for Fortune 500 companies as well as Startup ventures in Silicon Valley, California.
Medium Voltage Equipment Surge Protection Considerations
Transformers
If the voltage withstand/BIL rating of the transformer is less than that of the switchgear feeding the transformer, surge protection is recommended at the transformer terminals, in line with established practices. In addition, consideration should be given to using surge arresters and/or surge capacitors for transformers having equal or greater withstand/BIL ratings than that of the switchgear feeding the trans- former for distribution systems where reflected voltage waves and/or resonant conditions may occur. Typically incoming voltage surges are reflected at the transformer primary terminals (because of the change in impedance) resulting in voltages at the ends of the transformer primary terminals/windings of up to two times the incoming voltage wave. System capacitance and inductance values combined with the transformer impedance values can cause resonant conditions resulting in amplified reflected waves. Surge arresters/capacitors when required, should be located as close to the trans- former primary terminals as practical.
Motors
Surge capacitors and, where appropriate, surge arresters should be applied at the motor terminals.
Generators
Surge capacitors and station class surge arresters at the machine terminals.
Surge Protection
The distribution system can be subject to voltage transients caused by lighting or switching surges. Recognizing that distribution system can be subject to voltage transients caused by lighting or switching, the industry has developed standards to provide guidelines for surge protection of electrical equipment. Those guide- lines should be used in design and protection of electrical distribution systems independent of the circuit breaker interrupting medium. The industry standards are:
ANSI C62 Guides and Standards for Surge Protection
IEEE 242—Buff Book IEEE Recommended Practice for Protection and Coordination of Industrial and Commercial Power Systems
IEEE 141—Red Book Recommended Practice for Electric Power Distribution for Industrial Plants
IEEE C37.20.2
Surge Protection Recommendations
For circuits exposed to lightning, surge arresters should be applied in line with Industry standard practices.
Transformers:
Close-Coupled to medium voltage primary breaker: Provide transients surge protection, such as Surge Arrester in parallel with RC Snubber, or ZORC. The surge protection device selected should be located and connected at the transformer primary terminals or it can be located inside the switchgear and connected on the transformer side of the primary breaker.
Cable-Connected to medium voltage primary breaker: Provide transient surge protection, such as Surge Arrester in parallel with RC Snubber, or ZORC for transformers connected by cables with lengths up to 75 feet. The surge protection device should be located and connected at the transformer terminals. No surge protection is needed for transformers with lightning impulse withstand ratings equal to that of the switchgear and connected to the switchgear by cables at least 75 feet or longer. For transformers with lower BIL, provide surge arrester in parallel with RC Snubber or ZORC.
The natural frequency of transformer windings can under some circumstances be excited to resonate. Transformer windings in resonance can produce elevated internal voltages that produce insulation damage or failure. An RC Snubber or a ZORC applied at the transformer terminals as indicated above can damp internal winding resonance and prevent the production of damaging elevated internal voltages. This is typically required where rectifiers, UPS or similar electronic equipment is on the transformer secondary.
Arc-Furnace Transformers— Provide Surge Arrester in parallel with RC Snubber, or ZORC at the transformer terminals.
Motors—Provide Surge Arrester in parallel with RC Snubber, or ZORC at the motor terminals. For those motors using VFDs, surge protection should be applied and precede the VFD devices as well.
Generators—Provide station class Surge Arrester in parallel with RC Snubber, or ZORC at the generator terminals.
Capacitor Switching—No surge protection is required. Make sure that the capacitor’s lightning impulse withstand rating is equal to that of the switchgear.
Shunt Reactor Switching— Provide Surge Arrester in parallel with RC Snubber, or ZORC at the reactor terminals.
Motor Starting Reactors or Reduced Voltage Auto-Transformers—Provide Surge Arrester in parallel with RC Snubber, or ZORC at the reactor or RVAT terminals.
Switching Underground Cables— Surge protection not needed.
Types of Surge Protection Devices
Generally surge protective devices should be located as closely as possible to the circuit component(s) that require protection from the transients, and connected directly to the terminals of the component with conductors that are as short and flat as possible to minimize the inductance. It is also important that surge protection devices should be properly grounded for effectively shunting high frequency transients to ground.
Figure 1.4-10. Surge Protection Devices
*Mr. Nikola Zlatanov spent over 20 years working in the Capital Semiconductor Equipment Industry. His work at Gasonics, Novellus, Lam and KLA-Tencor involved progressing electrical engineering and management roles in disruptive technologies. Nikola received his Undergraduate degree in Electrical Engineering and Computer Systems from Technical University, Sofia, Bulgaria and completed a Graduate Program in Engineering Management at Santa Clara University. He is currently consulting for Fortune 500 companies as well as Startup ventures in Silicon Valley, California.
Article 230.95 of NEC requires ground- fault protection of equipment shall be provided for solidly grounded wye electrical services of more than 150 V to ground, but not exceeding 600 V phase-to-phase for each service disconnect rated 1000 A or more. The rating of the service disconnect shall be considered to be the rating of the largest fuse that can be installed or the highest continuous current trip setting for which the actual overcurrent device installed in a circuit breaker is rated or can be adjusted. The maximum allowable settings are: 1200 A pickup, 1 second or less trip delay at currents of 3000 A or greater. The characteristics of the ground-fault trip elements create coordination problems with downstream devices not equipped with ground fault protection. The National Electrical Code exempts fire pumps and continuous industrial processes from this requirement.
It is recommended that in solidly grounded 480/277 V systems where main breakers are specified to be equipped with ground fault trip elements that the feeder breakers be specified to be equipped with ground fault trip elements as well.
Suggested Ground Fault Settings
For the main devices:
A ground fault pickup setting equal to 20–30% of the main breaker rating but not to exceed 1200 A, and a time delay equal to the delay of the short- time element, but not to exceed 1 second.
For the feeder ground fault setting:
A setting equal to 20–30% of the feeder ampacity and a time delay to coordinate with the setting of the main (at least 6 cycles below the main). If the desire to selectively coordinate ground fault devices results in settings that do not offer adequate damage protection against arcing single line- ground faults, the design engineer should decide between coordination and damage limitation.
For low voltage systems with high- magnitude available short-circuit currents, common in urban areas and large industrial installations, several solutions are available. High interrupting Series C® molded case breakers, current-limiting circuit breakers, or current-limiting fuses, limiters integral with molded-case circuit breakers (TRI-PAC®) or mounted on power circuit breakers (MDSL) can be used to handle these large fault currents. To provide current limiting, these devices must clear the fault completely within the first half-cycle, limiting the peak current (Ip) and heat energy (I2t) let-through to considerably less than what would have occurred without the device. For a fully fusible system, rule-of-thumb fuse ratios or more accurate I2t curves can be used to provide selectivity and coordination. For fuse-breaker combinations, the fuse should be selected (coordinated) so as to permit the breaker to handle those overloads and faults within its capacity; the fuse should operate before or with the breaker only on large faults, approaching the interrupting capacity of the breaker, to minimize fuse blowing. Recently, unfused, truly current-limiting circuit breakers with interrupting ratings adequate for the largest systems (Type Series C, FDC, JDC, KDC, LDC and NDC frames or Type Current Limit-R®) have become available.
The Series G high performance, current-limiting circuit breaker series offers interrupting ratings to 200 kA. Frames are EGC, EGU, EGX, JGC, JGU, JGX, LGC, LGU and LGX. Any of these current-limiting devices— fuses, fused breakers or current-limiting breakers—cannot only clear these large faults safely, but also will limit the Ip and I2t let-through significantly to prevent damage to apparatus downstream, extending their zone of protection. Without the current limitation of the upstream device, the fault current could exceed the with- stand capability of the downstream equipment. Underwriters Laboratories tests and lists these series combinations. Application information is available for combinations that have been tested and UL®-listed for safe operation downstream from MDSL, TRI-PAC, and Current Limit-R, or Series C breakers of various ratings, under high available fault currents.
Protective devices in electrical distribution systems may be properly coordinated when the systems are designed and built, but that is no guarantee that they will remain coordinated. System changes and additions, plus power source changes, frequently modify the protection requirements, sometimes causing loss of coordination and even increasing fault currents beyond the ratings of some devices. Consequently, periodic study of protective-device settings and ratings is as important for safety and preventing power outages as is periodic maintenance of the distribution system.
Grounding
Grounding encompasses several different but interrelated aspects of electrical distribution system design and construction, all of which are essential to the safety and proper operation of the system and equipment supplied by it. Among these are equipment grounding, system grounding, static and lightning protection, and connection to earth as a reference (zero) potential.
1.Equipment Grounding
Equipment grounding is essential to safety of personnel. Its function is to ensure that all exposed noncurrent- carrying metallic parts of all structures and equipment in or near the electrical distribution system are at the same potential, and that this is the zero reference potential of the earth. Equipment grounding is required by both the National Electrical Code (Article 250) and the National Electrical Safety Code regardless of how the power system is grounded. Equipment grounding also provides a return path for ground fault currents, permitting protective devices to operate. Accidental contact of an energized conductor of the system with an improperly grounded noncurrent-carry metallic part of the system (such as a motor frame or panelboard enclosure) would raise the potential of the metal object above ground potential. Any person coming in contact with such an object while grounded could be seriously injured or killed. In addition, current flow from the accidental grounding of an energized part of the system could generate sufficient heat (often with arcing) to start a fire. To prevent the establishment of such unsafe potential difference requires that (1) the equipment grounding conductor provide a return path for ground fault currents of sufficiently low impedance to prevent unsafe voltage drop, and (2) the equipment grounding conductor be large enough to carry the maximum ground fault current, without burning off, for sufficient time to permit protective devices (ground fault relays, circuit breakers, fuses) to clear the fault. The grounded conductor of the system (usually the neutral conductor), although grounded at the source, must not be used for equipment grounding.
The equipment grounding conductor may be the metallic conduit or raceway of the wiring system, or a separate equipment grounding conductor, run with the circuit conductors, as permitted by NEC. If a separate equipment grounding conductor is used, it may be bare or insulated; if insulated, the insulation must be green, green with yellow stripe or green tape. Conductors with green insulation may not be used for any purpose other than for equipment grounding. The equipment grounding system must be bonded to the grounding electrode at the source or service; however, it may be also connected to ground at many other points. This will not cause problems with the safe operation of the electrical distribution system. Where computers, data processing, or microprocessor- based industrial process control systems are installed, the equipment grounding system must be designed to minimize interference with their proper operation. Often, isolated grounding of this equipment, or isolated electrical supply systems are required to protect microprocessors from power system “noise” that does not in any way affect motors or other electrical equipment.
Such systems must use single-point ground concept to minimize “noise” and still meet the NEC requirements. Any separate isolated ground mat must be tied to the rest of the facility ground mat system for NEC compliance.
2.System Grounding
System grounding connects the electrical supply, from the utility, from transformer secondary windings, or from a generator, to ground. A system can be solidly grounded (no intentional impedance to ground), impedance grounded (through a resistance or grounded (with no intentional connection to ground.
3.Medium Voltage System: Grounding
Table 1.4-1. Features of Ungrounded and Grounded Systems (from ANSI C62.92)
Grounding/Ground Fault Protection
Because the method of grounding affects the voltage rise of the un-faulted phases above ground, ANSI C62.92 classifies systems from the point of view of grounding in terms of a coefficient of grounding This same standard also defines systems as effectively grounded when COG ð .8 such a system would have X0 /X1 ð 3.0 and R0 /X1 ð 1.0. Any other grounding means that does not satisfy these conditions at any point in a system is not effectively grounded. The aforementioned definition is of significance in medium voltage distribution systems with long lines and with grounded sources removed during light load periods so that in some locations in the system the X0 /X1, R0 /X1 may exceed the defining limits.
Other standards (cable and lightning arrester) allow the use of 100% rated cables and arresters selected on the basis of an effectively grounded system only where the criteria in the above are met. In effectively grounded system the line-to-ground fault current is high and there is no significant voltage rise in the un-faulted phases. With selective ground fault isolation the fault current should be at least 60% of the three-phase current at the point of fault. Damage to cable shields must be checked. Although this fact is not a problem except in small cables, it is a good idea to supplement the cable shields returns of ground fault current to prevent damage, by installing an equipment grounding conductor. The burdens on the current transformers must be checked also (for saturation considerations), where residually connected ground relays are used and the current transformers supply current to phase relays and meters. If ground sensor current transformers type) are used they must be of high burden capacity.
Table 1.4-1. Features of Ungrounded and Grounded Systems (Continued)
Table 1.4-2 taken from ANSI-C62.92 indicates the characteristics of the various methods of grounding.
Reactance Grounding
It is generally used in the grounding of the neutrals of generators directly connected to the distribution system bus, in order to limit the line-to-ground fault to somewhat less than the three- phase fault at the generator terminals. If the reactor is so sized, in all probability the system will remain effectively grounded.
Resistance Grounded
Medium voltage systems in general should be low resistance grounded. The ground fault is typically limited to about 200–400 A but less than 1000 A (a cable shield consideration). With a properly sized resistor and relaying application, selective fault isolation is feasible. The fault limit provided has a bearing on whether residually connected relays are used or ground sensor current transformers are used for ground fault relaying. In general, where residually connected ground relays are used (51N), the fault current at each grounded source should not be limited to less than the current transformers rating of the source. This rule will provide sensitive differential protection for wye-connected generators and transformers against line-to-ground faults near the neutral. Of course, if the installation of ground fault differential protection is feasible, or ground sensor current transformers are used, sensitive differential relaying in resistance grounded system with greater fault limitation is feasible. In general, ground sensor current transformers (zero sequence) do not have high burden capacity. Resistance grounded systems limit the circulating currents of triple harmonics and limit the damage at the point of fault. This method of grounding is not suitable for line-to-neutral connection of loads. On medium voltage systems, 100% cable insulation is rated for phase-to- neutral voltage. If continued operation with one phase faulted to ground is desired, increased insulation thickness is required. For 100% insulation, fault clearance is recommended within one minute; for 133% insulation, one hour is acceptable; for indefinite operation, as long as necessary, 173% insulation is required.
Table 1.4-2. Characteristics of Grounding
Values of the coefficient of grounding (expressed as a percentage of maximum phase-to-phase voltage) corresponding to various combinations of these ratios are shown in the ANSI C62.92 Appendix figures. Coefficient of grounding affects the selection of arrester ratings.
Ground-fault current in percentage of the three-phase short-circuit value.
Transient line-to-ground voltage, following the sudden initiation of a fault in per unit of the crest of the prefault line-to-ground operating voltage for a simple, linear circuit.
In linear circuits, Class A1 limits the fundamental line-to-ground voltage on an un-faulted phase to 138% of the prefault voltage; Class A2 to less than 110%.
See ANSI 62.92 para. 7.3 and precautions given in application sections.
Usual isolated neutral (ungrounded) system for which the zero-sequence reactance is capacitive (negative).
Same as NOTE (6) and refer to ANSI 62.92 para. 7.4. Each case should be treated on its own merit.
Under restriking arcing ground fault conditions (e.g., vacuum breaker interrupter operation),this value can approach 500%.
Under arcing ground fault conditions, this value can easily reach 700%, but is essentially unlimited.
Grounding Point
The most commonly used grounding point is the neutral of the system or the neutral point created by means of a zigzag or a wye-broken delta grounding transformer in a system that was operating as an ungrounded delta system. In general, it is a good practice that all source neutrals be grounded with the same grounding impedance magnitude. However, neutrals should not be tied together to a single resistor. Where one of the medium voltage sources is the utility, their consent for impedance grounding must be obtained.
The neutral impedance must have a voltage rating at least equal to the rated line-to-neutral voltage class of the system. It must have at least a 10-second rating equal to the maximum future line-to-ground fault current and a continuous rating to accommodate the triple harmonics that may be present.
4.Low Voltage System: Grounding
Solidly grounded three-phase systems (Figure 1.4-2) are usually wye- connected, with the neutral point grounded. Less common is the “red- leg” or high-leg delta, a 240 V system supplied by some utilities with one winding center-tapped to provide 120 V to ground for lighting. This 240 V, three- phase, four-wire system is used where 120 V lighting load is small compared to 240 V power load, because the installation is low in cost to the utility. A corner-grounded three-phase delta system is sometimes found, with one phase grounded to stabilize all voltages to ground. Better solution are available for new installations.
Figure 1.4-2. Solidly Grounded Systems
Lightning and Surge Protection
Physical protection of buildings from direct damage from lightning is beyond the scope of this section. Requirements will vary with geographic location, building type and environment, and many other factors (see IEEE/ANSI Standard 142, Grounding of Industrial and Commercial Power Systems). Any lightning protection system must be grounded, and the lightning protection ground must be bonded to the electrical equipment grounding system.
Grounding Electrodes
At some point, the equipment and system grounds must be connected to the earth by means of a grounding electrode system. Outdoor substations usually use a ground grid, consisting of a number of ground rods driven into the earth and bonded together by buried copper conductors. The required grounding electrode system for a building is spelled out in the NEC Article 250.
The preferred grounding electrode is a metal underground water pipe in direct contact with the earth for at least 10 ft (3 m). However, because under- ground water piping is often plastic outside the building, or may later be replaced by plastic piping, the NEC requires this electrode to be supplemented by and bonded to at least one other grounding electrode, such as the effectively grounded metal frame of the building, a concrete-encased electrode, a copper conductor ground ring encircling the building, or a made electrode such as one or more driven ground rods or a buried plate. Where any of these electrodes are present, they must be bonded together into one grounding electrode system. One of the most effective grounding electrodes is the concrete-encased electrode, sometimes called the Ufer ground, named after the man who developed it. It consists of at least 20 ft (6 m) of steel reinforcing bars or rods not less than 1/2 inches (12.7 mm) in diameter, or at least 20 ft (6 m) of bare copper conductor, size No. 4 AWG or larger, encased in at least 2 inches (50.8 mm) of concrete. It must be located within and near the bottom of a concrete foundation or footing that is in direct contact with the earth. Tests have shown this electrode to provide a low-resistance earth ground even in poor soil conditions.
The electrical distribution system and equipment ground must be connected to this grounding electrode system by a grounding electrode conductor. All other grounding electrodes, such as those for the lightning protection system, the telephone system, television antenna and cable TV system grounds, and computer systems, must be bonded to this grounding electrode system.
*Mr. Nikola Zlatanov spent over 20 years working in the Capital Semiconductor Equipment Industry. His work at Gasonics, Novellus, Lam and KLA-Tencor involved progressing electrical engineering and management roles in disruptive technologies. Nikola received his Undergraduate degree in Electrical Engineering and Computer Systems from Technical University, Sofia, Bulgaria and completed a Graduate Program in Engineering Management at Santa Clara University. He is currently consulting for Fortune 500 companies as well as Startup ventures in Silicon Valley, California.
The amount of current available in a short-circuit fault is determined by the capacity of the system voltage sources and the impedances of the system, including the fault. Voltage sources include the power supply (utility or on-site generation) plus all rotating machines connected to the system at the time of the fault. A fault may be either an arcing or bolted fault. In an arcing fault, part of the circuit voltage is consumed across the fault and the total fault current is somewhat smaller than for a bolted fault, so the latter is the worst condition, and therefore is the value sought in the fault calculations. Basically, the short-circuit current is determined by applying Ohm’s Law to an equivalent circuit consisting of a constant voltage source and a time- varying impedance. A time-varying impedance is used in order to account for the changes in the effective voltages of the rotating machines during the fault. In an AC system, the resulting short-circuit current starts out higher in magnitude than the final steady-state value and asymmetrical (due to the DC offset) about the X-axis. The current then decays toward a lower symmetrical steady-state value.
The time-varying characteristic of the impedance accounts for the symmetrical decay in current. The ratio of the reactive and resistive components (X/R ratio) accounts for the DC decay, see Figure 1.3-1. The fault current consists of an exponentially decreasing direct- current component superimposed upon a decaying alternating-current. The rate of decay of both the DC and AC components depends upon the ratio of reactance to resistance (X/R) of the circuit. The greater this ratio, the longer the current remains higher than the steady-state value that it would eventually reach. The total fault current is not symmetrical with respect to the time-axis because of the direct-current component, hence it is called asymmetrical current. The DC component depends on the point on the voltage wave at which the fault is initiated. See Table 1.3-2 for multiplying factors that relate the rms asymmetrical value of total current to the rms symmetrical value, and the peak asymmetrical value of total current to the rms symmetrical value. The AC component is not constant if rotating machines are connected to the system because the impedance of this apparatus is not constant. The rapid variation of motor and generator impedance is due to these factors:
Subtransient reactance (xd“), determines fault current during the first cycle, and after about 6 cycles this value increases to the transient reactance. It is used for the calculation of the momentary interrupting and/or momentary withstand duties of equipment and/or system.
Transient reactance (xd‘), which deter- mines fault current after about 6 cycles and this value in 1/2 to 2 seconds increases to the value of the synchro- nous reactance. It is used in the setting of the phase OC relays of generators and medium voltage circuit breakers.
Synchronous reactance (xd), which determines fault current after steady-state condition is reached. It has no effect as far as short-circuit calculations are concerned, but is useful in the determination of relay settings.
Transformer impedance, in percent, is defined as that percent of rated primary voltage that must be applied to the transformer to produce rated current flowing in the secondary, with secondary shorted through zero resistance.
Therefore, assuming the primary voltage can be sustained (generally referred to as an infinite or unlimited supply), the maximum current a trans- former can deliver to a fault condition is the quantity of (100 divided by percent impedance) times the transformer rated secondary current. Limiting the power source fault capacity will thereby reduce the maximum fault current from the transformer.
The electric network that determines the short-circuit current consists of an AC driving voltage equal to the pre-fault system voltage and an impedance corresponding to that observed when looking back into the system from the fault location. In medium and high voltage work, it is generally satisfactory to regard reactance as the entire impedance; resistance may be neglected. However, this is normally permissible only if the X/R ratio of the medium voltage system is equal to or more than 25. In low voltage (1000 V and below) calculations, it is usually worthwhile to attempt greater accuracy by including resistance with reactance in dealing with impedance. It is for this reason, plus ease of manipulating the various impedances of cables and buses and transformers of the low voltage circuits, that computer studies are recommended before final selection of apparatus and system arrangements.
When evaluating the adequacy of short-circuit ratings of medium voltage circuit breakers and fuses, both the rms symmetrical value and asymmetrical value of the short-circuit current should be determined. For low voltage circuit breakers and fuses, the rms symmetrical value should be determined along with either: the X/R ratio of the fault at the device or the asymmetrical short-circuit current.
Figure 1.3-1. Structure of an Asymmetrical Current Wave
Fault Current Waveform Relationships
The following Figure 1.3-2 describes the relationship between fault current peak values, rms symmetrical values and rms asymmetrical values depending on the calculated X/R ratio. The table is based on the following general formulas:
Where:
I = Symmetrical rms current Ip = Peak current e = 2.718 ω = 2πf f = Frequency in Hz t = Time in second
Based on a 60 Hz system and t = ½ cycle (ANSI/IEEE C37.13.1990/10.1.4)
Figure 1.3-2. Relation of X/R Ratio to Multiplication Factor
Fault Current Calculations
The calculation of asymmetrical currents is a laborious procedure since the degree of asymmetry is not the same on all three phases. It is common practice for medium voltage systems, to calculate the rms symmetrical fault current, with the assumption being made that the DC component has decayed to zero, and then apply a multiplying factor to obtain the first half-cycle rms asymmetrical current, which is called the “momentary current.” For medium voltage systems (defined by IEEE as greater than 1000 V up to 69,000 V) the multiplying factor is established by NEMA® and ANSI standards depending upon the operating speed of the breaker. For low voltage systems, short-circuit study software usually calculates the symmetrical fault current and the faulted system X/R ratio using ANSI guidelines. If the X/R ratio is within the standard, and the breaker interrupting current is under the symmetrical fault value, the breaker is properly rated. If the X/R ratio is higher than ANSI standards, the study applies a multi- plying factor to the symmetrical calculated value (based on the X/R value of the system fault) and compares that value to the breaker symmetrical value to assess if it is properly rated.
In the past, especially using manual calculations, a multiplying factor of 1.17 (based on the use of an X/R ratio of 6.6 representing a source short-circuit power factor of 15%) was used to calculate the asymmetrical current. These values take into account that medium voltage breakers are rated on maximum asymmetry and low voltage breakers are rated average asymmetry. To determine the motor contribution during the first half-cycle fault current, when individual motor horsepower load is known, the subtransient reactance found in the IEEE Red Book should be used in the calculations.
When the system motor load is unknown, the following assumptions generally are made: Induction motors—use 4.0 times motor full load current (impedance value of 25%).
*Mr. Nikola Zlatanov spent over 20 years working in the Capital Semiconductor Equipment Industry. His work at Gasonics, Novellus, Lam and KLA-Tencor involved progressing electrical engineering and management roles in disruptive technologies. Nikola received his Undergraduate degree in Electrical Engineering and Computer Systems from Technical University, Sofia, Bulgaria and completed a Graduate Program in Engineering Management at Santa Clara University. He is currently consulting for Fortune 500 companies as well as Startup ventures in Silicon Valley, California.