Published by Nikola Zlatanov*
Complete Overcurrent Device
Interest in complete overcurrent device selectivity has increased due to the addition of selectivity requirements to articles 700, 701, and 708 of the National Electrical Code (NFPA70). Many users, both commercial and industrial, use fuses and circuit breakers simultaneously. Traditional Time- Current Curve (TCC) analysis is known to not fully communicate fuse selectivity; hence fuse manufacturers publish device ratio guidelines for selection of fuse type and sizes. Recent publications of selectivity tables by circuit manufacturers also demonstrate that traditional TCCs are often insufficient to fully communicate circuit breaker selectivity. Traditional TCCs can lead to incorrect conclusions regarding circuit breaker fuse selectivity, indicating more or less selectivity than may be possible. The authors will describe various methods for assessment of selectivity in systems using both fuses and circuit breakers together, with either device on the line side. The methods will demonstrate that selectivity above what TCCs demonstrate may be possible if devices are selected correctly, and that traditional TCC analysis, can also incorrectly demonstrate more selectivity than a more thorough analysis would predict. The methods lend themselves to analysis that a power system engineer can perform with published information or information that may be requested from manufacturers.
Total Selectivity in Mixed Circuit Breaker and Fuse Systems
In 2005 the NFPA added the following requirement to article 700.27, Emergency Systems, of NFPA 70-National Electrical Code (NEC): “Emergency system(s) overcurrent devices shall be selectively coordinated with all supply-side overcurrent protective devices.” The same requirement was added in the 2005 edition to article 701.18, Legally Mandated Standby Systems and in 2008 to the new article 708.54, Coordination. Though local and state jurisdictions are interpreting these requirements differently, many of the interpretations require that substantial portions of the power distribution system provide complete selectivity up to calculated bolted fault values for both utility and emergency generations sources. Similar requirements have existed previously in NEC article 620.62.
Traditional power distribution system design often ignored selective performance to such high levels of fault current due to considerations of safety, equipment, or conductor protection and the real or perceived difficulty in achieving such high levels of selective behavior. However, the stricter interpretations of the new NEC requirements do not allow for these considerations. Also, in many industrial and critical commercial systems it is not unusual for designers to desire and design for higher levels of selectivity. The more common solutions for complete selectivity are fully fused systems where circuit sizes and fuse types are selected to maximize selectivity, and the use of low-voltage power circuit breakers without instantaneous protection in low- voltage switchgear to achieve better selectivity at the main equipment level. Neither of these solutions may yield the most size- or cost-efficient initial-cost solution nor the best solution from a safety and maintenance perspective, but they may be the only perceived solution for a user designing for maximum selectivity. Furthermore, over the years many existing facilities have accumulated a variety of device types. Increasing interest in arc-flash protection may drive facility engineers to closely scrutinize the protection and selectivity achieved by their existing distribution systems in order to achieve maximum possible protection at the least sacrifice to system reliability.
Conventional Selectivity Assessment Using Time-Current Curves and Fuse Ratios
Traditional assessment of selectivity is based on the use of time-current curve (TCC) overlays. These have proven to be a useful tool to evaluate selectivity over the long-time and short- time operating ranges of the various types of overcurrent devices. For circuit breakers, the curves are also used to document the operation of overcurrent devices in the instantaneous range. However, when overcurrent devices operate faster than about one cycle, the TCC is a limited tool for accurately predicting device behavior. In systems where at least one device can operate in less than one cycle or the devices interact with each other, the RMS-drawn TCC may not be an accurate representation of device performance. When there is device interaction, a time-current curve that predicts how one device operates in isolation may no longer describe how the device operates as part of a system. This is one reason why TCCs are not usually drawn below 0.01 seconds and why coordination studies often reflect the peak or RMS equivalent of the fully asymmetric peak current on the time-current curve.
Molded-case circuit breakers usually are drawn showing instantaneous clearing times of 1.5 cycles or less. Over much of the instantaneous range these devices may be significantly faster than 1.5 cycles and may exhibit current-limiting behavior even if not marked as UL 489 current-limiting circuit breakers. Furthermore, though the TCC may be labeled in RMS amperes, the circuit breaker’s instantaneous trip system may be sensitive to peak amperes. That implies that faults of equal RMS value but different power factors or closing angles will be sensed by the circuit breaker trip system differently. Fuses are energy- based devices and hence they may also be affected by fault current asymmetry.
It is important to understand whether time-coordination studies are designed to determine selectivity or nonselectivity. Protective devices should reliably be as or more selective than indicated by analysis. However, a determination of lack of selectivity need not be as reliable. In other words, devices that seem not to be selective by analysis may be selective under some circumstances, but devices determined to be selective by the same analysis should be reliably selective under all reasonably expected conditions.
Fuse Operation
The UL 248-1 definition of current-limiting fuse is, “A fuse that, within a specified overcurrent range, limits the clearing time at rated voltage to an interval equal to or less than the first major or symmetrical current loop duration; and limits the peak current to a value less than the available peak current.” UL 248, Low Voltage Fuses, defines fuse performance by class including the maximum allowable peak let-through current (Ip), maximum allowable clearing I2t, and the maximum allowable threshold ratio. Threshold current is defined by UL 248 as “The lowest prospective RMS symmetrical current above which a fuse is current limiting.” UL 248 defines threshold ratio as “The threshold current divided by the fuse current rating. ”
Fuses are thermal energy–sensitive devices. If the fuse element reaches its design melting temperature, it will melt. For each fuse design, there is a minimum melting energy that is determined by the element material (typically copper or silver) and by the minimum element cross-section. I2t is a measure of thermal energy under fault conditions represented by equation (1) and defined in section V. Figure 1.1-18 depicts a current-limiting fuse element.

Fig. 1.1-18 Fuse elements.
Fuse minimum melting energy is valid for very short events in the range of 1ms or less, when there is minimal heat loss to the surrounding environment. The higher the available fault current, the faster the fuse element will melt. At lower available fault currents, more time is required to melt the element and hence more energy is required, due to the loss of some heat to the environment surrounding the notch area.
Fuse clearing I2t is equal to melting I2t plus arcing I2t. Fuse arcing I2t is dependent upon numerous external factors, including the instantaneous voltage during the time of arcing, the instantaneous current at the initiation of the arc, and the x/r ratio of the circuit. The type of fault is also a factor, as it will determine the number of fuses clearing the fault. For example, a single fuse clears a line-to-neutral fault, two fuses operating simultaneously clear a line-to-line fault. Under the latter conditions the two fuses share the line-to-line voltage and will yield a lower arcing I2t than if a single fuse were clearing the fault at line-to-line voltage.
Some fuse manufacturers may publish I t melting data. However, that data may not be optimized for use in selectivity analysis. If the melting data are used to determine whether a downstream device will allow enough energy for the upstream fuse to melt, it is important that the melting data furnished be a minimum level, not an average or maximum level. If published data are to be used for selectivity analysis, it is important to know if the data are minimum, maximum, or average for the parameter considered. In time-current curves, tolerance in time and current are demonstrated by the band’s width. When the time-current curve is shown as a line, it must be labeled as either a maximum or minimum characteristic. Other data, such as let-through tables or melt-energy tables, may not clearly identify whether the data are average, minimum, or maximum. All analyses must take tolerance into account.
Fuse Peak Let-Through Current
The di/dt at the initiation of the fault is the primary external factor determining the peak let-through current, Ip, passed by the fuse. Higher di/dt will result in higher peak current let-through. The maximum possible fuse Ip occurs at the maximum prospective fault current. Fuse Ip graphs are readily available from fuse manufacturers. Figure 1.1-19 represents the Ip of a 100 A Class J fuse (AJT100). The uppermost diagonal line, labeled as 2.3x RMS, represents the peak available current, assuming a power factor of 15%. The red line represents the maximum Ip of the AJT100 fuse.

Fig. 1.1-19. Fuse peak let-through.
Assessing selectivity, or the lack of it, between upstream and downstream fuses is common in the industry today. Time- current curves are compared to determine selectivity for events lasting longer than 0.01 s. If a separation is maintained between the total clearing curve of the downstream fuse and the minimum melting curve for the upstream fuse, the fuses are presumed to be selective.
As noted earlier, fuses are capable of melting and clearing in less than one-half cycle; i.e., less than 0.0083s at 60 Hz. Fuse melting and clearing I2t values must be compared to assess selectivity for fuses operating in their current-limiting range. The total I2t of the downstream fuse must be less than the melting I2t of the upstream fuse for selectivity for events lasting less than 0.01s. Fuse manufacturers provide guidelines documenting the minimum ratio in terms of fuse ampere rating that must be maintained between upstream and downstream fuses to assure selectivity under all overcurrent conditions.
Circuit Breakers
Two different types of physical mechanisms may cause current-limiting behavior in circuit breakers. The more limited behavior in most molded-case circuit breakers not designed to optimize current-limiting behavior derives from traditional contact arm construction. Magnetic repulsion forces are created at the point where the contacts touch due to the constriction of current. The constriction is caused by the contact material’s inherent roughness, which leads to conduction at only a few spots on the contact’s surface. As the current flows toward those spots on both contact surfaces, repulsive forces are created across the contacts. Mechanism spring forces should keep the contacts closed for currents within the circuit breaker’s operating range. At currents above the circuit breaker’s maximum instantaneous pickup, the repulsive forces may start to overcome the spring forces and the contacts may part temporarily, causing an arc voltage to develop. This action is called contact popping. The popping will have a current- and energy-limiting effect prior to the contact’s being driven to full opening by the magnetic or electronic unlatching mechanism. Popping does not normally cause contacts to latch open and is power factor and closing angle dependent, so the limitation caused by the popping is not normally shown on circuit breaker let-through curves or time- current curves.
A second design common in circuit breakers specifically designed to be current limiting is the reverse-current loop shown in Figure 1.1-20. In this design, current is routed through parallel contact arms so that opposing magnetic forces are formed. During high fault-current conditions, the magnetic repulsion forces quickly climb to values that force the contacts to overcome the spring forces holding them together, so they part from each other very quickly. This is described as blowing the contacts open.

Fig 1.1-20. Circuit breaker reverse-current loop.
Before the magnetic trip or other instantaneous trip initiates action to unlatch the circuit breaker, the repulsion forces may cause significant popping. The combination of forces acting directly on the contact arms and the instantaneous trip mechanism creates the circuit breaker’s instantaneous and current-limiting characteristics.
Because of these various mechanisms, circuit breakers are sensitive to the peak current and peak energy delivered over the first few milliseconds of a fault. Circuit breakers also limit the energy they allow to flow through the first few milliseconds of a fault and up to complete interruption. This creates the possibility that overcurrent devices above or below a current-limiting circuit breaker will react differently than if the prospective fault current was not being affected by the current-limiting device. The same effect that creates the dynamic system that impairs engineered series-rated systems can create a combination of devices with desirable selective behavior, not evident from traditional time- current curve analysis.
Current-Limiting Fuse Above Noncurrent- Limiting Circuit Breaker
When a circuit breaker does not provide current-limiting behavior, an upstream fuse will be subject to the full magnitude of the fault current for the time shown on the circuit breaker’s time-current curve. For this combination of devices the traditional time-current curve is a suitable analytical tool to determine selectivity. If the fuse curve crosses the instantaneous foot of the circuit breaker curve, it is likely that the pair is more selective than the curve overlay shows, due to the conservative manner in which most circuit breaker curves are drawn. This is particularly true for circuit breakers with high withstand levels above the intersection of the fuse curve and the circuit breaker’s withstand rating. Popping behavior may provide some current- limiting behavior that may help provide additional selectivity.
Noncurrent-Limiting Circuit Breaker Above Current-Limiting Fuse
Many circuit breakers employ magnetic trips or simple digital electronic trips. For this kind of sensing the instantaneous trip may be described as peak sensing. Because they are peak sensing, the trips are sensitive to the peak let-through of the overcurrent device below. Peak-sensing trips are set to the nominal RMS current setting times √2. This comes from the ratio of peak to RMS for a symmetrical sine wave. The analysis to determine selectivity is based on a comparison of the peak let- through current of the downstream device versus the pickup setting of the upstream device in peak amperes, for a given value of available RMS fault current.
Figure 1.1-21 shows a simple system composed of a circuit breaker above a fused switch. The minimum setting for the upstream circuit breaker to reliably predict selective behavior at maximum available fault current is determined from the downstream fuse’s peak let-through characteristics at the expected maximum fault current. Figure 1.1-22 shows the peak let- through current for several current-limiting fuses. The uppermost diagonal line represents the prospective peak current available at the fuse’s 15% test power factor. The lower diagonal line, √2 times RMS, is the range of available instantaneous pickup settings for circuit breakers. If the available bolted fault current (Ibf) at the fuse is 50,000 A, the 200 A class J fuse shown in Figure 1.1-21 will let through a peak current of ~14,000 A. Dividing the peak let-through current by the square root of 2 provides a value of ~10,000 A RMS. If the circuit breaker is set above 10,000 A, the pair will be reliably selective. For a 601 Class L fuse with 62,000 A available, the circuit breaker’s trip setting must be above 22,000 A to reliably maintain full selectivity. These derivations are shown on Figure 1.1-22 by the dashed line pairs drawn vertically up to the peak let-through curves and down from the √2 diagonal line.
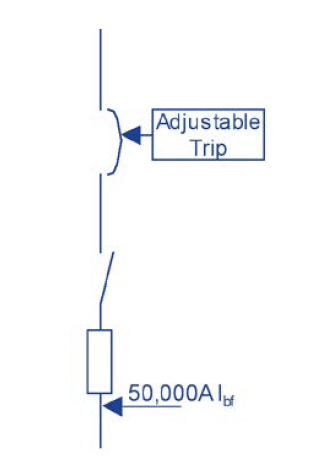
Fig. 1.1-21. Circuit breaker above a current-limiting fuse with 50 kA prospective fault current.
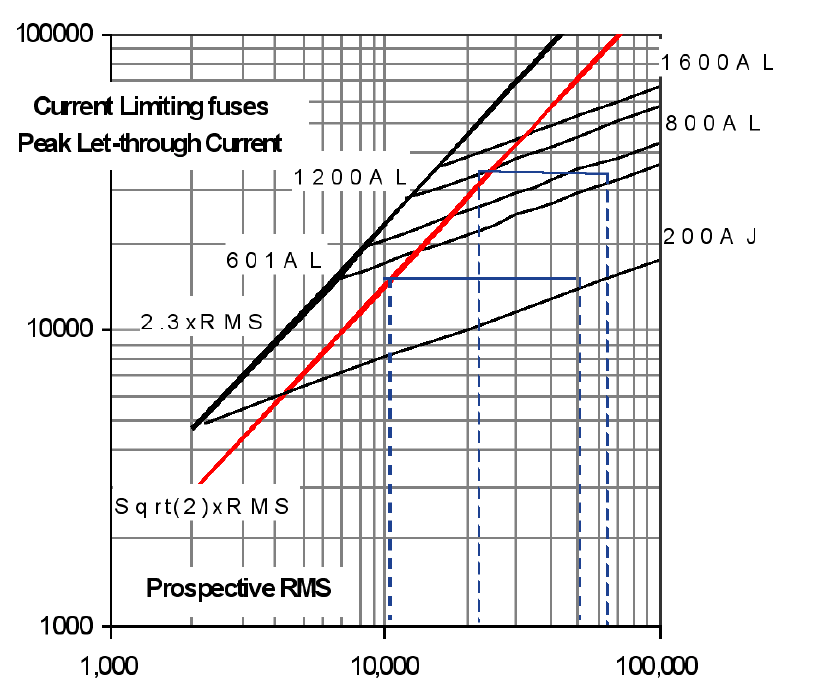
Fig. 1.1-22. Peak current let-through for several current-limiting fuses.
Figures 1.1-23 and 1.1-24 show time-current curves for a 200 A class J fuse under an 800 A circuit breaker. The pair of devices shown is reliably selective up to 50 kA prospective fault current, as shown in Figure 7. This level of selectivity is based on the peak let-through analysis in Figure 5. A simple overlay, such as in Figure 6, may lead to the conclusion that setting the circuit breaker so that the instantaneous trip is higher than the RMS current at which the fuse crosses the 0.01 s axis on the TCC is enough to achieve selectivity. That ignores the fact that the circuit breaker considers peak, not RMS, current and may require very little peak current above threshold to trip. The pair of devices shown in Figure 6 is not reliably selective. The time- current curve is not sufficient to determine selectivity for this pair of devices. An understanding of the interaction between the sensing of the upstream circuit breaker and the downstream fuse’s current-limiting behavior is required. Testing comparing current-limiting and noncurrent-limiting devices has demonstrated that the peak let-through analytic technique is valid for determining selectivity between a current-limiting branch and a noncurrent-limiting peak sensing main.
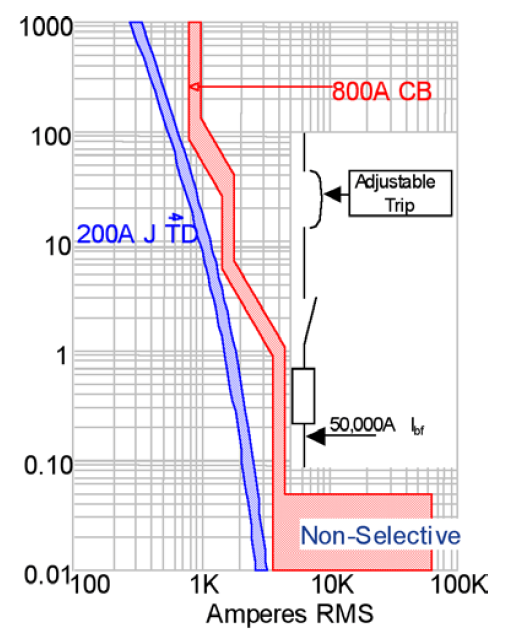
Fig. 1.1-23. Circuit breaker and fuse with nonselective setting.
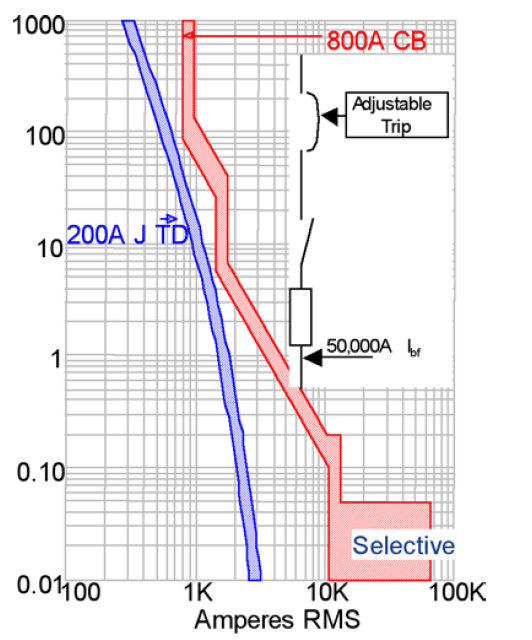
Fig. 1.1-24. Circuit breaker and fuse with selective setting
Current-Limiting Fuse Above Current- Limiting Breaker
Traditional Time-Current Curve Analysis
The ability of current-limiting circuit breakers and fuses to reduce thermal and mechanical stress as well as incident energy during an arc-flash event is well known. However, what is not well known is the selectivity improvement that the current- and energy-limiting performance enables. Efforts to express this have used selectivity tables for circuit breakers and fuse-ratio guidelines for current-limiting fuses. However, there is little information in the industry that indicates what selectivity is possible between these two types of current-limiting devices, other than what may be shown by traditional time-current curve analysis. This section presents the reasons why this selectivity is possible and a technique to evaluate it for circuit breaker above fuse combinations.
Figure 1.1-25 shows an upstream fuse and downstream current- limiting circuit breaker. Overlaying the time-current curve of the current-limiting circuit breaker and the melting time of the fuse is the traditional way to analyze these devices. Figure 1.1-25 also shows the time-current curve overlay for a 1600 A class L fuse and a 250 A current-limiting circuit breaker.
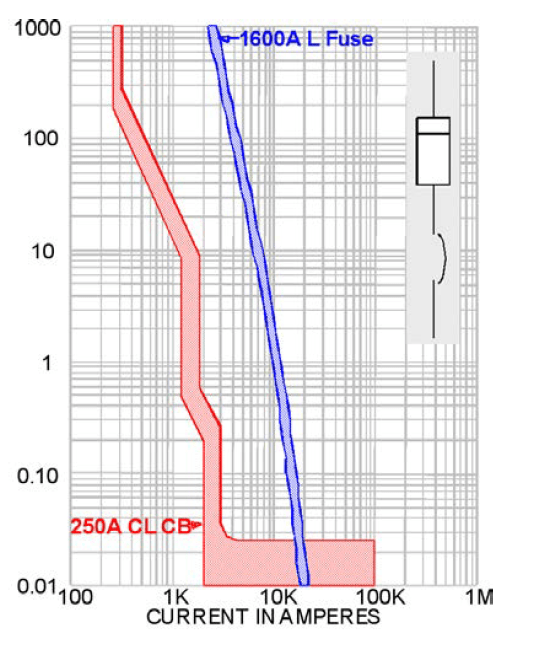
Fig. 1.1-25. Fuse above a current-limiting circuit breaker.
However, this type of evaluation treats the devices as static and independent; there are three dynamic characteristics of the combination that are not considered:
a. It is a series circuit, so any current- and energy-limiting by either device will affect both.
b. The device with the lowest current-limiting threshold and the fastest response will affect the current magnitude available to operate the less sensitive and slower device. The assumption is that the more sensitive and faster device is the downstream device.
c. The faster current-limiting device limits the let-through energy in addition to the let-through current. Because fuses require thermal energy to melt, the limitation caused by the downstream device has a major effect on the response of the fuse.
Current and Energy Limitations
Figure 1.1-26 shows the prospective current and the actual let- through current of the circuit breaker during a fault. As this figure shows, the let-through current and the clearing time are dramatically reduced from the fault’s prospective current. Because the two devices are in series, it is this let-through current that is seen by the fuse, not the full available bolted fault current. This also shows that the clearing time is also reduced to far less that the 0.025 s of the static TCC.
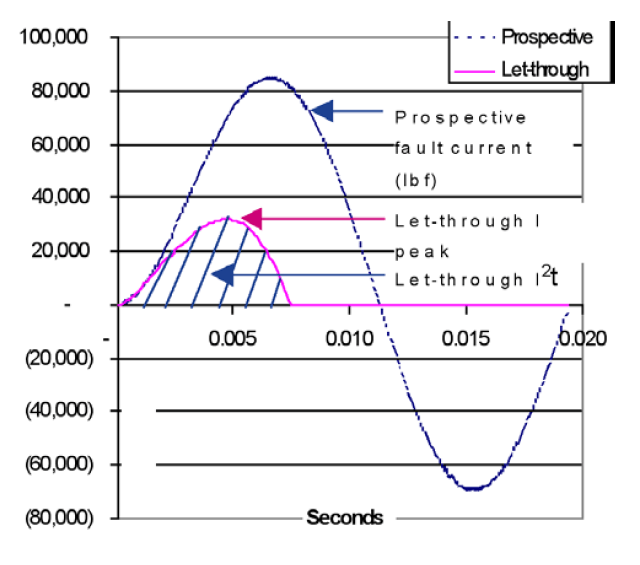
Fig. 1.1-26. Let-through peak and I2t energy waveform.
The thermal energy of this waveform, the area under the curve, is measured by the I2t and is calculated as

where I is in RMS terms and i is the instantaneous current.
As Equation 1 shows, the let-through energy is a function of the circuit breaker’s ability to limit peak current and its ability to limit the length of time the current flows. The energy limitation is a more significant contribution because it is a second-order term. The actual waveforms for three-phase devices interrupting a three-phase fault are more varied and complex. However, they will limit the peak current to values equal to or below that shown on published let-through curves. The actual interruption time may vary significantly and may be slightly longer than one-half of the power cycle. For any one phase, if the current lasts longer the peak will be smaller, if the I2t term does not exceed the maximum I2t defined by the device’s published curve. The current is significantly reduced and, hence, the let-through energy remains low regardless of the interrupting time.
Accounting for the Current Let-Through of the Downstream Circuit Breaker
Because the opening responses of fuses and circuit breakers respond to different system parameters, they are difficult to analyze comparatively. Circuit breaker response is primarily a function of current, while fuse response is primarily a function of thermal energy. Evaluating the device combination requires a technique that includes both variables and their interaction across the spectrum of prospective fault currents. The middle line and table in Figure 1.1-27 are the peak current let-through curve and values for a 250 A current-limiting circuit breaker as a function of the system’s prospective fault current. Because the upstream fuse responds to the reduced current allowed to flow by the downstream circuit breaker, it effectively operates on a smaller prospective fault current than the system’s prospective fault current above the circuit breaker. This is analogous to the way a larger and slower fuse responds to achieve selectivity above a smaller and faster fuse. This reduced let-through current becomes the prospective fault current for the upstream fuse, shown by the lower darker line in Figure 10. After converting the let-through current to a RMS value by dividing by the square root of 2, we may refer to it as the effective RMS current available to the fuse, Ie. A third designation, Isf, is used in the analysis of the devices in series. Isf is the prospective fault current that is required to generate the effective RMS of the series combination.
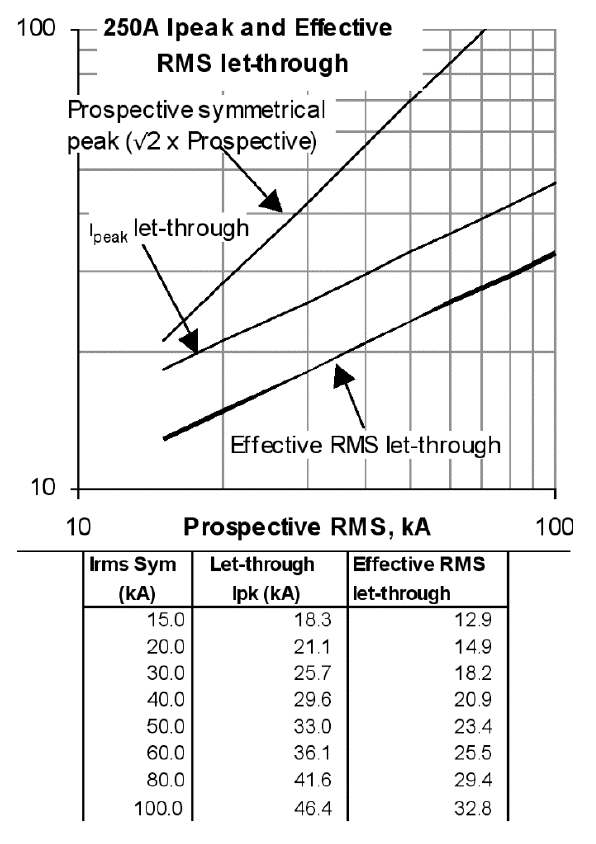
Fig. 1.1-27. Peak and effective let-through current.
The data for Isf are generated, with Isf as the dependent variable and Ie as the independent variable. This may also be considered a reverse let-through curve, with both terms expressed in RMS current, where the RMS prospective is a function of the peak-current let-through by the smaller current- limiting device. The data may be curve-fitted to create the equation for Isf = f(Ie). Equation 2 is the fit of the data.
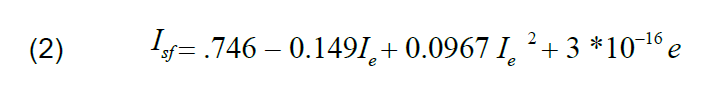
Equation 2 is the system’s available fault current shifted by the peak let-through characteristics of the smaller downstream current-limiting circuit breaker. Equation 2 is used to calculate the larger system fault current needed to produce the RMS prospective current that determines the upstream fuse’s performance. This equation can be used to shift the current axis in an I2t melting curve of the upstream fuse to properly demonstrate the current the upstream fuse will see. It shifts the current of a circuit’s characteristic from the Ibf current to the Isf current needed to create the same let-through. Figure 1.1-28 shows the half-cycle I2t as a function of Ibf and Isf. For example, for the half-cycle I2t to reach a value of 5 million A2s, the bolted fault current has to be 14 kA. But for the I2t to reach the same value in the series circuit, the series circuit available current, Isf, has to be 90 kA.

Fig. 1.1-28. Half-cycle available I2t based on prospective fault current, Ibf, and effective fault current.
Fuse Response to I2t
Fuses respond to the I2t thermal energy flowing through the fuse element. When the I2t thermal energy is sufficient to melt the current-carrying element, the fuse starts to interrupt the fault current. The energy required to accomplish this is called the pre- arc energy or melting energy. Figure 12 shows the minimum melting I2t of the fuse as a function of Ibf and Isf. The I2t melt values are unchanged but are shifted to the effective RMS let-through current Isf. This shifts the melt curve from the bolted fault current to the series fault current.
The fuse will melt at a specific level of energy based on prospective fault current. By shifting the prospective fault current from Ibf to Isf, the “apparent” energy required increases. The fuse’s melt-energy characteristic, inclusive of the current-limiting effect of the downstream circuit breaker, is represented by the fuse-melting energy as a function of Isf. The graph demonstrates that in a system able to deliver a 50 kA bolted fault current, the fuse alone will melt at an I2t of 2.2 million A2s. But in the series combination, which is arrived at by the Isf transform of the current, the fuse apparent I2t melt energy is 2.8 million A2s. This is because for 50 kA available fault current, the downstream circuit breaker will only let through the equivalent of a 23 kA lt.
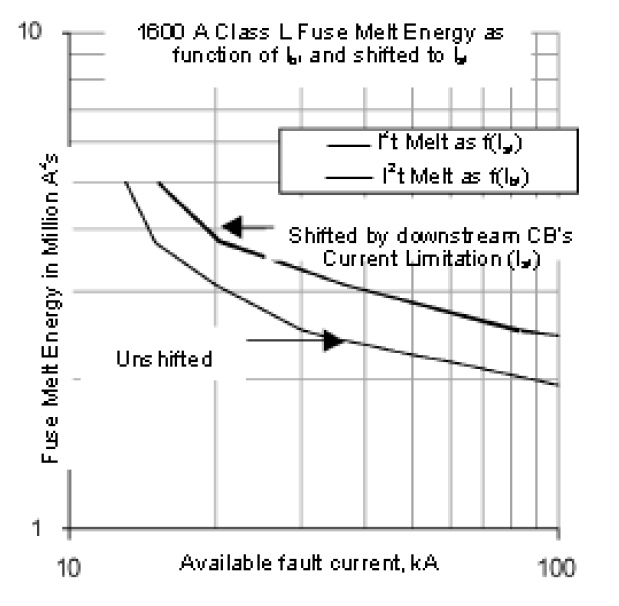
Fig. 1.1-29. A fuse’s required melt I2t as a function of Ibf and Isf.
This analysis is very conservative because the test power factor of the fuse is ignored. Fuses are tested at 15% power factor hence the peak prospective current is 2.31 times the RMS value of prospective current. Dividing the downstream circuit breaker’s peak let-through current by 2.31 instead of 1.41 yields a bigger Isf shift. This may be more in line with the device’s true performance, however it would be a less conservative conclusion.
Circuit Breaker Let-Through Energy and Selectivity Determination:
Because the fuse responds to energy, the circuit breaker let-through energy is used to evaluate the selectivity, not the circuit breaker’s clearing time. Figure 1.1-30 shows the let-through energy of the current-limiting circuit breaker superimposed on the fuse’s shifted and unshifted melt energy. Selectivity may be determined by comparing the circuit breaker’s let-through energy with the shifted melt energy required by the fuse.
The I2t let-through of the circuit breaker is not shifted because the let-through energy is a function of Ibf as perceived by the faster downstream limiting device, in this case the current-limiting circuit breaker. Figure 1.1-30 demonstrates this analysis for a specific combination of a 250 A current-limiting circuit breaker and a 1600 A current-limiting fuse. The analysis demonstrates that these devices should be selective for more than 90 kA prospective fault current. The same two devices demonstrated a potential selectivity of 15 kA based on traditional curve overlay, as shown in Figure 1.1-26 Based on a simple comparison of let-through energy and melt energy, selectivity up to 65 kA may be expected, but when the effect of the effective RMS shift is taken into account, predicted selectivity is over 90 kA.
Combining the shifted fuse melt curve with the circuit breaker let-through curve shows the energy-based selectivity of the combination, including the current-limiting effect of the downstream circuit breaker and the upstream fuse’s response to the limited prospective current it has available. This method provides a more accurate prediction of the selective behavior between a larger upstream current-limiting fuse and a smaller downstream current-limiting circuit breaker. The information used is the current- and energy-limiting characteristics of the circuit breaker and the pre-arc melt energy of the fuse. Fuse manufacturers do not commonly publish the pre-arc melt-energy curves for their fuses, but it may be available upon request.
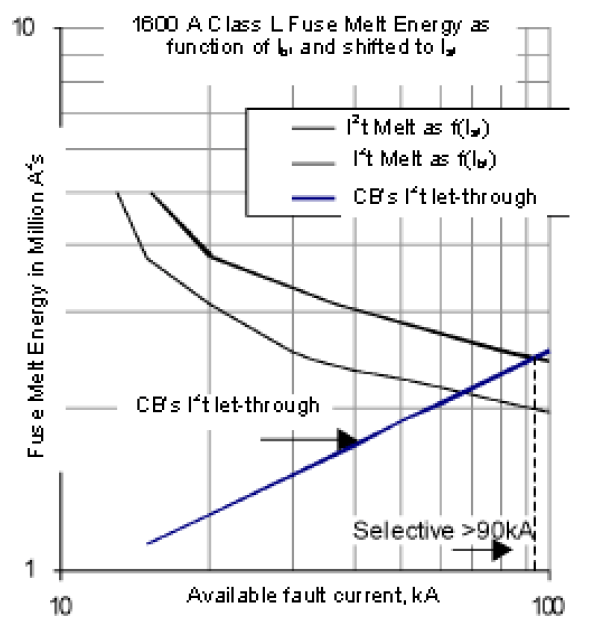
Fig. 1.1-30. A fuse’s required melt energy as a function of Ibf and Ipf and the downstream circuit breaker’s let-through energy.
Noncurrent-Limiting Circuit Breaker Above Current-Limiting Fuse
Advanced current-limiting circuit breakers may have three regions to their instantaneous trip. The leftmost region may be composed of an adjustable electronic trip with an advanced algorithm able to filter narrow-peak let-through currents. The rightmost region is where the circuit breaker contact assembly has enough energy from the fault current to quickly blow the contacts open and keep them open while the trip catches up and latches the mechanism in the open position. The middle transition region is where the circuit breaker contacts may pop or start to open due to magnetic forces, but the circuit breaker still relies on an electronic trip, magnetic trip, or other mechanical trip to fully open and unlatch the circuit breaker.
Figure 1.1-31 demonstrates the three regions in a 600 A circuit breaker with an adjustable advanced-algorithm electronic trip. The device shown uses an algorithm designed to filter narrow-peak let-through currents and hence may be set below the peak let-through of a downstream current-limiting device. The filtering algorithm section is identified by the gap below the curve. The flat-topped instantaneous portion between the adjustable section and the beginning of the sloped portion includes a region where the circuit breaker may trip because of the electronics or the mechanical trip mechanism. Which mechanism causes the circuit breaker to open depends on the closing angle, voltage, fault-current X/R ratio, and let-through characteristics of a downstream device that may be limiting fault current. The sloped portion to the right is the truly current-limiting portion of the curve. The clearing time is not material, as the circuit breaker may allow minimal current to flow for a few milliseconds, but the peak current and energy are limited regardless.
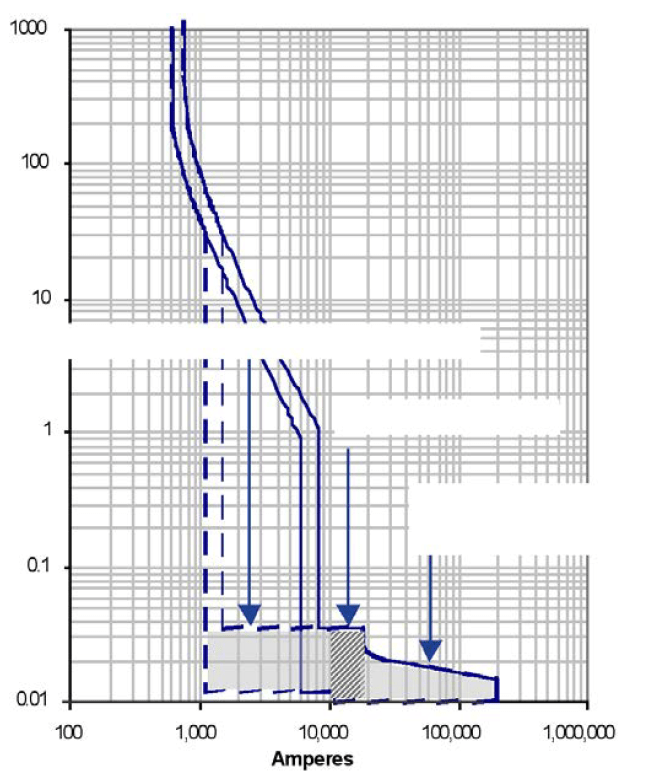
Fig. 1.1-31. TCC for a current-limiting molded-case circuit breaker showing separate regions for current limiting and filtering electronic tripping.
The trip system in the circuit breaker responds to both peak current and energy. Once the peak current is over the threshold, there has to be enough energy to move the trip mechanically to unlatch the breaker mechanism. In some breaker designs, the mechanical system is intentionally damped to reduce the sensitivity of the trip. This creates a portion of the fault current range for which the circuit breaker will not commit to a trip for a limited amount of time. With an understanding of how the trip operates, the circuit breaker can be analyzed as an energy- driven device over the range of fault currents. The shape of the curve drawn in Figure 1.1-31 is intended to alert the user that the circuit breaker behaves this way, but does not provide sufficient information for a complete selectivity analysis to be made. However the manufacturer will have sufficient information to perform selectivity analysis and generate selectivity tables for specific pairs of current-limiting devices where the downstream device may be a fuse or a circuit breaker, regardless of how the curve is drawn.
The analytical technique for determining selectivity for current-limiting circuit breakers above fuses is similar to that for fuses above circuit breakers. The analysis must be divided into two regions. In the leftmost region, the electronic trip filters the single peak allowed to flow by a current-limiting downstream device. The rightmost region represents the mechanical portion of the trip that may be analyzed as a pure energy device.
Figure 1.1-32 shows the commit energy representation for a molded-case circuit breaker with a waveform-recognition electronic trip and a mechanical trip. The flat section to the left is equivalent to two half-cycle sine waves at the threshold peak. This can be used to represent the peak filter algorithm in energy terms. The rising slope is a representation of the circuit breaker mechanical trip’s required commit energy. This is a simplification of the actual required energy, but it is sufficient to provide the required analytical tool. Note that the time the fuse takes to open is not part of the analysis. It is the energy the fuse lets through in the process that matters.
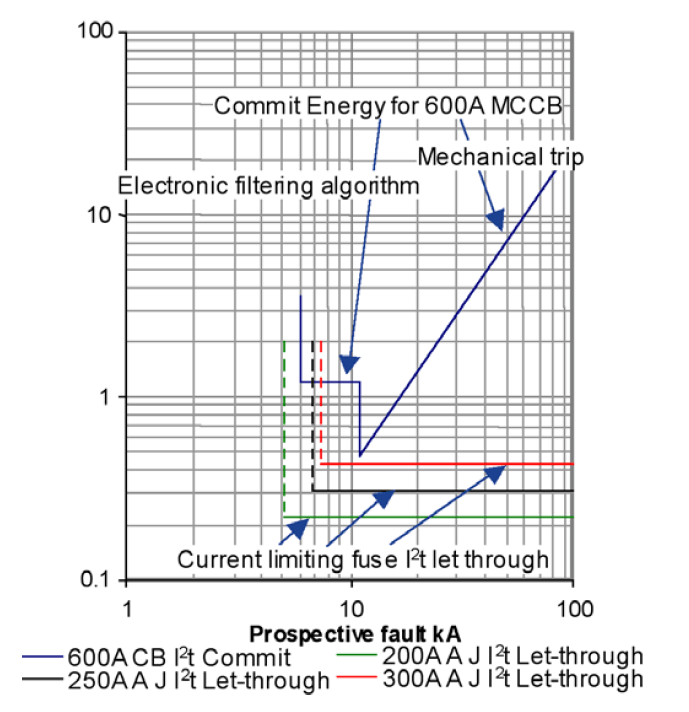
Fig. 1.1-32. Fuse let-through I2t and the circuit breaker’s I2t requirement.
Before the circuit breaker’s energy-based current-limiting region can be considered, the circuit breaker’s instantaneous trip must be set above where the fuse is reliably current and energy limiting for a three-phase event. The three horizontal lines represent the let-through I2t for three different sizes of class J fuses in a 480 V system. All three let less energy through than the circuit breaker’s mechanical system needs to commit. For high-level faults, all three fuses are probably selective with the circuit breaker’s mechanical system. However, in this case the potential overlap in the curves is at lower current levels. The three-phase behavior of the fuses in this region is typically not fully defined. Traditionally, the data of interest were for the highest available fault. Only the 200 A fuse, which is energy limiting at ~5000 A, meets the criterion of being reliably current limiting under the 6000 A threshold of the electronic trip. This energy-limiting threshold varies based on system voltage and is higher at 600 V. Fuse manufacturers commonly publish peak current let-through curves for their circuit breakers. However, this analysis requires the fuse manufacturer to provide the energy let-through value for the fuse at the application voltage and over a range of fault currents. This is typically constant energy after some prospective current level. Fuse manufacturers may be able to provide these data upon request.
Test Results
Upstream Fuse, Downstream Current-Limiting Circuit Breaker
Tests were designed to confirm that a current-limiting fuse provides selective protection above a current-limiting circuit breaker, as shown in Figure 1.1-30. The example analysis shown previously indicated that a 250 A current-limiting molded-case circuit breaker should be selective with a 1600 A class L fuse.
The overlay of characteristics shown in Figure 1.1-30 demonstrates that potential lack of selective performance occurs at high fault currents in the range of 90 to 100 kA. Without shifting the fuse melt-energy curve by the transform of the circuit breaker’s let- through, peak current selectivity may be limited to 65 kA. With the curve shift, selectivity should be at least 95 kA. Three-phase short-circuit tests where performed at 100 kA with a 20% power factor. Ten tests were done at various closing angles (closing angle is a measurement of the angular difference between when the fault is initiated and the voltage on phase A of the test circuit). In all ten cases the circuit breaker interrupted with no apparent damage to the fuse. Impedance tests on the fuses pre and post testing indicated no changes in fuse resistance.
Upstream Circuit Breaker, Downstream Fuse
A second set of tests was performed with a 600 A current- limiting circuit breaker on the line side of 200, 300, and 400 A class J time-delay, current-limiting fuses. This combination is shown in Figure 1.1-32. These particular combinations of devices show potential lack of selectivity at relatively low fault currents, where the fuse’s let-through current must be filtered by the circuit breaker’s electronic instantaneous trip. Sufficient data were not available from the fuse manufacturer to model fuse performance in the area around the fuse’s current-limiting threshold at 480 V. Hence, testing in this range of fault current was required. A total of 14 different tests were performed with the 200 A fuse at fault currents from 5 kA to 100 kA, at 20%– 50% power factor, and at various closing angles. In all cases, two or more fuses cleared properly and the circuit breaker did not trip. Some limited additional testing was performed with 300 and 400 A fuses at various low and high fault values. In all cases the fuses cleared properly and the circuit breaker did not trip. Though insufficient tests were performed with the larger fuses to make a definite determination, it is anticipated that the circuit breaker would be selective with fuses as large as 400 A.
Conclusions
The various techniques described provides methods for analyzing the selective capability of fuses and circuit breakers in systems in which either may be used above the other. Traditional time-current curve analysis is not sufficient for some of the combinations of devices, but other analyses based on an understanding of the let-through characteristics of the downstream device and the commit behavior of the upstream device, regardless whether either is a fuse or circuit breaker, allows insight into how the system of devices will operate. Understanding the system operation allows selection of the optimum assessment methods for every combination. Some of the analyses may be performed with published information, while others require more detailed understanding of the operation of both fuses and circuit breakers.
The analysis techniques presented here and the preliminary test validation of these techniques illustrate three important advancements in selectivity evaluation. First, that the limiting performance of downstream devices can be included analytically in selectivity studies. The traditional static time evaluation excludes this dynamic downstream limiting characteristic resulting in perceived selective or unselective results that are incorrect. Second, nontraditional measures, such as peak currents and I2t, can reliably be used to perform selectivity studies rather than solely using time. Third and most important, the limiting and trip-commit behavior of devices developed individually can be analytically combined for series combinations. This enables analysis of the series performance of the near-infinite combinations of upstream and downstream devices. The demonstrated methods can provide the industry with provable techniques to improve analysis of system reliability and protection using devices and information available to the industry today.
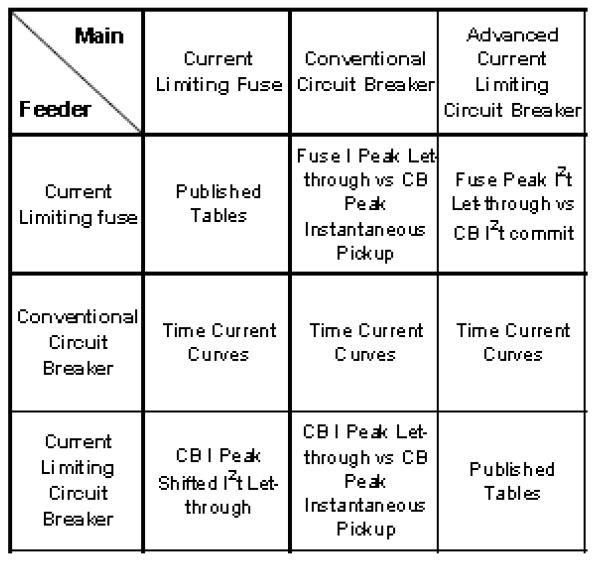
Fig. 1.1-33 Table of suggested assessment method versus line and load side device type
Manufacturers may have access to the detailed information and may be able to provide it to the interested user, or may be able to perform the analysis directly for the user interested in specific combinations. In either case, there are methods to move the industry past traditional analytical techniques that are not reliable in every case. And new techniques can be used to provide more reliable analyses, resulting in better protected, and more reliable power distribution systems.
*Mr. Nikola Zlatanov spent over 20 years working in the Capital Semiconductor Equipment Industry. His work at Gasonics, Novellus, Lam and KLA-Tencor involved progressing electrical engineering and management roles in disruptive technologies. Nikola received his Undergraduate degree in Electrical Engineering and Computer Systems from Technical University, Sofia, Bulgaria and completed a Graduate Program in Engineering Management at Santa Clara University. He is currently consulting for Fortune 500 companies as well as Startup ventures in Silicon Valley, California.

Hi my loved one! I want to say that this post is awesome, nice written and include almost all significant infos. I would like to look extra posts like this .
LikeLike