Assessing Power System Quality using Signal Processing Techniques
Published by Math H.J. Bollen1, Irene Y.H. Gu2, Surya Santoso3, Mark F. McGranaghan4, Peter A. Crossley5, Moisés V. Ribeiro6, and Paulo F. Ribeiro7
Source: IEEE Signal Magazine, 2009
Signal processing has been used in many different applications, including electric power systems. This is an important category, since a wide variety of digital measurements is available and data analysis is required to deliver diagnostic solutions and correlation with known behaviors. Measurements are taken at numerous locations, and the analysis of data applies to a variety of issues in
- power quality (PQ) and reliability
- power system and equipment diagnostics
- power system control
- power system protection.
This article focuses on problems and issues related to PQ and power system diagnostics, in particular those where signal processing techniques are extremely important. PQ is a general term that describes the quality of voltage and current waveforms. PQ problems include all electric power problems or disturbances in the supply system that prevent end-user equipment from operating properly. Examples of voltage and current variations that can result in PQ problems include voltage interruptions, long- and short-duration voltage variations, steady-state harmonics and inter-harmonics, and transient electromagnetic disturbances. There are many different types of equipment used to capture and characterize PQ variations—PQ monitors, digital fault recorders, digital relays, various power system controllers, and other intelligent electronic devices (IEDs). Signal processing techniques are used in the recording of PQ variations as well as the analysis of events and conditions. This article creates an awareness of PQ issues in the signal processing community and provides an overview of the signal processing techniques that can be used to understand and solve the PQ problems experienced in the power systems community.
MOTIVATION AND ISSUES OF INTEREST
PQ RESEARCH
Research in PQ has traditionally been motivated by the need to supply distortion- and disturbance-free voltages to the end-user loads [1], [2] so that these loads operate properly. Voltage and current disturbances in the power system are a normal part of system operation, but these disturbances can cause incorrect operation of customer equipment. Characterizing these incompatibilities requires an understanding of the disturbances themselves and their possible impact on customer equipment. Devices to measure and characterize the disturbances (PQ monitors) have been widely used and have helped create new research opportunities that use the measured voltages and currents to indicate possible equipment and system problems (referred to as equipment diagnostics).
To further develop applications in both power quality and diagnostics, research activities have been focused on
- the need for simple, fast, and efficient characterization of
- the voltage and current variations that can affect sensitive customer equipment
- the processing of voltage and current variations to understand how electronic equipment can be a source of waveform distortion (e.g., “transients” and “harmonics)
- the need for continuous, online monitoring of power line signals in order to classify the precise disturbance type and possibly identify the source of the disturbance
- the development of PQ monitoring instruments that not only capture disturbances but also distinguish between events and variations and can apply the appropriate processing to those measured signals that contain events
- the processing of voltage and current waveforms to correlate with equipment and system problems (such as insulator failures, cable failures, splice failures, and tree contacts)
- the processing of voltage and current waveforms to locate the source of variations or events (e.g., the cause of harmonics or the location of the fault).
Such requirements may involve sophisticated signal processing techniques that make use of signal decomposition, modeling, parametric estimation, and identification algorithms [3]–[6].
PQ VARIATIONS AND EVENTS
The operational voltage waveform in an ac utility power system has a nearly sinusoidal shape with a stable magnitude and nominal frequency (50 Hz or 60 Hz). For low-voltage equipment, the nominal voltage is 120 V in North America and 230 V in Europe. The current waveform reflects the system voltage and the load characteristics. For a balanced three-phase power system, there is about 120º difference in the phase between any two voltages or currents. The ideal case, designed for the optimal use of resources, is to have the frequency and voltage equal to the nominal values and a constant current in phase with the voltage. In the ideal case, voltages and currents are both sinusoidal.
However, actual voltage and current waveforms usually deviate from their nominal values. If the parameters (e.g., magnitude and frequency) are time-varying and deviate from their nominal values, it is referred to as a voltage variation (or a frequency variation). Any power problem that is manifested in voltage, current, or frequency deviations and results in the failure or incorrect operation of customer equipment is a PQ problem. PQ disturbances consist of two different types: PQ variations and PQ events (or events and variations for short) [6]. These two types require different types of processing.
PQ variations are small and gradual deviations from the nominal voltage. A few previously mentioned disturbances, such as waveform distortion, voltage variations, and frequency variations, are examples of PQ variations. Other examples are three-phase unbalance (deviation from the ideal phase angles and/or ideal magnitudes in a three-phase system) and voltage flicker (changes in voltage magnitude at a subsecond time scale, leading to light flicker in incandescent lamps). In what follows, one may notice that our definitions of particular PQ variations are strongly related to the way that the disturbances are quantified. Most PQ disturbances are related to minor deviations.
In some cases, however, large deviations occur in the voltage or current waveforms. Such PQ disturbances are called PQ events. The most severe and best-known example of a PQ event is a supply interruption or outage, in which the voltage is zero for longer than a few seconds. Other examples are voltage dips (a reduction in voltage magnitude that lasts between several tens of milliseconds and several seconds) and a voltage transient (a significant deviation from the sinusoidal waveform with a duration of less than about 10 ms).
It is worth noting that processing events and variations requires different signal processing techniques. Before discussing new approaches for signal processing in these applications, a review of existing techniques is given.
RESEARCH IN PQ HAS TRADITIONALLY BEEN MOTIVATED BY THE NEED TO SUPPLY DISTORTION- AND DISTURBANCE-FREE VOLTAGES TO THE END-USER LOADS.
CHARACTERIZATION OF PQ VARIATION
Most PQ variations are characterized by computing waveform features over a predefined time interval. Examples of standardized time intervals are 200 ms, 3 s, 1 m, 10 min, and 2 h.
An international standard (IEC 61000-4-30 [7]) exists that prescribes the way in which features are calculated, including the time interval over which these features are calculated. For example, voltage magnitude variations are quantified by the root mean square (rms) voltage calculated over a 200-ms window (or more precisely, ten cycles of the fundamental frequency in a 50-Hz system and 12 cycles in a 60-Hz system). Voltage unbalance, waveform distortion, and flicker are calculated over the same interval. For each time interval of data, the calculated features correspond to a voltage variation, unbalance, or some other type of variation in the specified time interval. However, many types of PQ variations can be present at the same time and cannot be separated. New variations are defined by introducing new features or combining existing features. A well-known example is flicker severity, which combines the calculated weighted average of voltage magnitude and its calculated change over the frequency range from 1 to 30 Hz. This results in a measure of flicker perceived by the human eye when this type of voltage fluctuation is applied to an incandescent lamp. The flicker severity measured over each 200-ms interval is then combined to yield values associated with a longer interval, e.g., one week or even one year.
Another example of PQ variations is the distortion of voltage or current waveforms by the introduction of harmonics and inter-harmonics. This type of distortion is often caused by certain loads that have nonlinear voltage-current characteristics (electronic equipment with power supplies is a classic example). Classic symptoms of harmonics are distorted voltage waveforms, transformer overheating, and blown capacitor fuses. Distortion that is not at integer multiples of the fundamental frequency is also possible for certain types of loads (e.g., arc furnaces and cyclo-converters); this type of distortion is referred to as interharmonics. Inter-harmonics are often difficult to quantify since they have rather low magnitude and tend to drift over time. They affect systems that are prone to resonance, especially those with low damping or a high Q factor.
The definition and computation of PQ variations are well standardized and documented [7]–[9]. Although there are many opportunities for additional applications in processing these variations, the main focus of this article involves measuring, characterizing, and analyzing PQ events. The methods for processing the quasi-stationary segments of PQ events, to be discussed in a later section, can also be used for processing PQ variations.
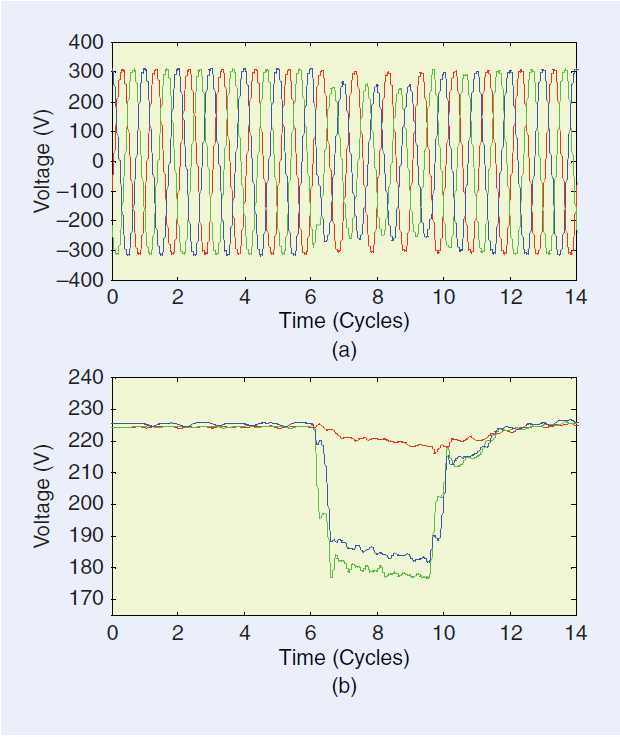
[FIG1] Typical example of a voltage-dip event due to a fault:
(a) waveforms of the three phase-to-neutral voltages and
(b) rms voltage as a function of time, measured in a 230-V network.
CHARACTERIZATION OF PQ EVENTS
The characterization of PQ events usually takes place in two stages. The first stage, referred to as triggering or event detection, is concerned with detecting the instant in time or triggering point at which an event starts. This stage distinguishes between a large and small deviation from the ideal voltage waveform. The second stage is characterization, in which the severity and duration of an individual event is quantified.
The characteristics of voltage dips, swells (short-duration increases in voltage magnitude), and interruptions are defined in the international standard on PQ measurements [7]. For example, in a voltage dip event (i.e., a drop in voltage magnitude), the voltage magnitude is quantified by the timedependent rms magnitude values: Each rms value is calculated from a one-cycle window of data where one cycle of power-system frequency is equal to 1/50 or 1/60 s. The process is repeated after shifting forward the data window with a half-cycle overlap. Once the rms magnitude values drop below a predefined threshold (often set as 90% of the nominal voltage), a voltage dip is detected. This detection often triggers additional operations (e.g., storage of the waveform over a certain time duration). Hence, triggering often refers to detecting the start (or end) of an event. A dip is typically quantified using one voltage value (or “magnitude”) and one duration value. Figure 1 shows the waveforms of a voltage dip event and the corresponding rms curves. The three colors correspond to the three phase-to-neutral voltages in a three-phase system. Note the difference in magnitude for the three voltages, the sharp drop and rise of the voltage magnitude, the slow decay in magnitude in between the sharp changes, and the slow recovery after the sharp rise. The sharp drop in voltage magnitude corresponds to the initiation of the fault; the sharp rise corresponds to the clearing of the fault.
Triggering and characterization of transients are usually more complicated. So far, there are no international standards for this. Figure 2 gives an example of a transient voltage event measured in a three-phase system. The event shows a sudden initiation, oscillations with the same frequency but different amplitude in the three voltages, and a slow decay without a clear ending instant.
The definition of events for currents is somewhat more complicated, as the current magnitude changes over a much wider range of values than that of the voltage. However, once appropriate triggering methods are chosen, the definition of current events is straightforward. An overcurrent (i.e., when the current magnitude exceeds a predefined percentage) is an example of a current event. When an event trigger is detected, it is normal practice to record both the voltages and currents associated with the event since these quantities are very interrelated.
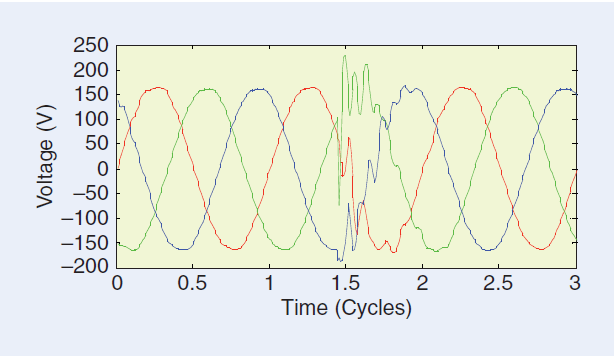
[FIG2] Example of a transient event measured in a 120-V network. This is a typical example of a capacitor-energizing transient.
EVENT DETECTION AND SEGMENTATION
AIM OF DETECTION AND SEGMENTATION
The first step in characterizing a PQ event is the detection of the event. This involves triggering (i.e., determining the starting and ending points). Event segmentation can then be used to partition the event into segments. Two types of event segments are usually determined, transition segments and event segments. Since the triggering points are closely related to the segment boundaries, event detection and event segmentation can be treated as two aspects of a single issue from a signal processing viewpoint, even though their applications and the manner of their implementation can be very different. In power system applications, event detection is often used for online triggering of a recording and thus for capturing the event. On the other hand, event segmentation usually takes place afterwards, during further analysis of the captured recording. Event detection can also be important for power system protection applications, where an event type is recognized in real time and the necessary steps are taken to isolate the area experiencing the event from the rest of the system or other remedial actions are performed.
An important issue for event detection and segmentation is the time resolution used for the estimation. Most detection and segmentation methods require some signal samples or a window of samples (e.g., for calculation of rms quantities or to apply bandpass filters) for estimating starting and ending points (the boundary points of the segment). Hence, there is an uncertainty in a detected point within a certain time interval, which is governed by the uncertainty principle. Roughly put, the longer the data window, the lower the time resolution for the detected points.
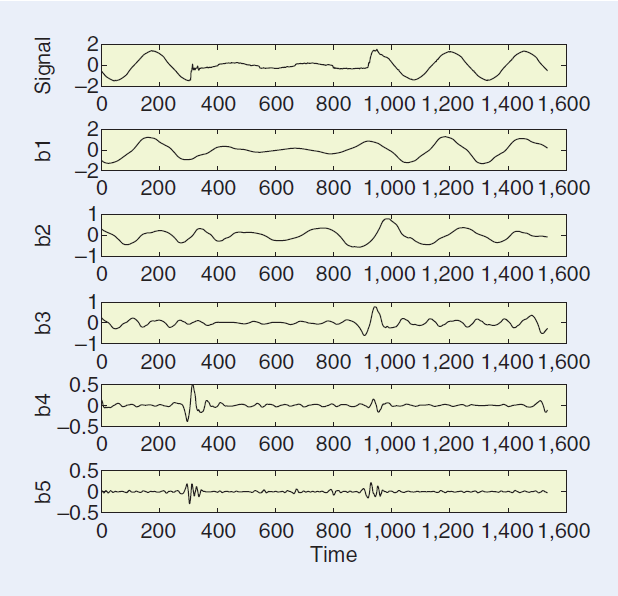
Detection and segmentation of events from signal waveforms is related to finding the quasi-stationary and nonquasi-stationary (or nonstationary, for short) part of the signals at a given time scale. The part of the signal before the nonstationary portion consists of either variations or nominal signals. Once the signal becomes nonstationary, further analysis needs to be performed. It is also worth noting that a signal that is nonstationary at a longer time scale could contain several quasi-stationary segments at a shorter time scale. For example, in Figure 3, the signal from cycles 5–25 is nonstationary in terms of a long time scale, but the signal from cycles 6–15 is quasi-stationary in a shorter time scale. For event segmentation, one is interested in finding nonstationary parts at a shorter time scale.
Event segmentation [10] consists of breaking an event into transition segments and event segments. In signal processing terms, segmentation is related to finding groups of data segments that possess similar properties. This is rather similar to image segmentation, in which an image is partitioned into several homogenous regions, and speech segmentation, in which a speech signal is divided into vowels and consonants. Event segmentation aims at partitioning the signal into quasi-stationary parts and nonstationary parts based on the physical state of the power systems. A transition segment is a segment where the signal is nonstationary, e.g., where there is a change in voltage or current magnitudes between two steady states. The duration of an estimated transition segment depends on the segmentation method applied. The transition segment should in all cases include the instant at which a change between two steady states takes place. The interval between the two nearest transition segments is an event segment, where the signal is quasi-stationary. The quasi-stationary segment before the first transition segment is a pre-event segment, while the quasi-stationary segment after the last transition segment is a post event segment. Transition segments are typically related to events or actions in the power system such as fault initiation, developing fault, fault clearing, and opening or closing of switches (to switch a line, transformer, capacitor, or other element). In Figure 3, the transition segments correspond to fault initiation, fault development to a three-phase fault, fault clearing by the circuit breaker on one side of the faulted line, and fault clearing by the circuit breaker on the other side of the faulted line.

[FIG3] Example of event segmentation from a voltage waveform recording. The segmentation results in a detected time interval (from 4.8 to 25 cycles), consisting of four transition segments (marked in yellow) and three event segments between the pairs of transition segments. Further, the segment before the first transition segment (the pre-event segment), and the segment after the last transition segment (the postevent segment) are segments related to the nominal states; they are thus excluded from the segmented event.
METHODS OF DETECTION AND SEGMENTATION
As mentioned before, triggering and segmentation both involve the detection of a deviation from the quasi-stationary character of a voltage or current signal. Therefore, the same kind of signal processing tools are used for segmentation and for triggering. The segmentation of an event is equivalent to finding transition segments. Three basic approaches exist for detecting transition segments [6].
■ The first approach, containing the simplest methods, involves calculating a number of time-dependent waveform features, typically the time-dependent rms voltage and current magnitudes. The transition segments are then detected by comparing the change in magnitude with a predetermined threshold. Although this method only requires simple signal processing, it turns out to be remarkably efficient for most measurement recordings. The triggering method employed for voltage dips, swells, and interruptions, in the vast majority of existing instruments, uses the rms voltage.
■ The second approach is to use high-pass or bandpass filters, followed by detecting step changes or oscillations. An event in a power system often results in a fast change in voltage (or current) and high-frequency oscillations. A high-pass filter can be used to detect such changes and oscillations. Many studies have been conducted, especially using wavelets, and are common in the literature. Wavelet filters are known to be effective in detecting multiscale singular points, and triggering points are usually related to significant sudden changes or singularities in the signal waveform. Since wavelet-filtered signals show all multiscale singular points of a signal waveform, some postprocessing is required to identify the triggering points (i.e., the starting and ending points). An advantage of using wavelet filters is their ability to automatically find the best resolution scale for detecting the triggering points (see the example in Figure 5). However, there is no reason to restrict this approach to the use of wavelet filters, as other high-pass filters may perform equally well for detection or segmentation. An analog or digital high-pass filter is typically used in existing instruments to detect transients.
■ The third approach makes use of parametric methods, where a signal model (e.g., a damped sinusoidal model or autoregressive model) is used. Depending on the algorithms used, a recorded data sequence may be divided into blocks, and the model parameters in each block may be estimated. This can be accomplished using estimation of signal parameters via rotational invariance techniques (ESPRIT), multiple signal classification (MUSIC), or autoregressive (AR) modeling. Alternatively, iterative algorithms may be used without dividing data into blocks (e.g., using Kalman filters). The so called residuals (model errors), which indicate the deviation between the original waveform and the waveform generated by the estimated model, are then calculated. As long as the signal is quasi-stationary, the residual is small; however, for a sudden change in the signal, e.g., a transition, the residual values become large. Residual values can therefore be used to detect transition segments. Each of these methods has advantages and disadvantages.
An important requirement for further study is to evaluate and compare the performance of different methods for real disturbance recordings. It is important to realize that the final aim is to detect the instant at which a change in the power system takes place. The different methods should therefore be evaluated for their ability to correctly detect and localize these changes; they should be compared in terms of time resolution, the detection rate, and the false alarm rate of the detected points. The classic tradeoff between the detection rate, false alarm rate, and time resolution may play an important role here.
EVENT CHARACTERIZATION
It is worth emphasizing that the basic purpose of event characterization is to find common features that are likely to be related to specific underlying causes in power systems. It is not difficult to detect the occurrence of an event, e.g., a voltage dip, from the signal waveform; however, finding the underlying cause of a dip (whether it results from faults, transformer energizing, or some other phenomenon) is the main aim in event characterization. Thus, event characterization is directly related to event analysis and feature extraction.
It is important to distinguish between the characterization of event segments (where signals are quasi- stationary) and the characterization of transition segments and transients
(where signals are nonstationary). From the signal processing viewpoint, characterizing event segments is related to analyzing and extracting features from quasi- stationary signals, an area for which general signal processing theories, methodologies, and algorithms are relatively well established. Event characterization requires joint efforts from the power engineering and signal processing communities, with the former providing specific knowledge about power systems, types of events, and their most relevant features and the latter developing automatic methods. Characterizing transition segments and transients, however, is related to analyzing nonstationary signals, an area where most signal processing research is still limited to finding solutions to specific problems; knowledge of and insight into the power system is also limited. Later in this article we shall briefly review some methods that are used for analyzing and characterizing transition segments (transients). We will then review the state-of-the-art signal processing methods currently used in power engineering research for the analysis and characterization of event segments (the quasi-stationary part of the event). These methods can also be applied to PQ variations that are quasi-stationary in nature.
TRANSIENTS AND TRANSITION SEGMENTS
Research on the analysis and classification of power system transients is still developing. Even though the analysis and characterization of transition segments has not been a major
area of focus, it will be critical for event analysis and underlying cause identification. The limited research is mainly due to short data lengths, a lack of understanding of the underlying power system changes, and the lack of generic nonstationary signal processing methods. Advancements in measurement equipment and data management are dramatically increasing the availability of transient events for analysis. This should spur increased development of analytical tools so this data can be used for the intelligent management of the power system, which means being able to automatically process and classify these events.
There are many different types of transients. However, many of them still must be analyzed and understood before appropriate mathematical models can be applied. Challenges for power system experts include 1) understanding and interpreting the high-frequency band of the disturbances, especially distinguishing whether the high-frequency band of the signal was caused by a power system disturbance or by interference from the measurement environment, and 2) modeling power system behavior during fast transitions by using circuit theory and power system modeling. Unfortunately, only a small portion of transients could be modeled up to now (e.g., damped sinusoids). One example of this type of model is that developed for capacitor switching transients. The solution, however, is still constrained by the condition in the signal processing model: when the ESPRIT or MUSIC technique [11] is used, it requires that all sinusoids be present throughout the entire data window under analysis. If sinusoidal components start from different time instants, the algorithm may yield some frequencies that are not related to the corresponding power system event [12]. Obviously, more research and modeling are needed for power system transient analysis. The ESPRIT and MUSIC methods will be discussed in a later section, as they have also been applied to the analysis of quasi-stationary segments.
SIGNAL PROCESSING METHODS FOR QUASI-STATIONARY DATA SEGMENTS
It should be emphasized that the methods described here can be used to both 1) characterize the waveform in event segments of PQ events and 2) quantify PQ variations. Since both types of signals are quasi-stationary, the same signal processing principles can be applied.
FILTERS FOR REMOVING FUNDAMENTAL VOLTAGE/CURRENT
This preprocessing is often required before beginning an analysis and characterization of the signal. For analyzing disturbances, the dominant fundamental 50 Hz or 60 Hz voltage/current can be considered as strong noise (often it is more than 10 dB stronger than the signal). This could affect the accuracy of signal component analysis for frequencies near the fundamental frequency. The most frequently used filters are the notch filter and other high-pass filters (for instance, McClellan linear-phase finite-impulse response high-pass filters [13]).
TIME-FREQUENCY DECOMPOSITION OF THE SIGNAL BY TRANSFORMS AND SUBBAND FILTERS
Decomposition of a one-dimensional signal into two dimensional time-frequency components allows one to observe the changes of individual components as a function of time. Hence, a further characterization of the dynamics of the components is possible, e.g., monitoring the changes of harmonic components over time and detecting the triggering points of the event.
SHORT-TIME FOURIER TRANSFORM
Choosing a signal decomposition method is often dependent on the application. In many power engineering applications, harmonic-related analysis is of interest. In such a case, short time Fourier transform (STFT) [14] offers time-frequency signal decomposition that is equivalent to applying a set of equal-bandwidth subband filters. Essential parameters that require fine-tuning for power system applications include the center frequencies and bandwith of subband filters: the center frequencies of equivalent bandpass filters should be set at the harmonic frequencies. This can be adjusted by zero-padding the windowed data before applying the fast Fourier transform (FFT). The filter bandwidth is determined by the size of the analysis data window. It is essential that only one or a few harmonics be allowed in each passband. There needs to be a tradeoff, however, between the time resolution of sub band filters and the number of harmonics allowed in each passband, i.e., the bandwidth of the filter. Further, to reduce the artifact of fluctuations in decomposed components caused by applying a window to the periodic signal, the window size is set to be one or an integer number of voltage/current fundamental cycles. Figure 4 shows an example of the magnitudes of the third, fifth, and seventh odd harmonics after applying STFT to a voltage dip recording. One can observe the harmonic contents and their changes before, during, and after the dip. The harmonic distortion increases slowly during the dip, especially in the third band. Further, the distortion is somewhat lower after the dip than before the dip. Although the window of L=256 leads to a low time resolution, the frequency resolution is relatively high: the output of each bandpass filter has a weighted average of three harmonics (within 3-dB bandwidth).

[FIG4] Pseudofundamental and harmonic voltage magnitudes obtained from the complex bandpass filter outputs using STFT (Hamming window L = 256). From top to bottom: input waveforms containing a voltage sag; magnitudes from the complex subband filters centered at fundamental and the third, fifth, and seventh odd harmonics. The original voltage dip signal is from IEEE project group 1159.2, where the sampling rate is 15,360 Hz (or 256 samples per 60-Hz cycle).
DISCRETE WAVELET TRANSFORMS
The dyadic discrete wavelet transforms (DWTs) [15] also decomposes signals into frequency-dependent components. It is equivalent to applying a set of subband filters with an octave bandwidth relation, however. The DWTs is an excellent tool for automatically detecting multiscale singularities in a signal. This is particularly useful for detecting the triggering points in events. It is worth mentioning that DWTs is not suitable for harmonic related disturbance analysis. Due to the octave bandwidth relation in the wavelet filters, implying more harmonics in a higher frequency band, the number of harmonics in each subband cannot be freely adjusted. Figure 5 shows an example where the outputs of the DWTs are used to detect the starting and ending positions of a voltage dip: the dip starting location is clearly visible in the output of the fourth band, and the dip end location is clearly visible in the third band.
There exist many applications in power engineering that use wavelets [16]. Whether to choose STFT or wavelets is dependent on the applications. For harmonic-based analysis, STFT is more suitable. For detecting triggering points, wavelets are more effective [17], [18].
[FIG5] Example of detecting triggering points from the outputs of multiscale wavelet filters (using Daubechies wavelets = db4 and seven scale levels in Matlab Wavelet Toolbox). From top to bottom: the original signal containing a voltage dip (same as that used in Figure 4) and the outputs from the first five subbands.
OTHER TRANSFORMS
Many other subband filters or transforms are used for signal decomposition. For example, power engineers sometimes use the S-transform [19] for event analysis [20]. The simplest S-transform can be viewed as a two-band filter bank related to Haar wavelet transform, where the two filter outputs are related to the sum and the difference of two neighboring signal samples, respectively. Further study of Cohen’s class of time-frequency distributions [61], where the short-time Fourier transform is a special case of Cohen’s class, is also worthwhile. This class has been applied successfully to transient signal analysis [62].
THIS ARTICLE CREATES AN AWARENESS OF PQ ISSUES IN THE SIGNAL PROCESSING COMMUNITY.
METHODS FOR ANALYZING EVENTS
A common issue in event analysis is the estimation of some quantity of interest. In terms of harmonic and inter-harmonic based distortion analysis, the parameters of interest are the number of dominant harmonics/inter-harmonics, their frequencies and magnitudes, the severity of each distortion component as a function of time, and the starting point as well as the duration of the distortion. This is related to estimating time-dependent frequencies, magnitudes, phases and damping factors, and some index values, such as the total harmonic distortion (THD). In terms of dip and swell events, the parameters of interest could include the beginning and ending time of the event and the percentage of voltage dip or swell during the event. Other relevant parameters, depending on the applications, could include the localization of the distortion sources. Depending on the application, real-time estimation could be required. Issues such as accuracy, complexity, and speed could also be of concern.
TWO BASIC METHODS: TIME-DEPENDENT RMS AND FFT
The rms is widely used in applications such as protection, monitoring, event detection, and event classification by power engineers. A time-dependent rms value is computed for each window of voltage/current waveform data x(k),
The window is then shifted forward, and a new computation is repeated. This results in a time-dependent curve, referred to as rms voltage/current. Although an rms curve is very basic and simple, power engineers often use it as a basis of comparison with other methods.
The data window size for computing the rms is usually one or a few cycles of the power system fundamental. It is worth noting that rms voltages over any multiple of a half-cycle window will be the same if the waveform is ideal (i.e., symmetric and strictly periodic). However, in the presence of high distortion, the size of window N significantly affects the resulting rms. This could be misleading if the size of the window is unknown. Figure 6 shows the rms of voltage waveforms using a one-cycle sliding window and a half-cycle sliding window, respectively.
The voltage dip caused by transformer saturation has different rms magnitudes for the two windows. This is due to the variations (increase and decrease) of voltage amplitude within one cycle as the transformer enters and exits the saturation (saturation effects often involve dynamic DC offsets that will result in this kind of impact on the half-cycle rms). The half- cycle rms provides better time resolution and captures the variation in voltage magnitude. Note that the half-cycle window calculation may generate (artificially) deeper dips than the one-cycle rms calculation. Since the one-cycle calculation operates as an averaging filter, the resulting rms voltage is smoother.
FFT is another basic method extensively used by power engineers. For this method, a relatively large window size containing the data of interest is selected, and FFT is then applied to the data. The FFT spectrum is commonly used for detecting dominant harmonics, inter-harmonics, and their related magnitudes. Despite the basic and simple nature of the method, power engineers often use the FFT result as a reference for other methods.
NONPARAMETRIC METHODS: STFT AND SUBBAND FILTERS
Nonparametric methods can be used to estimate the amplitude and the phase of power system fundamental and harmonic/inter-harmonic components. STFT, wavelets, and subband filters have been used for generating time-dependent waveforms of pseudoharmonics [17]. For more efficient design, [21] uses a set of subband filters centered at odd harmonic frequencies, while a set of subband filters centered at even harmonic frequencies is obtained by first inserting the single sideband (SSB) modulation that shifts the frequency by f0 before applying the same set of subband filters. Since the signal components within each band are inseparable, the output is the average of the signal components within the band. The waveform of individual harmonics can be obtained only when the filter bandwidth is sufficiently narrow. However, when choosing the bandwidth, there is a tradeoff between the bandwidth and the time resolution required for the analysis. This is limited by the uncertainty principle, which states that the product of time resolution and frequency resolution remains a constant. For inter-harmonics within the signal bandwidth, the possible number of frequencies is infinite. Therefore, these methods usually cannot be applied to inter-harmonic analysis.

[FIG6] The rms voltage versus times computed from measured voltage waveforms that captured a transformer saturation event from a distribution system. (a) Original voltage waveforms and (b) rms versus time, obtained using a sliding window of one cycle (dashed line) and half a cycle (solid line)
PARAMETRIC METHODS BASED ON DAMPED SINUSOIDAL MODELS AND ESPRIT/MUSIC
Parametric methods can be used for analyzing both harmonic and inter-harmonic components. Once a good model is found for the signal, a much higher frequency resolution can be achieved compared to nonparametric methods. For harmonic/interharmonic–related analysis, a damped sinusoidal model is suitable for modeling some types of transients and disturbances, especially those involving switching of capacitive elements of the power system (e.g., cables or capacitor banks) or other switching operations that have the same impact on these capacitive elements (e.g., fault clearing). In this model type, a data sequence is regarded as summed damped sinusoids in white noise:
where nsk and nek denote the beginning and the ending time instant of the kth sinusoid, u(n)is the unit step sequence, ak ≥ 0 is the amplitude, ωk is the harmonic frequency in radians, Φk is the initial phase, βk is the damping factor, and v(n) is zero-mean white noise.
Assuming all sinusoids exist within the analysis time window (i.e., nsk = ns, nek = ne), then the step sequence u(•) can be removed from (2), yielding

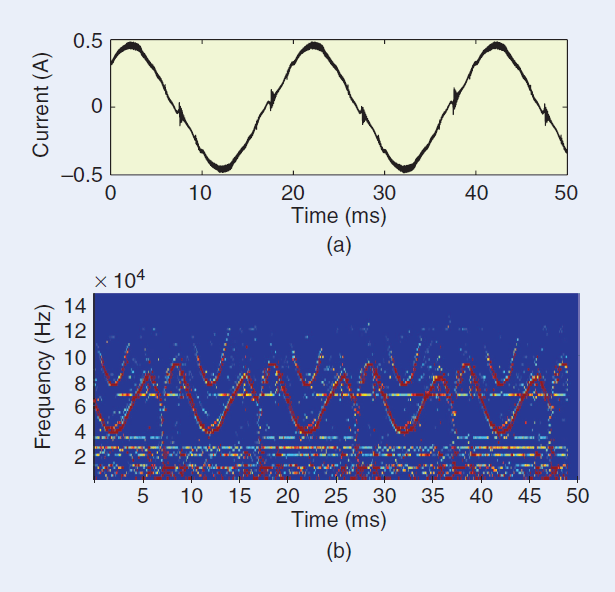
[FIG7] Example of the sliding-window ESPRIT for analyzing time dependent sinusoids. A 200-ms current sequence, with a sampling rate of 1 MHz (20,000 samples per 50-Hz cycle) was obtained from a fluorescent lamp with high-frequency ballast. The interest is the waveform distortion influencing the frequency band above 20 kHz. A high-pass filter of order 500 is applied for prefiltering, with a cutoff frequency of 10 kHz and a transition bandwidth of 10 kHz. (a) The original current sequence (a) and (b) the spectrogram obtained from the sliding-window ESPRIT. The size of the sliding window is 500 samples (0.5 ms) with 20% window overlap, the number of sinusoids is K = 12, and the total dimension of signal and noise subspaces is 200.
In such a case, model parameters can be estimated using ESPRIT or MUSIC [11]: the former is a signal subspace-based method, while the latter is a noise subspace-based method. It is worth mentioning that if this assumption does not hold, using ESPRIT or MUSIC may result in artificial frequency estimates that do not relate to the power disturbance event. For estimating parameters in (3), a two-step process is usually applied: first, the frequencies and damping factors are estimated using ESPRIT or MUSIC. Then, the least squares (LS) method is used to estimate the amplitudes and initial phases of sinusoids. ESPRIT and MUSIC are both suitable for analyzing stationary signals. The advantage of the method is that the frequencies can be located anywhere, including harmonics and inter-harmonics. This is rather useful, especially for analyzing inter-harmonics. Its disadvantage is that the number of sinusoids should be specified in advance before running the algorithm, while in reality this is usually unknown. An application example is using the damped sinusoidal model to analyze transients caused by capacitor switching. ESPRIT is useful in estimating the frequencies of capacitor switching transients [12] under the constraint that all frequency components be included within the analysis window (but the number of frequency components is often unknown before the analysis).
If the data is nonstationary, one may divide the data sequence into overlapping blocks and apply a sliding-window ESPRIT and LS to each block of data before shifting the analysis window forward. In the sliding-window ESPRIT [22], it is more essential to observe the dynamics of sinusoids as a function of time than to observe individual values. Some postprocessing is therefore necessary to trace the frequencies of harmonics and inter-harmonics and to remove spurious frequencies due to the use of a fixed number of prespecified sinusoids. Figure 7 shows an example of a sliding-window ESPRIT applied to a current sequence containing the disturbance from fluorescent lamps [23].
PARAMETRIC METHODS BASED ON STATE-SPACE MODELS AND KALMAN FILTERS
Another model for harmonic/inter-harmonic–related analysis is the use of state-space models and Kalman filters. Kalman filters have been extensively used in power system applications [24]–[27]. If one assumes that the frequencies of harmonics are known, then the task is to estimate the time-dependent signal components (or magnitudes and initial phases) under the sinusoid model

To formulate the state-space model
state variables are defined as the real and imaginary part of the sinusoids:
where ak,r(n) = ak (n)cosΦk, ak,i(n) = ak(n)sinΦk are the real and the imaginary parts of the kth signal component, respectively, and are related to the magnitude and the initial phase by

Afterwards, the matrix values in the state and observation equations in (5) can be obtained.
For example, assume a signal consists of the fundamental (k = 1) and first few harmonics (k=2…K-1). Further, assuming a constant power system fundamental frequency between two consecutive samples, ω0(n) = ω0 (n+1), we can obtain the matrices in (5) as

where Δt = 1/fs is the sample interval. To avoid model errors affecting the harmonic estimates, a higher model order than the actual number of interest, K, is usually set.
Figure 8 shows an example of the estimated voltage fundamental and the first four harmonics from the Kalman filter. Other examples of parametric methods include the extended Prony’s method for online harmonic content monitoring and disturbance tracking [28]–[30] and the Hilbert transform for estimating the frequencies and other parameters of transients [31]. Some comparisons between the classical methods of harmonic state estimation (e.g., FFT) and other more “advanced” estimation methods (e.g., wavelet transforms, Kalman filters, Prony’s method) [32] have been performed. It has been concluded that due to the inherent assumption in the classical methods that discounts the interharmonics, the nonclassical filtering and signal modeling approaches are more suited for harmonic state estimation and tracking [33]–[35].
PHYSICALLY BASED MODELS FOR DISTURBANCE RECORDINGS
The choice of signal processing methods often requires an understanding of the properties of the system in which the signal originates. This was already mentioned before as an important requirement in the development of characterization and classification methods. In this subsection, three examples will be presented where the choice of transforms is strongly influenced by the understanding of the physical properties of the power system.
[FIG8] Estimated voltage fundamental and harmonics from the Kalman filter, where the model order was set to N = 20. (a) Original waveforms of a disturbance sequence containing transformer saturation. (b) Estimated voltage fundamental in time. (c) Estimated first four harmonics in time.
SYMMETRICAL-COMPONENT TRANSFORMATION AND VOLTAGE DIPS
A characterization method for voltage dips due to faults in three-phase systems was proposed in [2]. This method was based on the way in which dips originate and propagate through the power system. Using this dip classification, a method was developed in [36] to determine the type of dip from the recorded voltage waveforms. The type of dip in turn gives important information about the type of fault (e.g., whether it is a single-phase or two-phase fault). The classification method developed in [36] is based on the so called symmetrical-component transformation. From the three complex voltages in the three-phase system, the positive- sequence, negative-sequence, and zero-sequence voltages are obtained:

where Va = VaejΦa is the complex magnitude for phase a, va(n) √2 Vacos(ω0n+ Φa) is the instantaneous voltage, a = ej2π/3 corresponds to a phase angle shift of 120°, and va(n) = Re{Vaejω0n} is the complex form of va(n) Components in phases b and c are defined in the same way as those in phase a. Further, V0 corresponds to the zero sequence, V1 to the positive sequence, V2 to the negative sequence, and Vi = ViejΦi , i = 0, 1, 2. In physical terms, the positive-sequence voltage is the component used for the energy transfer between generators and consumers; the negative-sequence and zero-sequence components indicate unbalance between the three voltages; and the negative-sequence component propagates all the way from the fault to the equipment terminals, whereas the zero sequence component is in many cases blocked by transformers.
The dip types can be characterized by using the positive sequence voltage V1 and the negative-sequence voltage V2, based on fault modeling in electric power systems. The classification method is one of those discussed in the section below concerned with the classification of events according to their underlying causes.
CLARKE TRANSFORM AND TRANSIENTS
A disadvantage of the symmetrical-component transformation discussed above is that it is based on complex voltages and currents. It is thus not suitable for the analysis of transient disturbances. Instead, the so-called Clarke transform [60] is used for the analysis of transients in three-phase power systems. The Clarke transform relates phase-to-neutral voltages and component voltages through the following matrix expression:

The three components are referred to as the alpha component, beta component, and zero-sequence component. The method in [60] also includes finding the dominant Clarke component. The various signal processing methods (such as event detection, segmentation, and frequency extraction) can then be applied to the dominant Clarke components instead of the phase-to neutral voltages.
HILBERT TRANSFORM AND TRANSIENT MODELING
The damping factor and oscillation frequencies of capacitor switching transients are determined by the new natural resonant frequencies in the power system after the capacitor switching event occurs. It is possible to estimate the damping factors and frequencies of a power system distribution capacitor bank switching event by modeling the system as state space equations and subsequently finding the characteristic equation of a second-order system transfer function. For quadratic damping, the decaying transient y(t)and its Hilbert transform are related by
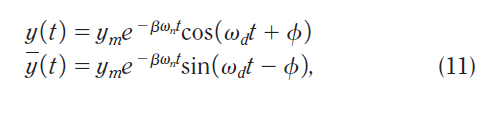
where the decaying magnitude a(t) = yme-βωnt is the envelope of the Hilbert transform [31].
CLASSIFICATION OF EVENTS ACCORDING TO THEIR UNDERLYING CAUSES
The classification of PQ disturbances is not in itself new; both IEEE 1159 and EN 50160 define methods for classification of events into dips, swells, short and long interruptions, under and over-voltages, and transients. The South-African standard NRS 048.2 and [44] further classify voltage dips into events of differing severity. In all cases, very simple classification criteria are utilized that are purely based on residual voltage and the duration of the event. Recent developments of interest are the use of advanced classification methods and classification based on the origins or underlying causes of events. The latter is also referred to as the extraction of additional information from event recordings. Such classifiers may also be used for power system diagnoses and power system protection.
CHOICE OF CLASSES
Numerous papers on automatic classification of voltage disturbances have been published in the last few years. These fall roughly into two groups:
1) Classification of event waveforms, with typical classes including “voltage dips,” “interruptions,” and “transients.” This type of work has its importance for the development of classification tools but has limited practical value, as standard methods are available.
2) Classification of events based on their origins, with typical classes including “faults,” “transformer energizing,” and “capacitor energizing.” This type of work has huge practical value.
DIFFERENT METHODS
The classification methods used and under development can be divided roughly into the following three groups:
■ Visual inspection. Power system experts commonly use this method in practice to classify the origins of disturbances.
■ Rule-based systems. These are often implemented as expert systems that distinguish between different classes of events based on their origins. One example is an expert system for classification of voltage dips and interruptions based on their origins [37]. The system is able to distinguish among nine classes and has been applied to a large set of measured recordings from a medium-voltage distribution system.
■ Statistically based methods. These are based on using various advanced signal processing techniques. Artificial neural networks (ANNs)—often combined with feature extraction from a set of wavelet filters and fuzzy logic for decision making—are the most commonly used methods in the literature. Examples of ANNs include a waveform-based classification system [38] and a system that distinguishes between transformer energizing and motor starting [39]. Another ANN-based system for identifying the origins of events was presented in [40]. More recently, statistical learning theory–based support vector machines have been used in a classification system [41]. The latter two classifiers were tested by using large amounts of measured voltage recordings. Classification systems based on multiple hypothesis tests, customer-oriented approaches, and other hybrid approaches have also been proposed [42]–[45].
EVENTS AND THEIR CLASSIFICATION
The classification of events, as with classification systems in other application areas, includes the basic steps of selecting features and designing the classifier [46]. Roughly speaking, defining features is heavily dependent on the knowledge of power engineering specialists, while extracting features and designing good classifiers mainly require signal processing and pattern recognition expertise.
ADVANCEMENTS IN MEASUREMENT EQUIPMENT AND DATA MANAGEMENT ARE DRAMATICALLY INCREASING THE AVAILABILITY OF TRANSIENT EVENTS FOR ANALYSIS.
SELECTION OF FEATURES
Defining and extracting good features is an essential step towards a successful event classification. This usually requires excellent knowledge of power systems. Features are sometimes extracted without considering the specific nature of power disturbance signals, for instance by 1) using the outputs from transforms and subbands, including DFT, STFT, wavelets, and other time-frequency signal decomposition methods, and 2) using second-order and higher-order statistics such as rms, energy, and cumulants. But without further processing (e.g., using shape of rms, triggering points, or disturbance energy variation in certain frequency ranges), these features offer little potential to ferret out the underlying power system phenomena. We are more interested in selecting features that relate the common physical phenomena in each event type to characteristics in the measured signals. Such an approach includes
■ using features related to the rules (e.g., phenomena related to transformer energizing or capacitor switching and the different shapes of their rms curves) and heuristics based on power specialist experience
■ using physical phenomenon–related features and statistical classification systems
■ using features associated with the parameters in the corresponding signal models (typically, different signal models should be applied to event segments and transition segments).
It should be noted that finding typical features for each specific type of event remains an open research area for electric power engineering.
DIMENSIONALITY OF FEATURE VECTORS
Features selected by power engineering specialists are likely to be partially correlated. Since there are many efficient methods in pattern recognition for decorrelating features and reducing feature dimensions, correlation of initially selected features usually does not impose a problem for the classification system. However, without feature optimization, high dimensionality of feature vectors usually requires more training data and is associated with a more complex classification system. A too high dimensionality could result in “over-fitting” of a classification system if insufficient training data is used, which leads to a poor generalization performance on the test data. The more complex classification system could be linked with a practical implementation problem and prevent possible real-time applications. Great interest and effort have been put into devising powerful pattern recognition techniques. However, these techniques often fail to consider the reduction of complexity and improved performance of the classification system as a whole.
CLASSIFICATION SYSTEMS FOR LOW-, MEDIUM- AND HIGH-VOLTAGE NETWORKS
It is worth mentioning that low-, medium- and high voltage electrical networks present different sets of single and multiple-event disturbances. As a result, the design of classification techniques for each voltage level has to take into account the specific characteristics of these networks. For instance, the sets of disturbances in the high-voltage transmission and low- voltage distribution systems differ considerably.
SINGLE-EVENT AND MULTIPLE-EVENT DISTURBANCES AND SEGMENTATION
Many classification systems developed so far consider disturbance recordings, each containing a single underlying cause (or single-event disturbance). However, multiple-events could be present in a single recording, e.g., a voltage dip followed by tripping of a protective device. For multiple-event disturbances, it is essential that segmentation be applied so that a data sequence can be partitioned into several transition and event segments and each can be analyzed separately [10].
PERFORMANCE OF CLASSIFICATION SYSTEMS
Some classification systems are able to reach an average accurate classification rate of above 95%. It is worth noting that the performance of a classifier is not only related to the classification rate but is also linked with the total number of event types that a system is able to classify and the use of real, measured data or merely of synthetic data. A system tested only on synthetic data has very limited practical use.
IDENTIFICATION OF UNDERLYING CAUSES OF DISTURBANCES
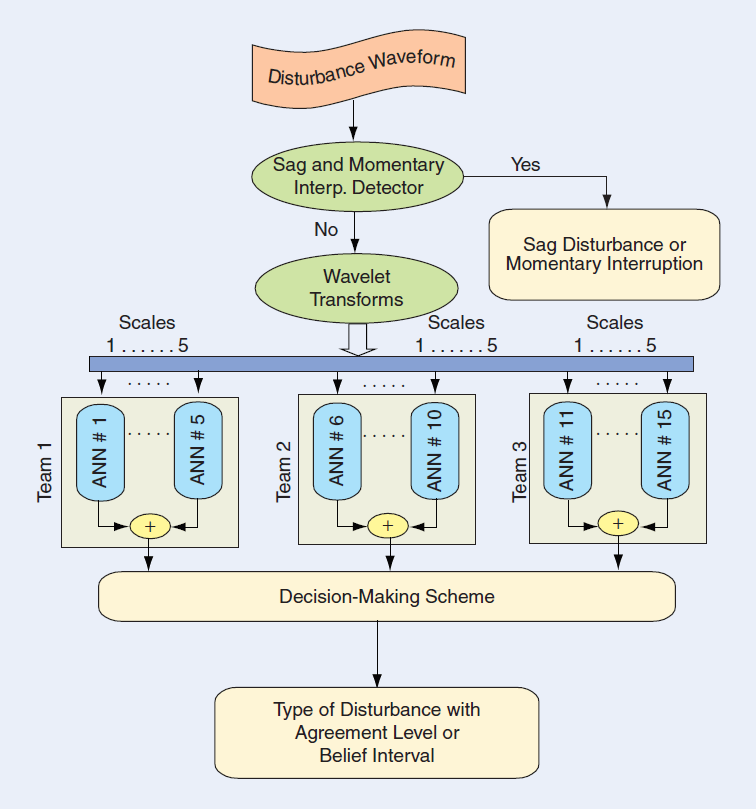
For a given disturbance waveform recording (either the voltage or the current) captured by power system monitoring equipment, it is usually simple and straightforward to find out the corresponding disturbance types, e.g., voltage dips (or sags), swells, interruptions, and transients. The required signal processing is very limited. Also, such analysis is of minor interest to power engineering communities. The main issue of concern is to find the underlying causes of disturbances in the power system. This requires both power system and signal processing knowledge. Such a process, referred to as event-based classification, includes a few basic processing blocks, as shown in Figure 9.

[FIG9] Block diagram of an event-based classification system.
A PHYSICAL UNDERSTANDING OF THE POWER SYSTEM IS IMPORTANT IN THE DEVELOPMENT OF SUITABLE CLASSIFICATION METHODS.
Before sending the signal waveforms to the “segmentation” block, some preprocessing to the signal may be required. The preprocessing is typically done based on requirements by power engineers, for example, removing or reducing the fundamental voltage or current to enhance the signal of interest (i.e., the distortion and disturbance to the fundamental). The segmentation block includes partitioning the data into event segments and transition segments and finding triggering points (the beginning and ending points of an event). Achieving these goals typically requires some signal processing, from simple signal processing to more complex signal decomposition and modeling. The “feature extraction” block is mainly a task for power engineers, where knowledge of power systems is essential for defining good features. For example, good features for distinguishing between a transformer-energizing event and a motor-starting event can be obtained by examining the following power system phenomena: Starting a motor takes the same amount of current from all three phases, which results in the same voltage drop in all three phases. Energizing a transformer, however, causes different saturations in the three phases, which leads to different voltage drops for each phase. Hence, one feature that can be used to differentiate between these two events would be the balancing of three-phase rms voltages. Further, the current waveform is sinusoidal for motor starting but nonsinusoidal for transformer energizing. The latter implies more harmonic distortions in both the current and the voltage. Another feature would thus be the harmonic distortions in rms voltages or currents. The “classification” block (or classification of the underlying causes of disturbances) mainly requires signal processing knowledge. This may include selecting the type of classifiers and designing a classifier capable of yielding good generalization performance for a test data set, adding newly learned event types, and producing a high confidence level for the classification according to the requirements specified by power engineering experts. The purpose of classifiers is to interpret causes, origins, and locations; to diagnose; or to gain more knowledge about unknown types of disturbances. All these stages require the use of effective signal processing methods.
CLASSIFICATION OF UNDERLYING CAUSES OF DISTURBANCES: DETERMINISTIC VERSUS STATISTICAL APPROACHES
Designing a proper classification system is usually considered a signal processing task. Therefore, we shall only briefly describe a few typical approaches and trends currently studied for classification of power disturbances through examples. It should be emphasized that these examples are far from complete and the aim is to facilitate further research.
RULE-BASED EXPERT SYSTEMS FOR CLASSIFICATION
An expert system utilizes deterministic approaches for classification. The heart of an expert system is a set of rules, where the “real intelligence” from human experts of power systems is translated into the “artificial intelligence” in computers. The performance of classification is therefore heavily dependent on the selected rules (often, a set of if-then rules) and the inference engine that performs the reasoning of rules. It is also important to include a knowledge base editor so that these rules are updated or checked.
The advantage of expert systems is that they do not require training data for the classifier as they use rules made by human experts. Therefore, if one has very limited training data available, an expert system is clearly a good choice. The main disadvantage of expert systems is that they usually require a set of fixed value thresholds to make a binary (i.e., yes or no) decision after applying the rules.
As an example, an expert system [37] was used to classify events according to nine underlying causes (energizing, nonfault interruption, fault interruption, transformer saturation due to fault, induction motor starting, step change, transformer saturation followed by protection operation, single-stage dip due to fault, and multistage dip due to fault) of voltage disturbances obtained from the measurements of a medium-voltage distribution system. Figure 10 shows the tree-structured inference process used for classifying the underlying causes. The expert system has yielded a classification rate of approximately 97% from a total of 962 measured disturbance recordings. A separate investigation has found that the same expert system using features and rules extracted from the time-dependent rms curves can handle many event types with similar classification performance [47].

[FIG10] A tree-structured inference process for classifying the underlying causes of power system disturbances.
THE MAIN ISSUES OF CONCERN ARE TO FIND THE UNDERLYING CAUSES OF DISTURBANCES IN THE POWER SYSTEM
ANN-BASED CLASSIFICATION
ANNs have been an important tool and the most frequently studied method so far for the statistically based classification of power system disturbances. Classification using ANNs has been shown to be a good alternative when a sufficient amount of training data is available. Interest in ANNs for PQ and power systems applications arises from the following theoretical aspects [48]:
■ ANNs are data-driven, self-adaptive methods that can adjust themselves to the data without any explicit specification of the functional or distributional form for the underlying models.
■ ANNs approximate any function with any required accuracy after sufficient training. Since any classification procedure seeks a functional relationship between the group membership and the attributes of the signal, accurate identification of this underlying function is clearly important.
■ ANNs are associated with nonlinear mappings; this makes them flexible in modeling complex real-world relationships.
■ANNs are able to estimate posterior probabilities, which provide the basis for establishing classification rules and performing statistical analysis.
The disadvantages of ANN classifiers include the lack of underlying mathematical models and interpretations, difficulty in determining the optimal number of neurons and layers, the uncertainty as to whether the system converges after a certain training period, and whether the classifier is over-fitted to the training data. Despite these setbacks, ANN-based classifiers can perform satisfactorily with “proper” training.
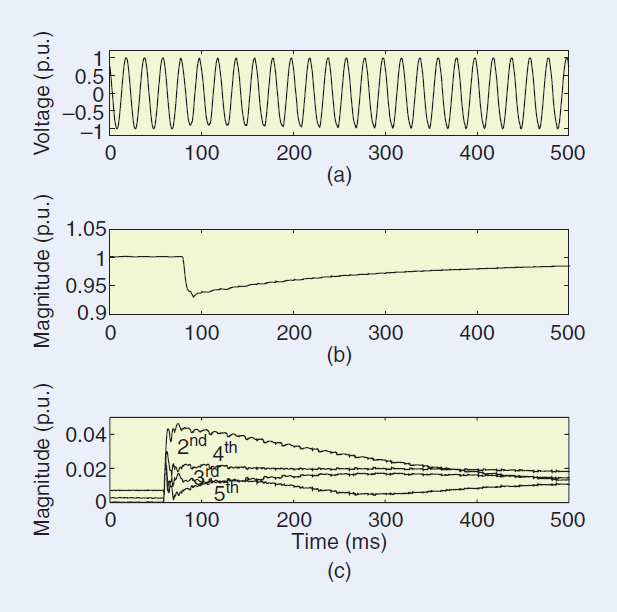
A good example of such a classifier is a wavelet-based ANN classification system, as shown in Figure 11 [40]. In this system, each disturbance recording is first fed into a set of subband filters using wavelets with five scales. This results in a set of time-dependent signal components. The scheme is then carried out in the wavelet domain using a set of subneural networks for classifying six disturbance types, including low-frequency capacitor switching, high-frequency capacitor switching, ideal voltage fundamental sinusoid waveform, impulse transient, voltage dip, and short interruption. The outcomes of the networks are then integrated using a decision-making scheme such as a simple voting scheme or the Dempster-Shafer theory of evidence. With such a configuration, the classifier is also capable of providing a degree of belief for the identified disturbances. The total number of recordings used for system training and testing is 1,199. The classification rate is 92.3% for the first four types of disturbances, where 10.8% of recordings are rejected as ambiguous, and 98.5% for the last two types of disturbances.
[FIG11] Block diagram of the wavelet-based neural classifier that includes the sag and momentary detector.
MORE TECHNIQUES NEED TO BE DEVELOPED FOR DETECTION AND ANALYSIS OF NONQUASI-STATIONARY SIGNALS
SUPPORT VECTOR MACHINE–BASED CLASSIFICATION
A support vector machine (SVM) classifier is another statistically based approach, with statistical learning theory as its mathematical foundation. SVM classifiers are increasingly popular in many application areas. An SVM classifier first maps the input space (either spanned by signals or by features of signals) nonlinearly into a high-dimensional feature space, where the classes are more likely to be linearly separable. An SVM classifier minimizes the generalization errors on the test set instead of the training set. Further, the classification error is linked with the complexity of the classifier (controlled by the Vapnik- Chervonenkis theory and the structural risk minimization principle), which a designer can choose [49]–[51]. Designing an SVM classifier can be formulated mathematically as solving a constrained optimization problem. The solution can be obtained from solving a convex quadratic programming problem [52]. One important feature of SVMs is the utilization of kernel functions (to satisfy Mercer’s condition [53]), so that only inner products of feature vectors are used. Most applications choose to use the existing set of kernel functions, since finding new and best kernel functions for SVMs is a nontrivial task. Conceptually, finding the best classifier can be considered as maximizing the margins to the separating hyperplanes of classes (or maximizing the shortest distance between the separating hyperplane using the support vectors from the related training classes).
The advantages of SVM classifiers include, among others, being able to control the complexity of classifiers, a theoretically guaranteed upper bound for classification error, storing only a small percentage of feature vectors (i.e., support vectors) instead of entire feature vectors from the training set, and automatically determining the parameters through training. When one has a large amount of disturbance recordings, an SVM classifier is an excellent choice.
A simple example is an SVM classification system that contains several sub-SVMs [41]. Only five different types of three-phase voltage dips are classified: dips caused by single phase-to-ground fault, phase-to-phase fault, three-phase fault, double phase-to-ground fault, and transformer saturation. Simple features are used. For each three-phase data recording, a feature vector of size 72 is used (24 feature components per phase). For each phase, the feature components include 20 rms values by equal distance sampling, starting from the triggering point of the disturbance; the magnitudes of the second, fifth, and ninth harmonics; and the total harmonic distortion with respect to the power system fundamental. Since dips due to faults have a rectangular rms shape, the number of synchronized drops in the three-phase rms can be used to classify the fault type from among the four different types of faults given above. Further, dips caused by faults and by transformer energizing can be distinguished by examining whether the rms voltage has a gradual (i.e., nonrectangularly shaped) recovery or a fast (i.e., rectangularly shaped) recovery. The former is caused by the transform saturation and the latter by the fault. Using the second harmonic as a feature is motivated by the fact that relatively high even harmonics (especially the second) are produced as the transformer enters and exits saturation. Further, two odd harmonic magnitudes (the fifth and ninth) are used to indicate the disturbance in the low- and high-frequency bands. The classifier has a tree structure (as shown in Figure 12) consisting of several sub-SVM classifiers. This is determined according to the number of transition segments in each recording (from the segmentation procedure). The system has yielded an average classification rate of 96%. More interestingly, the system is able to maintain a similar classification performance when using training data and test data from two different types of power networks from two different European countries.
Although SVM-based classification has been shown to be promising, more studies should be conducted. For example, it would be interesting to extend such a classification system so that it could accommodate a large number of classes (i.e., underlying disturbance cause types). Further, evaluating the performance (e.g., the generalization error, complexity, false alarm rate, number of support vectors, and effective kernel functions) and adding confidence indicators to the classification results of such a large classification system would be important. It would also be interesting to compare SVM-based and ANN-based classification systems.

[FIG12] A tree-structured SVM classifier, containing multiple SVM subclassifiers, is used for the classification of the underlying causes of disturbances. N 5 5 was used in this system.
FURTHER RESEARCH AND POTENTIAL APPLICATIONS FOR POWER ENGINEERING AND SIGNAL PROCESSING
As mentioned before, the objective of this article is not to present signal processing or artificial intelligence techniques, it is to describe some potential applications and current developments as well as the challenges involved in the application of signal processing to power system disturbances. Signal processing techniques turn raw PQ measurements into a much more valuable commodity: information that can help us to understand and relate the disturbances and power system/ load problems. This may lead to the diagnosis and mitigation of PQ problems.
SIGNAL PROCESSING FOR ONLINE PQ MONITORING
As utilities and industrial customers have expanded their PQ monitoring systems, the data management, analysis, and interpretation functions have become the most significant challenges in the overall PQ monitoring effort [54]. There are two basic streams in PQ data analysis: offline and online analysis. Offline analyses, described in the previous sections, are mainly suitable for system performance evaluation, problem characterization, and system diagnosis and maintenance where rapid analysis and dissemination of analysis results are not required. For online analysis, results are helpful when actions must be taken immediately (e.g., determining fault locations from voltage and current waveforms). Online analysis is also useful in limiting large amounts of data transfers over limited communication channels. For instance, online analysis within a substation can result in significant savings in data transfers by identifying disturbance causes that warrant actual transfer of data to a central system. For other causes, a summary of the event characteristics may be sufficient. Some examples of the signal processing involved in online analysis are the following:
■ Analysis of rms variations, including tabulations of voltage dips and swells, magnitude-duration curves or scatter plots, and computation of rms-related indices. Signal processing techniques can be used to quantify voltage dip and swell performance (e.g., duration and depth). Furthermore, signal processing techniques in conjunction with the load equipment
models can be used to predict the impact of voltage dips on sensitive equipment.
■ Analysis of steady-state conditions, which includes trends of rms voltages and currents, negative- and zero-sequence unbalances, real and reactive power, and harmonic distortion levels and individual harmonic components. Statistics, such as minimum, maximum, average, standard deviation, count, and cumulative probability levels can be temporally aggregated and dynamically filtered. Using such steady-state data, statistical signal processing can be used to predict the performance or the health of voltage regulators on distribution circuits.
■ Analysis of harmonics, where users can calculate voltage and current harmonic spectra, perform statistical analysis of various harmonic indices, and monitor trending over time. Such analyses can be very useful in identifying excessive harmonic distortions on power systems as a function of system characteristics (resonance conditions) and load characteristics.
■ Analysis of transients, which includes statistical analysis of maximum voltage, transient durations, and transient frequencies. Such results can reveal switching problems with equipment such as capacitor banks.
■Standardized PQ reports (e.g., daily reports, monthly reports, statistical performance reports, executive summaries, and customer PQ summaries).
■ Analysis of protective device operation.
■ Analysis of energy use.
■Correlation of PQ levels or energy use with other important parameters (e.g., relating voltage dip performance and lightning flash density).
■ Equipment performance as a function of PQ levels (equipment sensitivity reports).
Online (or nearly real-time) PQ data assessment results are available immediately for rapid dissemination. Users can then take immediate actions upon receiving the notifications. An excellent example of online analysis is locating a fault on a distribution circuit. Signal processing techniques would be used to extract and analyze voltage and current waveforms. The analysis would reveal the fault location, and this information would then be disseminated quickly to the line crew [55]–[57].
POTENTIAL APPLICATIONS
Some future signal processing applications from the power engineering point of view are listed next.
INDUSTRIAL PQ MONITORING APPLICATIONS
■ Energy and demand profiling, with identification of opportunities for energy savings and demand reduction.
■ Harmonic evaluations to identify transformer loading concerns, sources of harmonics, problems indicating misoperation of equipment (such as converters), and resonance concerns associated with power factor correction.
■ Unbalance voltage profiling to identify impacts on three phase motor heating and loss of life.
■ Voltage dip impact evaluation to identify sensitive equipment and possible opportunities for process ride-through improvement.
■ Power factor correction evaluation to identify proper operation of capacitor banks, switching concerns, and resonance issues and to optimize performance in order to minimize electric bills.
■ Motor-starting evaluation to identify switching problems and monitor inrush current and protection device operation.
■ Profiling of voltage variations (flicker) to identify load switching and load performance problems.
■ Short-circuit protection evaluation to evaluate proper operation of protective devices based on short-circuit current characteristics, time-current curves, and so forth.
POWER SYSTEM PERFORMANCE ASSESSMENT AND BENCHMARKING
■ Trending and analysis of steady-state PQ parameters (voltage regulation, unbalance, flicker, harmonics) for performance trends, correlation with system conditions (capacitor banks, generation, loading, and so on), and identification of conditions that need attention.
■ Evaluation of steady-state PQ with respect to national and international standards. Most of these standards involve specification of PQ performance requirements in terms of statistical PQ characteristics.
■ Voltage dip characterization and assessment to identify the cause of dips (transmission or distribution) and to characterize the events for classification and analysis (including aggregation of multiple events and identification of subevents for analysis with respect to protective device operations).
■ Capacitor switching characterization to identify the source of the transient (up-line or down-line), locate the capacitor bank, and characterize the events for database management and analysis.
■ Performance index calculation and reporting for system benchmarking purposes and for prioritization of system maintenance and improving investments.
■ Locating faults. This is one of the most important benefits of monitoring systems. It can dramatically improve response times for repairing circuits and also identify problem
conditions related to multiple faults over time in the same location.
■ Capacitor bank performance assessment. Smart applications can identify fuse blowing, can failures, switch problems (restrikes and reignitions), and resonance concerns.
■Voltage regulator performance assessment to identify unusual operations, arcing problems, regulation problems, and so forth. This can be accomplished with trending and associated analysis of unbalance, voltage profiles, and voltage variations.
■Distributed generator performance assessment. Smart systems should identify interconnection issues, such as protective device coordination problems, harmonic injection concerns, islanding problems, and so forth.
■ Incipient fault identification. Research has shown that cable faults and arrester faults are often preceded by current discharges that occur weeks before the actual failure. This is an ideal expert system application for the monitoring system.
■ Transformer loading assessment. This can evaluate transformer loss-of-life issues related to loading and can also include harmonic loading impacts in the calculations.
■ Feeder breaker performance assessment to identify coordination problems, proper operation for short circuit conditions, nuisance tripping, and so forth.
FUTURE DIRECTIONS
PQ monitoring is rapidly becoming an integral part of general distribution system monitoring, as well as an important customer service. Electric power utilities are integrating PQ and energy management monitoring, evaluation of protective device operation, and distribution automation functions. PQ information should ideally be available throughout the company via an intranet and should be made available to customers for evaluation of facility power-conditioning requirements.
PQ information should be analyzed and summarized in a form that can be used to prioritize system expenditures and to help customers understand the system’s performance. Therefore, PQ indices should be based on customer equipment sensitivity. The system average rms variation frequency index (SARFI) indices for voltage dips are excellent examples of this concept.
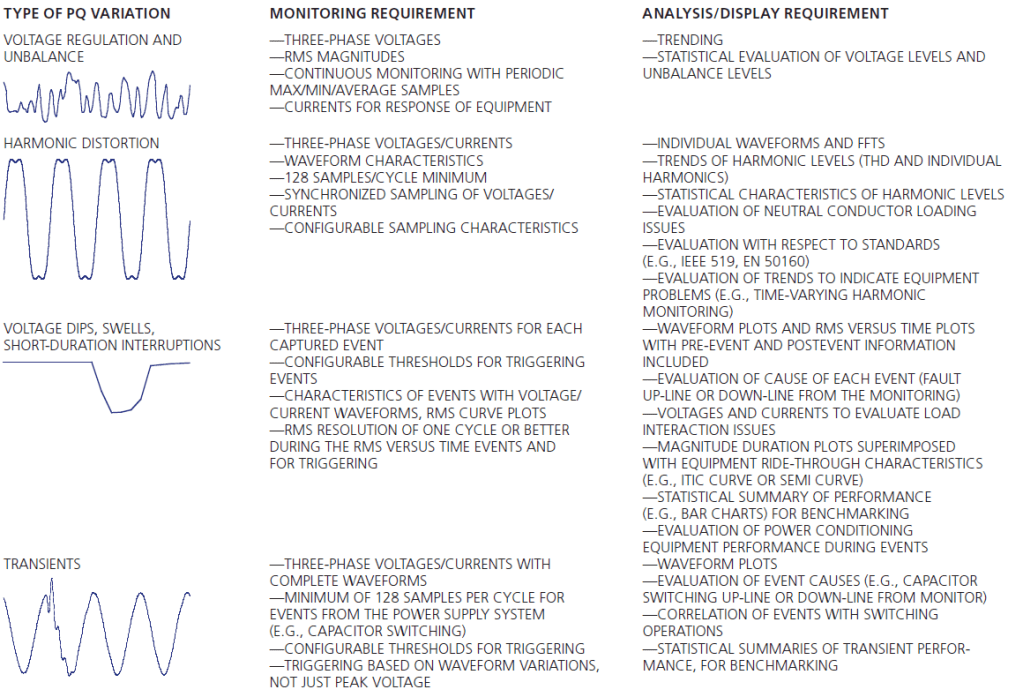
PQ encompasses a wide range of conditions and disturbances. Therefore, the requirements for the monitoring system can be quite substantial. Table 1 summarizes the basic requirements as a function of the different types of PQ variations [5].
The information from PQ monitoring systems can help improve the efficiency of operating the system and the reliability of customer operations. These are benefits that cannot be
ignored. The capabilities and applications for PQ monitors are continually evolving.
[TABLE 1] SUMMARY OF MONITORING REQUIREMENTS FOR DIFFERENT TYPES OF PQ VARIATIONS.
THE OBJECTIVE OF THIS ARTICLE IS TO DESCRIBE SOME POTENTIAL APPLICATIONS AND CURRENT DEVELOPMENTS AS WELL AS THE CHALLENGES INVOLVED IN THE APPLICATION OF SIGNAL PROCESSING TO POWER SYSTEM DISTURBANCES.
FURTHER SIGNAL PROCESSING CHALLENGES AND REQUIREMENTS
Some signal processing issues require further research. These include:
■ Event-based classification systems. Further research on efficient and fast classification systems with the aim of finding underlying causes of disturbances is needed. This has a large application potential, for diagnosis and even for protection applications if real-time processing can be achieved.
■ Transient analysis . Research is needed in model-based transient analysis and in finding the underlying causes of transients. Currently only a few types of transients have been modeled under some constraints.
■ Modeling and understanding the spectra of disturbance recordings in the high-frequency range, e.g., the high-frequency content as it relates to the underlying causes events and the noise related to the measuring environment.
■ Fault locations. From the measurements, finding the locations where particular faults originated. This should also include self-clearing faults that can be more difficult to locate due to high impedance and/or arcing characteristics.
■ Determining the source of quasi-stationary voltage variations (flicker) based on characteristics of the voltage variations and characteristics of customer load variations or other parameters that may correlate with the voltage variations [57]–[59].
■ Modeling three-phase unbalanced disturbances.
■ Analysis of harmonic distortion signals to determine the source of the harmonics in complex networks that can magnify and modify the harmonic content.
CONCLUSIONS
This article presents some of the challenges in applying signal processing techniques to PQ disturbance recordings. Our main emphasis is on the automatic analysis of PQ events. The distinction between the quasi-stationary and the non-quasi-stationary part of PQ signals was used as the basis for discussion. Many techniques are currently available for the analysis of quasi-stationary PQ signals, whereas more techniques need to be developed for detection and analysis of nonquasi-stationary signals.
Several methods for analysis of quasi-stationary signals were discussed. Those methods may be applied to quasi-stationary segments of PQ events but also to PQ variations.
Automatic classification of PQ events requires employing various signal processing methods. Such classification methods should be aimed at extracting the information related to the underlying phenomena in the power system that resulted in these PQ disturbances. We also show that a physical understanding of the power system is important in the development of suitable classification methods.
Although the main emphasis of the article is on PQ events, they are not the only possible signal processing application of interest to the power engineering community. We therefore give an extensive list of other issues for which advanced signal processing tools may provide solutions.
The exciting new applications and challenges of signal processing for PQ analysis, highlighted here, should help to further bridge the gap between the power engineering and signal processing communities.
REFERENCES
[1] R. C. Dugan, M. F. McGranaghan, S. Santoso, and H. W. Beaty, Electrical Power Systems Quality, 2nd ed. New York: McGraw-Hill, 2003.
[2] M. H. J. Bollen, Understanding Power Quality Problems: Voltage Sags and Interruptions. Piscataway, NJ: IEEE Press, 2000.
[3] I. Y. H. Gu and E. Styvaktakis, “Bridge the gap: signal processing for power quality applications,” Elect. Power Syst. Res. J., vol. 66, no. 1, pp. 83–96, 2003.
[4] M. H. J. Bollen, I. Y. H. Gu, P. G. V. Axelberg, and E. Styvaktakis, “Classification of underlying causes of power quality disturbances using deterministic and statistical signal processing methods,” EURASIP J. Adv. Signal Process. (Special Issue on Emerging Signal Processing Techniques for Power Quality Applications), 2007.
[5] M. F. McGranaghan and S. Santoso, “Challenges and trends in analyses of electric power quality measurement data,” EURASIP J. Adv. Signal Process. (Special Issue on Emerging Signal Processing Techniques for Power Quality Applications), 2007.
[6] M. H. J. Bollen and I. Y. H. Gu, Signal Processing of Power Quality Disturbances. Hoboken, NJ: Wiley–IEEE Press, 2006.
[7] Power Quality Measurement Methods, IEC 61000-4-30, IEC, 2003.
[8] Flickermeter—Functional and Design Specifications, IEC 61000-4-15, 1997.
[9] EN 50160, Voltage Characteristics of Electricity Supplied by Public Distribution Networks, CENELEC, Brussels, Belgium, 1999.
[10] E.Styvaktakis, Automating Power Quality Analysis, Ph.D. dissertation, Dept. of Signals and Systems, Chalmers Univ. Technology, Gothenburg, Sweden, 2002.
[11] M. H. Hayes, Statistical Digital Signal Processing and Modeling. New York: Wiley, 1996. [12] M. H. J. Bollen, E. Styvaktakis, and I. Y. H. Gu, “Categorization and analysis of power system transients,” IEEE Trans. Power Deliv., vol. 20, no. 3, pp. 2298–2306, 2005.
[13] Signal Processing TOOLBOX for Use with MATLAB. The MATH WORKS Inc., Natick, MA, 2005.
[14] A. V. Oppenheim and R. W. Schafer, Digital Signal Processing. Englewood Cliffs, NJ: Prentice-Hall, 1974.
[15] S. Mallat, A Wavelet Tour of Signal Processing, 2nd ed. New York: Academic, 1999.
[16] S. Chen and H. Y. Zhu, “Wavelet transform for processing power quality disturbances,” EURASIP J. Adv. Signal Process (Special Issue on Emerging Signal Processing Techniques for Power Quality Applications), 2007.
[17] S. Santoso, W. M. Grady, E. J. Powers, J. Lamoree, and S. C. Bhatt, “Characterization of distribution power quality events with Fourier and wavelet transforms,” IEEE Trans. Power Deliv., vol. 15, no. 1, pp. 247–254, 2000.
[18] Y. H. Gu and M. H. J. Bollen, “Time-frequency and time-scale domain analysis of voltage disturbances,” IEEE Trans. Power Deliv., vol. 15, no. 4, pp.1279–1284, 2000.
[19] R. G. Stockwell, L. Mansinha, and R. P. Lowe, “Localization of the complex spectrum: The S transform,” IEEE Trans. Signal Process., vol. 44, no. 4, pp. 998–1001, 1996.
[20] P. K. Dash, B. K. Panigrahi, D. K. Sahoo, and G. Panda, “Power quality disturbance data compression, detection, and classification using integrated spline wavelet and S-transform,” IEEE Trans. Power Deliv., vol. 18, no. 2, pp. 595–600, 2003.
[21] C. Duque, P. M.Silveira, T. Baldwin, and P. F. Ribeiro, “Novel method for tracking time-varying power harmonic distortions without frequency spillover,” in Proc. IEEE Power Engineering Soc. General Meeting, July, 2008, pp. 1–6.
[22] I. Y. H. Gu and M. H. J. Bollen, “Estimating interharmonics by using sliding window ESPRIT,” IEEE Trans. Power Deliv., vol. 23 , no. 1, pp. 13–23, 2008.
[23] E. O. A. Larsson, C. M. Lundmark, and M. H. J. Bollen, “Distortion of fluorescent lamps in the frequency range 2–150 kHz,” in Proc. IEEE Int. Conf. Harmonics and Quality of Power, Cascais, Portugal, Oct. 2006, pp. 1–6.
[24] H. Ma and A. A. Girgis, “Identification and tracking of harmonic sources in a power system using a Kalman filter,” IEEE Trans. Power Deliv., vol. 11, no. 3, pp. 1659–1665, 1996.
[25] V. M. M. Saizm and J. B. Guadalupe, “Application of Kalman filtering for continuous real time tracking of power system harmonics,” Proc. Inst. Elect. Eng. Gener. Transmission Distrib., vol. 144, no. 1, pp. 13–20, 1997.
[26] K. K. C. Yu, N. R. Watson, and J. Arrillaga, “An adaptive Kalman filter for dynamic harmonic state estimation and harmonic injection tracking,” IEEE Trans. Power Deliv., vol. 20, no. 2, pp. 1577–1584, 2005.
[27] J. A. Macias and A. Gomez, “Self-tuning of Kalman filters for harmonic computation,” IEEE Trans. Power Deliv., vol. 21, no. 1, pp. 501–503, 2006.
[28] Z. Hu, J. Guo, M. Yu, Z. Du, and C. Wang, “The studies on power system harmonic analysis based on extended Prony method,” in Proc. Int. Conf. Power System Technology, Oct. 2006, pp. 1–8.
[29] S. R. Naidu, F. F. Costa, “A novel technique for estimating harmonic and inter-harmonic frequencies in power system signals,” in Proc. 2005 European Conf. Circuit Theory and Design, 2005, vol. 3, pp. 461–464.
[30] A. Bracale, G. Carpinelli, D. Lauria, Z. Leonowicz, T. Lobos, and J. Rezmer, “On some spectrum estimation methods for analysis of nonstationary signals in power systems. Part I. Theoretical aspects,” in Proc. 11th Int. Conf. Harmonics and Quality of Power, Sept. 2004, pp. 266–271.
[31] K. Hur, S. Santoso, and I. Y. H. Gu, “On empirical estimation of utility distribution damping parameters using power quality waveform data,” EURASIP J. Adv. Signal Process. (Special Issue on Emerging Power Quality Applications), 2007.
[32] E. A. Feilat, “Detection of voltage envelope using Prony analysis-Hilbert transform method,” IEEE Trans. Power Deliv., vol. 21, no. 4, pp. 2091–2093, 2006.
[33] I. Kamwa, R. Grondin, and D. McNabb, “On-line tracking of changing harmonics in stressed power systems: Application to Hydro-Quebec network,” IEEE Trans. Power Deliv., vol. 11, no. 4, pp. 2020–2027, 1996.
[34] T. Lobos, J. Rezmer, and H.-J. Koglin, “Analysis of power system transients using wavelets and Prony method,” in Proc. IEEE Porto Power Tech. Conf., Sept. 2001, vol. 4.
[35] M. Meunier and F. Brouaye, “Fourier transform, wavelets, Prony analysis: tools for harmonics and quality of power,” in Proc. 8th Int. Conf. Harmonics and Quality of Power, Oct. 1998, vol. 1, pp. 71–76.
[36] L. Zhang and M. H. J. Bollen, “Characterization of voltage dips in power systems,” IEEE Trans. Power Deliv., vol. 15, no. 2, pp. 827–832, 2000.
[37] E. Styvaktakis, M. H. J. Bollen, and I. Y. H. Gu, “Expert system for classification and analysis of power system events,” IEEE Trans. Power Deliv., vol. 17, no.2, pp. 423–428, 2002.[38] Z.-L. Gaing, “Wavelet-based neural network for power quality disturbance recognition and classification,” IEEE Trans. Power Deliv., vol. 19, no. 4, pp. 1560–1568, 2004.
[39] T. X. Zhu, S. K. Tso, and K. L. Lo, “Wavelet-based fuzzy reasoning approach to power-quality disturbance recognition,” IEEE Trans. Power Deliv., vol. 19, no.4, pp. 1928–1935, 2004.
[40] S. Santoso, E. J. Powers, W. M. Grady, and A. C. Parsons, “Power quality disturbance waveform recognition using wavelet-based neural classifier,” IEEE Trans. Power Deliv., vol. 15, no. 1, pp. 222–235, 2000.
[41] P. G. V. Axelberg, I. Y. H. Gu, and M. H. J. Bollen, “Support vector machine for classification of voltage disturbances,” IEEE Trans. Power Deliv., vol. 22, no. 3, pp. 1297–1303, 2007.
[42] C. A. Duque, M. V. Ribeiro, F. R. Ramos, and J. Szczupak, “Power quality event detection based on the divide and conquer principle and innovation concept,” IEEE Trans. Power Deliv., vol. 20, no. 4, pp. 2361–2369, 2005.
[43] I. Y. H. Gu, N. Ernberg, E. Styvaktakis, and M. H. J. Bollen, “Statistical-based sequential method for fast online detection of fault-induced voltage dips,” IEEE Trans. Power Deliv., vol. 19, no. 2, pp. 497–504, 2004.
[44] J. F. L. van Casteren, J. F. G. Cobben, J. H. R. Enslin, W. T. J. Hulshorst, W. L. Kling, and M. D. Hamoen, “A customer oriented approach to the classification of voltage dips,” in Proc. CIRED Conf., 2005.
[45] J. Barros and E. Perez, “Automatic detection and analysis of voltage events in power systems,” IEEE Trans. Instrum. Measure., vol. 55, no. 5, pp. 1487–1493, 2006.
[46] R. O. Duda, P. E. Hart, and D. G. Stork, Pattern Classification, 2nd ed. New York: Wiley, 2001.
[47] E. Styvaktakis, M. H. J. Bollen, and I. Y. H. Gu, ‘Automatic classification of power system events using rms voltage measurements,” in Proc. IEEE Power Eng. Soc. Summer Meeting, vol. 2, Chicago, IL, July 2002, pp. 824–829.
[48] W. R. A. Ibrahim and M. M. Morcos, “Artificial intelligence and advanced mathematical tools for power quality applications: A survey,” IEEE Trans. Power Deliv., vol. 17, no. 2, pp. 668–673, 2002.
[49] J. Shawe-Taylor and N. Cristianini, Kernel Methods for Pattern Analysis. Cambridge, U.K.: Cambridge Univ. Press, 2004.
[50] C. J. C. Burges, “A tutorial on support vector machines for pattern recognition,” Data Mining Knowl. Discovery, vol. 2, pp. 121–167, 1998.
[51] K. R. Muller, S. Mika, G. Rätsch, K. Tsuda, and B. Schölkopf, “An introduction to kernel-based learning algorithms,” IEEE Trans. Neural Netw., vol. 12, no. 2, pp. 181–202, 2001.
[52] D. P. Bertsekas, Nonlinear Programming. Belmont, MA: Athena Scientific, 1995.
[53] J. Shawe-Taylor and N. Cristianini, Kernel Methods for Pattern Analysis. Cambridge, U.K.: Cambridge Univ. Press, 2004.
[54] A. M. Gargoom, N. Ertugrul, and W. L. Soong, “A comparative study on effective signal processing tools for power quality monitoring,” in Proc. 2005 European Conf. Power Electronics and Applications, Sept. 2005.
[55] S. Santoso, R. C. Dugan, J. Lamoree, and A. Sundaram, “Distance estimation technique for single line-to-ground faults in a radial distribution system,” in Proc. IEEE Power Engineering Society Winter Meeting, 2000, vol. 4, pp. 2551–2555.
[56] E. Styvaktakis, M. H. J. Bollen, and I. Y. H. Gu, “A fault location technique using high frequency fault clearing transients,” IEEE Power Eng. Rev., vol. 19, no. 5, pp. 58–60, 1999.
[57] P. G. V. Axelberg, M. H. J. Bollen, and I. Y. H. Gu, “Trace of flicker sources by using the quantity of flicker power,” IEEE Trans. Power Deliv., vol. 23, no. 1, pp. 465–471, Jan. 2008.
[58] A. A. Girgis, J. W. Stephens, and E. B. Makram, “Measurement and prediction
of voltage flicker magnitude and frequency,” IEEE Trans. Power Deliv., vol. 10, no. 3, pp. 1600–1605, 1995.
[59] T. K. Abdel-Galil, E. F. El-Saadany, and M. M. A. Salama, “Online tracking of voltage flicker utilizing energy operator and Hilbert transform,” IEEE Trans. Power Deliv., vol. 19, no. 2, pp.861–867, 2004.
[60] M. H. J. Bollen and I. Y. H. Gu, On the analysis of voltage and current transients in three-phase power systems, IEEE Trans. Power Deliv., vol. 22, no. 2, pp. 1194–1201, Apr. 2007.
[61] L. Cohen, Time-Frequency Analysis. Englewood Cliffs, NJ: Prentice-Hall, 1995.
[62] Y.-J. Shin, E. J. Powers, M. Grady, and A. Arapostathis, “Power quality indices for transient disturbances,” IEEE Trans. Power Deliv., vol. 21, no. 1, pp. 253–261, Jan. 2006.
AUTHORS
1Math H.J. Bollen (math.bollen@ieee.org) is a manager for power quality and EMC with STRI AB, Sweden, and guest professor at EMC-on-Site, Luleå University of Technology, Skellefteå, Sweden. He received the M.S and Ph.D. degrees from Eindhoven University of Technology, The Netherlands, in 1985 and 1989, respectively. Before joining STRI AB in 2003 he was post-doc at Eindhoven University of Technology, Eindhoven, The Netherlands; lecturer at the University of Manchester Institute of Science and Technology, United Kingdom; and professor in electric power systems at Chalmers University of Technology, Gothenburg, Sweden. His research experience covers power quality, reliability, and other aspects of power system design and operation. He has written several fundamental papers and two
textbooks on power quality. He is a Fellow of the IEEE.
2Irene Y.H. Gu (irenegu@chalmers.se) received the Ph.D. degree from Eindhoven University of Technology, The Netherlands, in 1992. She was a research fellow at Philips Research Institute IPO, The Netherlands, and Staffordshire University, United Kingdom, and a lecturer at the University of Birmingham in the U.K. from 1992 to 1996. Since 1996, she has been with the Department of Signals and Systems, Chalmers University of Technology, Sweden, where she has been professor of signal processing since 2004. Her current research interests include signal processing of power system disturbances, signal and image processing theories and applications, and machine vision. She is a Senior Member of the IEEE.
3Surya Santoso (ssantoso@mail.utexas.edu) received the M.S.E. and Ph.D. degrees in electrical and computer engineering from the University of Texas at Austin in 1994 and 1996, respectively. He rejoined the University of Texas at Austin as an assistant professor in 2003. Prior to joining the university, he was a consulting engineer with Electrotek Concepts Inc., Knoxville, Tennessee, for seven years. His primary research interests include the development of intelligent systems for analyzing raw PQ measurement data, power system modeling and studies, and wind power. He coauthored the book Electric Power Systems Quality. He is a Senior Member of the IEEE.
4Mark F. MacGranaghan (mmcgranaghan@epri.com) received the B.S.E.E. and M.S.E.E. degrees from the University of Toledo, Ohio and the M.B.A. degree from the University of Pittsburgh, Pennsylvania. Currently, he is vice president of consulting services at EPRI PEAC, Knoxville, Tennessee. He is coauthor of the book Electrical Power Systems Quality. He has been influential in developing IEEE and international standards for harmonic limits on power systems and within facilities. He helped to achieve coordination between the IEEE and IEC in a wide range of PQ standards development activities. He has taught seminars and workshops on PQ issues and power system analysis to electric utility engineers from around the world. He is a Member of the IEEE.
5Peter A. Crossley (p.crossley@manchester.ac.uk) received the B.S. degree from the University of Manchester Institute of Science and Technology and the Ph.D. degree from the University of Cambridge, both in the United Kingdom, in 1977 and 1983, respectively. Currently, he is professor of power systems at the University of Manchester. He was involved in the design and application of digital protection relays and systems for 25 years, first with GEC in the U.K. and then with ALS TOM Protection and Control, Staf ford, U.K., the University of Manchester Institute of Science and
Technology, and the Queen’s University of Belfast, U.K. He is a Member of the IEEE.
6Moisés V. Ribeiro (moviribeiro@yahoo.com.br) received the M.S. and Ph.D. degrees in electrical engineering from the University of Campinas, Brazil, in 2001 and 2005, respectively. He was a visiting researcher at University of California, Santa Barbara, in 2004 and post-doc and visiting professor at Federal University of Juiz de Fora, Brazil, in 2005 and 2006, respectively. He is currently an assistant professor at Federal University of Juiz de Fora. His research interests include computational intelligence, digital and adaptive signal processing, power quality, power line communication, sensor networks, and digital communications. He is a Member of the IEEE.
7Paulo F. Ribeiro (pribeiro@calvin.edu) received the B.S. degree in electrical engineering from the Federal University of Pernambuco, Brazil, completed the electric power systems engineering courses with Power Technologies Inc. He received the Ph.D. degree from the University of Manchester, United Kingdom. Currently, he is a professor of engineering at Calvin College, Grand Rapids, Michigan. He is active in IEEE and IEC working groups on power quality. His research interests include power electronics, power quality, system modeling and simulation, and signal processing applied to power systems. He is a Fellow of the IEEE.

Excellent site you have got here.. It’s difficult to find high quality writing like yours these days. I honestly appreciate people like you! Take care!!
LikeLike
I want to to thank you for this wonderful read!! I absolutely enjoyed every bit of it. I have got you saved as a favorite to look at new things you post…
LikeLike
Good article. I will be going through many of these issues as well..
LikeLike
Hello there! I could have sworn I’ve been to this website before but after going through some of the articles I realized it’s new to me. Anyways, I’m definitely pleased I discovered it and I’ll be book-marking it and checking back regularly!
LikeLike
I blog frequently and I seriously thank you for your information. The article has truly peaked my interest. I am going to take a note of your site and keep checking for new information about once a week. I opted in for your RSS feed too.
LikeLike
Hello Raymond, Thank you for your message and supporting our blog.
LikeLike
I needed to thank you for this fantastic read!! I certainly loved every little bit of it. I have got you book marked to look at new stuff you post…
LikeLike
Hello Emile, Thank you for your message and supporting us!
LikeLike
I think other site proprietors should take this website as an model, very clean and wonderful user genial style and design, as well as the content. You are an expert in this topic!
LikeLike
Hey there! I could have sworn I’ve been to this site before but after reading through some of the post I realized it’s new to me. Nonetheless, I’m definitely delighted I found it and I’ll be bookmarking and checking back often!
LikeLike