Published by Terry Chandler, Director of Engineering, Power Quality Thailand LTD/Power Quality Inc., USA. Emails: terryc@powerquality.org, terryc@powerquality.co.th


Published by Terry Chandler, Director of Engineering, Power Quality Thailand LTD/Power Quality Inc., USA. Emails: terryc@powerquality.org, terryc@powerquality.co.th
Published by Dranetz, Website: Dranetz.com
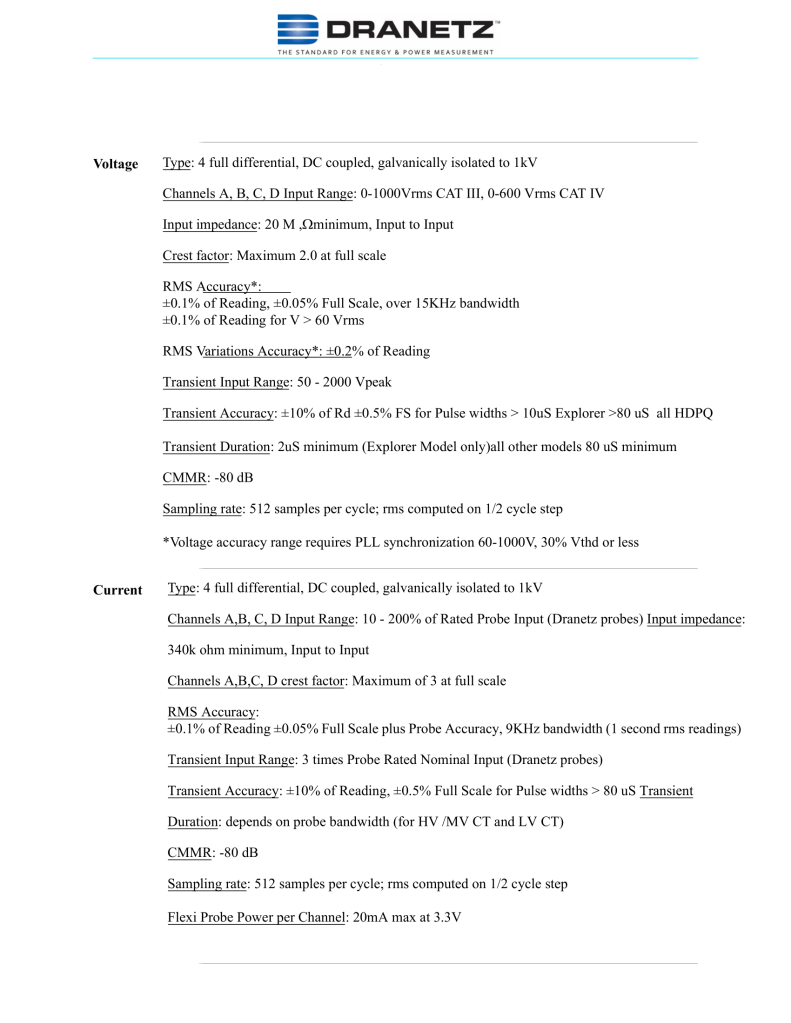
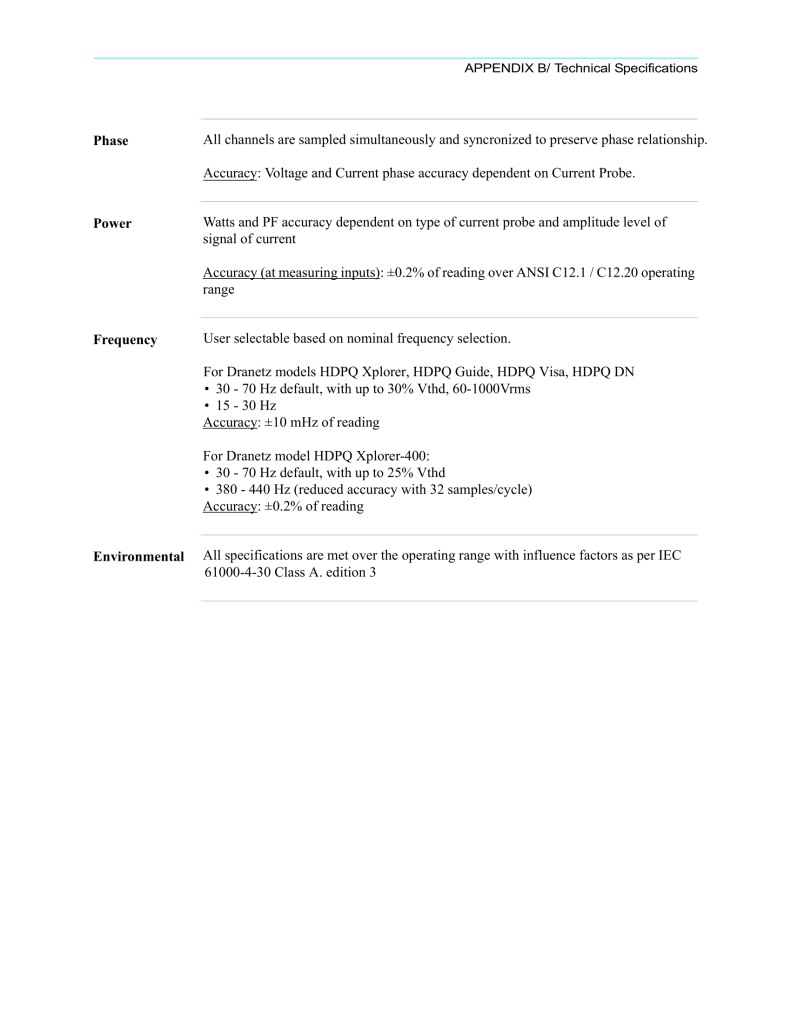
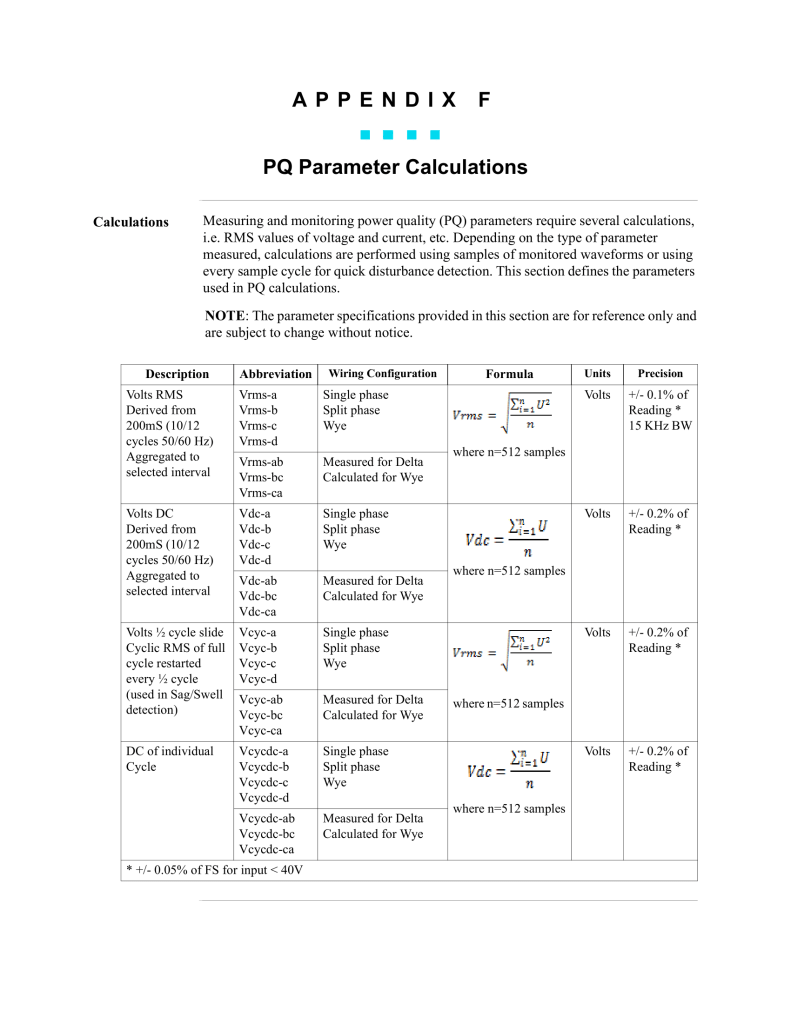
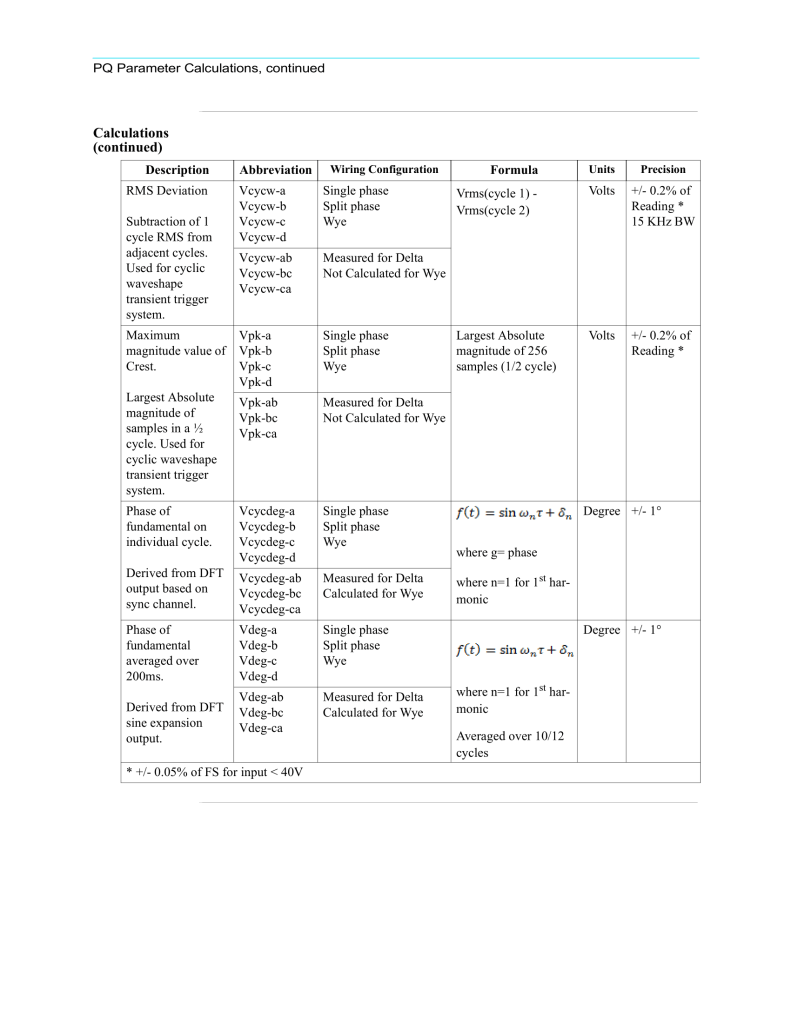
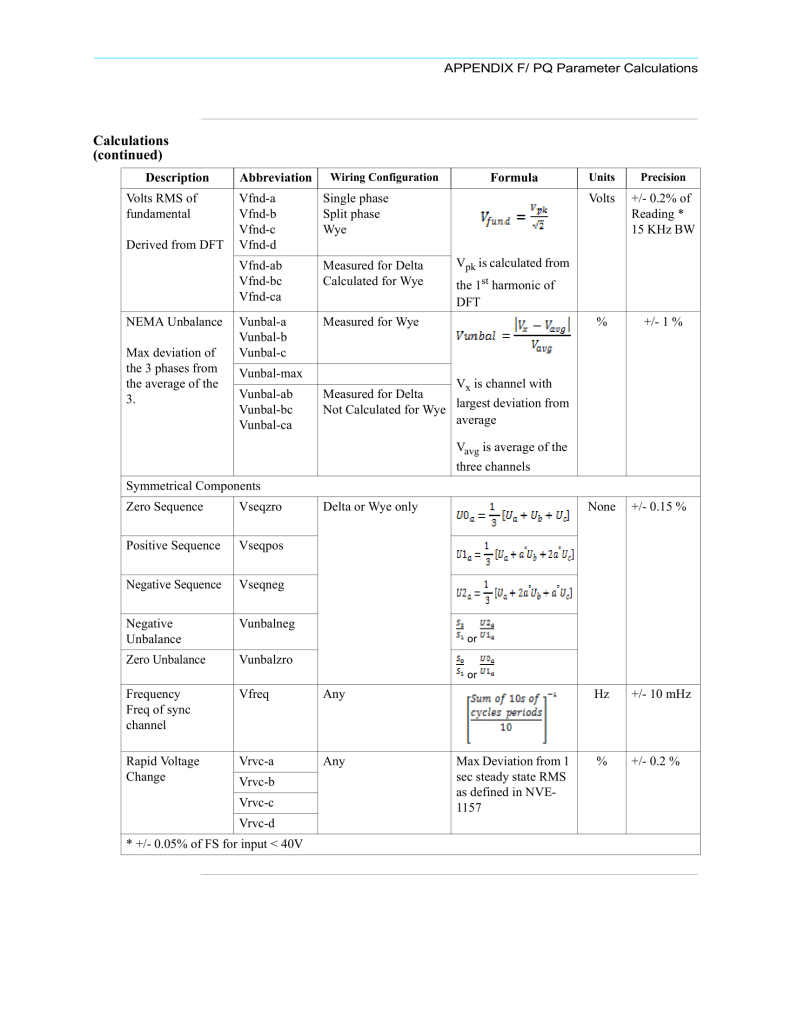
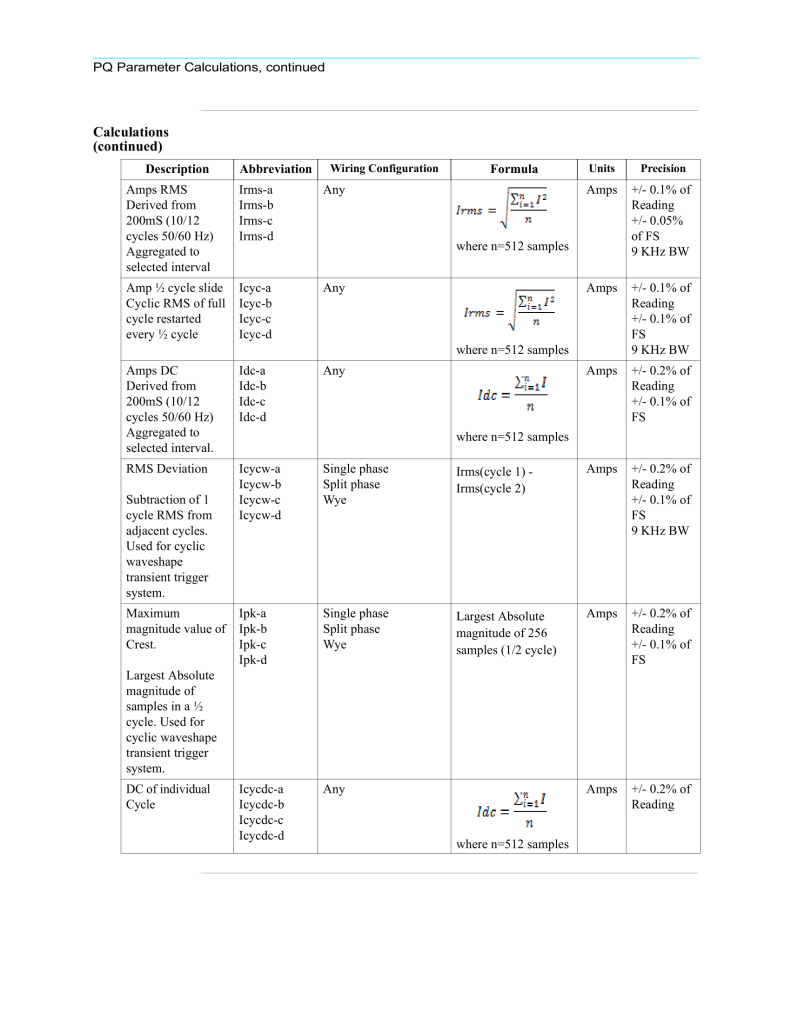
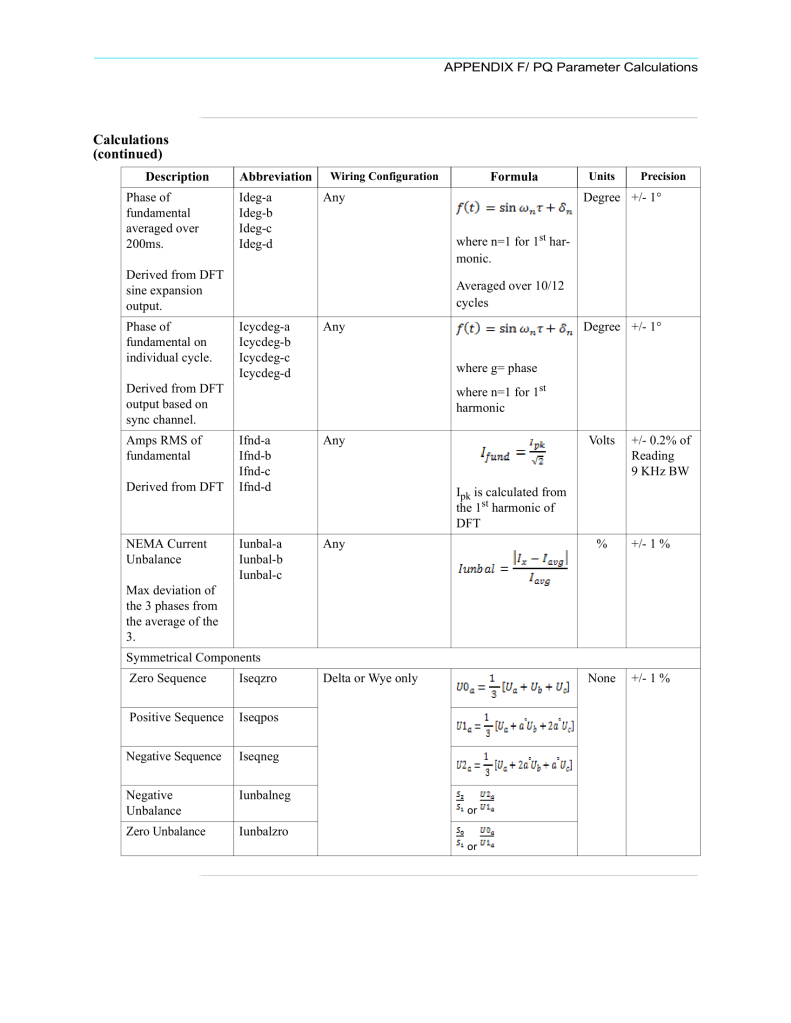
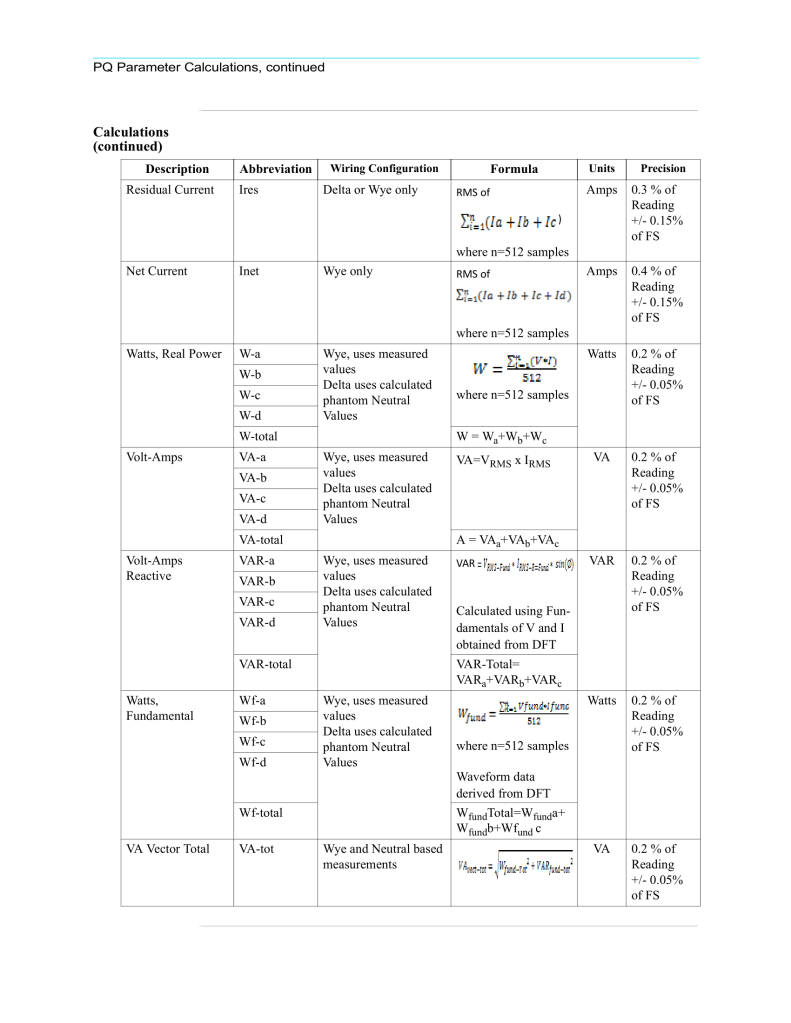
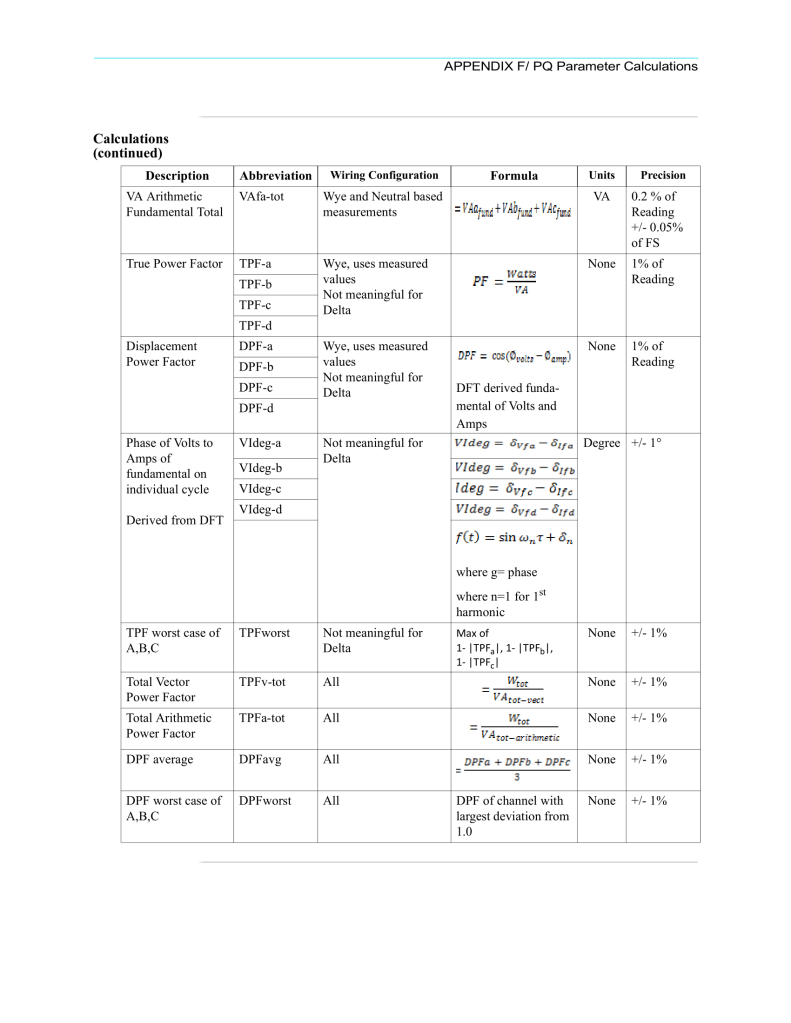
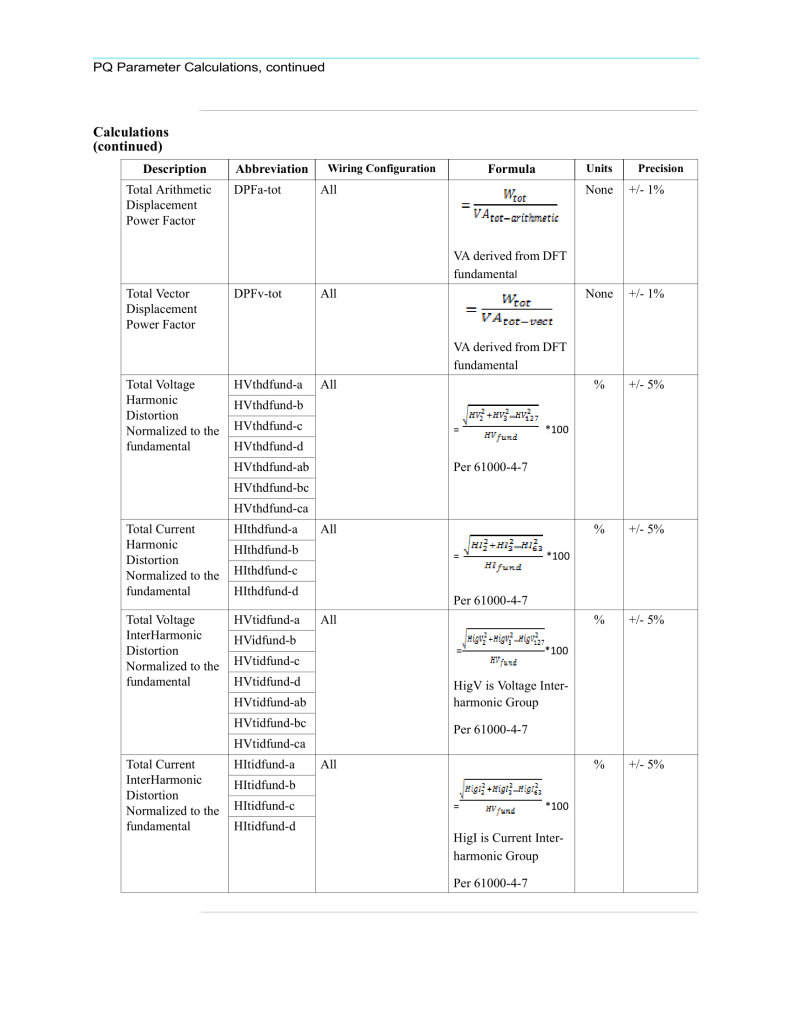
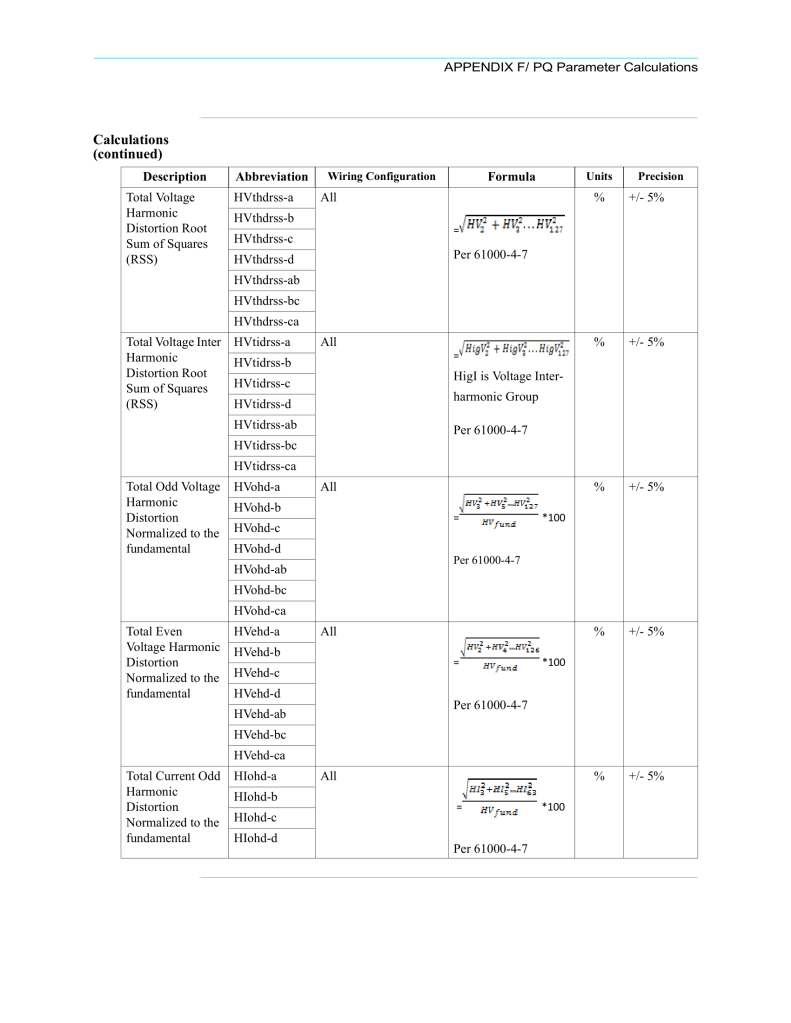
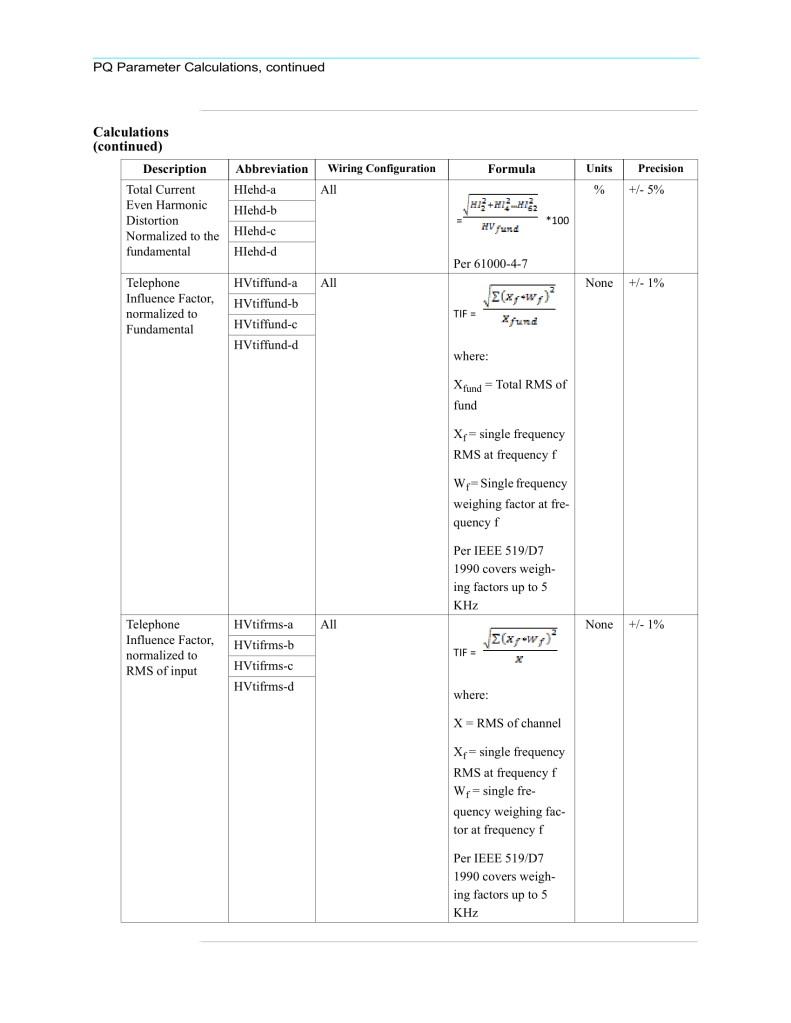
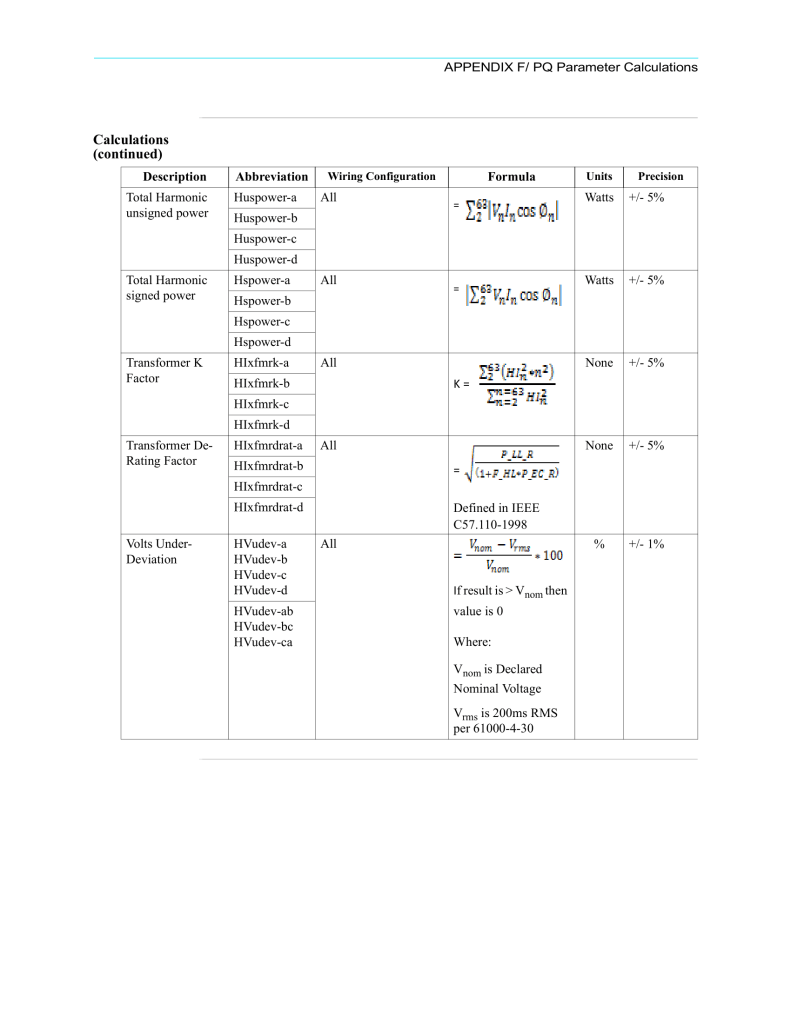
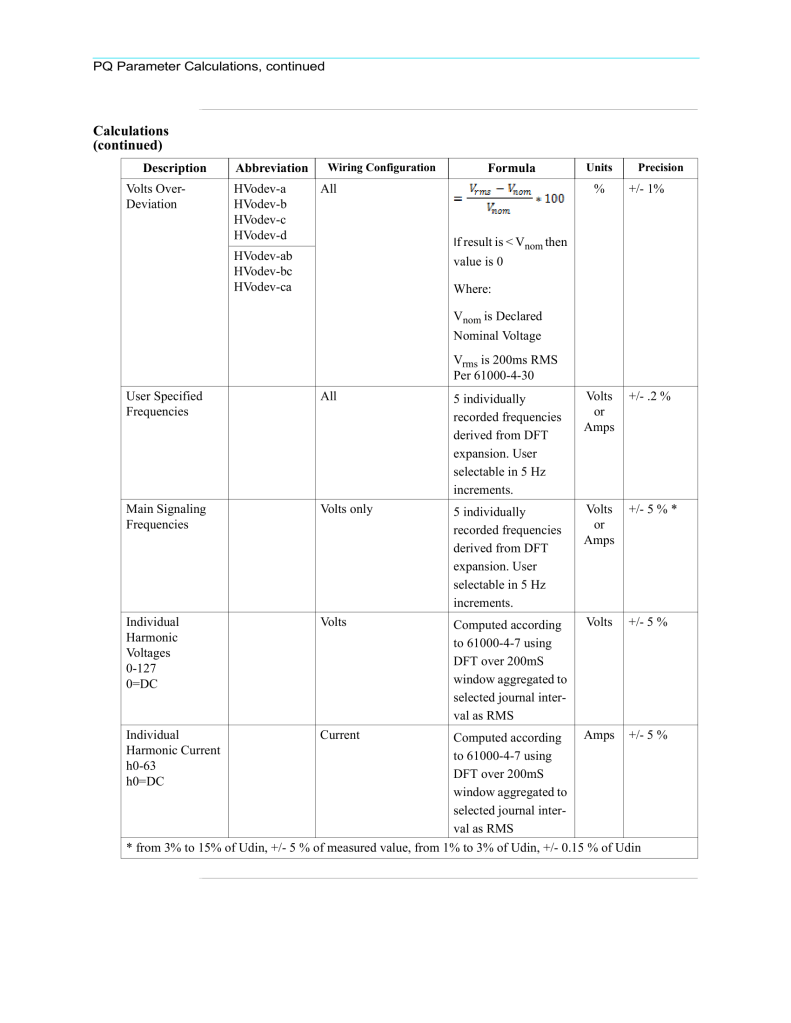
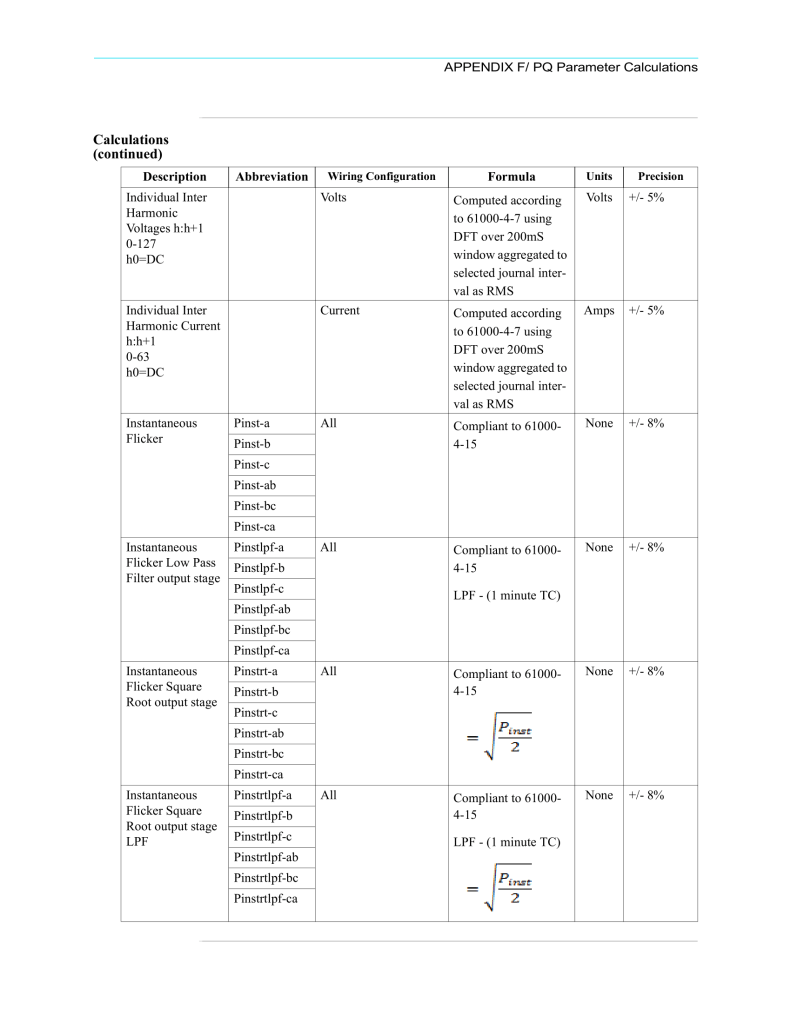
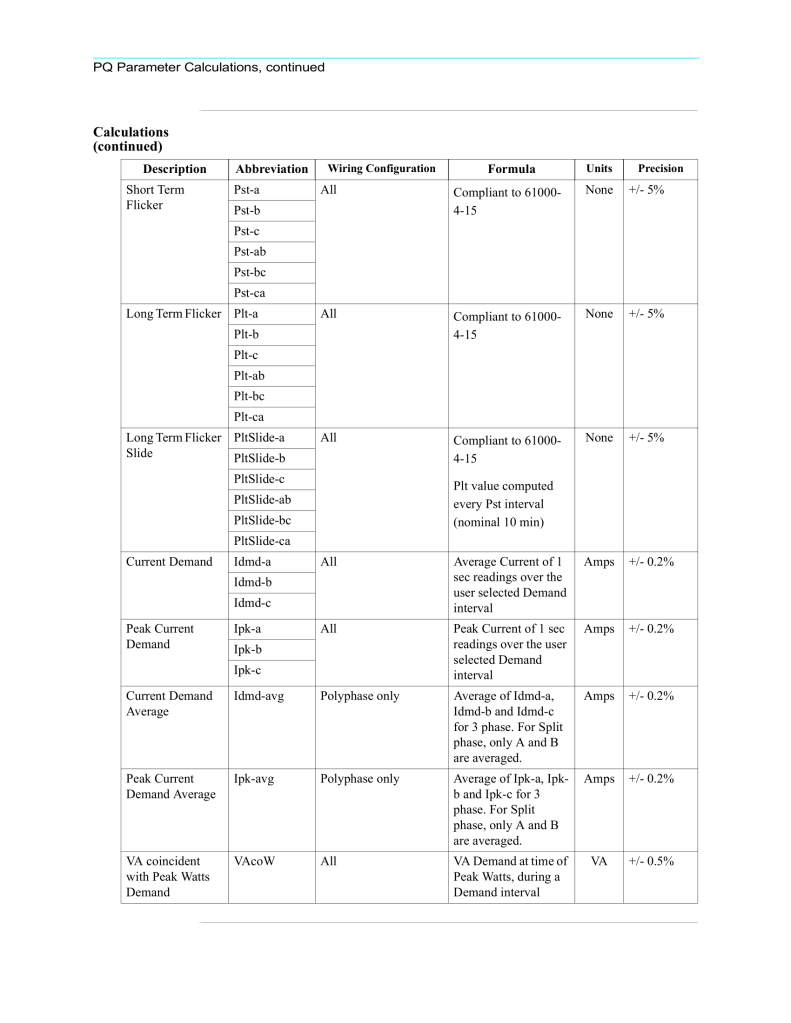
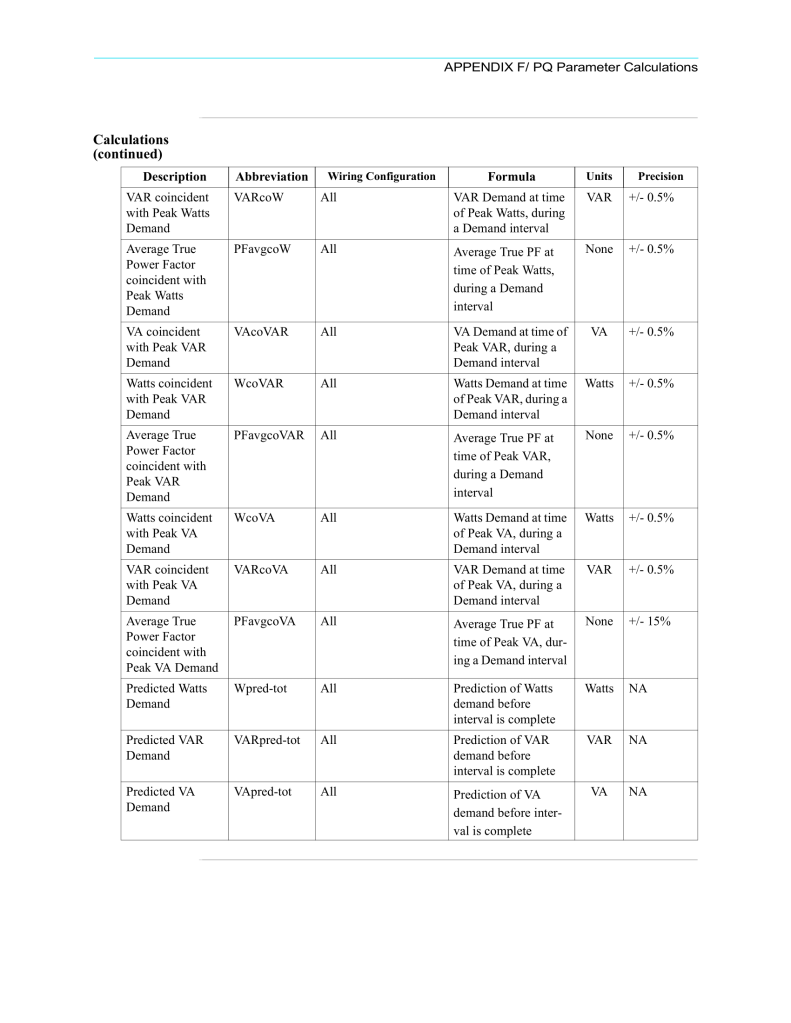
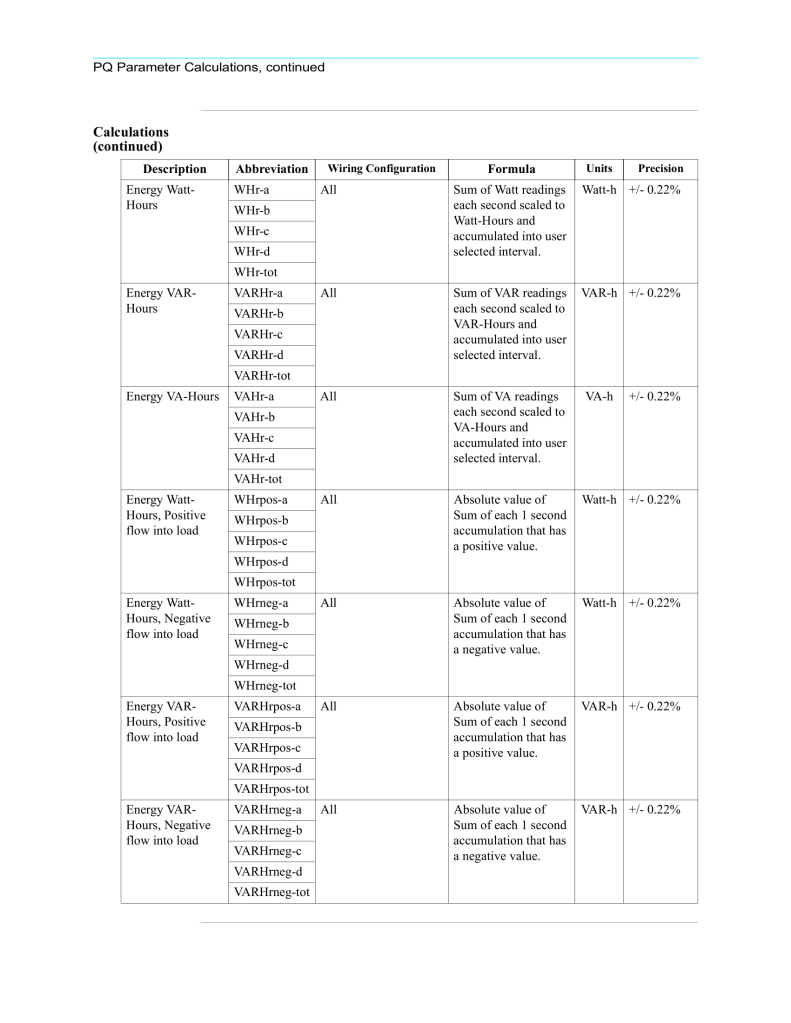
Measured Parameters of All HDPQ Models: Xplorer, Guide, Visa, SP and HDPQ DataNode
Published by Henryk Markiewicz, Email: henryk.markiewicz@pwr.wroc.pl, & Antoni Klajn, Email: antoni.klajn@pwr.wroc.pl, Wroclaw University of Technology, July 2004. Website: www.pwr.wroc.pl
Source: Leonardo Power Quality Initiative (LPQI) Power Quality Application Guide Voltage Disturbances 5.4.2 Standard EN 50160
Electrical energy is a product and, like any other product, should satisfy the proper quality requirements. If electrical equipment is to operate correctly, it requires electrical energy to be supplied at a voltage that is within a specified range around the rated value. A significant part of the equipment in use today, especially electronic and computer devices, requires good power quality (PQ). However, the same equipment often causes distortion of the voltage supply in the installation, because of its non-linear characteristics, i.e. it draws a non-sinusoidal current with a sinusoidal supply voltage (see Section 3.1 of this Guide). Thus, maintaining satisfactory PQ is a joint responsibility for the supplier and the electricity user. According to standard EN 50160 [1] the supplier is the party who provides electricity via a public distribution system, and the user or customer is the purchaser of electricity from a supplier. The user is entitled to receive a suitable quality of power from the supplier. In practice the level of PQ is a compromise between user and supplier. Where the available PQ is not sufficient for the user’s needs, PQ improvement measures will be needed and will be the subject of a cost-benefit analysis (see Section 2.5 of this Guide). However, the cost of poor PQ usually exceeds the cost of measures required for improvement – it is estimated that losses caused by poor power quality cost EU industry and commerce about € 10 billion per annum (see Section 2.1 of this Guide).
However, electrical energy is a very specific product. The possibility for storing electricity in any significant quantity is very limited so it is consumed at the instant it is generated. Measurement and evaluation of the quality of the supplied power has to be made at the instant of its consumption. The measurement of PQ is complex, since the supplier and user, whose sensitive electrical equipment is also a source of disturbances, have different perspectives.
Standard IEC 038 [2] distinguishes two different voltages in electrical networks and installations:
The main document dealing with requirements concerning the supplier’s side is standard EN 50160, which characterises voltage parameters of electrical energy in public distribution systems. This is a European standard but it is supplemented in some regions or countries by other supplemental standards, such as [3] in Germany, or [4] in Poland. Many regional codes, such as the German TAB [3] apply to an individual utility, but these are being unified as part of the liberalisation of the German electricity market. According to IEC 038, both standard EN 50160 and rules [3,4] concern the supply voltage, i.e. that measured at the point of common coupling.
On the user’s side, it is the quality of power available to the user’s equipment that is important. Correct equipment operation requires the level of electromagnetic influence on equipment to be maintained below certain limits. Equipment is influenced by disturbances on the supply and by other equipment in the installation, as well as itself influencing the supply. These problems are summarised in the EN 61000 series of EMC standards, in which limits of conducted disturbances are characterised. Equipment sensitivity to utility voltage quality, as well as mitigation measures, are presented in Section 3 (Harmonics) and Section 5 (Voltage Disturbances) of this Guide.
The subject of this section is a detailed presentation of standard EN 50160 and an analysis of its requirements according to the operation of chosen equipment. Methods of measuring supply voltage parameters are also presented.
In standard EN 50160 several voltage parameters are defined. The most important are:
Supply voltage – the rms value of the voltage at a given moment at the point of common coupling, measured over a given time interval.
Nominal voltage of the system (Un) – the voltage by which a system is designated or identified and to which certain operating characteristics are referred.
Declared supply voltage (Uc) – is normally the nominal voltage Un of the system. If, by agreement between the supplier and the user, a voltage different from the nominal voltage is applied to the terminal, then this voltage is the declared supply voltage Uc.
Normal operating condition – the condition of meeting load demand, system switching and clearing faults by automatic system protection in the absence of exceptional conditions due to external influences or major events.
Voltage variation – is an increase or decrease of voltage, due to variation of the total load of the distribution system or a part of it.
Flicker – impression of unsteadiness of visual sensation induced by a light stimulus, the luminance or spectral distribution of which fluctuates with time.
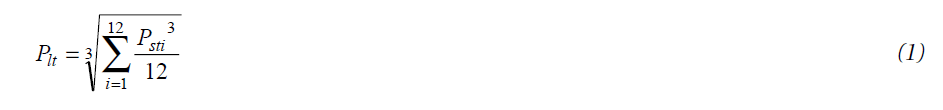
Flicker severity – intensity of flicker annoyance defined by the UIE-IEC flicker measuring method and evaluated by the following quantities:
Supply voltage dip – a sudden reduction of the supply voltage to a value between 90% and 1% of the declared voltage Uc, followed by a voltage recovery after a short period of time. Conventionally the duration of a voltage dip is between 10 ms and 1 minute. The depth of a voltage dip is defined as the difference between the minimum rms voltage during the voltage dip and the declared voltage. Voltage changes which do not reduce the supply voltage to less than 90% of the declared voltage Uc are not considered to be dips.
Supply interruption – is a condition in which the voltage at the supply terminals is lower than 1% of the declared voltage Uc. A supply interruption is classified as:
Temporary power frequency overvoltages – have relatively long duration, usually of a few power frequency periods, and originate mainly from switching operations or faults, e.g. sudden load reduction, or disconnection of short circuits.
Transient overvoltages – are oscillatory or non-oscillatory, highly damped, short overvoltages with a duration of a few milliseconds or less, originating from lightning or some switching operations, for example at switch-off of an inductive current.
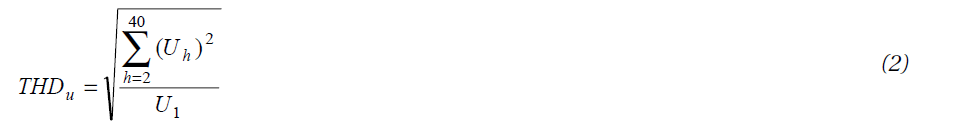
Harmonic voltage – a sinusoidal voltage with a frequency equal to an integer multiple of the fundamental frequency of the supply voltage. Harmonic voltages can be evaluated:
Interharmonic voltage – is a sinusoidal voltage with frequency between the harmonics, i.e. the frequency is not an integer multiple of the fundamental.
Voltage unbalance – is a condition where the rms value of the phase voltages or the phase angles between consecutive phases in a three-phase system are not equal.
EN 50160 gives the main voltage parameters and their permissible deviation ranges at the customer’s point of common coupling in public low voltage (LV) and medium voltage (MV) electricity distribution systems, under normal operating conditions. In this context, LV means that the phase to phase nominal rms voltage does not exceed 1000 V and MV means that the phase-to-phase nominal rms value is between 1 kV and 35 kV.
The comparison of the EN 50160 requirements with those of the EMC standards EN 61000, listed in Tables 1 and 2, show significant differences in various parameters. There are two main reasons for these differences:
◆ The EMC standards concern the utility voltage, according to IEC 038, while EN 50160 deals with the supply voltage. The differences between these voltages are due to voltage drops in the installation and disturbances originating from the network and from other equipment supplied from the installation. Because of this, in many standards of the EN 61000 series the equipment current is an important parameter, while the load current is not relevant to EN 50160.
◆ EN 50160 gives only general limits, which are technically and economically possible for the supplier to maintain in public distribution systems. When more rigorous conditions are required, a separate, detailed agreement between supplier and consumer must be negotiated. Measures for improving PQ imply additional cost and equipment and are considered in other parts of this Guide.
◆ EN 50160 has additional limitations. It does not apply under abnormal operating conditions, including the following:
As the analysis of parameters presented in Table 1 shows, these requirements are not particularly rigorous for the supplier. The numerous situations in which the standard does not apply can excuse the majority of outages and voltage disturbance events that occur in practice. Thus, many suppliers interpret the requirements of EN 50160 as principally informative and accept no responsibility when the limits are exceeded.

Table 1 – Comparison of supply voltage requirements according to EN 50160 and the EMC standards EN 61000
On the other hand, the consumer’s point of view is usually totally different – they regard the limits given in EN 50160 as requirements that must be guaranteed by the supplier. However, as mentioned before, for many consumers, even fulfilling the requirements given in EN 50160 does not assure a satisfactory level of PQ. In such cases the level of PQ required must be defined in a separate agreement between supplier and consumer.

Table 2 – Values of individual harmonic voltages at the supply terminals for orders up to 25, given in percent of Un
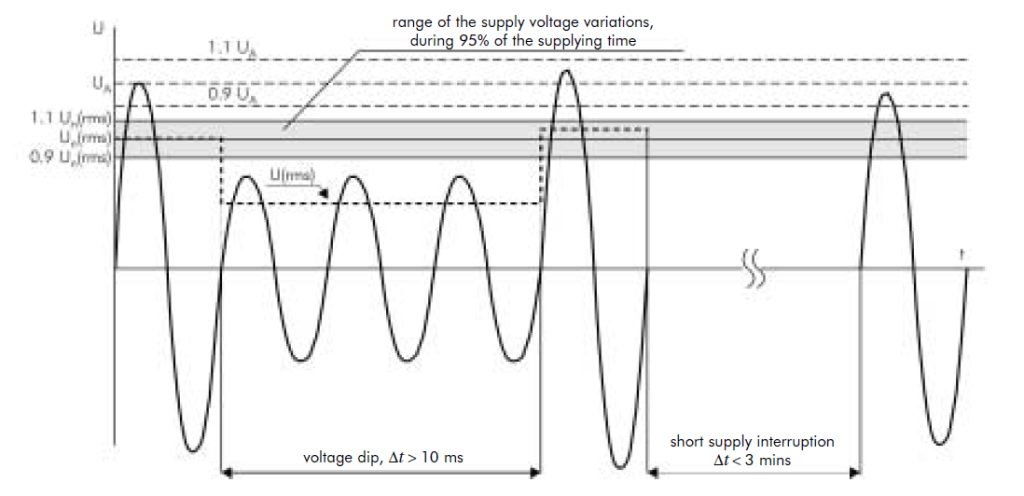
Figure 1 – Illustration of a voltage dip and a short supply interruption, classified according to EN 50160; Un – nominal voltage of the supply system (rms), UA – amplitude of the supply voltage, U(rms) – the actual rms value of the supply voltage
The correct operation of electrical equipment requires a supply voltage that is as close as possible to the rated voltage. Even relatively small deviations from the rated value can cause sub-optimal operation of equipment, e.g. operation at reduced efficiency, or higher power consumption with additional losses and shorter service life. Sometimes prolonged deviations can cause operation of protection devices, resulting in outages. Of course, the correct operation of equipment also depends on many other factors, such as environmental conditions and proper selection and installation.
Investigation of the independent influence of each supply voltage parameter on equipment operation is easily performed, but when parameters vary simultaneously the situation is much more complex. In some cases, after detailed analysis of the effects of each of the different voltage parameters, results can be superimposed in order to estimate the total influence of many parameters. The influence of a particular voltage parameter on equipment operation is made based on mathematical formulae describing analysed physical phenomena. Two simple examples, concerning lighting and motors, follow.
For incandescent light sources, supply voltage is the most significant influence on the luminous flux, as illustrated in Figure 2 and formula (3). The permissible supply voltage variations according to EN 50160 can thus cause significant changes of the flux. EN 50160 allows, for example, that the supply voltage can be equal to Un-10 % or Un+10% for a long period, thus an incandescent lamp will deliver as little as 70%, or as much as 140%, of its nominal luminous flux respectively. Furthermore, at Un +10%, the service life of these lamps is reduced to about 25% of the nominal value (Figure 3), i.e. about 250 hours instead of the typical life of 1 000 hours. (Note that the durability of fluorescent and discharge lamps depends mainly on the number of turn-on cycles. The effect of supply variations is small.) The values shown in Figures 2 and 3 are calculated for steady state operation voltage at the given value.
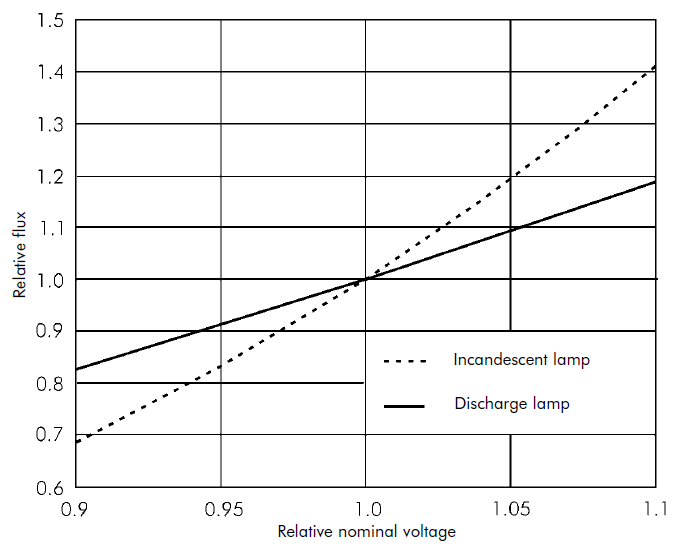
Figure 2 – Relative value of luminous flux F of an incandescent and discharge lamp as a function of the supply voltage according to formula (3)

Figure 3 – Relative value of the service life (durability) of an incandescent lamp as a function of the supply voltage according to formula (4)
In practice the voltage value changes continuously according to the operation and load conditions in the network, as for example shown in Figure 4. The mathematical description of characteristics shown in Figures 2 and 3 are:

where:
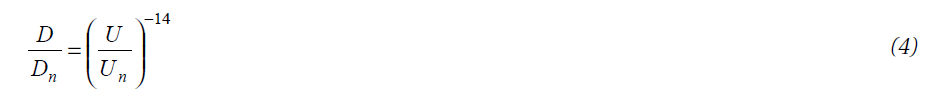
where:

Figure 4 – Examples of voltage dips (rms phase to neutral voltage); oscillograms showing the supply voltage (upper trace) and frequency changes (lower trace) at the PCC of a small factory
One can see that the requirements concerning voltage changes in EN 50160 are not very rigorous. Even keeping voltage variations in the permissible limit ±10%, can cause under performance of lighting sources In practice, these variations should be limited to about ±(3-4)%, in order to avoid negative consequences in lighting.
The voltage fluctuations shown in Figure 4 illustrate the voltage influence on the flicker severity, which can be measured and calculated according to formula (1). Measurement of flicker is considered in another section of the Guide.
For electric motors the most significant factor is the fluctuation of torque, which depends on the square of the supply voltage value. Problems could occur during start-up of heavy loads, because the inrush current causes an additional voltage drop within the installation (Figure 5). In practice, for the majority of three phase electric motors, start-up occurs normally at or above 85% of nominal voltage for heavy starting loads and at or above 70% for light starting loads. Thus, the EN 50160 voltage fluctuation requirements are satisfactory here. However prolonged operation of the motor at an rms voltage value of –10% or +10 % of Un can cause other negative consequences: overloading and operation of the thermal protection in the first case, or operation at excessive power and protection tripping in the second case. All voltage dips can cause nuisance tripping of the motor protection.
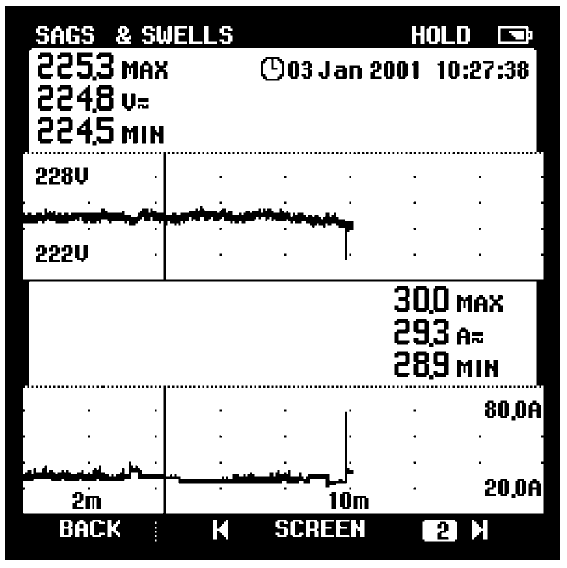
Figure 5 – Example of supply voltage changes (upper trace) at start-up of an asynchronous motor; lower trace – load current in the supplied installation of a small factory; the peak at the end of current flow is the inrush process
The influence of the load current on the supply voltage in the installation depends on the impedance of the supply grid. The utilization voltage at the equipment depends on the impedance of the supply grid and that of the customer’s installation. An illustration of the influence of load current on the supply voltage is shown in Figure 6.

Figure 6 – Illustration of the load current influence on the supply voltage dips in the electrical installation
Other important problems for the motors are voltage harmonics in and unbalance of the supply voltage. Voltage unbalance in a three-phase system causes an opposing torque, proportional to the negative sequence voltage component. Each voltage harmonic produces a respective harmonic current and its own torque, which can be coherent or opposite to the main torque, for various slip values. The most important here are the 5th and 7th harmonics. Figure 7 illustrates a case in which the 7th harmonic torque can cause problems during motor start-up, where the characteristic torque and the braking torque curves cross.

Figure 7 – Influence of asynchronous torque produced by harmonics on the main torque characteristic of an asynchronous motor
For other electrical equipment the relationship between supply voltage and its power or efficiency may be significant. For the majority of equipment, voltage changes in the range (0.9 – 1.1) Un do not cause any negative consequences, especially for common heating devices. For equipment with a higher sensitivity to the supply voltage proper protection should be installed.
Measurement and testing of supply voltage quality, according to EN 50160, requires specialised apparatus and measuring methods (see Sections 3.2 and 5.2 of this Guide). This arrangement enables continuous monitoring, over 7 days, of the following parameters:
This type of equipment also enables measurement of voltage dips and outages, its frequency and duration.
The measured parameters are processed and recorded as 10 minute time-segments (1008 segments over 7 days). For each segment the mean value of the measured parameter is calculated. After the 7-day recording period a so-called “ordered diagram” is produced, which shows the sum of the duration of a given distortion level in the observed time period. (For frequency measurement, the duration of each single segment is 10 seconds).
An example of an ordered diagram is shown in Figure 8. It clearly shows whether the measured voltage parameters have been maintained at the permissible level for 95% of the tested time. (Table 1).
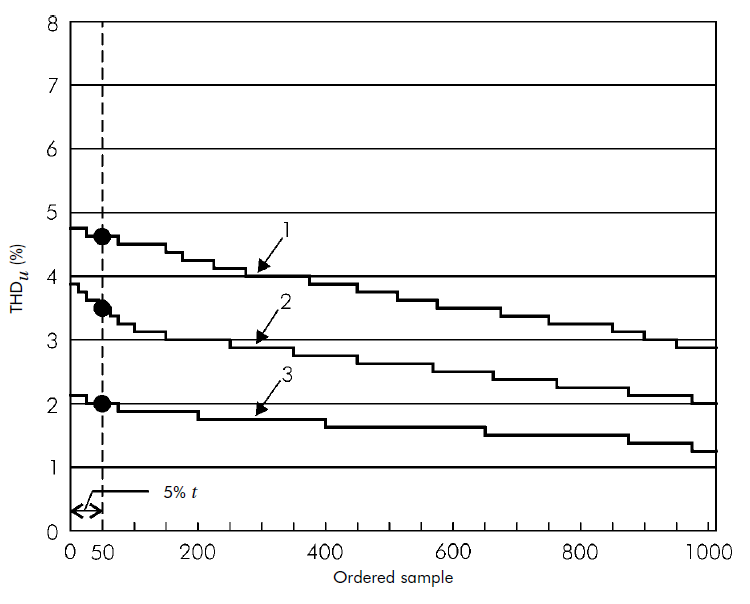
Figure 8 – Example of the ordered diagram of the total harmonic distortion factor measured in substations supplying low voltage industrial (1 and 3) and municipal (2) networks
As mentioned above, while EN 50160 gives general limits for public supply networks, various European countries have additional rules governing supply conditions. Many of these national regulations cover areas not included in EN 50160, such as the maximum permissible harmonic load to be connected to the PCC.
The German national standard VDE 0100 states that the voltage parameters defined in DIN EN 50160 reflect extreme situations in the network and are not representative of typical conditions. In planning networks, the recommendations of VDE 0100 should be followed. One of the TABs [3] gives maximum values (per unit) for phase-angle controlled resistive loads (1 700 VA single-phase, 3 300 VA two-phase and 5 000 VA balanced three-phase) and for uncontrolled rectifier loads with capacitive smoothing (300 VA single-phase, 600 VA two-phase and 1000 VA balanced three-phase). The equipment standard VDE 0838 (EN 60555) is also quoted.
In Poland, the rules of electrical energy distribution established by the government [4] give the fundamental parameters of the supply voltage (Table 3) and do not refer to EN 50160. Additionally, consumers are divided into six groups, for which separate, permissible total annual outage times are defined. The document also deals in detail with various economic aspects of the energy market, principles of settlement between network and distribution companies etc.
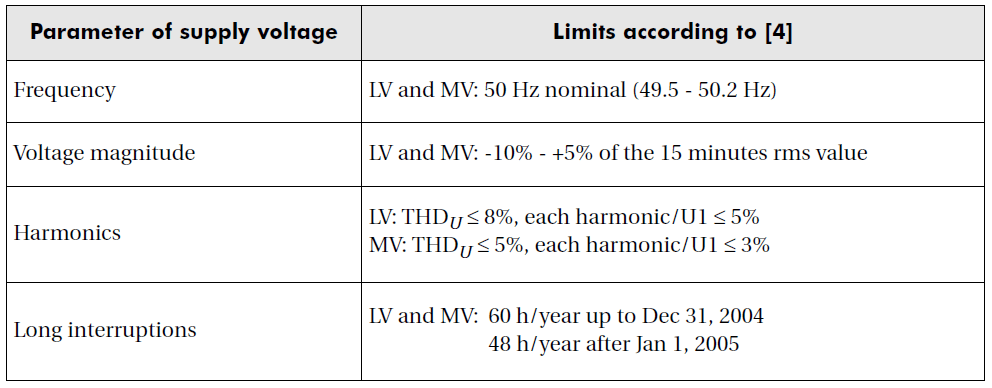
Table 3 – Requirements concerning PQ of supply voltage in Polish distribution network, according to [4]
In Italy there is an important document dealing with the continuity of supplied supply [8]. The Italian Regulatory Authority for Electricity and Gas (AEEG) has in fact set out a uniform system of service continuity indicators and has put in place a system of incentives and penalties in order to progressively bring continuity levels up to meet European standards. The Authority has divided the national territory into 230 geographical zones, sub-divided by areas of population density and has set improvement targets for each area on the basis of the previous year’s performance. Utilities that succeed in improving by more than the required rate can recover the higher costs sustained. Conversely, companies have to pay a penalty if they fail to meet the improvement target. Interruptions due to acts of God, or those caused by third parties, are not included in the calculation. The overall performance target is to bring continuity levels up to national benchmark levels based on European standards: 30 minutes of interruptions overall per user per year in large cities (high density); 45 minutes in medium-sized towns (medium density): and 60 minutes in rural areas (low density). Other countries have similar regimes imposed by the regulatory authorities.
The UK has a number of documents making up the distribution code. One of the most important is G5/4, discussed elsewhere in this Guide, which regulates the connection of harmonic loads to the point of common coupling. Measures to encourage the improvement of continuity are the responsibility of the Office of Gas and Electricity Markets (OFGEM).
The requirements of EN 50160 are not difficult for electricity suppliers to fulfil. The parameters of the supply voltage shall be within the specified range (Table 1) during 95% of the test period, while the permitted deviations in the remaining 5% of the period are much greater. For example, the mean value during 95% of the time shall be between 90% and 110% of the nominal voltage. This means that, in an extreme case, customers could be supplied at 90% of nominal voltage continuously while, for 5% of the time, the voltage could be much lower. If, in such a boundary situation, other parameters are also at the extremes permitted in the standard, for example harmonic voltages or voltage unbalance, then equipment mal-operation is likely.
The standard could be improved. For example, requiring the mean values of measured voltage parameters, over the whole of the test period within ±5% would guarantee that the supply voltage could not be maintained at the lower or upper boundary value for a prolonged period.
The number of voltage dips permitted (up to 1 000 during the year) and the number of short and long outages are rather high from the customer’s point of view. Voltage dips to below 30% of the nominal voltage with duration longer than 0.3 s can cause low voltage protection to trip or contactors in the motor circuits to drop out. Thus, the real number of process interruptions will be much greater than the number that would be expected to result from voltage interruptions.
EN 50160 should be understood as representing a compromise between supplier and customer. It requires that the supplier provide, as a minimum, a barely adequate quality supply. Most suppliers routinely exceed these requirements by a large margin, but do not guarantee to do so. If the customer has higher requirements, mitigation measures should be provided or a separate agreement for a higher quality supply must be negotiated. However, the important advantage of the standard is:
It is the task of the electricity regulator to set a level of quality that requires best practice from the supplier, while not setting the level too high so that the price of electricity increases for everybody.
[1] EN 50160, Voltage characteristics of electricity supplied by public distribution systems, 1999
[2] IEC 038, IEC standard voltages, 1999
[3] Technische Anschlussbedingungen (Technical requirements of connection), VDEW
[4] Rozporzadzenie Ministra Gospodarki z dnia 25 wrzesnia 2000, w sprawie szczególowych warunków przylaczania podmiotów do sieci elektroenergetycznych, obrotu energia elektryczna, swiadczenia uslug przesylowych, ruchu sieciowego i eksploatacji sieci oraz standardów jakosciowych obslugi odbiorców. Dziennik Ustaw Nr 85, poz. 957 (Rules of detailed conditions of connection of consumers to the electrical power network and quality requirements in Poland).
[5] Baranecki A et al, Poprawa jakosci zasilania w sieciach NN i SN. (Improvement of supply quality in LV and MV networks), Elektronizacja 1-2/2001
[6] Seipp G G, Elektrische Installationstechnik, Berlin – München, Siemens AG, 1993
[7] DIN VDE 0100-100 (VDE 0100 part 100): 2002-08
[8] Decision 128/1999: Definizione di obblighi di registrazione delle interruzioni del servizio di distribuzione dell’energia elettrica e di indicatori di continuità del servizio
[9] Decision 144/00: Determinazione dei livelli effettivi base e dei livelli tendenziali di continuità del servizio per ogni ambito territoriale e per ogni anno del periodo 2000-2003 ai sensi dell’articolo 7 della deliberazione dell’Autorità per l’energia elettrica e il gas 28 dicembre 1999, n. 202/99 e per la determinazione della media nazionale dei livelli tendenziali di continuità del servizio per l’anno 2004, ai sensi dell’articolo 9, comma 9.4, della medesima deliberazione.
Published by Nasiru B. Kadandani, Department of Electrical Engineering, Bayero University, Kano, Nigeria. Email: nbkadandani.ele@buk.edu.ng.
Published in: The Proceedings of Second International Conference on Electrical and Electronics Engineering, Clean Energy and Green Computing, Konya, Turkey, 2015.
Grid integration of intermittent renewable energy sources like wind and solar is usually associated with power quality disturbance especially when the penetration level is high. This paper investigates the power quality issues associated with grid connected wind power plant (WPP) and how to overcome such problems using static synchronous compensator (STATCOM) – a member of Flexible A.C Transmission System (FACTS) devices. The major power quality issue investigated in the paper is harmonic distortions. Other power quality parameters such as voltage dip, voltage swell, flicker, transient, short and long interruptions were also briefly introduced. The entire system including the STATCOM control scheme is simulated in Simulink environment of MATLAB. Simulation results show that the harmonic contents at the output of the system with unfiltered linear loads are quite high, thus showing power quality deterioration. Fast Fourier Transform (FFT) analysis on the voltage and current waveforms of the system show that the STATCOM control scheme is capable of cancelling out the reactive and harmonic parts of the load current thereby restoring the smooth sinusoidal waveform of the voltage and current at the wind point of interconnection (POI), or point of common coupling (PCC) which signifies power quality improvement.
Keywords—power quality; STATCOM; THD; FFT; WPP.
Power quality is a term used by engineers to refer to the problems associated with voltage, current or frequency deviation that result in failure or equipment malfunction. It is usually related to maintaining a smooth sinusoidal waveform of bus voltage, current and frequency [1]. Thus, a perfect power supply is one that is highly available within prescribed voltage and frequency tolerances, with smooth sinusoidal wave form and also enables equipment work properly. On the other hand, any disturbance in the magnitude, frequency or purity from the balanced three phase sinusoidal wave form can lead to deterioration of the power quality. Power quality is of great concern to consumers, utilities and equipment manufacturers. It becomes especially important with the insertion of sophisticated devices, whose performance is very sensitive to the quality of power supply [2]. Power quality study is gaining much emphasis due to the increased proliferation of sensitive equipment and the need of maintaining excellence in electrical power generation [3]. Increased research in grid integration of wind turbine and the actual project development makes power quality issues more and more important both in theory and practice.
Among all forms of power quality issues in grid connected wind power plants (WPP), harmonic distortion is more common since any deviation from a perfect sinusoidal wave shape in voltage, current or frequency is an indication of the presence of harmonics in the power system. Due to the wide-spread use of power electronic devices in residential, commercial and industrial loads, electric utilities have experienced an increase in the level of harmonic frequencies on their electrical delivery systems. Hence, the potential harmonic effects on power equipment and system operation are becoming a concern for the utilities.
In response to the aforementioned challenges, some utility operators and wind farm vendors usually assess the quality of power supplied to major customers through measurement and analysis to ascertain whether the harmonic levels are within allowable limits as recommended by regulating bodies like IEC and IEEE. Fortunately, intensive research in power electronics has lead to the development of flexible a.c transmission system (FACTS) devices for power quality improvement. Such devices are capable of mitigating power quality disturbances with respect to grid codes and provide power system stability by controlling the power flow in a transmission network using power electronic controlled devices [4]. FACTS devices are categorized into two, namely; Thyristor-based FACTS controllers and GTO based FACTS controllers. Members of the first category include Static VAR Compensator (SVC), Thyristor Controlled Series Capacitor (TCSC), Thyristor Controlled Phase Angle Regulator (TCPAR), e.t.c. The second category includes static synchronous compensator (STATCOM), Static Synchronous Series Compensator (SSS), Unified Power Flow Controller (UPFC), e.t.c.
A. Harmonic Distortions
Harmonic distortion refers to the periodic deviation of voltage (or current) sine wave from a smooth sinusoidal shape and usually occurs when frequencies of the multiple integers of the fundamental frequency are added to the pure sinusoidal waveform of the voltage (or current). Harmonics are therefore integer multiples of the fundamental frequency. Total harmonic distortion (THD) is a measure of all the values of the waveform that are distorted.
At the generation end, harmonics are usually caused by power electronic converters used in variable speed wind turbine, while at the receiving (consumer) end, harmonics are caused by non-linear loads (equipment’s that do not use voltage or current in normal sinusoidal shape) such as computers, television, arc furnace, arc welders, mercury lamps, electronic ballasts, battery charger, variable speed drives, medical diagnostic equipment and fluorescent lamps [5]. Other causes of harmonics include resonance phenomena, transformer saturation, light dimmers and switch mode power supplies.
Harmonics can cause significant damage to transmission and distribution network as well as to consumer equipment. The most notable effects of harmonic distortion are; overload operation of electric motor, nuisance tripping of circuit breaker, misbehaved operation of fuses, tripping of variable speed drives, overheating of electric motors and transformers, incorrect power measurement and failure or damage to electrical equipment’s like contactors and power factor correction capacitors.
Harmonic distortions can be mitigated by application of active conditioners, input chokes, passive filters, isolation transformers, and equipment’s with build-in power factor correction capability such as FACTS devices like STATCOM, DVR, SVC.
• Harmonic Distortion in Bus Voltages
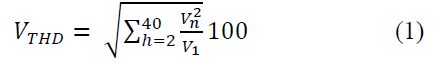
The total harmonic distortion of bus voltage, 𝑉𝑇𝐻𝐷 is defined as the ratio of the square root of the sum of squares of the rms value of the harmonic component, 𝑉𝑛 to the rms value of the fundamental component, 𝑉1 [6].
For 132kV, the voltage THD limit is <3% [7].
• Harmonic Distortion in Line Currents
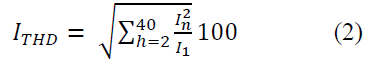
The total harmonic distortion of line current, 𝐼𝑇𝐻𝐷 is defined as the ratio of the square root of the sum of squares of the rms value of the harmonic component, 𝐼𝑛 to the rms value of the fundamental component, 𝐼1 [6].
For 132kV, the current THD limit is <2.5% [7].
It can be seen from equations 1 and 2 that THD is the rms value of the waveform when the fundamental is removed. The fundamental of a smooth sinusoidal voltage (or current) waveform is the system frequency (50Hz in some countries and 60Hz in others).
B. Flicker
Flicker is a term used to relate the short lived voltage variation that is associated with annoying changes in the luminance of lamps. It is usually caused by the two modes of operations of the WPP, namely; switching operations and continuous operations. Flicker from switching operation usually occurs as a result of start-up and shut down of the wind turbines (WTs). Continuous operations like blade pitching, wind turbulence, tower shadow, wind shear, and yaw misalignment can also cause flicker. Furthermore, industrial loads such as welding machine, electric boilers and electric arc furnaces also cause flicker [8].
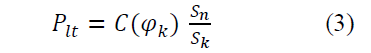
The long term flicker, 𝑃𝑙𝑡, which is usually evaluated over 2 hours period is expressed in [9] as:
Where
𝑆𝑛= Rated apparent power of the WT,
𝑆𝑘= Short circuit apparent power of the grid,
𝜑= Phase shift and
𝐶= Flicker coefficient
The limiting value for flicker coefficient is ≤ 0.4 for average value of 2 hours [10].
The main effect of flicker is the annoying and noticeable changes in lightning levels. Flicker can be mitigated by controlling the power factor angle; controlling the voltage at PCC and by application of FACTS devices like STATCOM, SVC and UPFC.
C. Voltage Dip / Voltage Sag
A voltage dip (or voltage sag) is defined as a sudden reduction of the voltage to a value between 1% and 90% of its nominal value followed by a voltage recovery after a short period of time, conventionally 1 millisecond to 1 minute. In other word, it refers to the sudden reduction in the potential of electric grid usually between 10% and 90% of its nominal value followed by a rapid return to its normal value for duration of 0.5 cycles to 1 minute [11].
Voltage dip, Δ𝑈𝑑, at the wind point of common coupling (PCC), or point of interconnection (POI) can be expressed as a function of rated apparent power of the WT, 𝑆𝑛, Short circuit apparent power of the grid, 𝑆𝑘, voltage change factor, 𝐾𝑢(𝜑𝑘), and Phase shift, 𝜑 [12].
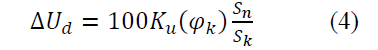
The acceptable voltage dip limiting value is ≤ 3% [13].
In grid connected WPP, voltage dip is usually said to occurs when large wind turbines are started up together – in which case, the current drawn from the electric grid will rise to a high value for duration of milliseconds. It can also occur as a result of the start up of large motors or when there is grid short circuit [14]. Other sources of voltage dip in power system include power line switching, lightning stroke, utility and facility faults, balanced or unbalanced faults, large load changes and starting of heavy electrical loads.
The main consequences of voltage dip include loss of data, shutdown (system halts), fail function of equipment and disconnection of sensitive loads. Other effects of voltage dip include light flicker, failure of transformers and motors, overload operation of motors, tripping of variable speed drives and loss of computer or controller memory.
In complex systems like grid connected WPP, a severe voltage dip can leads to cascading failures as result of disconnection of the wind generators that can further results in loss of generation; which will consequently affects the stability of the net power system [5]. Furthermore, the fault clearance is usually followed by high inrush current during the recovery process. The WT is required to be able to “ride through” a severe voltage dip and other power quality disturbance by remaining in operation and connected to the grid during the fault. Hence, voltage dip should be given more attention in order to avoid cascading failures in complex power system.
Depending on the condition and location in the power system, voltage dip can be mitigated by installing devices such as ferroresonant transformer, sag proofing transformer, uninterruptible power supply (UPS), coil-hold in devices, flywheel and motor-generator (MG), and FACTS devices like STATCOM, SVC and DVR.
D. Voltage Swell
Voltage swell is a term used to refer to the increase in the rms value of a voltage or current at power frequency from 1.1p.u to 1.8p.u for duration of 30 to 60 seconds [15]. Voltage swell at the PCC is given as a function of the turbine’s maximum apparent power, 𝑆𝑚𝑎𝑥, grid impedance (Resistance, 𝑅, and Reactance, 𝑋) and the phase shift, 𝜑 [16]:
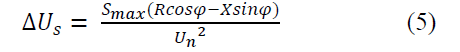
The limiting voltage rise value is < 2% [17].
In grid connected WPP, voltage swell is usually caused by large load changes such as starting up and shutting down of large capacity WTs as well as by power-line switching. Other origins of voltage swell include sudden drop of loads, open neutral connection, unsymmetrical faults, and energizing a large bank of capacitor.
The main consequences of voltage swell include equipment malfunction, insulation breakdown, disconnection of equipment, failure or damage on power factor correction capacitor, damage to electric contactor, light flicker and tripping of variable speed drives.
Mitigation of voltage swell can be achieved by the use of transformer with tap changing, connection of large load at the PCC, application of soft starter, – a device capable of providing smooth connection and by installing FACTS devices like STATCOM.
E. Voltage Transient
Voltage transients are sudden and significant deviations from normal levels usually of short durations (microseconds or milliseconds) and vary greatly in magnitude [18]. They are usually caused by lightning, electrostatic discharges, or load switching. Transient disturbances are sometimes called surges.
The frequency of the transient is defined in [19] by the following expression:
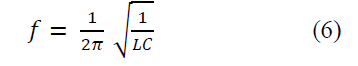
Where
𝑓= Frequency of the supply
𝐿= Inductance
𝐶= Capacitance of the grid
In grid connected WPPs, transient can occur when some WTs are suddenly switched on or off, or when there is lightning discharge. Similarly, the inrush current that arises due to the connection or disconnection of induction generator can also give rise to voltage transient. Transient disturbances can also occur when mechanical switches are used to switch power factor correction devices (such as reactive power compensation capacitors). Other sources of transients include, load switching, utility fault clearing and facility faults.
The main consequences of voltage transients are insulation failure, loss of data, equipment damage, overheating of equipment, and reduced lifetime of transformers and motors. Other effects include errors on microprocessor controlled equipment, computer system data alterations, tripping of variable speed drives, misbehaved fuse operation and damage to electrical contactors and other electronic equipment.
Voltage transients can be mitigated by installing equipment’s with build-in power factor correction capability like STATCOM, DVR and SVC.
F. Short Interruptions
This is a term used to refer to the total interruptions of electrical power supply for a duration ranging from few milliseconds to one or two seconds. It is usually caused by the opening and automatic re-closure of protection devices. The main impacts of short interruption are; tripping of protection devices and stoppage of sensitive equipment like computer.
G. Long Interruptions
When the total interruption of electrical power supply exceeds two seconds, then, it is referred to as long interruptions. It is usually caused by failure of protection devices or equipment failure in the power system.
A. Basic Configuration
STATCOM is a member of GTO based FACTS family. It is a shunt connected reactive power compensation device that can regulate bus voltage at the wind POI. Depending on the condition, a STATCOM can control the electric power system parameters by generating or absorbing reactive power. STATCOM is a shunt connected FACTS device whose output current (inductive or capacitive) can be controlled independently of the a.c system voltage [20]. It is capable of helping WPP to stabilize after disturbances.
Basically, STATCOM consists of two-level voltage source converter (VSC) with d.c energy storage; a coupling transformer connected in shunt with the a.c system and control devices (Fig. 1). The VSC converts the d.c voltage across the d.c energy storage device into a set of three phase a.c output voltage. The three phase voltages are in phase with the a.c voltage and are coupled with the a.c system through the reactance of the coupling transformer. Active and reactive power control can be achieved by varying the magnitude and phase angle of the STATCOM. Thus, when fed from an energy source or energy storage device, a STATCOM can generate or absorb independently controllable real and reactive power at its output terminals. In other words, it can provide a.c power when connected to a source.
STATCOM is analogous to an ideal synchronous machine, in which case, it can generate a balanced three phase sinusoidal voltage at fundamental frequency with controllable amplitude and phase angle. Hence, it can regulate the voltage profile of the bus to which it is connected.
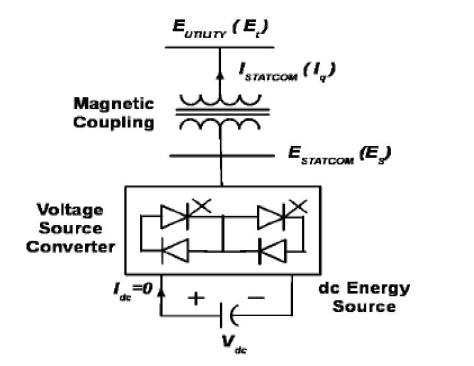
Fig. 1. Basic Configuration of a STATCOM.
B. STATCOM Topology for Power Quality Improvement in Grid Connected WPP
The STATCOM control scheme is connected with the interface of an induction generator and some linear loads at the PCC with the grid network (Fig. 2). In order to maintain the power quality of the grid network, the output of the STATCOM is varied in accordance with the control strategy. The STATCOM used here is IGBT based and is capable of providing the reactive power support to the induction generator and the nonlinear load in the grid network. Specifically, the STATCOM is used to provide the reactive power support to the grid connected WPP. The design is made in such a way as to provide the required reactive power to the WPP under normal operation and also to operate as reactive power source when the wind is below the cut-in (i.e. the minimum wind speed required to starts the turbine).
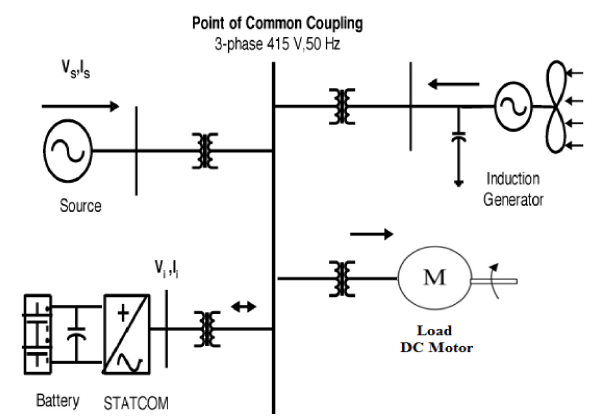
Fig. 2. STATCOM in a Grid Connected WPP for Power Quality Improvement.
The a.c voltage difference across the transformer leakage reactance results in an exchange of reactive power between the STATCOM and the power system in such a way that the a.c system bus voltage can be regulated to improve the voltage profile of the system. The VSC generates a controllable a.c voltage source behind the transformer leakage reactance. The VSC voltage is compared with the system a.c bus voltage. If the voltage magnitudes are equal, the reactive power exchange is zero. When the system a.c bus voltage is greater than the VSC voltage, the a.c system sees the STATCOM as an inductance connected to its terminals. If however the system a.c bus voltage is lower than the VSC voltage, the system sees the STATCOM as a capacitance connected to its terminals.
C. Advantages of STATCOM over other FACTS Device
In this paper, STATCOM is used as the FACTS device for power quality improvement because of the following advantages that it offers over other FACTS family:
• It provides harmonic filtering
• It provides power factor correction
• It is faster in terms of voltage control and reactive power support
• It provides both capacitive and inductive compensation
• It has the capability of controlling output current over the rated maximum capacitive or inductive range independent of the a.c system voltage
• It has increased transient rating in both capacitive and inductive operating regions
• It can maintain full compensating current at depressed line voltage
• It can control output power and provide power oscillation damping by self generation and or absorption of reactive power
• The reactive power provision is independent from the actual voltage on the point of interconnection with the grid network
• It can produce full capacitive output current at low system voltage
A wind energy system is simulated in Simulink environment of MATLAB and connected to a simulated grid network having a non-linear load as shown in Fig. 3.
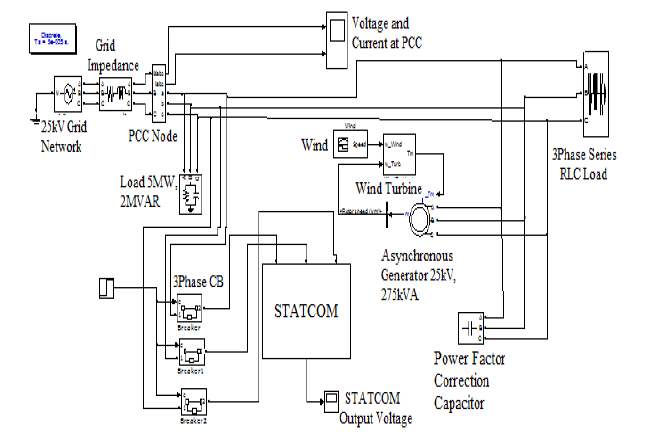
Fig. 3. Proposed Grid Connected WPP with STATCOM Controller.
A. Simulation Results Without STATCOM Controller
The STATCOM controller is first switched off and a simulation is run. Result obtained (Fig. 4) shows how the wind penetration and the non-linear load contributes in deteriorating the voltage and current wave forms from being of smooth sinusoidal shape, thereby deteriorating the power quality of the system.
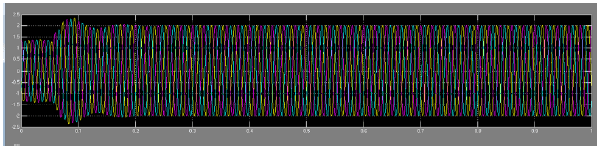
Fig. 4a. 3-Phase Voltage at the Wind POI without a STATCOM Controller.

Fig. 4b. 3-Phase Current at the wind POI without a STATCOM Controller.
FFT analysis on the above voltage and current waveforms of Fig. 4 gives THD level of 1.40% and 3.20% respectively which are high enough to deteriorate the power quality of the system as shown in Fig. 5.
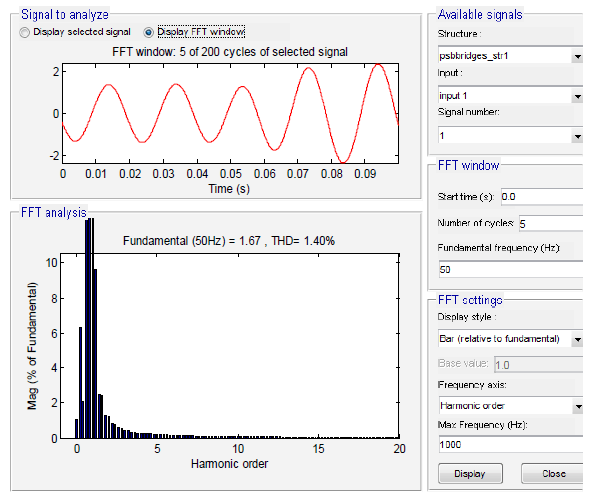
Fig. 5a. FFT Analysis of Voltage Waveform at the Wind POI without STATCOM Controller.
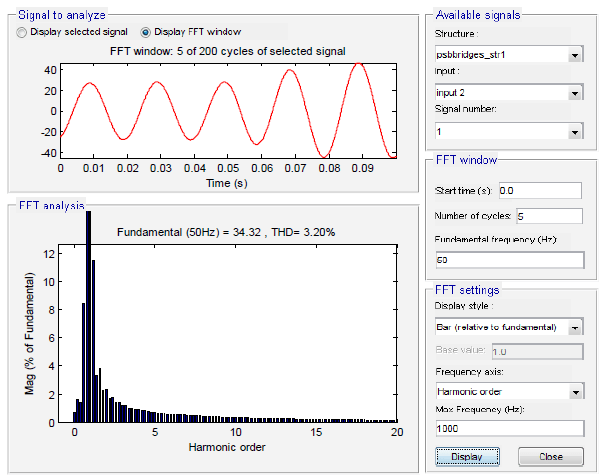
Fig. 5b. FFT Analysis of Current Waveform at the Wind POI without STATCOM Controller.
B. Simulation Results With STATCOM Controller
The simulation is re-run with the STATCOM controller switched on and all other load parameters intact. The result shows how the STATCOM control scheme mitigates the harmonic current and provides the necessary harmonic compensation thereby cancelling the voltage and frequency variations on the system (Fig. 6). The power quality of the system is thus improved.
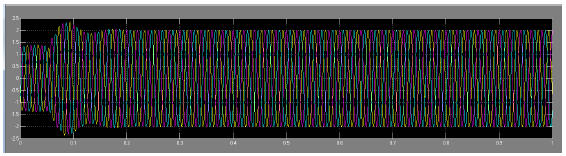
Fig. 6a. 3-phase Voltage at the Wind POI with a STATCOM Controller.
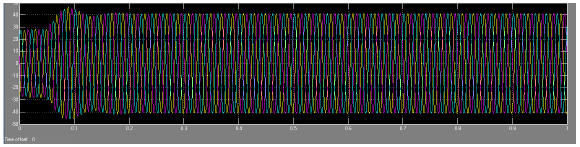
Fig. 6b. 3-phase Current at the Wnd POI with a STATCOM Controller.
FFT analysis on the voltage and current waveforms of Fig. 6 gives THD level of 0.13% and 0.38% respectively. These low values of THD signify improvement on the power quality of the system as shown in Fig. 7.
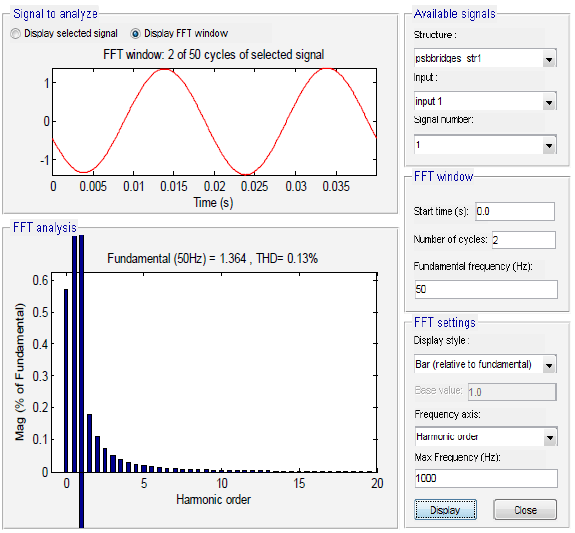
Fig. 7a. FFT Analysis of Voltage Waveform at the Wind POI with STATCOM Controller.
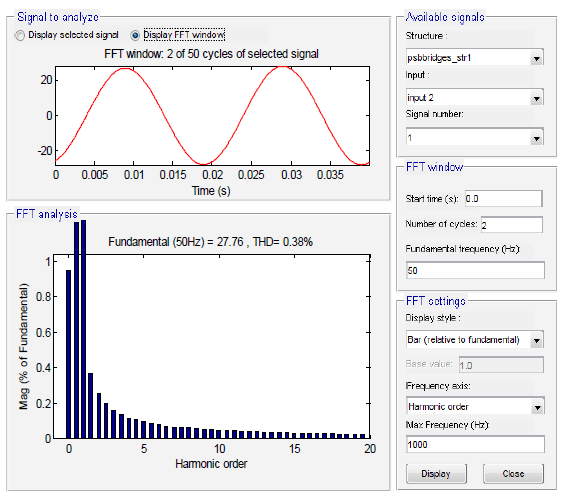
Fig. 7b. FFT Analysis of Current Waveform at the Wind POI with a STATCOM Controller.
The paper has presented power quality parameters related to an electrical power system with large wind power penetration. Specifically, emphasis is given on harmonic distortion due to the increased use of nonlinear loads by consumers. The paper have also presented a STATCOM control scheme for power quality improvement in a grid connected WPP consisting of non-linear load and waveform analysis using FFT. Simulation results show that the harmonic contents at the output of the system with unfiltered linear loads are quite high. FFT analysis on the voltage and current waveforms of the system show that the STATCOM control scheme is an excellent means of cancelling out the reactive and harmonic parts of the load current thereby restoring the smooth sinusoidal waveform of the voltage and current at the wind POI, which signifies power quality improvement.
References
[1] V. Kumbha, and N. Sumathi, “Power Quality Improvement of Distribution Lines Using DSTATCOM Under Various Loading Conditions”, Int. Journal of Modern Engineering Research, Vol. 2, Issue 5, September – October 2012, pp 3451 – 3457.
[2] J. Sridevi, J. Amarnath, and G. Govinda Rao, “Zonal Power Quality Improvement Using Static VAR Compensator for an Indian Utility System”, Int. Journal of Engineering Research and Application, Vol. 2, Issue 3, May – June 2012, pp 1320-1325
[3] M.R. Sayed, M.A.M. Hassan, and A.A. Hassan, “Power System Quality Improvement Using Flexible A.C Transmission Systems Based on Adaptive Neuro-Fuzzy Interface System”, WSEAS Transactions on Power Systems, Vol. 8, Issue 2, April 2013, pp 656-73
[4] B. Singh, “Introduction to FACTS Controllers in Wind Power Farm – A Technological Review”, Int. Journal of Renewable Energy Research, Vol. 2, No. 2, 2012, pp 166-212
[5] T.R. Ayodele, A.A. Jimoh, J.L. Munda, and J.T. Agee, “Challenges of Grid Integration of Wind Power on Power Systems Grid Integrity: A Review”, Int. Journal of Renewable Energy Research, Vol. 2, No. 4, 2012, pp 618 – 626
[6] K. Ravichandrudu, P.S.P. Kumar, and V.E. Sowjanya, “Mitigation of Harmonics and Power Quality Improvement for Grid Connected Wind Energy System Using UPFC”, Int. Journal of Application or Innovation in Engineering and Management”, Vol. 2, Issue 10, October 2013, pp. 141 – 156.
[7] D. Srinivas, and M.R.S. Reddy, “Power Quality Improvement in Grid Connected Wind Energy Systems Using FACTS Devices and PID Controller”, IOSR Journal of Engineering, Vol. 2, Issue 11, November 2011, pp 19-26
[8] J.N. Barothu, and A. Arif, “Method for Enhancement of Power Quality at Point of Common Coupling of Wind Energy System”, American Journal of Engineering, Vol. 1, Issue 1, March 2013, pp. 11 -21
[9] S.W. Mohod, and M.V. Aware, “Power Quality Issues and its Improvement in Wind Energy Generation Interface to Grid System”, MIT Int. Journal of Electrical and Instrumentation Engineering, Vol. 1, No. 2, August 2011, pp 116-122
[10] S. Shakil, K.K. Srivastava, and A.V. Pandey, “Power Quality Enhancement and Sag Mitigation by Dynamic Voltage Restorer”, Int. Journal of Scientific and Engineering Research, Vol. 4, Issue-6, June 2013, pp. 999 – 1009
[11] Y.I Nakhoda, and A. Lomi, “Implementation of Dynamic Voltage Restorer and Distribution Static Compensator for Power Quality Improvement”, Journal of Selected Areas in Renewable and Sustainable Energy, May 2012, pp 1 – 7
[12] T. Ackermann, “Wind Power in Power Systems”, John Wiley and Sons Limited, Stockholm, 2005
[13] A.K Chourasia, A. Mishra, and D. Sharma, “A Simulation of a STATCOM Control for Grid Connected Wind Energy System for Power Quality Improvement”, Int. Journal of Engineering Research and Applications, Vol. 3, Issue 4, August 2013, pp. 1207 – 1214
[14] S.A Mohammed, M.A. Abdel-Moamen, and B. Hasanin, “Analysis, Modeling and Simulation of Dynamic Voltage Restorer for Compensation of Voltage Quality Disturbances”, Int. Journal of Control, Automation and System, Vol. 1, No. 2, 2013, pp 23 -29
[15] C. Tajavoth, M. Trishulapani, V.K.R. Mohan-Rao, and Y. Yambabu, “Power Quality Improvement for Grid Connected Wind Energy System Using STATCOM Control Scheme”, IOSR Journal of Engineering, Vol. 3, Issue 7, 2013, pp. 51 – 57
[16] S. N. Deepa, and Yuvaraj, “Improving Grid Power Quality with FACTS Devices on Integration of Wind Energy Systems”, Students Pulse Academic Journal of Anna University of Technology, Coimbatore, Vol. 3, Issue 4, April 2011, pp 1-8
[17] V.A. Reddy, P.H. Reddy, and M.S. Basu, “Power Quality Improvement in Wind Energy System by Using STATCOM on Integration to the Grid”, International Journal of Modern Engineering Research, Vol. 2, Issue 5, September – October 2012, pp 3637 – 3640.
[18] M.R.S. Reddy, and M.V. Kumar, “Power Quality Improvement in DFIG Based Wind Energy Conversion System Using UPFC”, IOSR Journal of Engineering, Vol. 3, Issue 1, January 2013, pp 46 – 54
[19] J. Earnest, T. Wizelius, “Wind Power Plants and Project Development”, PHI Learning Private Limited, New Delhi, 2011
[20] A. Vijayan, and S. Padma, “Maintaining Voltage Stability in Power System Using FACTS Devices”, Int. Journal of Engineering Science Invention, Vol. 2, Issue 2, February 2013, pp 20 – 25
Published by testguy, November 23, 2019. Website: testguy.net
A power quality meter can plot the voltage and current waveforms as functions of time, this is called an oscillogram. Data can be extracted from the power quality recorder and analyzed to determine the overall condition of the power system using various timeplots and tables.
The actual data analysis is usually performed by an electrical engineer, who will generate a report that provides a summary of the various power conditions, a list of events that occurred during the analysis, and any corrective action or recommendations that should be considered.

Figure 1. Data can be extracted from the power quality recorder and analyzed to determine the overall condition of the power system using specialized computer software.
Power Quality Meters are capable of calculating a large number of power measurements at extremely high speeds. These measurements may include minimum, average, and maximum values for parameters such as:
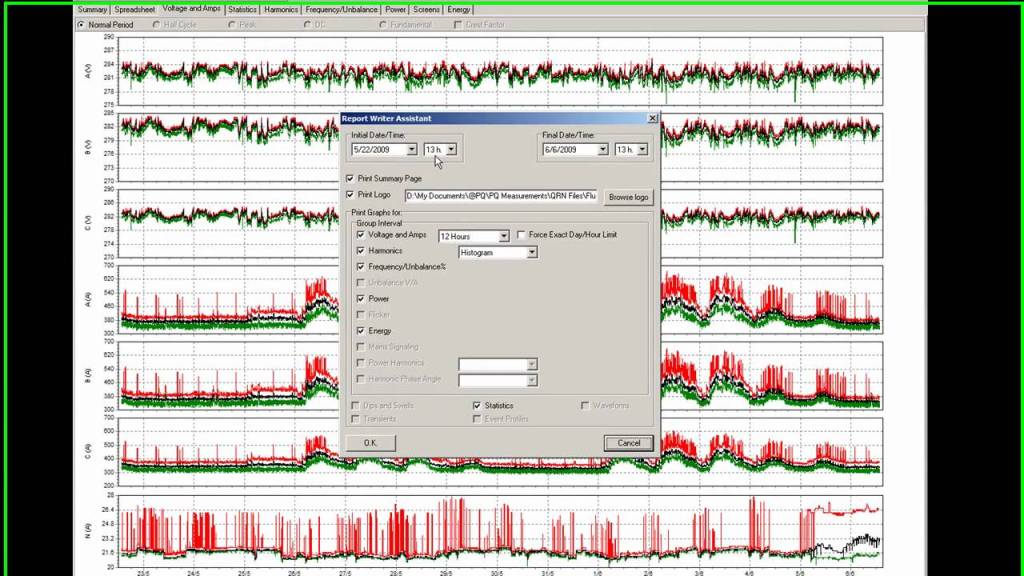
Figure 2. Power Quality Meters are capable of calculating a large number of power measurements at extremely high speeds.
Published by testguy, November 23, 2019. Website: testguy.net
Several types of instruments are available for power quality measurement, each serving their own unique purpose. Power quality analyzers are the most commonly used tools to observe real-time readings and also collect data at high speeds for downloading to computers for analysis, opposed to a power recorder or “data logger” which is mainly used for simple voltage and current measurements.
Often times power interruptions are unpredictable and of short duration, which can only be captured using a power quality meter (PQM) installed over a period of days, weeks or months. Each phase in the system has a voltage probe and current sensor applied to monitor the magnitude and polarity of each channel over the specified period.
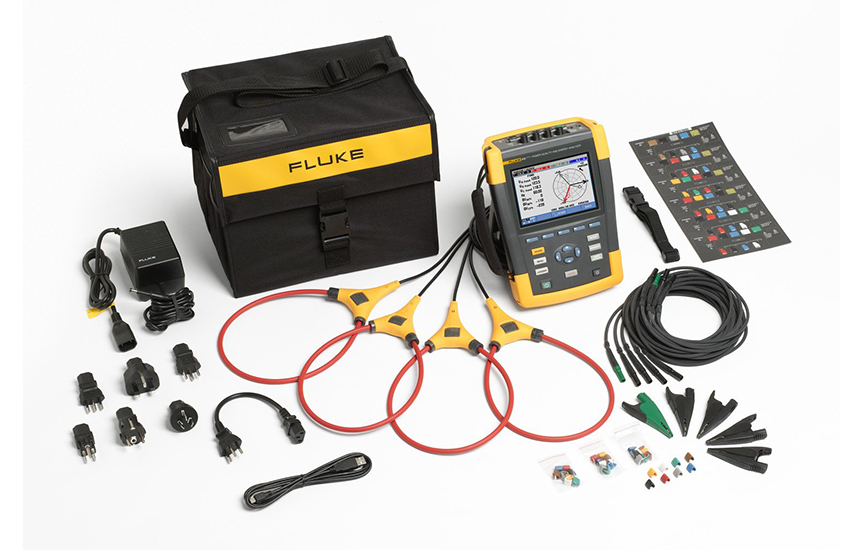
Image#1: Several types of instruments are available for power quality measurement, each serving their own unique purpose.
The place where the PQM is connected is called the measurement plane, everything to the right of the plane is considered part of the load and everything to its left is considered the source. The measurement plane can be any point within the power system, not necessarily at the incoming service.
A cycle is the time that the waveform takes to travel from the zero line up to its positive peak, back down to its negative peak, and then back to zero. Power quality meters can be extremely high speed devices designed to capture events down to the sub-cycle level.
In an ideal 60Hz system, one cycle takes 16.7 milliseconds, or 0.0167 seconds. This is called the period of the wave, and is represented by the letter T. Frequency is equal to the inverse of the period, f = 1/0.0167 = 60Hz.
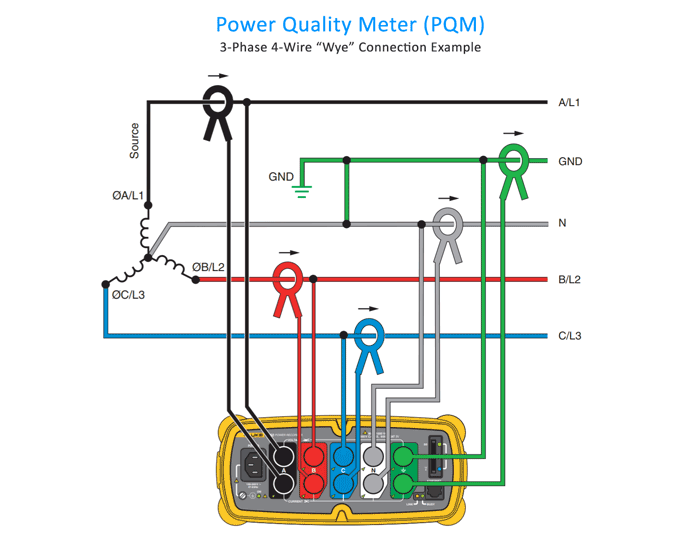
Image#2: Power Quality Analyzer Connection Example.
The type of meter to install will depend on the data to be captured. For example, a simple ampere load evaluation or utility bill audit would require a far less sophisticated meter than trying to pinpoint the cause of a nuisance trip or other power interruption.
The most important factor to consider when performing power quality analysis is safety. Often times meters are applied live with equipment in service which can be an extremely dangerous task.
This type of work should only be performed by qualified personnel while observing all appropriate safety precautions. A local power outage at the monitoring location is always the safest way to install and remove a power quality meter.
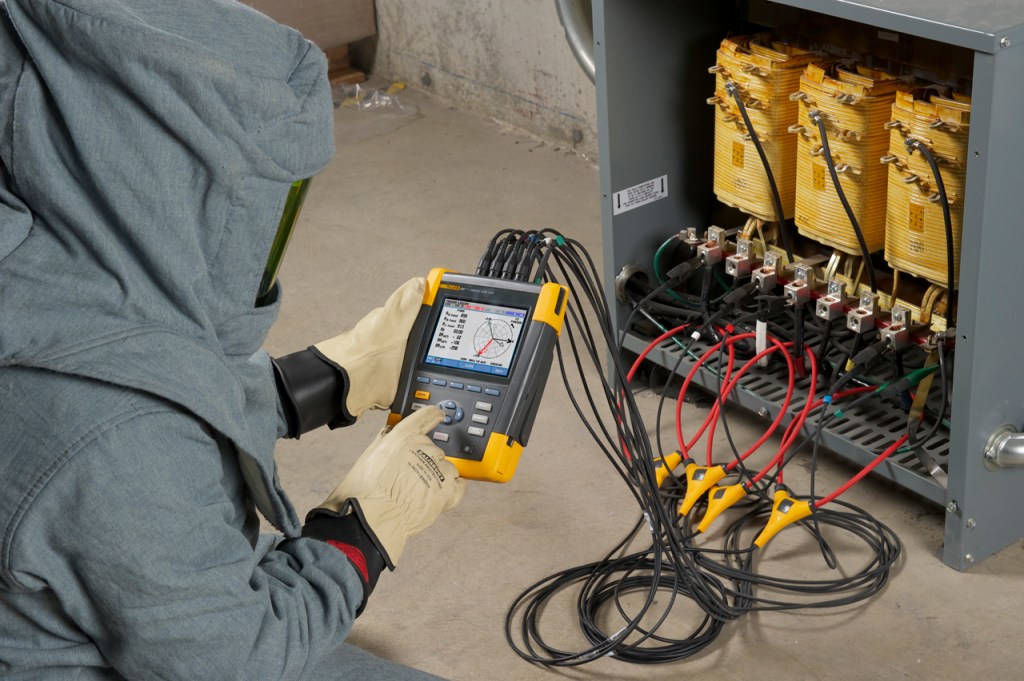
Image#3: The most important factor to consider when performing power quality analysis is safety.
Published by testguy, November 23, 2019. Website: testguy.net
Electrical loads are often composed of more than just pure resistance, the combination of resistance and reactance in an AC system is called the impedance. Reactance comes in two forms: inductive and capacitive, both of which do not contribute to “useful” work on the power system.
Power Factor is a way to characterize how much electrical power goes toward producing useful work such as light, heating, or machinery. Low power factor means a large amount of energy is being lost in the system in the form of wasted heat, which generally equates to higher energy bills and equipment degradation.
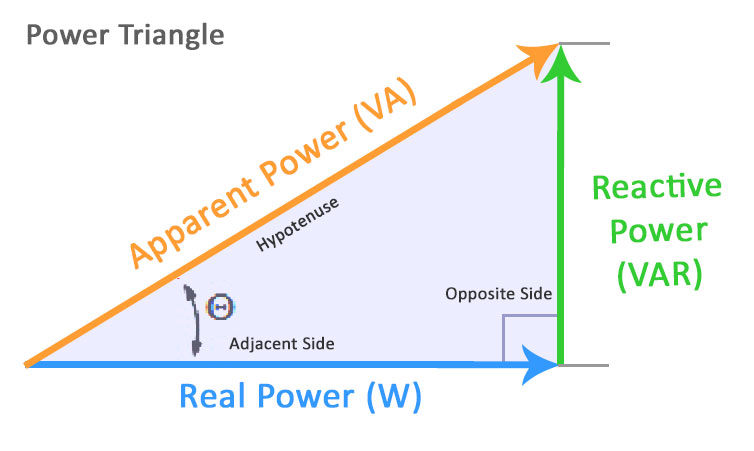
Fig1. Three types of power – true, reactive, and apparent – relate to one another in trigonometric form.
Motors, solenoids and pumps typically have impedances that are combinations of resistance and inductive reactance, which vary with the mechanical load on the machine. Capacitors have impedances that are combinations of a typically small resistance and larger capacitive reactance component.
When reactance is present in an AC system, the voltage and current sine waves will shift out of phase from each other. Voltage leads current with inductive reactance and Current leads voltage with capacitive reactance, the two cancel each other out.

Fig2. When reactance is present in an AC system, the voltage and current sine waves will shift out of phase from each other.
Low power factor tends to occur in industrial facilities that contain a large number of motors or other inductive loads. Utility companies typically charge large industrial and commercial customers a higher rate for low power factor.
Unbalance occurs in three-phase power systems when single phase loads (lighting, office equipment, etc.) do not draw the same amount of current on each phase, resulting in greater stress on the neutral conductor. An ideal condition occurs when the loads are balanced, meaning that the voltage and current phases are exactly 120 degrees apart from each other, although the currents might not be in-phase with the voltages.

Fig3. Unbalance occurs in three-phase power systems when single phase loads do not draw the same amount of current on each phase.
A balanced three-phase 4-wire wye system will have zero current on the neutral wire. The amount of current on the neutral wire in an unbalanced system will increase as the unbalance increases, this could result in overheating and risk of fire.
Motors being driven by unbalanced voltages will result in a small motor torque working in the opposite direction from the motor rotation, a phenomena known as counter-torque. When this condition occurs, part of the energy delivered to the motor will work against itself.
Harmonics are a form of waveform distortion that occurs in circuits containing semiconductor based electronics such as LED lighting, switching power supplies, electronic ballasts, computers, robotics, test equipment, etc. These “non-linear” loads impose higher frequency sine waves on the system, which result in more power lost in the form of wasted heat.
The excess heat produced by harmonics can have detrimental effects on a power system. Transformers are especially susceptible to damage caused by harmonics due to stray “eddy currents” which circulate in the iron core and produce excess heat.
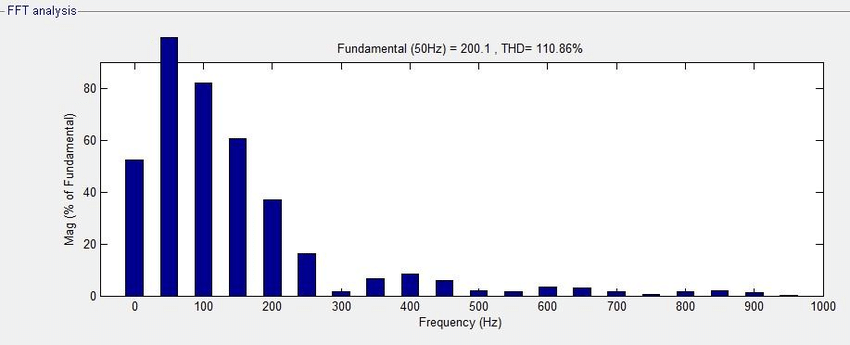
Fig4. Harmonics are identified by their frequency in multiples of the “fundamental” or main frequency.
Harmonics are identified by their frequency in multiples of the “fundamental” or main frequency (60Hz in the United States). For example, the third harmonic in a 60 Hz system would be 180 Hz (60×3 = 180) and the 5th harmonic would be 300 Hz (60 x 5 = 300).
The magnitude of each harmonic frequency can be measured using power quality meters and are generally displayed in the form of a harmonic spectrum. Total harmonic distortion (THD) and total demand distortion (TDD) are sometimes used with power quality meters to simplify harmonic distortion as a single measurement rather than an entire spectrum.
Published by testguy, November 23, 2019. Website: testguy.net
Repetitive voltage reductions in lighting circuits can be detected by the human eye, a phenomena known as “flicker.” The term flicker refers to a very specific problem related to human perception of light produced by incandescent light bulbs, not necessarily general voltage fluctuations.
Some common sources of flicker include: Arc welders, Electric boilers, Industrial motors, Lasers, Photocopying machines, Saw mills, and X-ray machines.
Fig1. Flicker, transients, and noise examples
Transients occur when spikes are superimposed on a voltage or current sine wave, ranging in amplitude from just a few volts to several thousand volts. Lighting and utility switching typically cause high energy impulsive transients of short duration, while electronic devices, VFDs and switching inductive loads typically cause low energy transients continuously.
Noise refers to unwanted, high frequency oscillations that are superimposed on an alternating voltage or current sine wave. This phenomena is usually intensified by improper grounding and is capable of disrupting electronic devices such as computers and programmable controllers.
Published by testguy, November 23, 2019. Website: testguy.net
The second most simple type occurs when voltage at the load drops below a minimum rated voltage or climbs above a maximum rated voltage for some period of time. Depending on how long these conditions last, they may be referred to as undervoltage or overvoltage and sags or swells.
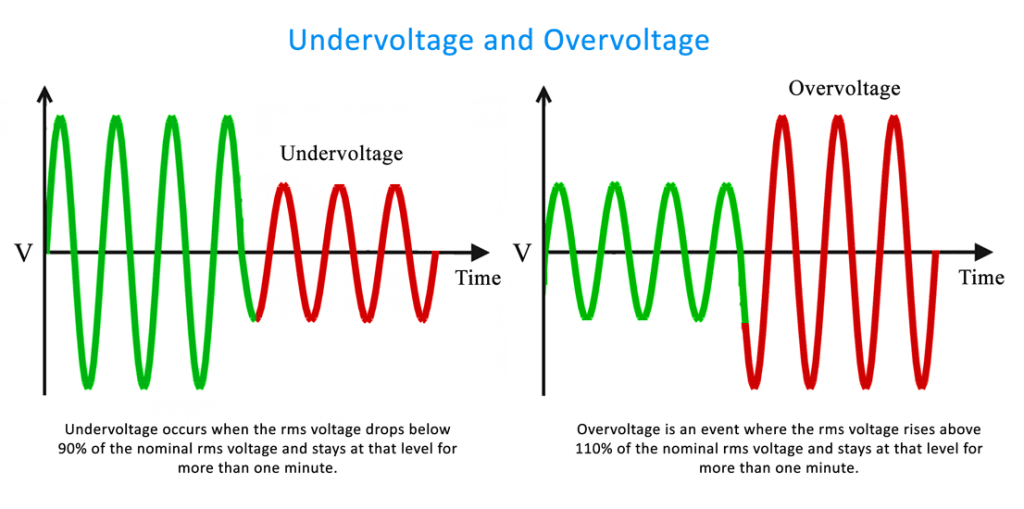
Fig1. Undervoltage and overvoltage occur when voltage at the load drops below a minimum rated voltage or climbs above a maximum rated voltage for longer than a minute.

Fig2. Sags and Swells occur on the power system when voltage drops below or exceeds nominal voltage for a short duration.
Reductions in voltage and sags usually occur when the rms current to the load increases significantly. There are 3 categories of sags and swells, depending on their duration:
Published by testguy, November 23, 2019. Website: testguy.net,
The most simple type of power quality problem occurs when power delivered to an electrical load goes away, this is called a “power interruption.” The different types of power interruptions are classified according to their duration.
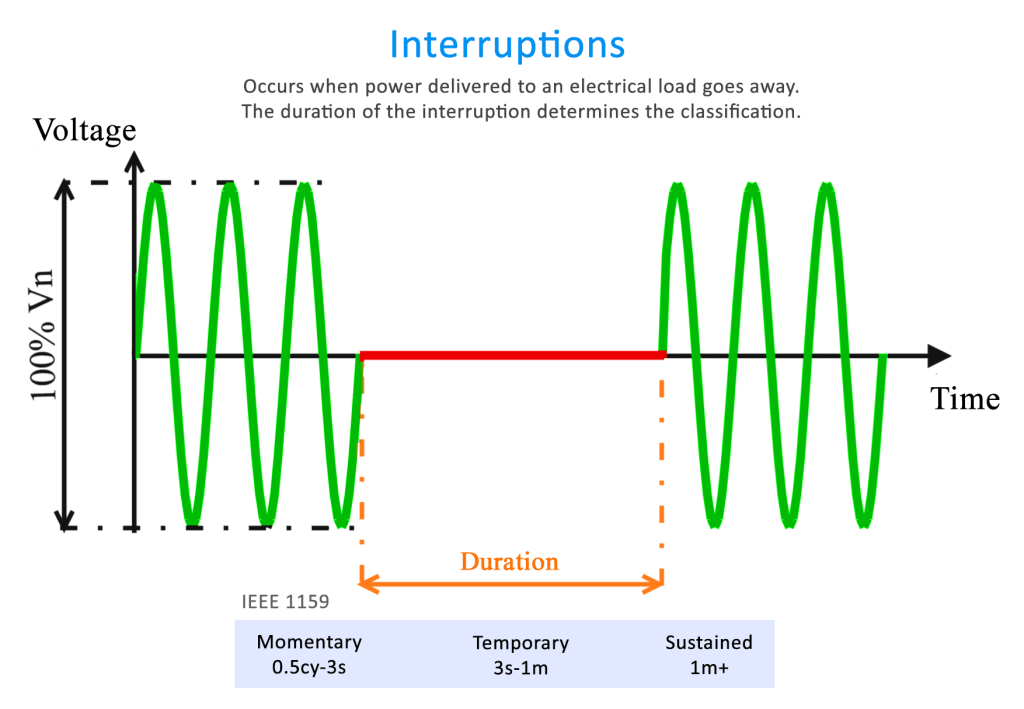
Fig1. A power interruption occurs when power delivered to an electrical load goes away.
Power interruptions are caused by many different sources, such as lighting strikes utility switching operations, physical damage to power lines, and human error. A momentary power interruption could have serious or even dangerous results depending on the load connected, such as microprocessor-based or hospital equipment.
