Published by PowerCET® Corporation, Course: PQ103, 2007. Introduction to Power Quality: Problems, Analysis & Solutions – The Electric Utility System.


Published by PowerCET® Corporation, Course: PQ103, 2007. Introduction to Power Quality: Problems, Analysis & Solutions – The Electric Utility System.
Published by PowerCET® Corporation, Course: PQ103, 2007.


Published by Carelabs (Carelabz)

Electrical safety testing is essential to ensure safe operating standards for any product that uses electricity. Various governments and agencies have developed stringent requirements for electrical products that are sold world-wide. Several tests are conducted to check the safety of products. One among that is earth test.
Potentially the most dangerous appliances are Class I appliances (earthed appliances), example: microwave ovens/bench grinders and the like, but also in this category are extension leads. Class I appliances are designed to have a connection to the ground via an earth conductor. This may, or may not, be a suitable low resistance path for electric current to protect personnel and equipment. If this conductor is damaged anywhere then the consequences can be virulent.
The measurement of ground resistance for an earth electrode system should be done when the electrode is first installed, and then at periodic intervals thereafter. This ensures that the resistance-to-ground does not increase over time. The International Electrical Testing Association specifies ground electrode testing every three years for a system in good condition with average up-time requirements.
Poor grounding not only increases the risk of equipment failure; it is dangerous too. Facilities need to have adequately grounded electrical systems so in the event of a lightning strike, or utility overvoltage, current will find a safe path to earth. Although the ground system when initially installed had low earth ground resistance values, the resistance of the grounding system can increase if the ground rods are eaten away by corrosive soils with high moisture content, high salt content, and high temperatures.
If our technician finds an increase in resistance of more than 20 percent, we will investigate the source of the problem and make the correction to the grounding system to lower the resistance.
These factors emphasize the importance of a continuous, periodic program of earth-resistance testing. It is not enough to check the earth resistance only at the time of installation.
Resistance to earth can vary with changes in climate and temperature. Such changes can be considerable. An earth electrode that was good (low-resistance) when installed may not stay that way; to be sure, you must check it periodically. We cannot tell you what your maximum earth resistance should be. For specific systems in definite locations, specifications are often set. Some call for 5 Ω maximum; others accept no more than 3 Ω. In certain cases, resistances as low as a small fraction of an ohm are required.
Nature of an Earth Electrode Resistance to current through an earth electrode actually has three components:
Electrode Resistance: Rods, pipes, masses of metal, structures, and other devices are commonly used for earth connections. These are usually of sufficient size or cross-section that their resistance is a negligible part of the total resistance.
Electrode-Earth Contact Resistance: This is much less than you might think. If the electrode is free from paint or grease, and the earth is packed firmly, contact resistance is negligible. Rust on an iron electrode has little or no effect but if an iron pipe has rusted through, the part below the break is not effective as a part of the earth electrode.
Resistance of Surrounding Earth: An electrode driven into earth of uniform resistivity radiates current in all directions. Think of the electrode as being surrounded by shells of earth, all of equal thickness. The earth shell nearest the electrode naturally has the smallest surface area and so offers the greatest resistance.
The resistance to earth of any system of electrodes theoretically can be calculated from formulas based upon the general resistance formula:
R = ρ LA
Where ρ is the resistivity of the earth in ohm-cm, L is the length of the conducting path, and A is the cross-sectional area of the path. All such formulas can be simplified a little by basing them on the assumption that the earth’s resistivity is uniform throughout the entire soil volume under consideration.
Soil Resistivity Testing:
Wenner four-pole equal method [19] has been considered in measuring the soil resistivity. The correct design of an earthing system is dependent upon detailed knowledge of the local ground resistivity. This is measured as a function of depth at a series of locations around the site, using an expanding four electrode Wenner array (BS EN 50522). The procedure is known as soil resistivity or earth resistance testing. Correct measurement is particularly important in areas of high resistivity ground, where electrical currents are not able to dissipate. In these conditions obtaining an earth can be problematic, and information on ground resistivity is required to much greater depths for the successful installation of an earthing system.
Fall-of-Potential Method:
With a four-terminal tester, P1 and C1 terminals on the instrument are connected to the earth electrode under test. With a three-terminal instrument, connect X to the earth electrode. Although four terminals are necessary for resistivity measurements, the use of either three of four terminals is largely optional for testing the resistance of an installed electrode. The use of three terminals is more convenient because it requires one lead to be connected. The trade-off is that the resistance of this common lead is included in the measurement. Normally, this effect can be minimized by keeping the lead short, to accommodate simple test requirements. The small additional resistance thus introduced is negligible. When performing more complex tests or meeting stringent requirements, however, it may be better to use all four terminals by a lead from the P1 terminal to the test electrode (connecting it inside the lead from C1). This is a true four wire test configuration which eliminates all lead resistance from the measurement.
The added accuracy may prove significant when meeting very low resistance specifications or using test methods that necessitate an extra digit of measurement in order to meet the mathematical requirements. The decision is optional, based on the operator’s testing goals and the method used. The driven reference rod C should be placed as far from the earth electrode as practical; this distance may be limited by the length of extension wire available, or the geography of the surroundings. Leads should be separated and “snaked,” not run close and parallel to each other, to eliminate mutual inductance. Potential-reference rod P is then driven in at a number of points roughly on a straight line between the earth electrode and C. Resistance readings are logged for each of the points.
Dead Earth Method:
When using a four-terminal instrument, P1 and C1 terminals connect to the earth electrode under test; P2 and C2 terminals connect to an all-metallic water-pipe system. With a three-terminal instrument, connect X to the earth electrode, P and C to the pipe system. If the water system is extensive (covering a large area), its resistance should only be a fraction of an ohm. You can then take the instrument reading as being the resistance of the electrode under test. The dead earth method is the simplest way to make an earth resistance test. With this method, resistance of two electrodes in series is measured — the driven rod and the water system. But there are three important limitations:
Under these circumstances, if conditions 1 and 2 above are met, you can connect to the water-pipe system and obtain a suitable earth electrode. As a precaution against any possible future changes in the resistance of the water-pipe system, however, you should also install an earth electrode.
Clamp-on Method:
Fall-of-potential testing, and its modifications, is the only ground testing method that conforms to IEEE 81. It is extremely reliable, highly accurate and can be used to test any size ground system. Additionally, the operator has complete control of the test set-up and can check or proof his/her results by testing at different probe spacing. Unfortunately, the Fall of Potential method also comes with drawbacks:
The clamp-on ground testing method, although it does not conform to IEEE 81, does provide the operator with the ability to make effective measurements under the right conditions. The clamp-on methodology is based on Ohm’s Law (R=V/I). A known voltage is applied to a complete circuit and the resulting current flow is measured. The resistance of the circuit can then be calculated. The clamp-on ground tester applies the signal and measures the current without a direct electrical connection. The clamp includes a transmit coil that applies the voltage and a receive coil that measures the current.
Selective Measurement Testing:
Selective testing is very similar to the Fall-of-Potential testing, providing all the same measurements, but in a much safer and easier way. This is because with Selective testing, the earth electrode of interest does not need to be disconnected from its connection to the site! The technician does not have to endanger himself by disconnecting ground, nor endanger other personnel or electrical equipment inside a no grounded structure.
When you find that your earth electrode resistance is not low enough, there are several ways you can improve it:
Effect of Rod Size:
As you might suspect, driving a longer rod deeper into the earth, materially decreases its resistance. In general, doubling the rod length reduces resistance by about 40 percent.
Use of Multiple Rods:
Two well-spaced rods driven into the earth provide parallel paths. They are, in effect, two resistances in parallel. The rule for two resistances in parallel does not apply exactly; that is, the resultant resistance is not one-half the individual rod resistances (assuming they are of the same size and depth).
Treatment of the Soil:
Chemical treatment of soil is a good way to improve earth electrode resistance when you cannot drive deeper ground rods because of hard underlying rock, for example. It is beyond the scope of this manual to recommend the best treatment chemicals for all situations. You have to consider the possible corrosive effect on the electrode as well as EPA and local environmental regulations. Magnesium sulfate, copper sulfate, and ordinary rock salt are suitable non-corrosive materials. Magnesium sulfate is the least corrosive, but rock salt is cheaper and does the job if applied in a trench dug around the electrode. It should be noted that soluble sulfates attack concrete, and should be kept away from building foundations. Another popular approach is to backfill around the electrode with a specialized conductive concrete. A number of these products, like bentonite, are available on the market.
Not much information has been collected on the effects of temperature. Two facts lead to the logical conclusion that an increase in temperature will decrease resistivity:
Grounding testers are indispensable troubleshooting tools to help you maintain uptime. It is recommended that all grounds and ground connections be checked at least annually as a part of your normal predictive maintenance plan. Should an increase in resistance of more than 20% be measured during these periodic checks, the technician should investigate the source of the problem and make the correction to lower the resistance by replacing or adding ground rods to the ground system.
Source: https://carelabz.com/learn-what-is-earth-ground-test-why-and-how-is-it-done/
Published by Carelabs (Carelabz)

Leakage current is the current that streams from either DC or AC circuit in an equipment to the ground or framework and can be from the output or input. If the equipment is not properly grounded, the current flows through other paths such as the human body. This mighty also occur if the ground is incompetent or is disrupted unintentionally or intentionally.
The leakage current in an equipment flows when an unintentional electrical connection occurs between the ground and an energized part or conductor. The ground may be the reference point of zero voltage, or the earth ground. Ideally, the current leaking from the power supply unit should flow through the ground connection and into the installations earth ground.
The inadequacies in the materials that build up the elements like the capacitors and semiconductors are the main cause of leakage current. These results in to small current leaking or flowing through the through the dielectric, in the case of a capacitor.
This measurement is done during the electrical safety test of a device. The currents flowing through the protective conductor or metallic parts of the earth are measured.
Electrical system usually consists of a grounding technique that offers shield against a shock hazard if an insulation fault occurs. The grounding system comprises of a grounding rod that connects the instrument to the earth. If ever a disastrous failure of insulation between power line and conductive parts occur, the voltage will be pushed to ground. The current that is created because of this event will flow, causing a circuit breaker to open or a fuse to blow thus avoiding a shock hazard.
Clearly, a shock hazard prevails if the earth or ground connection is intruded, either accidentally or intentionally. The possibility for a shock might be larger than assumed if there is case of leakage currents. Even in the scenario of no insulation failure, intrusion of leakage currents streaming through the grounding rod still pose a threat of electric shock to somebody meeting the ungrounded system and ground at the same time.
This is a huge concern when it comes to the field of medical applications, where a patient might be the receiver of the electric shock. A shock can be even fatal if the patient is weak or unconscious, or if the current flows to internal organs. The two-layered insulation offered in non-grounded equipment ensures protection. The security in this scenario is made sure because both coats of insulation are not likely to collapse together. Nevertheless, the situations that leads to leakage currents still exists and must be considered.
Hence, how can you eradicate or reduce the outcomes of leakage current? Measure the leakage current and then recognize the cause. Purpose of the Test is to measure the amount of current that passes through a person when that person touches an electrical product.
| Type of Equipment | Maximum Leakage Current |
|---|---|
| Class I | 0.75mA for hand held devices, 3.5mA for other devices |
| Class II | 0.25mA |
| Class III | No hazardous voltages |
Direct Measurement
Direct measurement has precision and a meter especially designed for determining leakage currents is used. The current flowing in the ground conductor is measured by connecting the meter in series with the grounding connection of the device concerned.
Leakage current clamp meter is the most popular device used to measure leakage current. They are like the clamp meters utilized for finding load currents but gives considerably better results when quantifying currents less than 5mA. Generally, clamp meters wouldn’t register such small currents. After we position the jaws of a clamp meter around a conducting rod or wire, the current reading is taken, and the value depends upon the intensity of the alternating electromagnetic field around the conductor. The clamp meter will identify the magnetic field around conductors like a wire armor cable, single core cable, a water pipe etc. The paired neutral and phase conductors of a single-phase circuit, or all live conductors of a three-phase circuit.
Testing different kinds of conductors:
Measurement of Leakage Current to Ground
Measuring leakage current through the ground conductor
Measuring leakage current to ground via unintentional paths to ground.
Tracing the source of leakage current
The objective of the Leakage Current test is to verify that the electrical insulation used to protect the user from a Risk of Shock is suitable for the application. Leakage Current testing is used to verify that the product does not leak excessive current when contacted by the user. For medical equipment, the current flowing to ground is measured.
Hipot Leakage Current Testers
Advantages of leakage current measurement are:
Leakage current can be a sign of the inefficiency of insulation on conductors. It is achievable to trace the cause of leakage current with the help of a low current leakage current clamp to interpret orderly measurements as needed. If required, this allows you to re-allocate loads all around the installation in a better unbiased manner.
Published by Randy Barnett, Certified Energy Auditor and Trainer for NTT, Centennial, Colo. Email: randy@randybarnett.net , March 1st, 2012.
Analyzing electrical parameters associated with distributing electricity is viewed by many as complex engineering work. Yet, for engineers, electricians, and technicians troubleshooting equipment problems these days — and for contractors maintaining electrical systems they may have once installed — measuring power quality is becoming as much of a necessity as using the clamp ammeter to find out why the overloaded circuits keep tripping.
When any electrical system fails to meet its purpose, it is time to investigate the problem, find the cause, and initiate corrective action. The purpose of the electrical distribution system is to support proper operation of the loads. When a load does not operate properly, the quality of the electric power in the system should be suspected as one possible cause. Whether it’s used for troubleshooting purposes or to obtain baseline data, measuring/analyzing electrical system parameters is called power quality analysis.
The setup and use of power quality equipment — and obtaining and interpreting usable data — can be intimidating for those not familiar with the process. The key to success is knowing where and how to measure as well as how to interpret the results.
Organization and planning is key to success. Dedicating an equipment cart to hold analyzers, test equipment, drawings, manuals, notebook, digital camera, and safety equipment can help.
Several measurement tools are available for power quality measurement. Power quality analyzers are the most commonly used tools to observe real-time readings and also collect data for downloading to computers for analysis. While some are permanently installed in the distribution system, handheld analyzers are necessary for many applications, especially troubleshooting.
Handheld power quality analyzers are fairly lightweight (generally 4 lb to 5 lb) and will measure a variety of parameters. The most typical include voltage, amperage, frequency, dips (sags) and swells in voltage values, power factor, harmonic currents, and the resulting distortion and crest factor, power and energy, voltage and current unbalance, inrush current values, and light flicker. If an analyzer measures and records such basic parameters, you can address most power quality issues successfully.
Portable data loggers typically monitor many of the same parameters as the power quality analyzer; however, they are meant for long-term recording (days to several weeks). In addition, the data logger does not typically provide the real-time values on-screen that an analyzer can provide. Additional test equipment, such as scopemeters and recording digital multimeters, also find specific use applications.
Conducting a power quality survey begins with planning. Simply determine the purpose of the survey, and write it down in a notebook or binder that will be used throughout the process to organize and maintain data. Start with a good one-line diagram of the facility electrical distribution system. If one does not exist, then this is an excellent time to get one up to date.
If conducting a general power quality survey to obtain baseline data for future comparisons — or to help identify any immediate hidden electrical distribution problems that may exist — start monitoring as close as practical at the point of service. Beware, however, measuring near the service typically means large amounts of fault current available. Therefore, be careful when connecting the analyzer at a point in the distribution system downstream of the main breaker that limits incident energy levels to acceptable values. Because power quality problems can either come from the electric utility — or be generated within the facility — be sure to contact the utility in order to identify any possible issues on this side of the meter.
Inside the facility, continue to “drill down” into the distribution system following the one-line diagram. Obtain data at the source of each separately derived system. For example, take recordings at the first panelboard or switchboard after a 480V to 208Y/120V transformer. Be sure to mark up drawings, and take plenty of notes for future reference.
Digital cameras work well for quickly capturing nameplate data and later identifying exact connection locations. Note plant conditions and any equipment that was running. Print out digital pictures, and maintain all data for the survey in the notebook binder. These notes will become valuable when analyzing data and conducting further studies.
Follow manufacturer’s instructions for connecting and setting up the analyzer. Because of the amount of test equipment and supporting documentation that is needed, it is often best to have an equipment cart dedicated for power quality work. In addition to technical expertise, the underlying key to a successful survey is planning and organization. Three common mistakes when connecting power quality analyzers are:
Whether observing values real-time on the analyzer color screen or analyzing downloaded data on the laptop back in the shop, an understanding of power quality parameters and their characteristics must be understood. IEEE Power Quality Standards and NFPA 70B are excellent resources to help understand power quality terminology, issues, and corrective actions. To help with data analysis, each manufacturer provides software for its specific test equipment. Here is what to look for when analyzing data:
If experiencing overheating of neutrals, overheating of transformers or motors, nuisance tripping of circuit breakers, blown fuses, unusual audible noise in larger distribution equipment, or if distorted voltage sine waves are found, then suspect harmonics. The magnitude of the various harmonic frequencies and the amount of total harmonic distortion created by the harmonics are the critical factors to determine the severity and correction techniques for any harmonic problem. Measure harmonics at their source, (e.g., VFD, UPS), and expect them to lessen further upstream from the equipment. Sine wave distortion is a good indicator that you should analyze harmonics values (Figures 1, 2, and 3).
Fig. 1. While performing a power quality survey in a commercial office, distortion of the current sine wave on phase “C” at a panelboard indicated nonlinear loads and potential harmonic problems.
Transients are extremely short-duration voltage surges, sometimes incorrectly called “spikes.” The voltage levels achieved during a transient can cause equipment problems ranging from malfunction to destruction. If you’re experiencing unusual insulation failures, record data for extended periods at the equipment. The most severe transients are often caused by nearby lightning strikes. However, they can also be the result of switching of loads.
Voltage sags and swells are the most common type of power quality culprits. While definitions provide specific numbers for magnitude and duration of changes up or down in voltage values, the bottom line is changes of 10% or more in either direction from normal voltage can cause problems. These conditions only need to last from ½ cycle to 1 min. Too high a voltage (swell) can occur when large loads are dropped off the line. Sags, the decrease in voltage, are typically more bothersome and can cause contactors and relays to chatter or drop out completely. Equipment such as PLCs and variable-speed drives can malfunction, and computers may lock up. Observe voltage recordings for sags and swells, and try to relate these variations to changes in plant conditions or operations, (e.g., a chiller or other large load cycling off or on).
Fig. 2. Switching the analyzer to the harmonic function found indications of primarily 3rd and 5th harmonics (180 Hz) on phase “C.” These harmonics can distort the voltage sine wave causing mis-operation of equipment and increasing heat on the neutral conductor — and in motor and transformer windings.
Voltage unbalance between phases on a 3-phase motor can cause current values to reach six to 10 times the value of the voltage unbalance. Because current causes heat — and overheating is one of the leading causes of motor failure — distribution systems should be monitored for unbalance. Unbalance is often the result of single-phase loads cycling off and on, so monitor for unbalance at panelboards and switchboards throughout a typical plant cycle.

Fig. 3. The concern is that the harmonic currents may severely distort the voltage sine wave causing distribution system problems. A normal crest factor (CF) should read 1.41 (Vpeak ÷ Vrms). Here, phase “C” voltage crest factor is 1.47, slightly higher than normal. The crest factor for amperage on phase “C” is 2.09.
The key to success in power quality measurement and analysis can be attributed to success in three key areas. Set goals and plan the survey by reviewing one-line diagrams to determine points to monitor. Learn the functions and features of the test equipment and how to use it to capture the needed values. Finally, know what to look for while observing data whether in the field or after it is downloaded to the computer. Learning how to successfully measure electrical parameters associated with proper operation of equipment is obviously a key step in solving power quality issues.
Published by Sonel
The economic benefits of energy suppliers and their users are strongly dependent on reliability, safety and efficiency of the power system. One of the phenomena that is strongly related to the efficiency of the power system is an asymmetry.
Current and voltage asymmetry degrades the efficiency of the power system. It reduces the efficiency of generation, transmission and distribution of electricity. Ultimately, this results in an increase in the price of electricity. The electricity consumer will also incur additional costs due to a decrease in the efficiency of electrical equipment with the appearance of voltage asymmetry.
Figure 1. Asymmetry in power network causes higher costs.
There are three types of asymmetry states in the power grid. It is the current asymmetry, voltage asymmetry and the simultaneous occurrence of both current and voltage asymmetry.
With regard to three-phase systems, voltage asymmetry is defined as a state in which the effective values of the three phase voltages are not the same and/or the angles between them differ significantly from 120 ° as can be seen in figure 2b. Any three-phase system of voltage or current vectors can be decomposed into a sum consisting of three components: zero sequence, negative sequence and positive sequence component. Coefficients that are scaled to the positive sequence can be calculated and are used to describe the quantitatively phenomenon of voltage and current asymmetry.
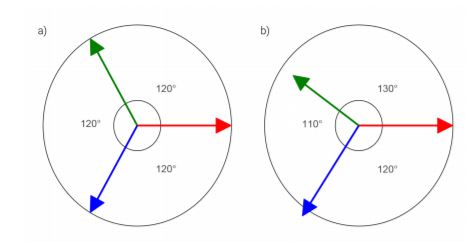
Figure 2. Phasor graph in a) reflects perfect symmetry in 3 phase power system. All vectors corresponding to 3 phases have the same magnitude and there is 120° between two adjacent vectors. Phasor graph in b) reflects asymmetry in power system. The vectors have different length and the angular shifts are different than 120° between adjacent phases.
Voltage asymmetry and current asymmetry are two different types of asymmetry in the power system. The source and nature of these asymmetries are different. Voltage unbalance results from the structural asymmetry of generators (variations in internal construction), transformers, and transmission and distribution lines. In addition, asymmetry can be caused by a voltage drop on the system impedance by asymmetrical currents. In turn, the main source of current unbalance is load imbalance, caused by a single phase load in the distribution system or a fault on the load side.
Voltage asymmetry can also cause asymmetry in the supply current. This is particularly evident in the current of induction motors supplied with asymmetric voltage. For example, a 1% asymmetry in the supply voltage can cause several times greater current unbalance in induction motors.
Asymmetry of the current, i.e. the occurrence of the asymmetrical component, causes the dissipation of energy in the elements of the power system in the form of heat. As a result, current asymmetry reduces performance when generating, transmitting and distributing electricity. Therefore, the distribution system cables and wires must be selected taking into account the level of asymmetry.
The negative voltage asymmetry component will contribute to the creation of a magnetic field with the opposite direction in induction motors. It’s like accelerating and braking at the same time. For example, the occurrence of voltage asymmetries of up to several percent is able to significantly increase the temperature of the motor winding and reduce the winding life by more than half. Therefore, the load on motors should be reduced accordingly to compensate heating losses resulting from asymmetry.

Figure 3. High asymmetry caused overheating windings of the engine and fire.
Asymmetry also has a negative effect on three-phase rectifiers and inverters. Voltage unbalance causes asymmetry of the supply current, which increases the temperature of the rectifier diodes and disrupts the operation of the safety devices. Other negative effects occur during transient states mainly caused by faults in the power system.
Transient current asymmetry occurs, for example, due to phase-to-phase faults. In this case, extreme levels of current asymmetry will occur, which will last only for a few seconds. However, this may lead to instability and system failure if the causes are not eliminated on time.
The asymmetry is related to the presence of positive sequence and zero sequence components and parameters u0 and u2 (equations shown in the table) are commonly used in measurements in power engineering:
u0=U0/U1 × 100%
u2=U2/U1 × 100%
where:
u0 – zero sequence asymmetry parameter,
u2 – asymmetry of the opposite parameter,
U0 – zero sequence component,
U1 – positive sequence component,
U2 – negative sequence component.
Commonly used devices for measuring power network parameters, including asymmetry, are power quality analyzers. Series of devices named PQM is the series of power quality analyzers by Sonel. All analyzers in the PQM series have the ability to measure asymmetry parameters.

Figure 4. Electrician is configuring connected PQM for measurement of asymmetry.
New and revised Standards for Power Quality measurements from IEC and IEEE and their benefit to users of PQ monitoring equipment that is compliant with these new standards general information refer to the actual standard for additional details.
The IEC 61000-4-30 Class A standard defines the measurement methods, time aggregation, accuracy and evaluation, for each power quality parameter to obtain reliable, repeatable and comparable results between various brands and models of PQ instruments and systems.
IEC 6100-4-30 Class A Edition 2 standardizes the measurements of:
• Power frequency
• Supply voltage magnitude
• Flicker (by reference to IEC 61000-4-15)
• Voltage dips/sags and swells
• Voltage interruptions
• Supply voltage unbalance
• Voltage harmonics, and interharmonics (referenced to IEC 61000-4-7)
• Mains signaling voltage
• Rapid voltage changes
• Magnitude of current
• Current harmonics and interharmonics (referenced to IEC 61000-4-7)
• Current unbalance
“This third edition cancels and replaces the second edition published in 2008. This edition constitutes a technical revision”.
• Rapid voltage changes
• Flicker class F1
• Magnitude of the current
• Current unbalance
• Current harmonics (by reference to IEC 61000-4-7)
• Current interharmonics (by reference to IEC 61000-4-7)
1. Rapid Voltage Change (RVC) parameter captures voltage changes (sags) that can be disruptive to some loads without exceeding the standard of +/- 5% voltage change limit. An instrument that does not make RVC measurements will miss these events. So a utility may receive customer complaints (most common is light flickers) and not have any data to find the source of the complaint. (most common is large motor starts or other sudden load or distributed generation switching). (tripping)
2. The Edition 3 revision transfers the responsibility for measurement methods continue in this standard, but responsibility for influence quantities, performance, and test procedures are transferred to IEC 62586 -1 and -2.
Part 1, namely IEC 62586-1, was constructed to define a comprehensive PQ device product standard, coined within as PQIs. The standard outlines safety, electromagnetic compatibility (EMC), climatic, and mechanical requirements, and refers to IEC 62586-2 for functional aspects. These requirements serve to ensure the instrument’s robustness will be suitable for its installation within the severe environments of a power station or substation.
Part 2, IEC 62586-24, defines the functional tests cited in the first part of the series. These tests are intended to comprehensively verify the PQ measurement methods outlined in 4-30. This chapter was established to provide traceable and repeatable procedures to verify the compliance of each PQ metric outlined in 4-30. This firstly addresses the main shortcoming of 4-30 and ensures better method adherence between PQ meter manufacturers. Additionally, the standard allows regulatory laboratories adhering to ISO/IEC 170255 to issue conformance reports and certificates according to IEC 62586-1 or IEC 62586-2 (with compliance to IEC 62586-2 meaning compliance to IEC 61000-4-30). The latter provides PQ meter manufacturers a way to provide internationally recognized compliance for the entire scope of PQI requirements.
3. To help ensure accurate PQ metrics in the harsh installation environment of a power station or substation, a number of electromagnetic compatibility (EMC) and influence quantity tests were also added to the scope of the IEC 62586 series.
“IEC 62586-2:2013 specifies functional tests and uncertainty requirements for instruments whose functions include measuring, recording, and possibly monitoring power quality parameters in power supply systems, and whose measuring methods (class A or class S) are defined in IEC 61000-4-30. This standard applies to power quality instruments complying with IEC 62586-1. This standard may also be referred to by other product standards (e.g. digital fault recorders, revenue meters, MV or HV protection relays) specifying devices embedding class A or class S power quality functions according to IEC 61000-4-30. These requirements are applicable in single, dual- (split phase) and 3-phase a.c. power supply systems at 50 Hz or 60 Hz.”
4. Environmental impact on the instrument from a laboratory environment. (25 Degrees C to a substation environment 40 Degrees C + ) is now part of the requirement of this standard.
5. Detailed measurement procedures for Harmonics including to the 100th are included.
6. Reporting of the harmonics to IEEE 519-2014 with harmonic limits specified for 1 and 1 week are included.
All of these issues can be defined as IEC 61000-4-30 Class A, Edition 3 compliant.
Published by MYRON ZUCKER INC. , Website: www.myronzucker.com
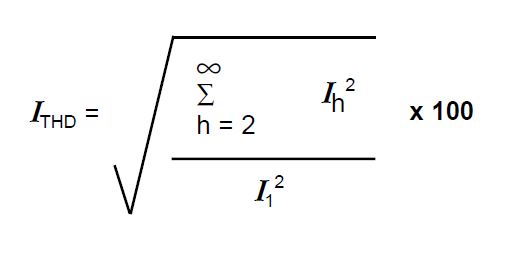
Harmonics are multiples of the fundamental frequency of an electrical power system. If, for example, the fundamental frequency is 60 Hz, then the 5th harmonic is five times that frequency, or 300 Hz. Likewise, the 7th harmonic is seven times the fundamental, or 420 Hz, and so on for the higher-order harmonics. Harmonics can be discussed in terms of current or voltage. A 5th harmonic current is simply a current flowing at 300 Hz on a 60 Hz system. A 5th harmonic voltage occurs from the 5th harmonic current flowing through the impedances present. Sometimes the amount of harmonics is discussed as Total Harmonic Distortion (THD). The formula for calculating the THD for current is as follows:
If, for example…
I1 = current at 60 Hz = 250 Amps
I5 = current at 300 Hz = 50 Amps
I7 = current at 420 Hz = 35 Amps
then…

If these harmonic currents flow in a power system, then they cause what is known as poor “power quality” or “dirty power.” There are other causes of poor power quality, including transients such as voltage spikes, surges, sags and ringing. As shown in Figure 1, harmonics are considered a steady-state cause of poor power quality because they repeat every cycle. Figure 2 shows the resultant wave form from a 5th harmonic present in a 60 Hz system.

Figure 1 — Fundamental and 5th Harmonic
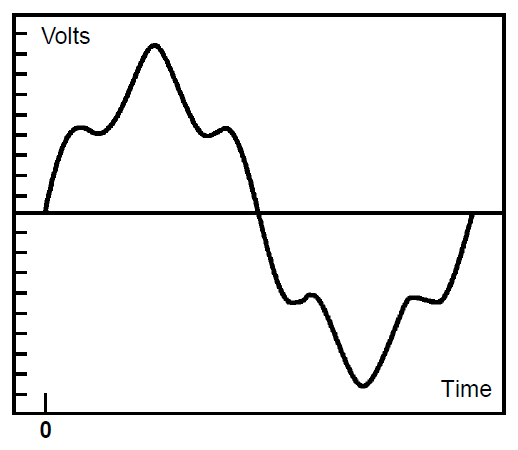
Figure 2 — Fundamental and 5th Harmonic Combined
Harmonics are caused by devices that draw non-sinusoidal currents when a sinusoidal voltage is applied. Many times these are devices which convert AC to DC. Some of the devices which cause harmonics are listed below:
◆ Adjustable Speed Drives (ASDs)
— DC Drives
— Variable Frequency Drives (VFDs)
◆ 6-pulse Converters
◆ Power Rectifiers (e.g., plating systems)
◆ Uninterruptible Power Supplies (UPSs)
The devices listed above use power electronics such as SCRs, diodes and thyristors. These devices have become a growing percentage of the load in industrial power systems. The majority use a 6-pulse converter similar to that in Figure 3.
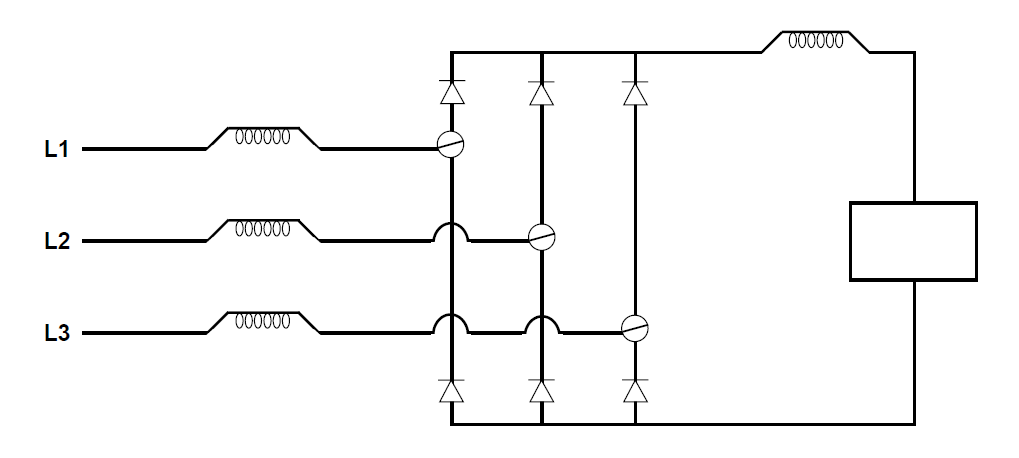
Figure 3 — A Typical 6-pulse Converter
Loads which cause harmonics do so as a steady-state phenomenon. Therefore, if a load is suspected to be non-linear, then even an instantaneous reading of the load (while it is operating) can determine if it is harmonic producing.
Each type of load would typically exhibit a specific harmonic spectrum. For example, the most common industrial harmonic source is the 6-pulse converter. It exhibits a spectrum starting with the 5th harmonic and decreasing in amplitude throughout its spectrum. This spectrum is defined in the following formula and corresponding graph (Figure 4):
h = np ± 1
where
h = harmonic numbers of the spectrum
n = 1, 2, 3, . . .
p = 6 for a 6-pulse converter
Therefore h = 5, 7, 11, 13, 17, 19, 23, 25, . . .
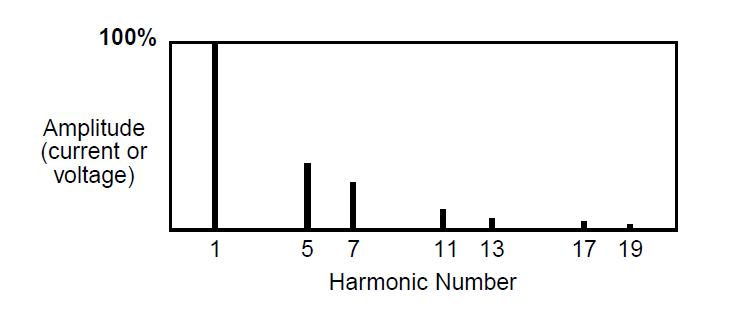
Figure 4 — 6-pulse Converter Spectrum Graph
Another common spectrum is that of a switch-mode power supply used for personal computers. This is found in commercial applications and has a spectrum starting with the 3rd harmonic and continuing with the triplens as the most dominant.
h = 3, 9, 15, 21, 27, . . .
Large UPS (Uninterruptible Power Supply) systems exhibit yet another typical spectrum. They tend to use a 12-pulse converter and have the following spectrum:
h = np ± 1
where
h = harmonic numbers of the spectrum
n = 1, 2, 3, . . .
p = 12 for a 12-pulse converter
Therefore h = 11, 13, 23, 25, 35, 37, . . .
There are many problems that can arise from harmonic currents flowing in a power system. Some are easy to detect. Other problems may exist and persist because harmonics are not suspected as the cause. Harmonic currents cause higher RMS current and voltage in the system. This can result in any of the problems listed below:
One of the larger problems is overheating transformers. In fact, a 10°C rise in operating temperature of transformers, motors or capacitors can cut equipment life by 50%. The harmonic currents are higher frequencies and tend to travel along the outside (skin effect) of the conductors, which results in insulation breakdown.
One of the two most common problems for industrial power users is striving to meet IEEE Std. 519-1992. IEEE 519 is a standard developed for utility companies and their customers in order to limit harmonic content and provide all users with better power quality. In the future, some utility companies may impose a penalty for users producing harmonics. Some key areas of the standard are as follows in Tables 1 and 2:
TABLE 1: Voltage Distortion Limits
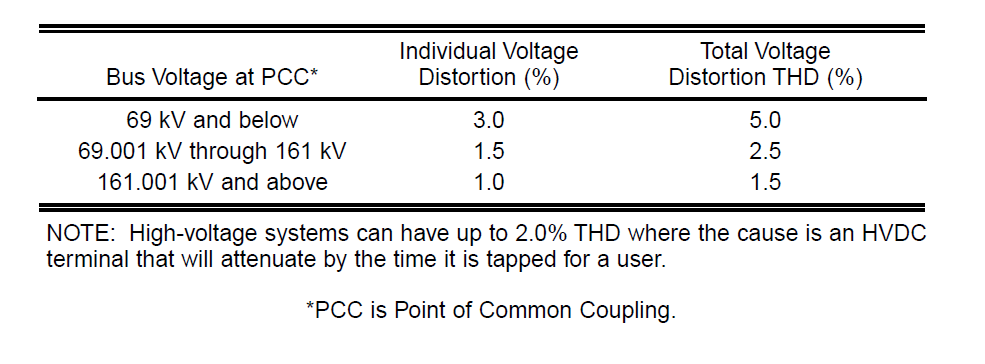
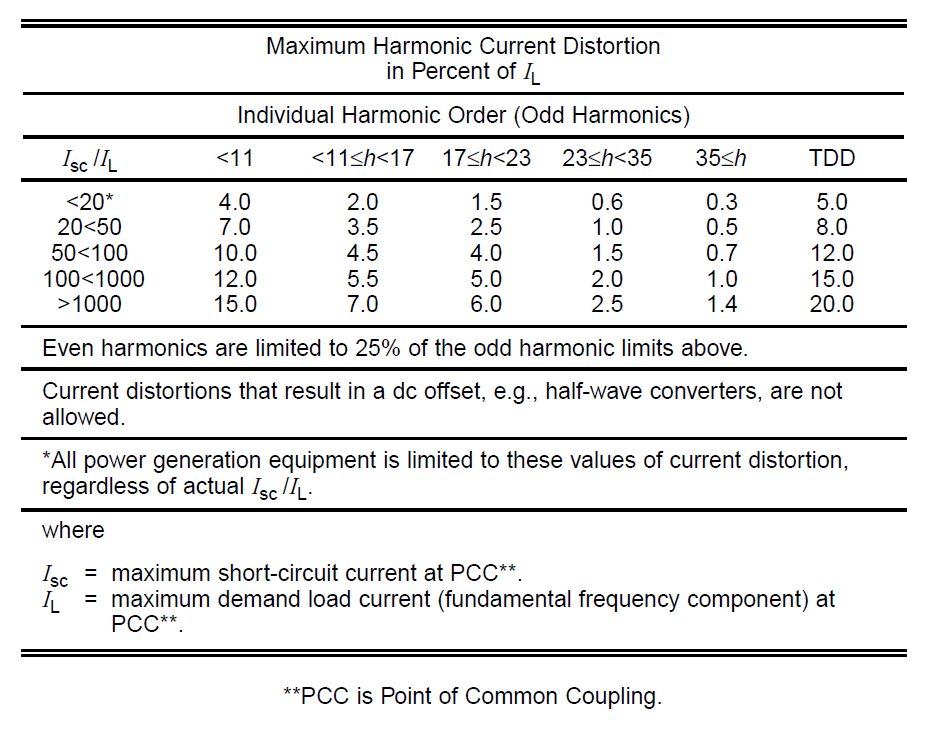
TABLE 2: Current Distortion Limits for General Distribution Systems
(120 V through 69 000 V)
The other most common problem resulting from harmonics is power factor capacitor failures, or a need to correct power factor in a harmonic environment. In low-voltage systems (600 V or less), capacitors are typically the lowest impedance at harmonic frequencies. Therefore, they experience very high RMS currents and increased heat, which causes them to fail. So, even if meeting IEEE 519 is not the goal, dealing with harmonics may still be required.
When correcting power factor, there is the possibility of creating a resonant circuit. A resonant circuit occurs at the frequency when the impedance of the system (mostly the power transformer) and the impedance of the power factor capacitor are equal. This is called the resonant frequency.
The following formula can be used to find the resonant frequency in terms of harmonic number.
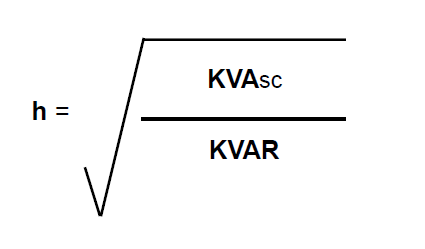
h = resonant frequency in terms of harmonic number
KVAsc = short-circuit capacity at the capacitor
KVAR = rated KVAR of the unswitched capacitance
If there are any sources of current at that frequency, they will be amplified. This will cause high distortion levels and could blow fuses or trip circuit breakers.
When electric power users need to correct power factor, or they desire to meet IEEE 519, they must first locate the source of harmonics.
If the electrical power system is in the design phase, then the best approach is to gather as much information about any harmonics the non-linear loads will produce. A detailed one-line diagram including system voltages, transformer impedances, ASD Hp ratings, power rectifier KVA ratings, UPS KVA ratings and capacitor KVAR ratings is a good start to locating harmonics and the problems that may result. Myron Zucker, Inc. has produced a “Power Factor Correction & Harmonic Filter Questionnaire” which guides the user through a series of questions to obtain the data listed above and requests a one-line diagram.
The same approach should be used for an existing system. With an existing system, a harmonic study can be conducted to verify the system characteristics expected from the questionnaire or it can be done to determine the actual system characteristics. Myron Zucker, Inc. can provide assistance with both methods of locating harmonics.
Harmonics can be “trapped” by the application of a Myron Zucker, Inc. tuned filter trap. The trap is an inductor capacitor (LC) filter which provides a low-impedance path for the harmonic currents. It “traps” the harmonics between itself and the harmonic source. As in correcting power factor problems at the source with capacitors, Myron Zucker, Inc. also recommends correcting harmonics problems at the source by using traps. For that reason, Myron Zucker, Inc. manufactures Caltrap™ brand harmonic filters from 10 to 100 KVAR, commonly tuned to the 5th harmonic, although other points are available. Myron Zucker, Inc. can also provide Caltrap™ brand harmonic filters with an integral line reactor to further isolate harmonics and provide other line reactor benefits such as reduced voltage notching from ASDs. Typical installations are shown in Figures 5 and 6 below.
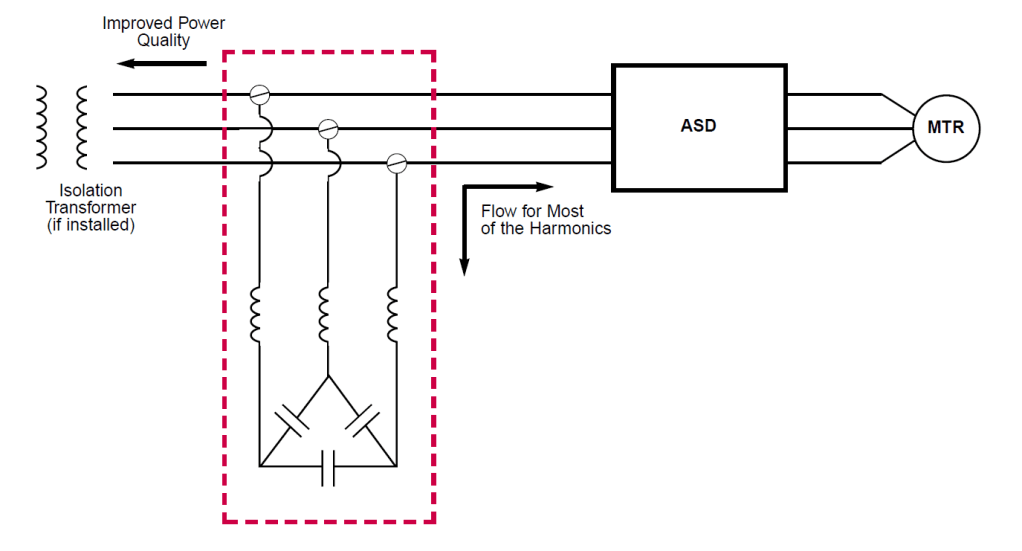
Figure 5 — Caltrap™ Brand Harmonic Filter

Figure 6 — Caltrap™ With Line Reactor Brand Harmonic Filter
Although the best engineering practice is to trap the harmonics at the source, for economic reasons it may be better to use one trap for several harmonic sources. For example, a machine with several ASDs could be corrected with one trap at the machine control panel. In the same way, several small ASDs fed from one bus duct could have a trap at the beginning of the bus duct, giving the rest of the system better power quality.
In some cases, an even larger trap can be provided at the switchgear, feeding an entire low-voltage system. This would still trap the harmonics before the service transformer and could be used to reduce utility voltage harmonics.
Myron Zucker, Inc. manufactures Capacitrap® brand harmonic filters and automatically controlled Autocapacitrap® brand harmonic filters for these applications.Your local representative or Myron Zucker, Inc.’s Application Engineering Department can help determine what products are best for any application.
Myron Zucker, Inc. has successfully installed Caltrap™, Capacitrap® and Autocapacitrap® brand harmonic filters throughout the US and other countries. Our quality products and 50 years of experience in the power industry can be beneficial in any application
Published by Michael Z. Lowenstein, President of Harmonics Ltd., Monroe, Conn. Nov 1st, 2002.
Understanding the causes, similarities, and differences between current and voltage distortion will help you pinpoint most power quality problems.
When a writer or speaker mentions harmonic distortion in an article or presentation, they rarely distinguish between current and voltage distortion. This confuses the reader or listener and results in them passing on misinformation. So what’s the solution? Only when you truly understand the sources and properties of current and voltage distortion can you acknowledge their differences and realize how each affects a particular portion of the distribution system and the loads powered by that system.
An electrical system supplies power to loads by delivering current at the fundamental frequency. Only fundamental frequency current can provide real power. Current delivered at harmonic frequencies doesn’t deliver any real power to the load. When current of a single frequency is present in a system, you can use the measured values in Ohm’s Law and power calculations (see Sidebar below). However, when currents of more than one frequency are present, direct addition of the current values leads to a summed value that doesn’t correctly represent the total effect of the multiple currents. Instead, you need to add the currents in a manner known as the “root mean square” summation. The equation for the rms addition of currents is as follows:
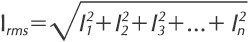
So if a system carries 70A of fundamental current, 18A of 5th harmonic current, 14A of 7th harmonic current, and 11A of 11th harmonic current, the effective current would be 74.3A rms, not the arithmetic sum of 113A. This 74.3A rms value would be the correct value to use in all power calculations.
The same is true for harmonic voltages. To obtain the effective voltage for a system in which voltages of several frequencies are present, you must add the voltages in an rms fashion.
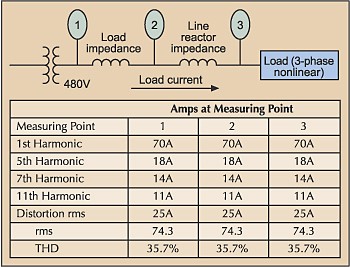
Fig. 1 Current measurement with harmonics
Current measurement with harmonics. Fig. 1 illustrates the measurement of current drawn by a nonlinear load. The rms current contains both the fundamental and harmonics. Note that the value of current at each harmonic as well as that for the rms current are the same at each measuring point, just as in a system containing only fundamental current. The term “distortion rms” is used to denote the rms value of harmonic current with the fundamental left out of the summation. The rms current is basically the total effective load current. Calculate total harmonic distortion (THD) by using the value of distortion rms current in the following equation:

The current THD is the same at each measuring point.
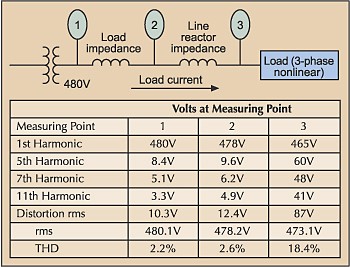
Fig. 2 Voltage measurement with harmonics
Voltage measurement with harmonics. Fig. 2 at right illustrates the measurement of voltage in a system powering a nonlinear load. The voltage contains both the fundamental and harmonics. The farther you measure from the source, the higher the harmonic voltage generated. The increased impedance, through which the harmonic current must flow, results in higher harmonic voltage generation. This is the opposite effect of impedance on the fundamental voltage, whereas fundamental voltage causes fundamental current flow, and harmonic current flow causes harmonic voltage.
Looking at Fig. 2 again, we see that although the fundamental voltage has dropped from 480V at Point 1 to 465V at Point 3, the increase in harmonic voltage causes the rms voltage to be higher at each measuring point than the fundamental voltage alone. Distortion rms is the rms value of the harmonic voltage with the fundamental left out of the summation, and it increases the farther away you measure from the source. Calculate THD using the same equation used for current distortion.
Effects of current distortion. Since operation of nonlinear loads causes the distorted current, which is path dependent, the effect of current distortion on loads within a facility is minimal. Therefore, harmonic currents can’t flow into equipment other than the nonlinear loads that caused them. However, the effect of current distortion on distribution systems can be serious, primarily because of the increased current flowing in the system.
All distribution systems are rms current-limited. In a system powering 3-phase loads, for example, a 1,000kVA, 480V transformer is rated to deliver 1,200A rms. But the more harmonic current this transformer has to supply, the less fundamental current it can provide for powering loads. In other words, because the harmonic current doesn’t deliver any power, its presence simply uses up system capacity and reduces the number of loads that can be powered.
Harmonic currents also increase I2Z heat losses in transformers and wiring. Since transformer impedance is frequency dependent, increasing with harmonic number, the impedance at the 5th harmonic is five times that of the fundamental frequency. So each ampere of 5th harmonic current causes five times as much heating as an ampere of fundamental current.
In a system powering phase-to-neutral connected loads, detrimental effects are again due to the harmonic currents using up system capacity and reducing the number of useful loads that can be powered. Third harmonic currents cause a further detriment, because they’re additive in the neutral conductor. When many computers, which are nonlinear loads, are connected, the neutral current — primarily 3rd harmonic — can be larger than any of the phase currents. These 3rd harmonic currents circulate in the primary (delta) of the distribution transformer that serves the portion of the system powering the computers and are dissipated as heat.
Effects of voltage distortion. Besides overheating, the other major effect of current distortion on an electrical system is the creation of voltage distortion. This distortion will have minimal effect on a distribution system, but unlike current distortion, it isn’t path dependent. So harmonic voltages generated in one part of a facility will appear on common buses within that facility. As we see in Fig. 2, high-voltage distortion at the terminals of a nonlinear load doesn’t mean high distortion will be present throughout the system. In fact, the voltage distortion becomes lower the closer a bus is located to the service transformer. However, if excessive voltage distortion does exist at the transformer, it can pass through the unit and appear in facilities distant from the origin.
The effect on loads within the facility could be detrimental in certain cases. For example, extreme voltage distortion can cause multiple zero crossings for the voltage wave. For equipment where proper sequencing of operations depends on a zero crossing for timing, voltage distortion can cause misoperation. Most modern electrical equipment uses an internal clock for timing sequencing so it’s unaffected by multiple zero crossings.
Voltage distortion appears to have little effect on operation of nonlinear loads connected either phase-to-phase or phase-to-neutral.
On the other hand, 5th harmonic voltage distortion can cause serious problems for 3-phase motors. The 5th harmonic is a negative sequence harmonic, and when supplied to an induction motor it produces a negative torque. In other words, it attempts to drive the motor in a reverse direction and slows down its rotation. So the motor draws more 60-Hz current to offset the reverse torque and regain its normal operating speed. The result is overcurrent in the motor, which either causes protective devices to open or the motor to overheat and fail. For this reason, removing 5th harmonic current from systems powering 3-phase loads is often a high priority in industrial facilities.
IEEE 519 “Harmonic Current and Voltage Limits.” This document outlines limits on voltage and current harmonic distortion measured at the point of common coupling (PCC), which is usually defined as the place where the consumer connects to the power supplier. Without going into a thorough analysis, here are several aspects of IEEE 519 that are particularly relevant.
IEEE 519 is designed to protect the voltage integrity of the utility grid system, and shouldn’t be applied to operations within a particular facility. For example, using the system shown in Fig. 2, the presence of 18.7% voltage distortion at the load does not violate the 5% voltage distortion limit of IEEE 519, since the terminals of the nonlinear load are far removed from the PCC.
Thinking about the possible detrimental effects of a large amount of voltage distortion on this nonlinear load, you have to remember that the load itself causes this distortion. Voltage distortion caused by normal operation isn’t detrimental to operation of the load.
In another example, imagine the nonlinear load illustrated in Fig. 1 is an adjustable speed drive (ASD) or a nonlinear load connected to a 1,000kVA, 480V transformer. Current distortion is 25A, or 35.7%, for this drive. But as a percentage of the transformer capacity, the load is negligible. So the effect of powering this drive on the transformer, or on the generation of voltage distortion at the PCC, is insignificant.
Voltage and harmonic distortion levels can vary drastically, depending on the configuration of your system. Your job is to find them, diagnose the cause, and eliminate it before it has a chance to damage your equipment.
Sidebar: Current, Voltage, and Impedance Before studying the effect of harmonics on an electrical distribution system, you must understand the relationships between current, voltage and impedance. Ohm’s Law governs these relationships. This basic electrical tenet states that voltage equals current times resistance. For alternating current (AC) circuits, resistance is replaced by impedance, but the unit of measure (the ohm) remains the same. Using Ohm’s Law, you can calculate the voltage losses due to current flow through the impedance of a system. Once you know the impedance, you can find the power dissipated by this current flow.
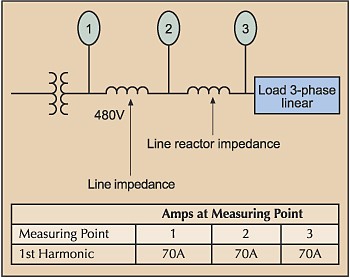
Current measurement
Fig. A (below) illustrates the principles of current measurement. Laws of physics state that the current into a point must equal the current out of a point. If the current path shown is the only current path, the current measurements at Points 1, 2, and 3 must all be the same. Since the load is linear, all current flows at 60 Hz.
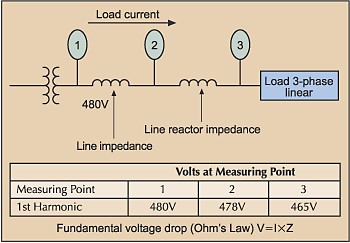
Voltage measurement
Voltage measurement is different. Fig. B (below) illustrates the principles of voltage measurement. Measuring in the direction of current flow, the voltage measured at any point is reduced from the voltage measured at a previous point by the product of the current and the impedance (I×Z.) The voltage drop across the system impedance reduces the voltage measured at Point 2. The voltage drop across the relatively high impedance of the line reactor further reduces the voltage measured at Point 3. As you can see, the farther you measure from the source, the more the voltage is lowered.
Power losses and power delivery
If the voltage measured at Point 3 is lower than that measured at Point 2, and the current is the same, then some power was lost in the line between the two points. This power is often called the I2Z loss. To ensure that you supply loads with enough voltage for them to operate properly, or to reduce I2Z losses, you must use larger conductor sizes for long electrical runs. This reduces the line impedance and, therefore, the voltage and power losses.
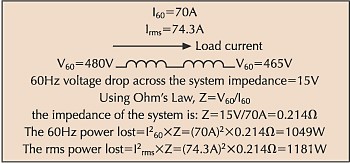
Sidebar: Sample Power Loss Calculation
Using the system shown in Fig. 2 above, it’s easy to calculate the power loss due to the voltage drop across system impedance. The data to the right illustrates this calculation. Calculate the power loss for the 60 Hz or fundamental current and then do the same for the rms current. As you can see, the presence of harmonic currents results in increased power losses. In this example, the harmonic currents increase power loss by 132W, or 12.6%. In many cases, removing harmonic currents can result in energy savings.
Measurements on electrical distribution systems powering nonlinear loads usually disclose the presence of both current and voltage harmonics.
Source: https://www.ecmweb.com/content/article/20887165/harmonic-current-and-voltage-distortion