Published by Thomas Key, EPRI, Senior Technical Executive. November 21st 2014

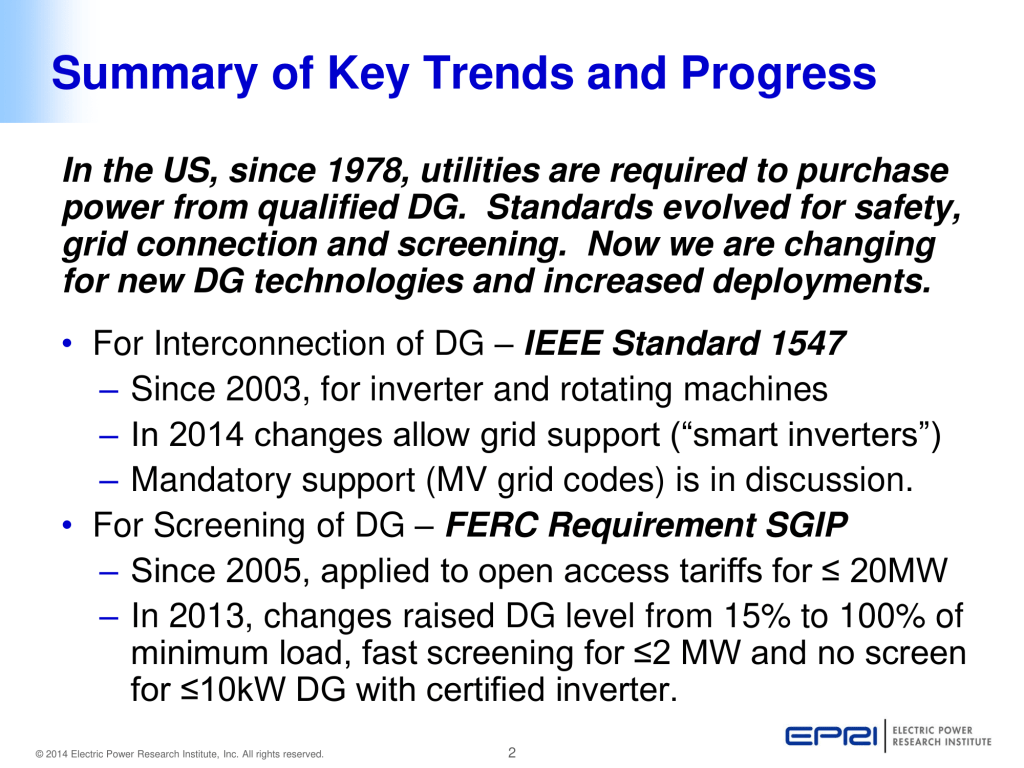

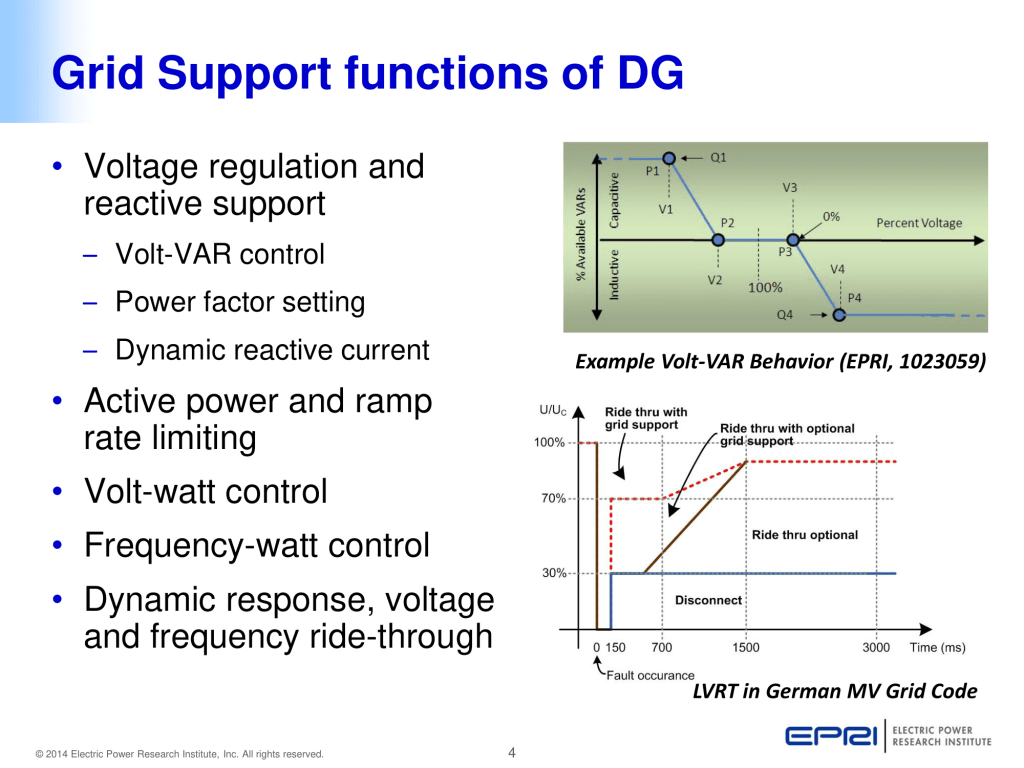


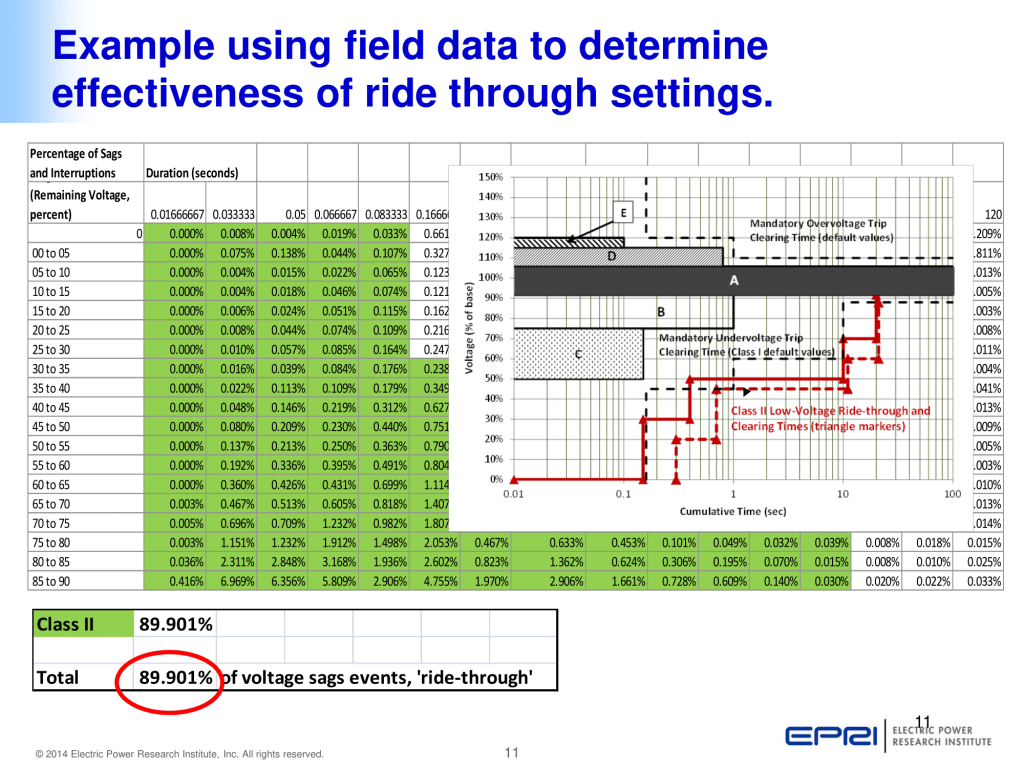


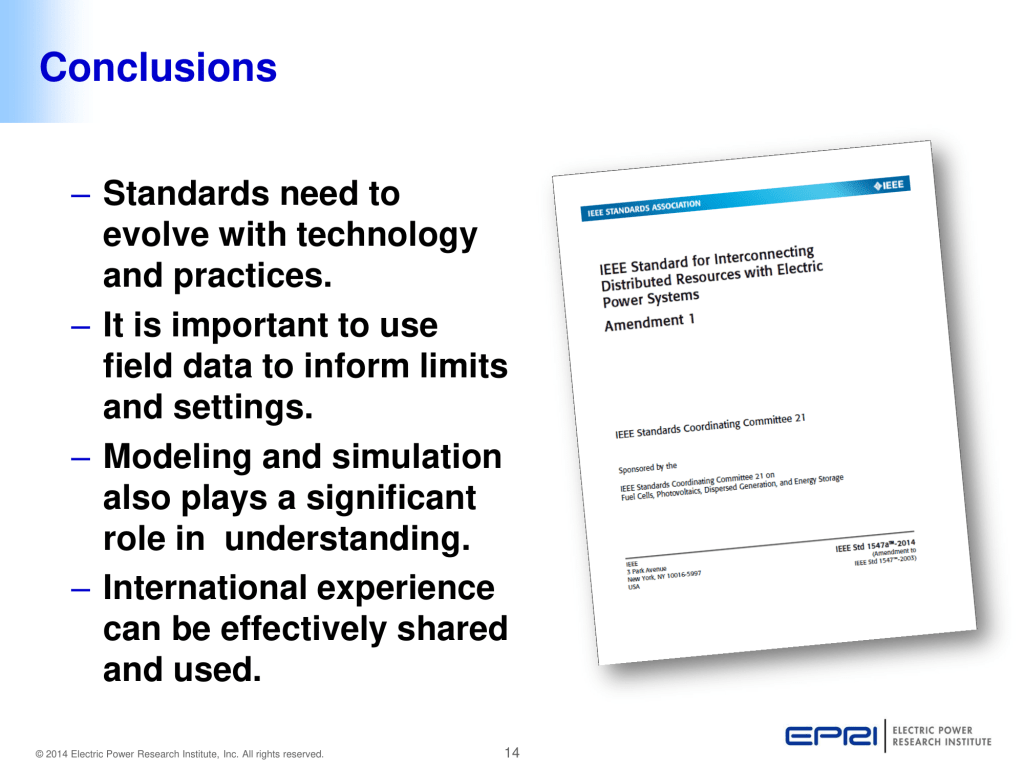

Published by Thomas Key, EPRI, Senior Technical Executive. November 21st 2014
Published by Carelabs (Carelabz)
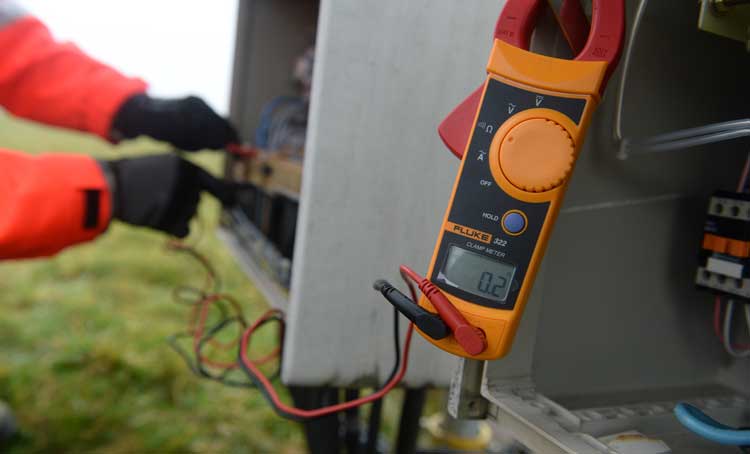
Cabling is an expensive business and must be treated carefully. The expenditure of substitution once the routes are all concealed is bigger. The fault is not always visible like crushing, bending or kinking. Make sure that your cabling installer have made provision to protect installed cabling from other worker’s actions. This is substantially less costly than changing cabling in the future. If cable routes are guarded with no way of opening them between termination and installation, it is ideal to terminate the cables for the time being, so they can be tested before the routes are protected.
Cable testing is made to drop down testing times. This is done to check the:
Many times, a fault in a cable can be seen well before it becomes an actual problem. A visual inspection of all the cables in your facility is a great way to find trouble before it causes you a downtime. We look for corrosion on the copper, cracks in the insulation, moisture on the cables and many other indicators of damage to the cables.
Cable faults cost money and create disruption, so there is an enormous demand for cable test techniques to ensure cables and joints are in good condition, and to allow cable faults to be located rapidly.
Cable testing to both predict and then deal with faults is a vital concern for all those involved with the distribution of electricity. A wide range of test techniques and test equipment are available to allow this concern to be effectively addressed, but cable testing can, nevertheless, be a challenging task.
For this reason, a resource that’s as important as the test equipment itself is access to expertise that will help with selecting the best equipment for the job, and using it in such a way that it delivers the best results
Given below are the tests and inspections that must be done before energizing low voltage cable rated 600V or below.
The following tests are type test of electrical power cable.
Given below are the tests done while cable testing is done:
Even-addressed points are allocated to the SENSE of the measurement, odd points to injection of the current. This layout is doable all the way through the switching matrix and can be joint with two wire continuity tests.
Source: https://carelabz.com/what-cable-testing-how-cable-testing-done/
Published by S. Bhattacharyya1, S. Cobben2, & W. Kling, Electrical Engineering Department, Eindhoven University of Technology, 5600 MB Eindhoven, The Netherlands.
E-mails: s.bhattacharyya@tue.nl1; sharmirb@yahoo.com2
Published in IET Generation, Transmission & Distribution. Received on 24th May 2011 – Revised on 29th February 2012, doi: 10.1049/iet-gtd.2011.0801
Modern customers use many electronics devices that are quite sensitive to the quality of power supply. Voltage dip is an important power quality (PQ) issue that can cause damage to various customers’ devices and might lead to partial or complete interruption of the operation of an installation. Hence, a customer should know the approximate number and types of voltage dips that can happen at the point of connection (POC) so that he can take preventive measure to protect his installation from voltage dip-related problems. In the recent years, the EN50160 standardisation committee has developed a classification methodology to define voltage dips. The committee also recommended that voltage dip-related responsibilities should be clearly defined in the standard to solve disagreements among the different parties in the network. In this study, first voltage dip simulation is done on a typical medium voltage (MV) network, and approximate number of events in a year at a customer’s POC is estimated. Furthermore, the guidelines are proposed to distinguish voltage dip-related responsibilities of the involved parties in the network. Finally, a case study is described in which the proposed guidelines about voltage dip-related responsibilities are applied.
At an industrial customer’s installation, many sensitive devices are connected. Those devices might have different sensitivities towards voltage dips and can be distinguished by their individual voltage–tolerance performance curve. The most widely used voltage–tolerance curves are the CBEMA (Computer Business Equipment Manufacturers Association) curve, the ITIC (Information Technology Industry Council) curve and the SEMI 47 (Semiconductor Equipment and Materials International Group) curve [1].
For large industries (such as: semiconductor industries, paper plants, steel industries etc.), voltage dips are considered as critical problem as the whole plant operation might get disrupted and the process has to be restarted. Characterisation of various types of voltage dips and assessment of their impacts on equipment sensitivity is a complex and time-consuming process. A device may respond differently depending on the dip type, magnitude, duration, point on wave of dip initiation and ending, phase shift during dip event, dip energy etc. The analysis of the CIGRE/CIRED JWG 4.110 concluded that ‘process immunity time’ (PIT) is an important indicator for designing a customer’s process efficiently and to minimise process outages because of voltage dips [2]. When a customer chooses low process immunity devices for his installation, then he will not be able to protect the process from various voltage dip events. On the contrary, when he selects the high-process immunity, it means that he has to invest more money for the connected devices to make his
installation more immune to different voltage dip events. This choice depends on customer’s installation vulnerability to voltage dips and associated financial consequences. The main contributions of the paper are related to
The IEC/TR 61000-2-8 [3] report gives statistical measurement results on voltage dips and short interruptions in different countries of the world. This report stated that the frequency and probability of occurrences of voltage dips at any voltage level are highly unpredictable (both in time and place) as it varies depending on the type of network and the point of observation. In the industries, the standards such as SEMI F42, CBEMA, ITIC, etc are used for
defining immunities of various sensitive devices against voltage dips at the installations. Different immunity classes are also specified in the IEC 61000-4-11 standard [4]. The CIGRE/CIRED JWG C4.110 proposed immunity classes for equipment against balanced and unbalanced voltage dips. In the recent years, the CENELEC members proposed a voltage dip classification table (see Table 1) for the EN50160 standard [5] that can be combined with the product class definition for immunity tests of IEC 61000-4-11
standard. The following holds for Table 1:
Table 1 Integrating voltage dip product classification with the EN50160 [5]

The classification of voltage dip events is useful and important for regulation purposes. It can be used as an evaluating tool to measure the network’s voltage dip occurrence frequency over a certain time period. Also, it hypothetically gives a responsibility sharing border between the network operator and the customer/equipment manufacturer. However, standardising on voltage dip limit number is a complex issue as it largely depends on topology of the network, and hence requires a lot of analysis to establish it for voltage quality management purposes.
In the Netherlands continuous power quality (PQ) measurement is done only in the extra-high and highvoltage networks. Table 2 shows the maximum and average number of dips recorded at a measuring site in the HV network during 2006–2009 [6–9].
The number shown in each cell for each year represents the maximum amount of dips registered at one of the measuring sites. The numbers shown within the brackets of each cell in Table 2 indicate the average number of voltage dips recorded at all measurement sites (e.g. 20 measurement locations in HV network of the Netherlands). From Table 2, the average number of voltage dips per year at a HV site is found approximately 8 based on 4 years measurements. On the other hand, the maximum number of events indicated in the cells had (probably) occurred in different measuring sites. For a worst case scenario, if it is considered that all those maximum number of events mentioned in the Table 2 has occurred at one particular site, then the number of maximum voltage dips would be 52. However, such a situation seldom occurs in reality.
Next, simulation is done on typical MV network model using ‘Power Factory’ software. It is done to find out yearly voltage dip profile of the network because of various fault events within the MV network itself. A typical MV substation consists of 15–20 outgoing feeders and each feeder is of 12 km length on average. Almost every MV feeder in the Dutch network consists of both primary and secondary protection devices. Fig. 1 shows a typical MV feeder and the location of its primary and secondary protections. An industrial customer is assumed to be located at ‘Node 7’ at which the yearly voltage dip statistics will be estimated. In the simulated network, total 15 outgoing feeders are present at the primary MV substation. The response time of the secondary protection is taken as 300 ms and that of the primary protection device is 600 ms.
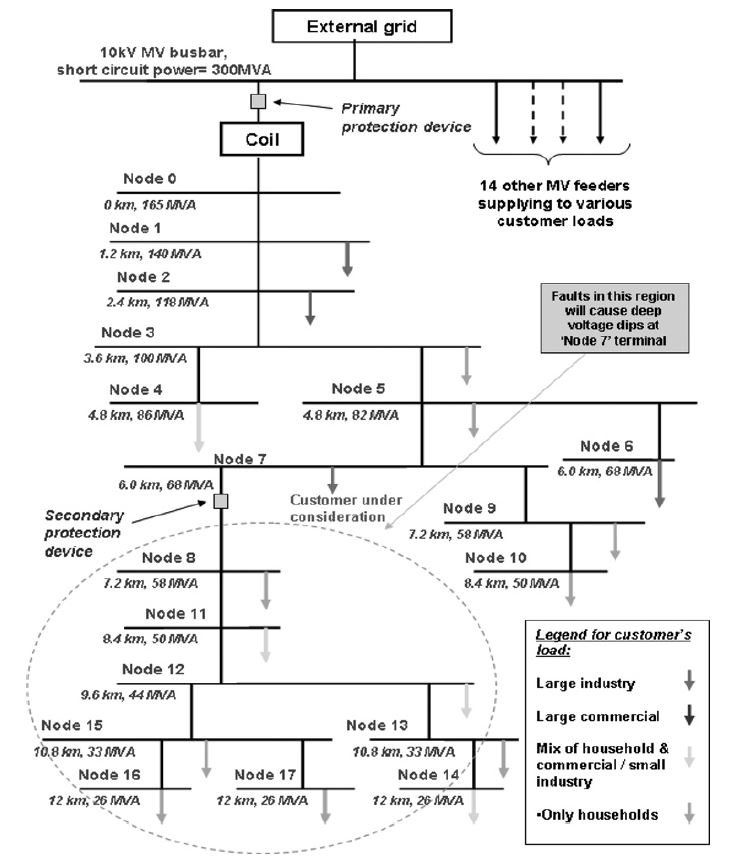
Fig. 1 MV network used for voltage dip simulation
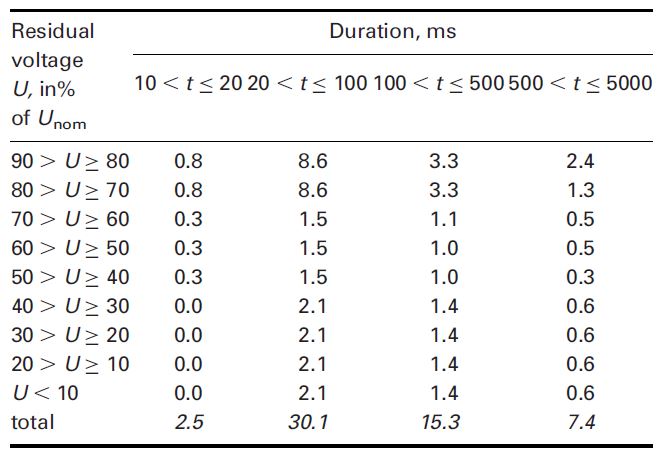
From the network’s national reliability report of the Netherlands [10], it is found that the failure rate of a MV feeder is 0.0243 /km of cable/year and for a MV terminal is 0.012/connection/year. Also, it is assumed that in the MV network 50% faults are of single-phase, 25% are of two-phase and 25% are of three-phase faults [11]. By using the failure data and fault simulation of the MV network, the voltage dip profile at a MV customer’s terminal can be estimated. The faults generated below ‘Node 7’ are cleared by the secondary protection and the customer at ‘Node 7’ faces a deep voltage dip at his terminal. However, when a fault occurs above ‘Node 7’ of that feeder, it is cleared by the primary protection and all customers of the feeder suffer interruption. The annual voltage dip profile at a typical MV customer’s POC (‘Node 7’) is estimated in Table 3. It can be seen that a MV customer is (statistically) expected to face annually 2.5 voltage dip events owing to the various faults in the MV network. Bhattacharyya [12] describes the detailed procedure to estimate voltage dip numbers in the MV networks.
Table 2 Maximum (average) number of voltage dips recorded at a site (all sites) in the HV network

Table 3 Estimated number of dips at a MV customer’s POC due to faults in MV networks

Further, it is assumed that all faults occurring in the HV network are propagating to the MV network. Therefore total number of voltage dips at a MV customer’s POC can be calculated by combining the values of Tables 2 and 3. It can be remarked that the voltage distributions of these two tables are not fully identical. Therefore adjustments are done for the values of Table 2 (such as value indicated in the cell 90 . U ≥ 70 and 10 , t ≤ 20 is divided equally to obtain the values for 90 . U ≥ 80 and 80 . U ≥ 70 with 10 , t ≤ 20). Hence, Table 4 is obtained that indicates average number of voltage dips at a MV customer’s POC in the Netherlands. It is found that there are on average 11 voltage dips/year at a MV customer’s terminal and approximately three events fall in the danger zone, outside the shaded areas of Table 4 (e.g. excluding the areas covered by the green and yellow cells).
Table 4 Average number of dips estimated at a MV customer’s POC

Similarly considering maximum occurrence of dip events (for each cell of Table 2) at a HV site and combining them with the MV simulation results (Table 3), another voltage dip profile is found at a MV customer’s POC (see Table 5). This represents the worst-served (fictitious) site in the MV network. Under such a condition, a MV customer may face a maximum of 55 voltage dips in a year out of which approximately 22 can cause process interruptions when the installation is designed for ‘class 3’ immunity requirements. The numbers found in each cell of Table 5 can be used as an indicative value for the maximum occurrence of voltage dip events at a POC, whereas Table 4 can be used as reference (average) number of voltage dip events/year at a typical MV customer’s POC in the Netherlands.
Table 5 Maximum number of dips estimated at a MV customer’s POC
The probability of occurrence of voltage dip events at a MV customer’s POC can be estimated based on ‘Poisson’s distribution’ function with the assumptions that the occurrence of events is random and the consecutive events are independent of each other [11]. This is a discrete distribution function and calculates the probability of a number of events occurring in a fixed period of time when the average rate of events is known. Fig. 2 shows that when a POC in the MV network registers an average 11 dips/year, then for 95% of the situations the number of voltage dips of that site will be limited to 16 with the maximum probability value 22 dips/year.
Further, to estimate a worse situation in the network, it is assumed that each of the MV customers faces yearly 22 voltage dips. Using the ‘Poisson’s distribution’ function again, it can be found that the number of voltage dips at a MV customer’s POC will be restricted to 30 for 95% of the time in a year (see Fig. 2). In the field measurement in Dutch networks, it was found that most of the MV sites experience less than 15 voltage dips in a year. With the above information, the annual voltage dips numbers at an average MV site in the Netherlands should be limited to 15 (which can be treated as ‘planning-level value’). When the number at a MV site reaches 30 dips in a year, it will be considered as an alarming situation for the network operator (thus can be treated as ‘compatibility level value’).

Fig. 2 Probability of annual occurrence of voltage dips at a MV installation
An important step in voltage dip performance analysis is to identify the customer’s process performance requirements.
The customer has to decide about the acceptable maximum number of process stoppage possibilities in a year owing to voltage dips. First step is to identify the PIT by including all devices in the process chain and estimate the maximum depth and duration of a voltage dip for which the process can survive. When a voltage dip occurs at a customer’s installation, one or more sensitive devices may trip immediately. However, because of recovery actions they may come back in operation and the process will not be interrupted. By analysing each device and its importance to the whole process chain, the process immunity time and respective voltage tolerance curve for the complete process can be determined. It is also possible that by incorporating some changes in the production chain such as modifying some devices with high immunity class or implementing a mitigation measure in the installation, the process immunity to voltage dips can be increased. The desired immunity requirement for the selected process device can be obtained after analysing the network’s voltage dip profile. It is to be noted that with high immunity requirements of a device, the cost of manufacturing also increases.
As found from Table 4, a typical MV customer can expect yearly on average 11 voltage dips/year at his POC, out of which approximately three events fall in the danger zone, outside the shaded areas of Table 4 (e.g. excluding the areas covered by the green and yellow cells). In an extreme situation, a MV customer can face a maximum of 55 voltage dips in a year out of which approximately 22 can cause process interruptions when the installation is designed for ‘class 3’ immunity requirements (as found from Table 5).
PQ mitigation measures can be applied to prevent voltage dip related inconveniences at an installation. As voltage dip mitigation is generally a costly issue, it requires coordinated actions to reach an optimum decision. To implement clear regulation in the electricity supply, the equipment’s performance standard (such as the voltage–time immunity characteristic) should be coordinated with the voltage quality requirements of the network. Such an approach in standards would be useful for all involved parties in the system to minimise voltage dip-related inconveniences. Fig. 3 gives a proposal to define voltage dip-related responsibilities of the three involved parties: the network operator, the customer and the device manufacturer.

Fig. 3 Responsibility borders for different parties about voltage dips in the network
The network operator is responsible to provide information to the customers (when enquired) on various voltage quality parameters such as approximate number of voltage dips on annual basis and their expected characteristics etc. In Table 4, a voltage dip table as per the EN50160 standard format is proposed for medium voltage network in the Netherlands. This gives indication on average number of expected dips on an annual basis, and their respective magnitude and duration. With such information, a network operator will have more insight about the voltage quality performance of his network. If the network operator thinks that a customer’s requirement is too high than the normally offered quality of the supply, he should discuss with the customer before a supply connection agreement is made.
Eliminating voltage dip event completely in the network is not realistic (mainly because of unpredictable natural events); but with robust network design the number of dips can be restricted. Voltage dips of small magnitude with short duration occur relatively frequently in power systems mainly owing to single phase (temporary) faults and are difficult to eliminate [13]. These dips generally do not have major impact on the customer’s POC. However, a customer who is vulnerable to such type of dips should take appropriate measures by himself in protecting the installation. A sensitive customer should also define his process’s typical immunity level based on the voltage–time (‘V-T’) performance of each
process device. A process failure can be affected by various factors. Therefore the customer should recognise the uncertainty region where the process may survive or fail depending on certain circumstances. To avoid voltage dip related problems, he can install a mitigation device, or can use highly immune device components that are less sensitive to voltage dips. The network operator, on the other hand, should provide the customer with the expected number (planning-level value) of all types of voltage dips at the POC, as suggested in this paper. If the customer suspects that his installation is vulnerable to those types of dips, he
can request the network operator for a special connection that fulfills the desired PQ requirements of his installation. This request may be treated as a ‘special contract’. With such a contract, if the network operator fails to meet the agreed commitment, he will be responsible to pay for the solution and the costs involved.
Device manufacturers, on the other hand, should test their devices for different test voltage conditions to define voltage dip immunity characteristics. While selling a device, they should declare the immunity level of their product in the datasheet. If the device still fails to meet the guaranteed performance that is specified in its datasheet, the device manufacturer will be responsible to solve the problem.
The proposed responsibility sharing guidelines proposed in this paper can be explained by a case study conducted at an industrial customer’s POC. Fig. 4 shows the results of a voltage dip measurement campaign conducted at an automobile customer’s installation over a 5 years period [14].
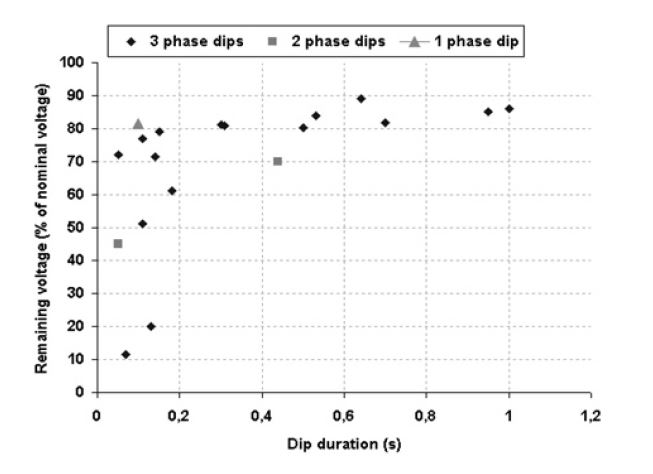
Fig. 4 Recorded voltage dip-data at the automobile customer’s POC (in 5 years period)
From the measurement records, it can be noticed that many three-phase voltage dips have occurred at the customer’s POC. Most of the three-phase dips were of either small duration or small magnitude (voltage dip with a residual voltage of 80% or more). Those types of voltage dips did not cause much damage to the customer’s process operation, as the connected devices (and components) were found immune to withstand short duration and small magnitude voltage dips. However, it was noticed that the customer still suffered approximately three process outages in a year that caused significant financial losses.
At the considered customer’s installation, there are three departments (the metal operation, spray coating, and assembly) where process interruptions occurred owing to voltage dips. Fig. 5 shows the schematic view of the main process operational chain of the considered ‘automobile’ industry along with its detailed assembly process layout. The damage was due to the failures of many programmable logic controllers and variable frequency drives present in the process. The considered customer lost approximately one million euro during the observation period, with an average of E54,000 per interruption [14]. To minimise voltage dip-related financial losses, various mitigation (immunisation) options can be adopted. A modification in the network such as creating a separate high capacity cable for the customer can influence the number and type of voltage dips at the POC. However, such a mitigation measure in the network is a quite expensive investment and the network operator will not be willing to pay for it easily. In most of the cases, the customer needs to implement a mitigation method in his installation at his own expenses. If the network operator provides the customer with the statistics of voltage dips and an approximate number of occurrences of voltage dips at the POC, the customer can accordingly take action to tackle voltage dip problems at the installation. It is also possible to immune the entire site or the whole process chain against various types of voltage dips, but this measure requires significant investments. In contrast, adapting immunisation for a part of process-chain or a sub-process will be more cost effective and less time-consuming solution. While analysing this case, it was observed that ‘drive’ sub-process of the assembly is the bottleneck for restarting the process after a voltage dip event leading to process interruption. The restarting cost of this process accounts for a significant percentage of the total financial losses related to the voltage dips. Therefore attention was paid to this sub-process to immunise it against the voltage dips.

Fig. 5 Schematic of main departments and the detailed assembly process
A sensitive sub-process can be protected against all voltage dips by using an uninterrupted power supply (UPS) or a flywheel. In this case, customer found that installing UPS is the most cost-effective option in comparison to flywheel. Another option can be to protect the sensitive process against the most frequently occurring dip events only. Installing a dynamic voltage restorer (DVR) can provide voltage support (typically up to 30% of the nominal voltage, for one second) during a voltage dip event. Thus, almost 2/3 of all interruptions owing to voltage dips can be avoided by installing DVR in the ‘assembly’ process. The considered installation did not encounter any financial damage when the residual voltage is more than 82% of the nominal voltage. With the DVR installed, it can provide voltage support of another 30% of the nominal voltage. Thus, the installation will be immune to voltage dip with a residual voltage of 52% of the nominal value or more, as shown in Fig. 6.

Fig. 6 Installation protected by a DVR against voltage dips [15]
It was also estimated in the analysis that the investment for a DVR is almost half of the UPS system. A cost–benefit analysis was done for the customer to select the most cost effective and optimum solution. It was found that installing DVR for the whole assembly chain is the economically optimum. It gives the lowest pay-back period and a positive net present value (NPV) when the minimum lifetime of the installation is taken as 5 years [14].
In the present standards, no limiting value is given regarding the number of voltage dip events at a customer’s POC. Therefore a network operator is not directly responsible to restrict the number of voltage dips in the network. Presently, the customers with sensitive processes take mitigation measures by themselves to minimise voltage dip-related problems at their installations. In many cases, customers implement PQ mitigation device or improve immunities of their installation against voltage dips. The customer of the considered case has also adapted an economically optimum mitigation method (DVR) at his
installation to minimise the number of voltage dips causing process interruption. Regulation on the maximum number of voltage dips (of various magnitudes and durations) at a POC could be introduced in the future electricity business to minimise the techno-economic losses of the customers. In this paper, approximate numbers of voltage dips in a year (and the approximate number of dips in each cell of the EN50160 voltage classification table) at a MV customer’s installation are estimated. The network operators in the Netherlands can use this information as reference values while making a PQ contract/agreement with a MV industrial customer. On the other hand, the customer will also be aware of the indicative number of voltage dips that he can face annually at his POC. This will help the customer to design his installation in a more efficient way.
In specific cases, the costs of mitigations can also be shared between the customer and the network operator, based on their mutual agreements.
Presently, many countries of the world are working towards the introduction of voltage quality regulation and identifying the responsibilities of involved parties in the network. In Italy, PQ measurement campaigns are organised and PQ costs for the customers are estimated [16]. Regarding voltage dip, the EN50160 standard methodology was followed to estimate the numbers of dips, process immunity and related outage costs for customers. Further, the responsibilities of the network operator and customers are identified that are comparable with the guidelines proposed in this paper. In South Africa, voltage dip-related responsibilities are specified in their standard [17]. In Sweden, a proposal is given to differentiate various types of voltage dips occurring in different voltage levels [18]. The Swedish energy regulators have defined two parameters to identify the impacts of voltage dips: a maximum permissible event severity (in terms of voltage and duration); and a maximum number of events.
In this paper, the annual voltage dip profiles of Dutch networks are estimated. First, the dip profile is found for the HV networks based on the past 4 years field measurement records. It was estimated that on average the customers connected to the HV network will face eight voltage dip events in a year. Next, the HV voltage dip information is combined with the fault statistics of the MV network components to calculate voltage dip profiles at a POC connected in the MV network. Also, the appropriate numbers of dip events in each cell of the EN50160 standard voltage dip classification table are estimated. The annual number of process failures (at a MV customer’s POC) is found out based on the process’s immunity graph and the network’s annual voltage dip profile. In a typical MV network in the Netherlands, an industrial customer can expect approximately 11 voltage dips in a year at the POC; whereas annually three process interruptions can occur when the installation is protected with ‘class 3’ immunity requirements.
Further, it is estimated that the annual number of voltage dips at an average MV site should be restricted to 15 (‘planning-level value’), whereas it will be an alarming situation when this number exceeds 30 (‘compatibility-level value’) in the MV networks of the Netherlands. Assigning a unique compatibility value in the standard for voltage dips is complex as it is largely dependent on voltage level, network type and its topology. Besides that, more research should be done to distinguish between different types of dips and their impacts to various devices and to different parties involved in the network.
Finally, a proposal is given to define voltage dip-related responsibilities for the network operator, the customer and the device manufacturer. As voltage dip mitigation method is quite costly, the decision on investment is to done with utmost care. In this paper, a case study is discussed in which the industrial customer was suffering significant monetary losses because of voltage dips. Therefore the customer performed a cost–benefit analysis for his installation to choose the optimum mitigation method. Based on the 5 years recorded data on voltage dip at the POC, the customer took a cost-effective measure to protect his installation. By that measure, majority of the voltage dips could be avoided that were causing damage to the customer’s installation. Hence, it can be concluded that information on the appropriate number of dips (of different categories) from the network operator would be useful for a customer to design his installation more efficiently and cost effectively.
The work of this paper is part of the research project ‘Voltage quality in future infrastructures’ (‘Kwaliteit van de spanning in toekomstige infrastructuren (KTI)’ in Dutch), sponsored by the Ministry of Economic Affairs, Agriculture and Innovation of the Netherlands.
IET Gener. Transm. Distrib., 2012, Vol. 6, Iss. 7, pp. 619–626 625 doi: 10.1049/iet-gtd.2011.0801. www.ietdl.org
Published by
IJSRD – International Journal for Scientific Research & Development | Vol. 5, Issue 09, 2017 | ISSN (online): 2321-0613
Power quality is vital position recently because of the impact on electricity supplier’s equipment manufacture and consumer’s. Power quality is characterized in light of the fact that the variety of current, voltage and frequency in a power framework. It refers to an extensive sort of electromagnetic [EMI] phenomena that symbolize the contemporary and voltage at a given time and at a given area in the strength system. Currently, there are such a lot of industries the usage of technology for production and method unit. This generation calls for high quality and reliability of power supply system. The industries like equipments of manufacturing unit, semiconductor, computer, are very sensitive to the modifications of quality in power supply. Power Quality (PQ) issues encompass a wide variety of disturbances network along with impulse transient, voltage, harmonics distortion, sags/swells, flicker, , and interruptions. Voltage swells/sags can happens more regularly than other Power quality phenomenon. These voltage swells/sags are the maximum undesired power quality troubles inside the power distribution network. The goal and scope of this paper is look at of power excellent (PQ) occurrence in distribution structures.
Key words: Custom power, DSTATCOM, UPQC, DVR, PQ
Power quality problem in the power system has showed importance since the late 1980s. The curiosity in Power Quality is related to all three parties worried with the power i.e. Equipment manufacturers utility businesses and electricity buyers. Problems affecting the electric supply that were once considered tolerable by the electricity utilities and users are now frequently taken as a problem to the users of every day equipment. Understanding power quality (PQ) can also be confusing at best. There are two phrases identified in electrical power techniques concerning the quality of power: first-rate power pleasant and terrible power first-rate. Power quality (PQ) can be utilized to explain a power supply that is at all times on hand, continuously within the voltage and frequency tolerances and has a pure sinusoidal wave shape to all equipment, because most equipment was designed on that basis [13]. Unfortunately, most of the equipment that is technical distorts the voltage [12] on the electric distribution system, leading to what is known as poor power quality (PQ).And therefore affecting other apparatus that was once designed with the expectation of constant undistorted voltage, and are for that reason sensitive [11] to power disturbances leading to reduced performance and can reason factors peculiar operation or premature failure. The cost of power quality (PQ) issues can be very high and include the cost of demurrage, lack of customer confidence and, in some cases, equipment damage. Indeed, power quality (PQ) is an important point in the relationship between suppliers and consumers[12] but might become a contractual gratitude that stress on improving power quality(PQ), availability, performance[8] and efficiency and these improvements will have: advantage for industrial customers (customized and flexible availability) and for suppliers utilities.
To make the investigation of PQ issues valuable, the different sorts of unsettling influences should be arranged by magnitude and duration.
A. Under voltages
Brief duration under -voltages are referred to as a “Voltage Dips [IEC]”/” Voltage Sags” Voltage sag [17, 18] is a reduction in the supply voltage magnitude followed by means of a voltage realization after a short period of time. Extreme framework loading, loss of age, inaccurately set transformer taps and voltage. controller unsettling disturbances, causes under voltage. Loads with a poor power factor or a basic lack of reactive power support on a method additionally contribute. Under voltage might also not directly lead to overloading issues as equipment places an increased current to keep power output (e.g. Motor loads).

Fig.1: An example of Under Voltage
B. Voltage Dips
The significant reason of voltage dips on a supply framework is a fault on the framework, i.e. sufficiently remote electrically that a voltage reregulation does not occur. Other sources are the applying of large loads and, occasionally, the apply of large inductive loads [18]. The effect on buyers may only assortment from the irritating (non-occasional light flicker) to the genuine (tripping of sensitive loads and associating of motors).
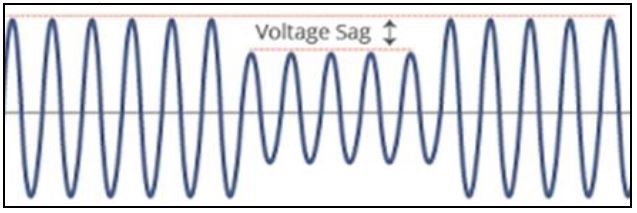
Fig. 2: An example of voltage sag
C. Voltage Spikes/Surges
Voltage surges/spikes are the opposite of dips – a arise that may be nearly instantaneous (spike) or happening over a longer duration (surge). These are regularly caused by arcing amid switching and lightning strikes operations on circuit breakers/contactors (fault clearance, circuit switching, particularly switch off of inductive burdens).
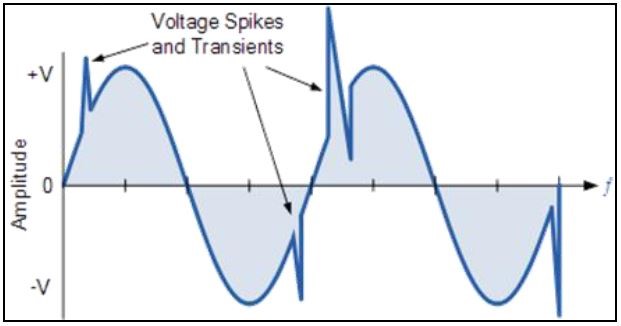
Fig. 3: An example of Voltage Surges/Spikes
D. Frequency Variations
Frequency fluctuations that are much enough to cause problems are most often envisage in small isolated networks, due to faulty. Different causes are not kidding overloads on a framework, or representative failures, however on an interconnected network, a solitary governor failure will not widespread disturbances influences of this nature.
E. Very short Interruptions.
Total interruption of electrical supply for length from couple of milliseconds to 1 seconds or 2 seconds. Causes: Mainly because of the opening and programmed reclosure of security gadgets to decommission a faulty section of the framework. The principle fault causes are insulator flashover insulation failure, and lightning

Fig. 4: An example of Very short Interruptions
F. Harmonic distortion
Current or voltage or waveforms expect non-sinusoidal shape. The waveform compares to the sum of other sine-waves with various stage and extent, having frequencies that are products of energy framework recurrence.
Causes: Classic sources: electric power machines working over the knee of the magnetization curve (alluring drenching), arc furnaces, rectifiers, welding machines and DC brush engines.
Modern sources: every single nonlinear load, for example, power electronics equipment including ASDs, , data preparing equipment, switched mode power supplies high efficiency lighting.
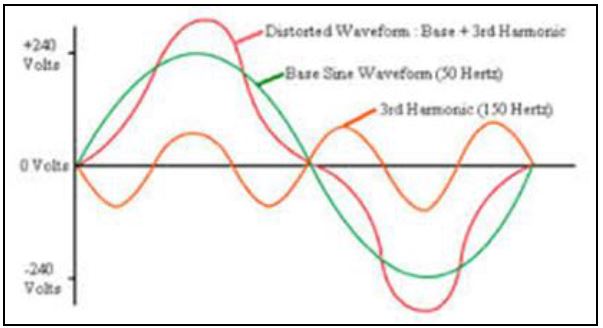
Fig. 5: An example of harmonic distortion
G. Voltage fluctuation
Oscillation of voltage esteem, amplitude regulated by a signal with frequency of 0 to 30 Hz. Causes: frequent start/stop of electric power motors (for instance elevators), Arc furnaces, oscillating loads. Consequences: Most outcomes are common to under voltage. The most perceptible outcome is the Flickering of lighting and screens, giving the impression of precariousness of visual observation.
A. Distribution Static Compensator (DSTATCOM)
DSTATCOM is a Voltage source inverter (VSI) based static compensator device (FACTS controller, STATCOM) connected to keep up transport voltage lists at the required level by of providing or accepting receptive power in the conveyance framework. It is associated in shunt with dispersion connect with the assistance of coupling transformer. The single line diagram [SLD] of DSTATCOM is appeared in indicated fig.6. The DSTATCOM comprises of a VSI, dc voltage, energy storage device, an air conditioner filter and coupling transformer.
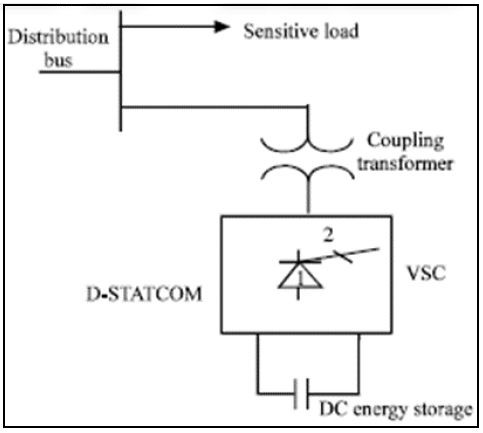
Fig. 6: Schematic diagram of DSTATCOM
In the power circuit, voltage source of inverter (VSI) converts DC voltage into controllable ac voltage, connected by ac filter and associated with AC distribution network through coupling transformer. The DSTATCOM can also absorbed and rely active power, by using energy storage in sufficient amount or renewal energy resources. The working rule of DSTATCOM that it constantly direction and screens the load currents and voltages, decides the measure of remuneration required by distribution system for a need of disturbances. In this plan the active power flow is controlled by the point between the ac framework and Voltage source inverter (VSI) voltages, the reactive power flow is controlled by the distinction between the adequacy of these voltages. The DSTATCOM works in both current and voltage control modes.
B. Static Series Compensator
Static series compensator is otherwise called Dynamic Voltage Restorer (DVR). It is a high-speed switching power electronic controlling gadget. Otherwise called series voltage booster. Dynamic Voltage Restorer (DVR) is a series connected custom power electronics device, designed to inject a dynamically regulated voltage in phase and magnitude in to distribution line by means of coupling transformer to correct load voltage. The summed up square diag. of DVR is appeared in the Fig 7.

Fig. 7: Schematic diagram of DVR
It consists of an energy storage device or renewal energy resources, a boost converter (dc to dc), voltage source inverter (VSI), ac filter and coupling transformer, connected in series. Here dc capacitors elements is used as energy storage device, which is interface by a boost converter. The boost converter controlled the voltage over the dc link capacitor that utilizations as a typical voltage hotspot for the inverters. The inverter methodology generates a compensating voltage, which is inserted into distribution system through series matching transformer. In the case of voltage reregulation, the Dynamic Voltage Restorer (DVR) controllers generate a reference voltage, and compare it with inject synchronized voltage and source voltage to maintain the load voltage constant. The energy storage elements provide the required power to synchronized injected voltage.
The ac filter evacuates the impacts on winding of coupling transformer and power electronics switching losses of control signal producing systems for voltage source of inverter (VSI).
Where Vs(t) supply voltage, Vi(t) infusion voltage of DVR, and Vl(t) load voltage are associated in arrangement. the load voltage is given as:
Vl(t)=Vi(t)+Vs(t)
Along these lines DVR is supposing as an external voltage source of controlled frequency, phase angle, and abundancy. The point of utilizing DVR is to keep up the phase angle, amplitude and of fixed load voltage.
C. Unified Power Quality Compensator (UPQC)
It is a typical operation of shunt active and arrangement conditioner. Shunt active power filter strength of the current compensation, series active power filter strength of voltage compensation allow quelling of various power quality problem. The single line diagram (SLD) of unified power quality compensator (UPQC) is appeared in Fig 8. To repay under voltage shunt associated active conditioner need to absorb active power injected by arrangement compensator in arrangement to remunerate overvoltage active conditioner retain active power keeping DC connect charged. Two kind of are unified power quality compensator (UPQC) are proposed in literature overviews. One is called Left-Shunt UPQC and another is known as Right Shunt UPQC. The general execution of right-shunt unified power quality compensator (UPQC) is superior to anything left-shunt unified power quality compensator (UPQC). At the point UPQC is related between two feeders by then, called IUPQC.

Fig. 8: Schematic diagram of UPQC
This paper Discussed a brief review of power devices which has been installed in power distribution network to remove various power quality fluctuations;, flicker, power factor decrease, dip, current harmonics, voltage sag/swells. These power electronics devices applied at the distribution system with purpose of protect whole plant, loads, feeder. The A. Distribution Static Compensator (DSTATCOM), which is associated in shunt can give great power quality in both appropriation and transmission. Unified Power Quality Compensator (UPQC) is the key of power devices, can regulate both current and voltage related problems at the same time. This entire device integrated to form custom power area.
REFERENCES
[1] M.B. Brennen and B. Banerjee, “Low cost, high performance active power line conditioners”. Proc. Conf. PQA 94, Part 2, Amsterdam, The Netherlands, Oct. 24- 27, 1994.
[2] J.M. Powell, “Power conditioning system and apparatus” U.S.Patent 4, 544, 877, Oct.1, 1985.
[3] “Comprehensive monitoring—covering all aspects” http://www.powerquality.com/art0031/art1.ht m
[4] Dennis Stewart, “Cover Story: Power monitoring technology Dispelling—metering myths” http://www.powerquality.com/articles.html
[5] Marty Martin, “Common power quality problems and best practice solutions,” Shangri-la Kuala Lumpur, Malaysia 14. August 1997.
[6] David Chapman, “Electrical design—A good practice guide”,CDA Publication 123, Dec. 1997.
[7] D.D. Sabin and A. Sundaram, “Quality enhances reliability”.IEEE Spectrum, Feb. 1996. 34-41.
[8] N.G. Hingorani, “Introducing custom power,” IEEE Spectrum, Jun. 1995, 41-48.
[9] “Details of equipment sensitivity,” http://www.powerquality.com/pqpark/pqpk1052.hm.
[10] A. Rash, “Power quality and harmonics in the supply network a look at common practices and standards,” in Proc. on MELECON’ 98, Vol.2, pp.1219-1223, May1998.
[11] R.C. Sermon, “An overview of power quality standards and guidelines from the end-user’s point-of-view,” in Proc. Rural Electric Power Conf., pp. 1-15, May 2005.
[12] IEC 61000-4-30, “Testing and measurement techniques – Power quality measurement methods,” pp. 19, 78, 81,2003.
[13] EN 50160, “Voltage characteristics of electricity supplied by public distribution systems,” 1999.
[14] M.H.J. Bollen, Understanding Power Quality Problems: Voltage Sags and Interruptions, New York, IEEE Press, 1999
[15] E. Styvaktakis, M.H.J. Bollen, I.Y.H. Gu, “Classification of power system events: Voltage dips,” 9th International IEEE Conference on Harmonics and Quality of Power, Orlando, Florida USA, Vol. 2, pp. 745- 750, October 1-4, 2000.
[16] A. Domijan, G.T. Heydt, A.P.S. Meliopoulos, S.S. Venkata, S. West, “Directions of research on electric power quality,” IEEE Transactions on Power Delivery, Vol. 8, pp. 429-436, 1993.
[17] R.C. Dugan, M.F. McGranaghan, and H.W. Beaty, Electric Power Systems Quality, New York, McGraw-Hill, 1996.
[18] J. Arrillaga, N.R. Watson and S. Chen, Power system quality assessment, John Wiley and Sons, 2000.
[19] IEEE Working Group on Voltage Flicker and Service to Critical Loads, “Power Quality—Two Different erspectives,” presented at IEEE/PES 1900 Winter Meeting,Atlanta, GA, Feb. 1990.
[20] IEEE Recommended Practice for Monitoring Electric Power Quality, IEEE Standard 1159– 1995.
[21] H.J. Kim, K.C. Seong, J.W. Cho, J.H. Bae, K.D. Sim, S. Kim, E.Y. Lee, K. Ryu and S.H. Kim, “3 MJ/750 kVA SMES System for Improving Power Quality,” IEEE Trans. on Superconductivity, Vol. 16, issue 2, pp. 574- 577, June,2006.
[22] W.M Grady, M.J. Samotyj, and A.H. Noyola, “Survey of active power line conditioning methodologies,” IEEE Trans. Power Delivery, Vol. 5, pp. 1536–1542, 1990.
[23] B. Singh, K. AL Haddad and A. Chandra, “A review of active filters for power quality improvement,” IEEE Trans. Ind. Electron., Vol. 46, pp. 960–970, 1999.
Published by Carelabs (Carelabz)
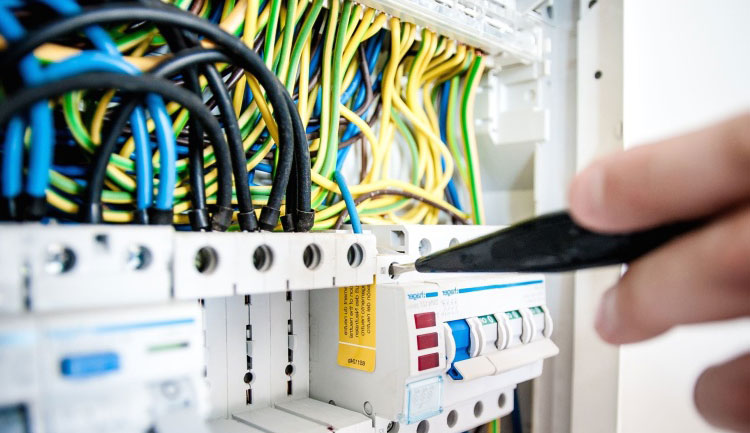
Making a product “safe” requires an understanding of the “hazards” that exist in each electrical product. Certain potential hazards are inborn in all electrical products because of the manner in which they are powered and how they perform their intended functions. Even though a product requires an electrical power source and uses electrical or electronic components, it should not present an electrical shock hazard to the user.
Four fundamental hazards must be evaluated as part of any product safety evaluation:
Although additional safety requirements are also included in most safety standards, these four hazards are the foundation upon which all safety standards are based.
Electrical shock and its effects can be caused and influenced by several factors. The primary effect is the result of electrical current passing through the human body. Severity of the injury to the human body is directly affected by such variables as: the nature of the electrical voltage (AC vs. DC); the pathway through the human body; conductivity of the contact (wet or dry); the size and shape of the individual involved i.e., the person’s impedance), duration of the contact, and the size of the contact area. All these affect the magnitude of current that flows through the person’s body.
Most safety standards address the shock issue by incorporating requirements that instructs appropriate product enclosures: connectors that do not allow direct user access, good dielectric or insulating barriers, as well as very low leakage current. Not all voltage potentials, however, are considered hazardous. Some are considered safe for user contact because of the low levels at which they operate. Since the standards are very specific about these limits, manufacturers must be careful to test their products against the right product standard to be sure that the products are safe.
Testing electrical and electronic products for electrical safety is intended to identify the potential risk of electrical shock to users. It is a statutory obligation in most cases. If your premises are open to the public, i.e. pubs, schools, cinemas, clubs, churches, dentists, doctors etc. then you most likely need to be inspected yearly. If you are a private dwelling then you should be tested at least every 10 years.
Electrical testing is often overlooked by ignorance, many companies now delegate the responsibility to dedicated companies. Carelabs keeps a data base of all tests and the results, when they are performed. This way there will be clarity.
Carelabs conducts electrical testing of the fixed equipment (cables, sockets, lights, etc.) and PAT (Portable Appliance Testing) simply put if it has a plug on it, it will and has to be tested. This is a requirement for all types of installation, Industrial, Commercial and Domestic. Home-owners wishing to sell their dwelling can use our same service to make the test results available to potential purchase.
Electrical safety is mandatory for legal access to every major country in the world. It can help prevent unsafe products from reaching the market, reducing the number of deaths and injuries, as well as costly product recalls and potential litigation. Manufacturers whose products that have been tested and certified to applicable electrical safety standards send a clear signal to buyers and the general public of their commitment to user safety. This question is many manufacturers want to ask, surely the general answer is “because it is regulated in safety standard”.
Both Producer and designer should do their duty to protect consumer safety on safety protection of special product. Passing safety verification doesn’t mean the danger won’t occur. The designers should browse safety related information on usual days, new standard announcement and new test method will effect on test basis of related product.
Electric shock:
Electrical shock is caused by flow of current through human body. This kind of electrical shock has direct effect on human body, the seriousness of injuries depends on degree of electrical energy, humidity, and time duration of the conduction. Shock hazards vary in severity and range from a tingling sensation to a lethal jolt. Identifying, correcting, and eliminating shock hazards are the primary reasons for electrical safety testing.
Electrical shock includes the following four kinds of test:
These tests will be discussed in detail in the following content.
Consider your laptop. Most of the time it presents no shock hazard to you. However, when you plug it into the charger and connect the charger to a wall outlet, you now have a possibility for a shock hazard. If the insulation between the charger and your laptop were to fail, the primary voltage applied to the charger could be present on conductive surfaces to which you have access.
We perform the following equipment checks during visual and physical inspection of all equipment:
1.Check for obvious damage or defects in the accessories, connectors, plugs or extension outlet sockets; and for discoloration that may indicate exposure to heat, chemicals or moisture.
Note: For low-voltage portable equipment and cord extension sets fitted with AS/NZS 3112 type (flat pin) plugs and extension sockets, the use of clear backed or integrally moulded (non re-wireable) plugs, and cord extension sockets is recommended. Clear backed plugs and sockets facilitate the easy inspection of the effectiveness of the sheath grip.
2.Check that flexible cords are effectively anchored to equipment, plugs and cord extension sockets.
Note: This inspection, including flexing and straining at points of entry and clamping points by the application of reasonable combination of push/pull and rotary movements, may detect broken strands or loose connections.
3.Check for damage to flexible cords that:
Note: Carefully running the supply cord through the hand will often detect internal damage such as twisted conductors or broken core filling. Connecting the plugs/sockets of extension leads together helps to confirm that the terminals have not spread.
4.Check that any operating controls are in good working order – that they are secure, aligned and appropriately identified.
5.Check that covers, guards, and the like are secured in the manner intended by the manufacturer or supplier.
6.Check that ventilation inlets and exhausts are unobstructed.
IEC 60335 is the most widely applied standard for electrical safety testing, especially for domestic appliances. Many safety testing standards in the world have been based on it. Electric safety testing will help
Following are the basic tests we conduct during electrical safety testing:
High voltage test also known as HiPot test or dielectric voltage-withstand test is a non-destructive test that determines the adequacy of electrical insulation for the normally occurring over voltage transient. This is a high-voltage test that is applied to all devices for a specific time in order to ensure that the insulation is not marginal. Hipot tests are helpful in finding nicked or crushed insulation, stray wire strands or braided shielding, conductive or corrosive contaminants around the conductors, terminal spacing problems, and tolerance errors in cables. It guarantees no current flows from one point to another point.
HiPot test is opposite of continuity test. Continuity Test checks surety of current flows easily from one point to another point while Hipot Test checks surety of current would not flow from one point to another point (and turn up the voltage really high just to make sure no current will flow).
Hipot testers usually connect one side of the supply to safety. The other side of the supply is connected to the conductor being tested. With the supply connected like this there are two places a given conductor can be connected: high voltage or ground. When you have more than two contacts to be hipot tested you connect one contact to high voltage and connect all other contacts to ground.
Testing a contact in this fashion makes sure it is isolated from all other contacts. If the insulation between the two is adequate, then the application of a large voltage difference between the two conductors separated by the insulator would result in the flow of a very small current. Although this small current is acceptable, no breakdown of either the air insulation or the solid insulation should take place. Therefore, the current of interest is the current that is the result of a partial discharge or breakdown, rather than the current due to capacitive coupling
Steps to be followed during HiPot tests are:
Ground protection consists of two kinds of test method:
The purpose of ground protection test is for protecting users from electrical hazards from touching equipment when unsuitable current is created and flows to the earth. The test method of ground continuity is inputting 1 ampere DC current to power terminal for confirming the resistance value between two ends is lower than 1Ω. Ground bond test is to inputting 25A or 1.5 times rated current to power terminal and check resistance values are lower than 100mΩ.
This test will ascertain whether the earth continuity between the earth supply to the equipment and the internal component earth connections and the metal casing of the equipment are earthed correctly.
The resistance reading must be no more than 1 ohm and whenever the resistance reading proves to be more than 1 ohm, there is a fault present and must be traced and rectified before proceeding any further. Check all the earth wires for continuity and check all connections are secure.
Poor grounding not only increases the risk of equipment failure; it is dangerous. Facilities need to have adequately grounded electrical systems so in the event of a lightning strike, or utility overvoltage, current will find a safe path to earth.
Simple grounding systems consist of a single ground electrode driven into the ground. The use of a single ground electrode is the most common form of grounding and can be found outside your home or place of business. Complex grounding systems consist of multiple ground rods; connected mesh or grid networks; ground plates; and ground loops. These systems are typically installed at power generating substations, central offices, and cell tower sites.
Warning: Poor earth continuity or no earth continuity at all will create a dangerous situation, as any metal parts that should be earthed may become live and a short circuit may cause an electric shock
Insulation resistance test is non-destructive test and can detect if insulation is good. In some regulation, do insulation resistance test firstly then withstand test. When insulation resistance test fails usually withstand voltage test also fails.
The standard insulation resistance test is divided into four steps:
This is the simplest of the tests. After the required connections are made, you apply the test voltage for a period of one min. (The one-min interval is an industry practice that allows everyone to take the reading at the same time. In this way, comparison of readings will be of value because, although taken by different people, the test methods are consistent.) During this interval, the resistance should drop or remain relatively steady. Larger insulation systems will show a steady decrease, while smaller systems will remain steady because the capacitive and absorption currents drop to zero faster on smaller insulation systems. After one min, read and record the resistance value.
The Insulation Resistance Test consists in measuring the Insulation resistance of a device under test, while phase and neutral are short circuited together. The measured resistance has to be higher than the indicated limit from the international standards. The measured resistance indicates the condition of the insulation between two conductive parts. An infinite resistance would be the perfect result, but no insulator is perfect, so the higher the reading the better. To perform the tests needed, you will need an Insulation Resistance Tester or a multifunctional tester such as Megger.
You can use it as:
Obviously, it’s a good idea to have a basic familiarity with the item you’re testing. Basically, you should know what is supposed to be insulated from what. The equipment you’re testing will determine how you hook up your meghommeter.
When performing insulation resistance testing, you must maintain consistency. Why? Because electrical insulation will exhibit dynamic behavior during the course of your test; whether the dielectric is “good” or “bad.” To evaluate a number of test results on the same piece of equipment, you have to conduct the test the same way and under the relatively same environmental parameters, each and every time. Your resistance measurement readings will also change with time. This is because electrical insulation materials exhibit capacitance and will charge during the course of the test. This can be somewhat frustrating to a novice. However, it becomes a useful tool to a seasoned technician.
Leakage current is the current that flows from either AC or DC circuit in an equipment to the chassis, or to the ground, and can be either from the input or the output. If the equipment is not properly grounded, the current flows through other paths such as the human body. The difference between leakage current test, withstanding voltage test and grounding protection test is the process of testing an equipment under running status. Whatever be the national standard regulation or region standard regulation, the standard of leakage current is different depending on the insulation types of products. “CLASS I, II, III” (which derived from IEC system) A brief descriptions is given below:
Leakage Current Test or a line voltage leakage current test simulates the effect of a person touching exposed metal parts of a product and detects whether or not the leakage current that would flow through the person’s body remains below a safe level. A person typically perceives current flow through his body when it reaches or exceeds 1mA (one thousandth of an ampere). Current above the threshold can cause an uncontrolled muscular spasm or shock. The leakage current is measured by applying a fixed voltage and measuring the voltage across the shunt that is a result of the leakage current. The reference design uses different switchable shunt resistances, which are switched on in a sequence to measure the insulation resistance. When there is a dead short, the insulation resistance is 0 Ω and a full current (or maximum) can pass through the insulation resistance. At this point in the measurement having a smaller shunt value (by turning on all of the switches) is mandatory. In the other case, when the insulation is higher, a higher shunt value is required. The leakage current flowing through the shunt or shunts is measured using a current shunt monitor
The first step to select safety test equipment is to realize your basic requirement, it may be the safety standard your company product need to accord. The test is for promoting product function requirement and consideration of cost and efficiency.
Since hipot tests are usually required for 100% of the units in a production line, and since hipot tests are more stringent, line voltage leakage tests are normally specified as design or type tests and not as production line tests.
Business Interruptions:
The more power your facility uses, the greater the risk of a failure. Electrical failures are inevitable without preventive maintenance.
Life/Safety Risks:
Electrical distribution system malfunctions are now the leading cause of office structure and basic industry fire in the North America. DON’T RISK IT! Let us help!
Utility Costs:
Without Preventive Maintenance the Electrical Distribution System itself can waste on average $1,000 to $4,000 in Electric Utility Cost annually! We can help to identify and eliminate these wasted costs!
Surge Suppression:
80% of all transients are generated internally by starting and stopping of elevators, motors, heating and air conditioning equipment and manufacturing equipment. Electrical transients, which are spikes of current and/or voltage in a circuit, cause degradation in equipment which commonly get mistaken for manufacturer quality and equipment age. We can help develop a surge suppression plan to ensure the maximum possible protection of your assets.
Power Quality Analysis:
Power quality problems cause loss of data and malfunction of computerized equipment. We can identify and help you eliminate these problems.
Insurance/Certification:
Insurance companies lose millions of dollars each year due to electrical failure. When insurance companies lose so do their customers. More and more insurance companies are encouraging their customers to participate in electrical preventive maintenance. It’s a savings for all.
Asset Management:
The average life expectancy of your Electrical Distribution System is only 15 years when electrical preventive maintenance does not exist. When your electrical system is cared for its life expectancy goes to an average of 30 years. We can help you plan for large upgrades, and avoid emergency repairs.
Source: https://carelabz.com/need-conduct-electrical-safety-testing/
Published by Bill Brown, P.E., Square D Engineering Services.
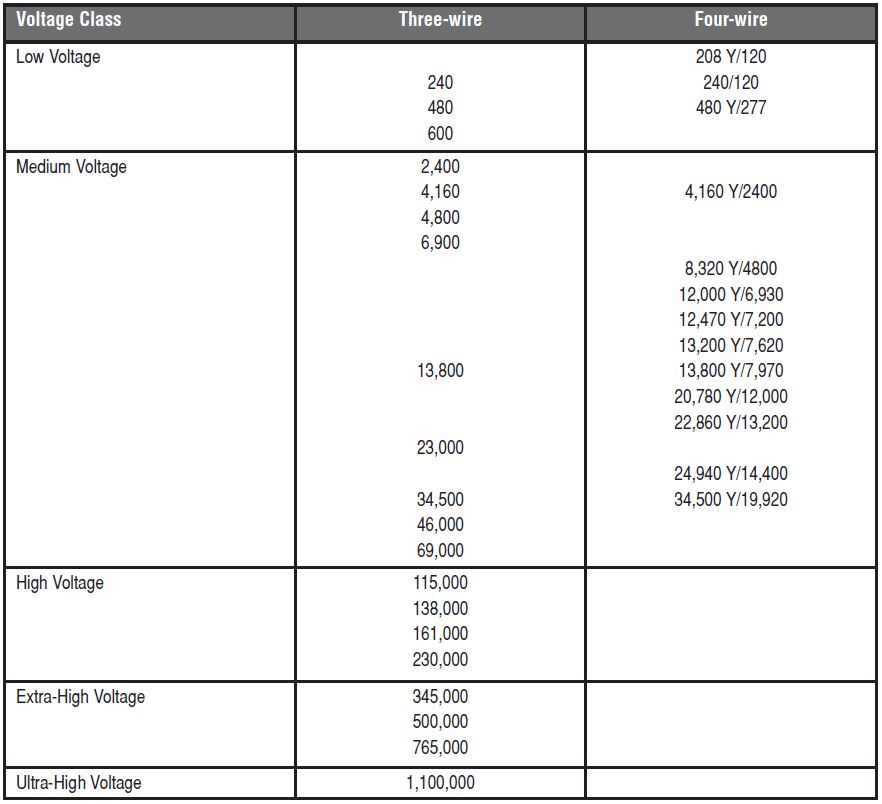
The selection of system voltages is crucial to successful power system design. Reference [1] lists the standard voltages for the United States and their ranges. The nominal voltages from [1] are given in table 4-1. As can be seen, ANSI C84.1-1989 divides system voltages into “voltage classes.” Voltages 600 V and below are referred to as “low voltage,” voltages from 600 V-69 kV are referred to as “medium voltage,” voltages from 69 kV-230 kV are referred to as “high voltage” and voltages 230 kV-1,100 kV are referred to as “extra high voltage,” with 1,100 kV also referred to as “ultra high voltage.” The emphasis of this guide is on low and medium voltage distribution systems.
Table 4-1: Standard nominal three-phase system voltages per ANSI C84.1-1989
The choice of service voltage is limited to those voltages which the serving utility provides. In most cases only one choice of electrical utility is available, and thus only one choice of service voltage. As the power requirements increase, so too does the likelihood that the utility will require a higher service voltage for a given installation. In some cases a choice may be given by the utility as to the service voltage desired, in which case an analysis of the various options would be required to arrive at the correct choice. In general, the higher the service voltage the more expensive the equipment required to accommodate it will be. Maintenance and installation costs also increase with increasing service voltage. However, equipment such as large motors may require a service voltage of 4160 V or higher, and, further, service reliability tends to increase at higher service voltages.
Another factor to consider regarding service voltage is the voltage regulation of the utility system. Voltages defined by the utility as “distribution” should, in most cases, have adequate voltage regulation for the loads served. Voltages defined as “subtransmission” or “transmission”, however, often require the use of voltage regulators or load-tap changing transformers at the service equipment to give adequate voltage regulation. This situation typically only occurs for service voltages above 34.5 kV, however it can occur on voltages between 20 kV and 34.5 kV. When in doubt the serving utility should be consulted.
The utilization voltage is determined by the requirements of the served loads. For most industrial and commercial facilities this will be 480 Y/277 V, although 208 Y/120 V is also required for convenience receptacles and small machinery. Large motors may require 4160 V or higher. Distribution within a facility may be 480 Y/277 V or, for large distribution systems, medium voltage distribution may be required. Medium voltage distribution implies a medium voltage (or higher) service voltage, and will result in higher costs of equipment, installation, and maintenance than low voltage distribution. However, this must be considered along with the fact that medium voltage distribution will generally result in smaller conductor sizes and will make control of voltage drop easier.
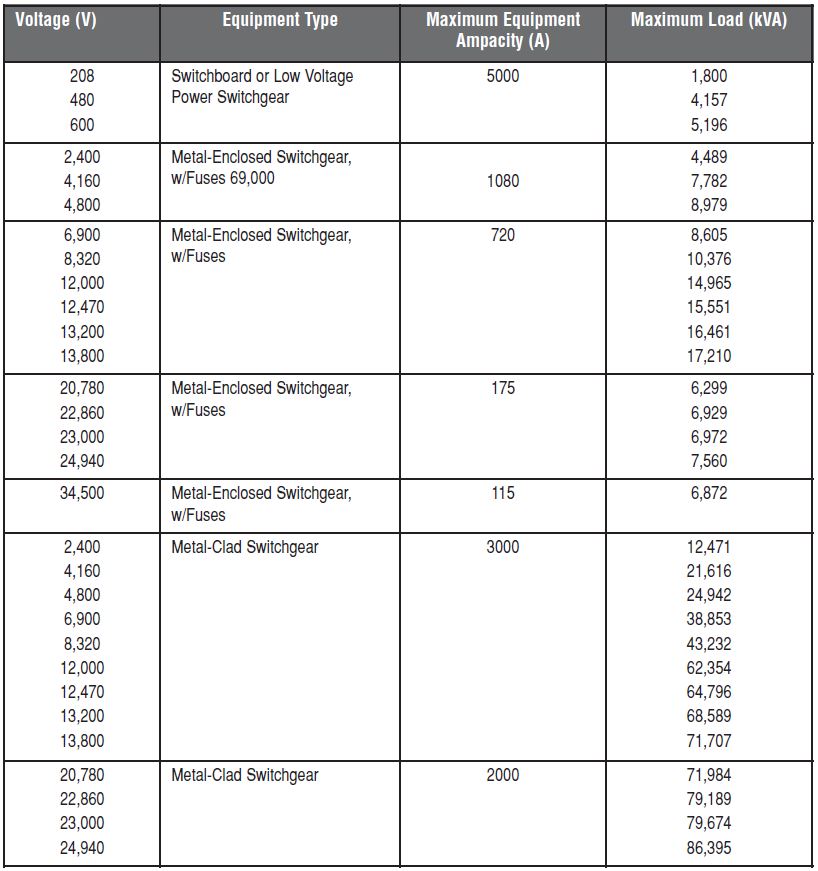
Power equipment ampacity limitations impose practical limits upon the available service voltage to serve a given load requirement for a single service, as shown in table 4-2.
Because all conductors exhibit an impedance to the flow of electric current, the voltage will not be constant throughout the system, but will tend to drop as one moves closer to the load. Ohm’s Law, expressed in phasor form for AC circuits, gives the basic relationship for voltage drop vs. the load current:

where
Thus, the larger the load current and larger the conductor impedance, the larger the voltage drop. Unbalanced loads will, of course, give an unbalanced voltage drop, which will lead to an unbalanced voltage at the utilization equipment.
A voltage drop of 5% or less from the utility service to the most remotely-located load is recommended by NEC article 210.19(A)(1), FPN No. 4. Because this is a note only, it is not a requirement per se but is the commonly accepted guideline.
Table 4-2: Power equipment design limits to service voltage vs. load requirements,
for a single service
Because conductor impedance increases with the length of the conductor, it can be seen that unless the power source is close to the center of the load the voltage will vary across the system, and, further, it can be more costly to maintain the maximum voltage drop across the system to within 5% of the service voltage since larger conductors must be used to offset longer conductor lengths.
Also from equation (4-1) it can be seen that as load changes, so does the voltage drop. For a given maximum load, a measure of this change at a given point is the voltage regulation, defined as

where
Another source of concern when planning for voltage drop is the use of power-factor correction capacitors. Because these serve to reduce the reactive component of the load current they will also reduce the voltage drop per equation (4-1). Both low and high voltage conditions, and voltage imbalance, have an adverse effect on utilization equipment (see [2] for additional information). Voltage drop must therefore be taken into account during power system design to avoid future problems.
References
[1] American National Standard Preferred Voltage Ratings for Electric Power Systems and Equipment (60 Hz), ANSI C84.1-1989.
[2] IEEE Recommended Practice for Electric Power Distribution for Industrial Plants, IEEE Standard 141-1993, December 1993.
Published by Norbert EDOMAH, Industrial Co-ordinator, Institute for Industrial Technology (IIT), Lagos, Nigeria. E-mail: ncedomah@yahoo.co.uk
Published in CIRED 20th International Conference on Electricity Distribution, Prague, 8 -11 June 2009.
Poor power quality has come to stay in most parts of the world. In most part of Africa, especially in Nigeria, it is almost normal not to have good clean power free from disturbances. If power equipment and loads could talk or express feelings, I am sure they would have made a big protest against the great injustices imposed on them. A survey was carried out amongst 15 multi-national companies in southwest Nigeria to ascertain the cause(s) and effects of poor power quality on electrical equipment and its economic implications. The survey revealed that 9 out of 15 of those companies loose an average of 5 variable speed (AC) drives every year owing to poor power quality. It also revealed that the most common disturbances faced are voltage sag and swell. This paper is aimed at stating some of the predominant power disturbance parameters, their sources and causes, the effect they have on electrical equipment, and their cost/economic implications. It also identifies some practical solutions and methods of addressing poor power quality issues.
Most people take the electrical supply for granted and expect it to be available at the flick of a switch. However, some businesses like share dealing houses, hospitals and continuous process lines, are so reliant on electricity that they have to provide safeguards to ensure that an emergency supply is always available. Generally, in industry, power quality is very low on the list of priorities and so very little attention is given to it, until something goes wrong.
Much of the electrical equipment in an industrial facility requires high-quality electricity; it will not tolerate sags, swells, transients, or harmonics, and it certainly will not tolerate power outages, no matter how short-lived. Recognizing the limitations of grid-delivered power and the fact that 80 percent of all power quality and reliability problems occur inside end-user’s facilities, it behooves all maintenance and reliability managers to understand the power quality susceptibilities within their facilities and of their key equipment. The remaining part of the paper will analyze each type of power defect with an explanation of how the problems occur and suggested preventative measures that can be considered.
Even the best distribution systems are subject to changes in system voltage from time-to-time. Voltage changes can range from small voltage fluctuations of short duration to a complete outage for an extended period of time. The following industry terms can be used to describe given voltage conditions.
Voltage dip: A voltage dip is used to refer to short-term reduction in voltage of less than half a second.
Voltage sag: Voltage sag is used to relate long-term reduction in voltage.
Voltage swell: Voltage swell is an increase in voltage outside normal rated tolerance of an equipment.
Voltage ‘spikes’, ‘impulses‘ or ‘surges’: These are terms used to describe abrupt, very brief increases in voltage value
Voltage transients: They are temporary, undesirable voltages that appear on the power supply line. Transients are high over-voltage disturbances (up to 20KV) that last
for a very short time (milliseconds or nanoseconds). Hence, the term ‘spike’ can also be used.
Harmonics: The fundamental frequency of the AC electric power distribution system is 50 Hz. A harmonic frequency is any sinusoidal frequency, which is a multiple of the fundamental frequency. Harmonic frequencies can be even or odd multiples of the sinusoidal fundamental frequency.
The following sections will discuss the causes and symptoms of each power disturbance parameter and the methods of preventing/minimizing their effects on power equipment.
Voltage dips, sags and surges
Most electrical power generating authorities have an obligation to supply consumers from the grid at a constant voltage (typically within +/- 6% of nominal). However, sometimes this is not practical, particularly in rural locations. Sometimes voltage sags are caused by the power supplier during times of heavy demand, while dips are often caused by auto closers, operating within one second of fault detection. It is also possible for heavy plant to pull down the supply voltage during start-up. Compressors and pumps are good examples of loads, which require a high start-up current and switch in and out on a frequent basis, causing the supply voltage to dip. A dip is used to refer to a short term reduction of less than half a second, whilst sag relates to a long-term voltage reduction.
Causes of dips, sags and surges
Methods of dealing with dips, sags and surges
Symptoms of dips, sags and surges
Transients and spikes
Transients are high over-voltage disturbances (up to 20 kV) that last for a very short time (milliseconds or nanoseconds). Hence the term “spikes” can also be used. They are potentially destructive and can cause electronic systems to fail. In about 80% of cases transients can be attributed to on-site activities.
Causes of transients and spikes
Methods of preventing transients
Harmonic pollution
The vast majority of radiated emission problems are caused by voltages and currents with non-sinusoidal wave forms. Digital circuits and switch mode power supplies, in particular, generate almost square waveforms with fast rise times. The problem with a square waveform is that it really comprises a collection of sine waves at different frequencies, added together. The various frequencies are all multiples of the main or fundamental frequency and so there are first harmonics which have twice the fundamental frequency, second harmonics which have three times the fundamental frequency and so on (e.g. fundamental = 50Hz, 1st = 100Hz, 2nd = 150Hz). Wave forms which are perfectly symmetrical only have odd harmonics. Asymmetrical wave forms have both even and odd harmonics.
Harmonics are undesirable for many reasons but because effects of harmonics on the mains supply are cumulative, one the most serious problems is the overloading of supply cables.
Nowadays, computers, televisions, fluorescent tubes with electronic ballasts and inverter drives for motors have a switch mode power supply inside them. This produces a DC voltage and then chops it up again into high frequency square waves. Capacitors are used to store power and smooth the DC.
Consequently, current flows only for a short time when the capacitors require topping up and there is a resulting high peak current but with a low RMS current load. These peaks from different equipment on the supply are cumulative. With the proliferation of electronic equipment, particularly those listed above, this has caused the regulations on harmonic pollution to be tightened by the Electricity Supply Authorities. Without these restrictions it would have been necessary to replace the entire supply cable network.
The flow of current at low frequency, through a conductor, is equally distributed across its cross-sectional area. However at higher frequencies the current tends to concentrate towards the surface of the cable. This phenomenon is known as the “skin effect”. As a consequence the impedance of the conductor rises and this has the effect of Increasing the voltage drop and harmonic distortion. Long lines also mean higher impedance and so the voltage disturbances from inrush currents, when a large motor starts-up for instance become more significant. Switch mode power supplies and variable speed drives connected to end of a long cable run will also result in higher harmonic voltage distortion.
Take a 50Hz sine wave

Add some 3rd harmonic
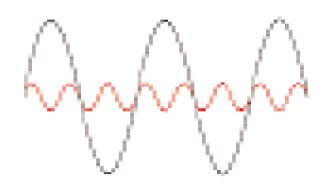
Add some 5th harmonic
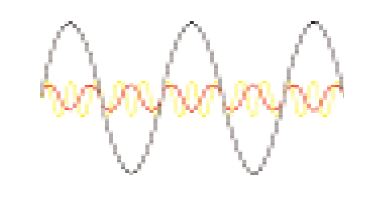
The result is a distorted sine wave (shown in green)

Causes of harmonic pollution
Methods of preventing harmonic pollution
Symptoms of harmonic pollution
Clearly, in a business environment, the equipment in use has to be resilient to the normal characteristic defects of the supply and this is not the case with off-the-shelf equipment. The cost of correction is much lower if corrective action is taken at the design stage of the equipment but this requires knowledge of the nature and probability of defects. It is this knowledge that is missing. This is, however, the most cost effective approach.
Some equipment makers are recognizing the problem but the competitive market means that manufacturers will only respond to customers’ requirements. Until customers understand the problems and realize that equipment suppliers can provide a solution, they will not specify improved performance. The exception is the variable speed drive market where manufacturers are actively promoting products with enhanced dip ride through.
Implications of poor power quality
Some of the implications of power quality especially related to power factor and harmonics are:
General benefits of power quality improvement
As already highlighted, the various power disturbance parameters can have very serious cost implications if not tackled. Equipment manufacturers are saddled with the responsibility to incorporate, from design stage, devices that could help minimize the effects of poor power quality. This could be expensive but in special cases where the need justifies the expense, it may be possible to arrange an alternative power source aside the grid where the various power disturbance parameters could be minimized.
[1] Siemens Technical Education Program (STEP) 2000 series, 2000, “Power monitoring and management with ACCESS”, USA
[2] REO UK LTD, “REO Power quality guide”, 2-18
[3] Wikipedia encyclopaedia, 2008, “Power Quality”, “http://en.wikipedia.org/wiki/Power_quality”
[4] Malcom Barnes, 2003, “Practical Variable Speed Drives and Power Electronics”, Newnes Publishing, Oxford, England, 114-138
[5] Dr. R. Venkatesh, “Economic framework of power quality”, 1 – 9
[6] David Chapman, March 2001, “Power quality application guide; voltage dips”, Copper development Association, United Kingdom, 1 – 6
Published by S.Khalid, Email: saifonline@rediffmail.com, & Dr. Bharti Dwivedi, Email: bharti_dwivedi@yahoo.com, Department of Electrical Engineering, I.E.T., Lucknow, India.
International Journal of Advances in Engineering & Technology, May 2011. ©IJAET ISSN: 2231-1963
Latest innovative ideas to make the life easier using the technology depends upon the application of power electronics in turn about power quality. With increasing quantities of non-linear loads being added to electrical systems, it has become necessary to establish criteria for limiting problems from system voltage degradation. This paper presents the power quality problems, issues, related international standard, effect of power quality problem in different apparatuses and methods for its correction, which is actually a technology management. This is important for design engineers and researchers in power quality to know the international standards used for power quality.
Keywords: IEEE 519, Power quality, Voltage Sag, THD.
The paper and the technology on which it is grounded are largely motivated by the power quality issues. The term power quality is rather general concept. Broadly, it may be defined as provision of voltages and system design so that user of electric power can utilized electric energy from the distribution system successfully, without interference on interruption.
Power quality is defined in the IEEE 100 Authoritative Dictionary of IEEE Standard Terms as The concept of powering and grounding electronic equipment in a manner that is suitable to the operation of that equipment and compatible with the premise wiring system and other connected equipment Utilities may want to define power quality as reliability [8]. From the Power Quality market or industry perspective, it is any product or service that is supplied to users or utilities to measure, treat, remedy, educate engineers or prevent Power Quality issues, problems and related items [6,8,12,13,15,23,28].
This paper critically discusses about the power quality problems, issues and related standards, assessment of power quality issues and methods for its correction with giving a thorough knowledge of harmonics, power quality indices, parameters effecting electric power etc.
II. POWER QUALITY PROBLEMS & ISSUES
A recent survey of Power Quality experts indicates that 50% of all Power Quality problems are related to grounding, ground bonds, and neutral to ground voltages, ground loops, ground current or other ground associated issues. Electrically operated or connected equipment is affected by Power Quality [9, 10, 11, 12, 15, and 16].
Determining the exact problems requires sophisticated electronic test equipment. The following symptoms are indicators of Power Quality problems:
The commonly used terms those describe the parameters of electrical power that describe or measure power quality are Voltage sags, Voltage variations, Interruptions Swells, Brownouts, Blackouts, Voltage imbalance, Distortion, Harmonics, Harmonic resonance, Interharmonics, Notching, Noise, Impulse, Spikes (Voltage), Ground noise, Common mode noise, Critical load, Crest factor, Electromagnetic compatibility, Dropout, Fault, Flicker, Ground, Raw power, Clean ground, Ground loops, Voltage fluctuations, Transient, Dirty power, Momentary interruption, Over voltage, Under voltage, Nonlinear load, THD, Triplens, Voltage dip, Voltage regulation, Blink, Oscillatory transient etc [4,6,14,18,19]. The issue of electric power quality is gaining importance because of several reasons:
Power quality is a worldwide issue, and keeping related standards current is a never-ending task. It typically takes years to push changes through the process.
Most of the ongoing work by the IEEE in harmonic standards development has shifted to modifying Standard 519-1992.
IEEE 519-1992, Recommended Practices and Requirements for Harmonic Control in Electric Power Systems, established limits on harmonic currents and voltages at the point of common coupling (PCC), or point of metering [1,18].
The limits of IEEE 519 are intended to:
1) Assure that the electric utility can deliver relatively clean power to all of its customers;
2) Assure that the electric utility can protect its electrical equipment from overheating, loss of life from excessive harmonic currents, and excessive voltage stress due to excessive harmonic voltage. Each point from IEEE 519 lists the limits for harmonic distortion at the point of common coupling (PCC) or metering point with the utility. The voltage distortion limits are 3% for individual harmonics and 5% THD.
All of the harmonic limits in IEEE 519 are based on a customer load mix and location on the power system. The limits are not applied to particular equipment, although, with a high amount of nonlinear loads, it is likely that some harmonic suppression may be necessary.
a. IEEE 519 Standard for Current Harmonics
Below current distortion limits are for odd harmonics. Even harmonics are limited to 25% of the odd harmonic limits [1,3,5]. For all power generation equipment, distortion limits are those with ISC/IL<20. ISC is the maximum short circuit current at the point of coupling “PCC”. IL is the maximum fundamental frequency 15-or 30- minutes load current at PCC.
TDD is the Total Demand Distortion (=THD normalized by IL)
The current harmonic distortion limits apply to limits of harmonics that loads should draw from the utility at the PCC. Note that the harmonic limits differ based on the ISC/IL rating, where ISC is the maximum short-circuit current at the PCC, and I is the maximum demand load current at the PCC.
TABLE 1: Current Distortion Limits For Harmonics
| ISC/IL | h<11 | 11≤h <17 | 17≤h<23 | 23≤h<25 | h≥35 | TDD (%) |
|---|---|---|---|---|---|---|
| <50 | 2.0 | 1.0 | 0.75 | 0.3 | 0.15 | 2.5 |
| ≥50 | 3.0 | 1.5 | 1.15 | 0.45 | 0.22 | 3.75 |
TABLE 2: Current Distortion Limits For Harmonics
| ISC/IL | h<11 | 11≤h <17 | 17≤h<23 | 23≤h<25 | TDD (%) |
|---|---|---|---|---|---|
| <20 | 4.0 | 2.0 | 1.5 | 0.6 | 5 |
| 20-50 | 7.0 | 3.5 | 2.5 | 1.0 | 8 |
| 50-100 | 10 | 4.5 | 4.0 | 1.5 | 12 |
| 100-1000 | 12 | 5.5 | 5.0 | 2.0 | 15 |
| >1000 | 15 | 7.0 | 6.0 | 2.5 | 20 |
b. IEEE Standard For Voltage Harmonics
The voltage harmonic distortion limits apply to the quality of the power. For instance, for systems of less than 69 kV, IEEE 519 requires limits of 3 percent harmonic distortion for an individual frequency component and 5 percent for total harmonic distortion.
TABLE 3 : Voltage Distortion Limits For Harmonics.
| Bus voltage | Individual Vb(%) | THDV(%) |
|---|---|---|
| V <69 kV | 3.0 | 5.0 |
| 69≤V<161 kV | 1.5 | 2.5 |
| V≥161 kV | 1.0 | 1.5 |
a. IEC 61000-3-2 (1995-03)
It specifies limits for harmonic current emissions applicable to electrical and electronic equipment having an input current up to and including 16 A per phase, and intended to be connected to public low-voltage distribution systems. The tests according to this standard are type tests [2,10,15].
b. IEC/TS 61000-3-4 (1998-10)
It specifies to electrical and electronic equipment with a rated input current exceeding 16 A per phase and intended to be connected to public low-voltage ac distribution systems of the following types:
These recommendations specify the information required to enable a supply authority to assess equipment regarding harmonic disturbance and to decide whether or not the equipment is acceptable for connection with regard to the harmonic distortion aspect. The European standards, IEC 61000-3-2 & 61000-3-4, placing current harmonic limits on equipment, are designed to protect the small consumer’s equipment. The former is restricted to 16 A; the latter extends the range above 16 A.
A thorough analysis of basic electrical-system considerations is presented. Guidance is provided in design, construction, and continuity of an overall system to achieve safety of life and preservation of property; reliability; simplicity of operation; voltage regulation in the utilization of equipment within the tolerance limits under all load conditions; care and maintenance; and flexibility to permit development and expansion.
This standard presents a thorough investigation of the problems of grounding and the methods for solving these problems. There is a separate chapter for grounding sensitive equipment [3, 6].
This standard is recommended engineering practices for the selection and application of emergency and standby power systems. It provides facility designers, operators and owners with guidelines for assuring uninterrupted power, virtually free of frequency excursions and voltage dips, surges, and transients [6].
The fundamentals of reliability analysis as it applies to the planning and design of industrial and commercial electric power distribution systems are presented. Included are basic concepts of reliability analysis by probability methods, fundamentals of power system reliability evaluation, economic evaluation of reliability, cost of power outage data, equipment reliability data, and examples of reliability analysis. Emergency and standby power, electrical preventive maintenance, and evaluating and improving reliability of the existing plant are also addressed [4,6,7,8,11].
Recommended design, installation, and maintenance practices for electrical power and grounding (including both power-related and signal-related noise control) of sensitive electronic processing equipment used in commercial and industrial applications [6,8]
As its title suggests, this standard covers recommended methods of measuring power-quality events. Many different types of power-quality measurement devices exist and it is important for workers in different areas of power distribution, transmission, and processing to use the same language and measurement techniques.
Monitoring of electric power quality of AC power systems, definitions of power quality terminology, impact of poor power quality on utility and customer equipment, and the measurement of electromagnetic phenomena are covered [5,8,12,13,14].
Computers, computer-like products, and equipment using solid-state power conversion have created entirely new areas of power quality considerations. There is an increasing awareness that much of this new user equipment is not designed to withstand the surges, faults, and reclosing duty present on typical distributions systems. Momentary voltage disturbances occurring in ac power distribution and utilization systems, their potential effects on this new, sensitive, user equipment, and guidance toward mitigation of these effects are described. Harmonic distortion limits are also discussed [6,19,36].
A standard methodology for the technical and financial analysis of voltage sag compatibility between process equipment and electric power systems is recommended. The methodology presented is intended to be used as a planning tool to quantify the voltage sag environment and process sensitivity.
The distribution voltage quality standard i.e. IEEE Standard P1564 gives the recommended indices and procedures for characterizing voltage sag performance and comparing performance across different systems.
A new IEC Standard 61000-2-8 titled “Environment —Voltage Dips and Short Interruptions” has come recently. This standards warrants considerable discussion within the IEEE to avoid conflicting methods of characterizing system performance in different parts of the world [2].
Developments in voltage flicker standards demonstrate how the industry can successfully coordinate IEEE and IEC activities. IEC Standard 61000-4-15 defines the measurement procedure and monitor requirements for characterizing flicker. The IEEE flicker task force working on Standard P1453 is set to adopt the IEC standard as its own [2].
IEEE Standard P1409 is currently developing an application guide for custom power technologies to provide enhanced power quality on the distribution system. This is an important area for many utilities that may want to offer enhanced power quality services [4,5, 6,7].
The new IEEE Standard P1547 provides guidelines for interconnecting distributed generation with the power system [5, 6,11].
The first sign of a power-quality problem is a distortion in the voltage waveform of the power source from a sine wave, or in the amplitude from an established reference level, or a complete interruption. The disturbance can be caused by harmonics in the current or by events in the main voltage supply system. The disturbance can go for a fraction of a cycle (milliseconds) to great durations (seconds to hours) in the voltage supplied by the source. The aim for method for correction is to make the power source meet an international standard. Power quality problems can basically start at four levels of the system that delivers electric power, first one, includes Power plants and the entire area transmission system. The second one are Transmission lines, major substations where as third one includes distribution substations, primary, and secondary power lines, and distribution transformers and last and fourth one includes service equipment and building wiring.
In addition, the problems can be caused by the equipment supplied with electric power—for example, power-electronic converters. Redundancy at all levels of the electric-power system reduces the incidence and duration of line-voltage disturbances [9, 11, 12, 14, 16, 17, 22, 23].
Some of the equipment affected by power-quality problems are discussed under the following heads:
a. Aircraft electrical System
b. Personal computers
c. Controllers
d. Adjustable speed drives
e. Contactors and Relays
a. Aircraft Electrical System
Aircraft requires reliable, redundant, and uninterruptible electrical power systems to supply flight critical fly-by-wire loads and mission critical loads. But switched loads and other transient conditions effect the electrical bus power quality.
One problem is the presence of rectifiers supplying such loads as electrically powered flight control actuators, other speed controlled motor loads, or avionics loads, see Figure 1.
The other problem is a load which changes load level most often. An electrical flight control actuator supplied with dc would cause transient loading on the dc bus, and affect power quality. A fuel transfer pump, electrically driven compressor, or other non-continuous ac load would cause applied-load transients on the ac bus.

Figure 1: Different type of loads used in Aircraft [37]
Another problem may occur when a source fails and the loads are switched from one bus to another. This type of transient occurs infrequently and would produce an actual power interruption. Many connected devices such as induction motors, could through such a power interruption, even if two buses were not synchronized [31].
b. Personal Computers
A personal computer is a device designed to be operated by one person at a time for computing and many general purposes. The malfunction of PCs incorporated in a real-time system because of voltage disturbances effects more badly than the malfunction of the PC used offline. The modes of personal computer malfunction under line voltage sag occur as the DC filter capacitor voltage of the power supply doesn’t go with time. The software problems creates the problems which include; Lockup, interruption,(blue screen), Blocking of the operating system, No response to any command from the keyboard (freeze screen), Hardware misoperation can be identified by automatic restarting of the system, or a permanent black screen, making a manual restart necessary [24,27,32,33,58].

Figure 2: Harmonic Model of a Typical PC load
c. Controllers
A controller is defined as a device which controls, the electric power delivered to the connected apparatus. Controllers can operate in three means electrical, hydraulic, and mechanical e.g. speed regulator of a motor-drive system, voltage regulator, the temperature controller of an industrial furnace. When line-voltage sag happened, a controller will be unable to recover if the sensitivity of the relays is less than the percent sag or the logic circuits supplied from the internal switch-mode power supply [12, 15, 16, 26, 34].
d. ASDs
Induction motors (and in ASDs) represent a huge part of the three-phase electrical load in commercial and industrial facilities. They are affected by line voltage sags and interruptions [20, 25, 28, 29, 30, 35, 36, 44].
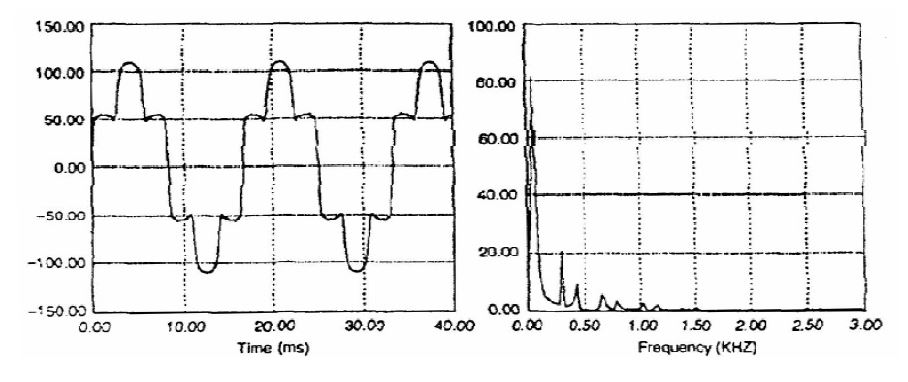
Figure 3: Input current and harmonic spectrum of a Typical ASD
e. AC Contactors and relays
Contactors and relays are made for all operation in a different range of coil voltage and contact ratings. Now a days, most of the places, the contactor function has been displaced by power-electronics devices such as GTOs, IGBTs. Whereas the control relay functions have been displaced by PLCs using digital logic. Whether electromagnetic or solid state, the devices are impacted by line-voltage sags and interruptions.
The device, the relay, or the contactor can be subjected to voltage sag, to a voltage interruption, or both [34, 35, 36,65].
Correction methods include the following:
We know that Engine-generator (E/G) sets Deviations in source voltage and current for critical load equipment and must be corrected to insure reliable operation of the equipment [12,14,15,16,17,18,27,28,29,34].
Different international standards, define corrected values. Methods of correction has been discussed above, if consider can be helpful in today’s innovative technology management.
We have discussed about the Power quality problems, issues, related power quality standards and the Effect of power quality problems in equipment’s. For which correction methods have been discussed. As a result, we can correct the problem and thereafter judge it by ensuring the results within internationals standards limits.
The following recommended standards for equipment is developed to help preserve voltage integrity by limiting harmonic current injection of single-phase loads which are likely to appear in increasing numbers in power distribution systems. By addressing harmonic current distortion at the individual sources, system problems may be avoided. The harmonic current limits established in the standards are proposed with the intent of minimizing the impact on existing equipment design
This paper presented an innovative technology management by critical analyzing about power quality problems, issues, related international standards, and their effect in life and the corrective measures using different means.. The corrective measures are also discussed which can be remedy for power quality problems generated in different equipment’s. Coordination with existing industry practices and international harmonic standards is also considered in this paper. This paper will help research workers, users and suppliers of electrical power to gain a guideline about the power quality.
[1] IEEE, “IEEE Recommended Practices and Requirements for Harmonic Control in Electrical Power Systems,” IEEE Std. 519-1992, revision of IEEE Std. 519-1981.
[2] IEC, “Electromagnetic Compatibility, Part 3: Limits- Sect.2: Limits for Harmonic Current Emission,” IEC
1000-3-2, 1st ed., 1995.
[3] V. K. Dhar, “Conducted EMI Analysis—A Case Study,” Proceedings of the International Conference on
Electromagnetic Interference and Compatibility ‘99, December 6–8, 1999, pp. 181–186.
[4] IEEE, “IEEE Guide for Service to Equipment Sensitive to Momentary Voltage Disturbances,” IEEE Std.
1250–1995.
[5] IEEE, “IEEE Recommended Practice for Evaluating Electric Power System Compatibility with Electronic
Process Equipment,” IEEE Std. 1346-1998.
[6] IEEE Std 446-1987, “IEEE Recommended Practice for Emergency and Standby Power Systems for Industrial and Commercial Applications,” (IEEE Orange Book).
[7] IEEE Std 1250-1995, “IEEE Guide for Service to Equipment Sensitive to Momentary Voltage Disturbances,” Art 5.1.1, Computers.
[8] IEEE 100, The Authoritative Dictionary of IEEE Standard Terms, seventh edition, 2000, p. 234.
[9] Bhim Singh, Kamal Al-Haddad, Ambrish Chandra, A review of active filters for power quality improvement, IEEE Trans. on industrial electronics, Vol.46, No. 5, pp. 960-971, October 1999.
[10] Mohan, Underland and Robbins, Power Electronics, John Wiley and Sons, 1995.
[11] American National Standards Institute, “American National Standard Voltage Ratings (60Hz) for Electric Power Systems and Equipment,” ANSI Std. C84.1-1989.
[12] R. C. Dugan, M. F. McGranaghan, S. Santosa, and H. W. Beaty, Electrical Power Systems Quality, 2nd edition, McGraw-Hill, 2002.
[13] Blajszczak, G. Antos, P, “Power Quality Park – Idea and feasibility study,” Proc. Of Electric Power Quality and Supply Reliability Conference (PQ), 16-18 June, pp 17 – 22, 2010.
[14] S.Khalid, B.Dwivedi, “A Review of State of Art Techniques in Active Power Filters and Reactive Power
Compensation,” National Journal of Technology, No 1, Vol. 3, pp.10-18, Mar. 2007.
[15] Alexander Kusko, Marc T. Thompson, “Power Quality in Electrical Systems, McGraw-Hill, New York, 2007.
[16] S.Khalid, B.Dwivedi, “Comparative Critical Analysis of Advanced Controllers used for Active Power Filter,” National Conference on Power Electronics and Renewable Energy Systems, PEARES, Kalavakkam, 2009.
[17] An Luo, Wei Zhao, Xia Deng, Shen, Z.J, Jian-Chun Peng, “ Dividing Frequency Control of Hybrid Active Power Filter With Multi-Injection Branches Using Improved Algorithm,” IEEE Transactions on Power Electronics, Vol. 24, No. 10, pp 2396 – 2405, Oct. 2009.
[18] J. G. Boudrias, “Harmonic Mitigation, Power Factor Connection, and Energy Saving with Proper
Transformers and Phase Shifting Techniques,” Proc. Of Power Quality Conference, ‘04, Chicago, IL.
[19] Key and J.S.Lai, “Analysis of Harmonic Mitigation Methods for Building Wiring Systems,” IEEE Trans. on Power Systems, PE-086-PWRS-2-06-1997, pp. 1-9, July 1997.
[20] P. W. Hammod, “A New Approach to Enhance Power Quality for Medium Voltage AC Drives,” IEEE Trans. on Ind. Appli, Vol. 33, No. 1, pp. 202-208, 1997.
[21] S. Buso, L. Malesani, P.Mattabeli and R. Veronese, “Design and Full Digital Control of Parallel Active Filters for Thyristor Rectifiers to Comply with IEC-1000-3-2 Standards,” IEEE Trans. on Ind. Appli, Vol. 34, No. 3, pp. 508-517, 1998.
[22] T. Key and J.S.Lai, “Comparison of Standards Limiting Harmonic Distortion in Power Systems,” IEEE Trans. on Ind. Appli, Vol. 29, No. 4, pp. 688-695, 1993.
[23] G. Lee, M. Albu, and G. Heydt, “A Power Quality Index Based on Equipment Sensitivity, Cost, and Network Vulnerability,” IEEE Transactions on Power Delivery, Vol 19, no 3, pp. 1504–1510, July 2004.
[24] S. Djokic, G. Vanalme, J. V. Milanovic, and K. Stockman, “Sensitivity of Personal Computers to Voltage Sags and Short Interruptions,” IEEE Transactions on Power Delivery, vol. 20, no. 1, pp. 375–383, January 2005.
[25] A. T. de Almedia, F.J.T.E. Ferreira, and D. Both, “Technical and Economical Considerations in the
Application of Variable-Speed Drives with Electric Motor Systems,” IEEE Transactions on Industry
Applications, vol. 41, no. 1, pp. 188–199, Jan./Feb.2005.
[26] M. Andressen, “Real Time Disturbance Analysis and Notification,” Proc. of Power Quality Conference ‘04, Chicago, IL.
[27] R. J. Yester, “New Approach to High Availability Computer Power System Design,” EC&M, pp. 18–24, January 2006.
[28] J. W. Gray and F. J. Haydock, “Industrial Power Quality Considerations When Installing Adjustable Speed Drive Systems,” IEEE Trans. on Ind. Appl., vol. 32, no. 3, pp. 646–652, May/June 1986.
[29] L. Manz, “Applying Adjustable-Speed Drives to Three-Phase Induction NEMA Frame Motors,” IEEE Trans. on Ind. Appl., vol. 33, no. 2, March/April 1997.
[30] Jouanne, P. N. Enjeti, and B. Banerjee, “Assessment of Ride-Through Alternatives for Adjustable Speed Drives,” IEEE Trans. on Ind. Appl., vol. 35, no. 4, pp. 908–916, July/August 1999.
[31] Woods, E.J. , “Aircraft electrical systems – coping with harmonics for changing power demands,” Proc. of the Energy Conversion Engineering Conference, IECEC-90,12-17 Aug, pp 84 – 89,1990.
[32] M. E. Barab, Craven, “Effects of Power Disturbances on Computer Systems,” IEEE Trans. on Power Del., vol. 14, no. 4, pp. 1309–1315, October 1998.
[33] D. O. Koval and C. Carter, “Power Quality Characteristics of Computer Loads,” IEEE Trans on Ind. Appl., vol. 33, no. 3, pp. 613–621, May/June 1997.
[34] S. Z. Djokic, J. V. Milanovic, and D. S. Kischen, “Sensitivity of AC Coil Contactors to Voltage Sags, Short Interruptions, and Undervoltage Transients,” IEEE Trans. on Power Delivery, vol. 19, no. 3, pp. 1299–1307, July 2004.
[35] J. C. Gomez, M. M. Morcos, C. A. Reineri, and G. N. Campetelli, “Behavior of Induction Motor Due to Voltage Sags and Short Interruptions,” IEEE Trans. on Power Delivery, vol. 17, no. 2, pp. 434–440, April 2002.
[36] Molder, H.,Vinnal, T., Beldjajev, V., “Harmonic losses in induction motors caused by voltage waveform distortions,” Electric Power Quality and Supply Reliability Conference (PQ), 16-18 June, pp 143 – 150 ,2010.
[37] MATLAB/Simulink, R2009b, the Mathsworks Inc., USA.
[38] C. E. Lin, T. C. Chen, and C. L. Huang, “A real time calculation method for optimal reactive power
compensator,” IEEE Trans. Power Syst., vol. 4, pp. 643-652, May 1989.
[39] L. S. Czarnecki, “Reactive, unbalanced current compensation in three phase asymmetrical circuits under nonsinusoidal conditions,” IEEE Trans. Instrum. Meas., vol. 38, pp. 754-759, June 1989.
[40] L. T. Moran, P. D. Ziogas, and G. Joos, “Analysis, design of a three-phase synchronous solid-state var compensator,” IEEE Trans. Ind. Applicat, vol. 25, pp. 598-608, July/Aug. 1989.
[41] Y. Baghzouz and M. D. Cox, “Optimal shunt compensation for unbalanced linear loads with nonsinusoidal supply voltages,” Elect. Mach. Power Syst, vol. 19, pp. 171-183, Oct. 1991.
[42] Freund, “Double the Neutral and Derate the Transformer or Else”, Electrical Construction and Maintenance, December 1988.
[43] R. Zavadil, et al, “Analysis of Harmonic Distortion Levels in Commercial Buildings,” Proceedings, First International Conference on Power Quality, PQA 1991.
[44] D. E. Rice, “Adjustable Speed Drive and Power Rectifier Harmonics – their Effect on Power Systems Components,” IEEE Trans. On Ind. Appl., Vol. IA-22, No. 1, Jan./Feb. 1986, pp. 161-177.
[45] A. Mansoor, “Predicting the Net Harmonic Currents produced by large numbers of Distributed Single-Phase Computer Loads.” Conference Record IEEE PES Winter Power Conference, Jan. 1995.
[46] T. Key & J-S. Lai, “Costs and Benefits of Harmonic Current Reduction for Switch-Mode Power Supplies in Commercial Office Buildings.” A paper preprint from IEEE IAS Annual Meeting, October 1995.
[47] G. Joos, L. Moran, and P. Ziogas, “Performance analysis of a PWM inverter VAR compensator,” IEEE Trans. Power Electron., vol. 6, pp. 380-391, July 1991.
[48] J. Kearly, A. Y. Chikhani, R. Hackam, M. M. A. Salama, and V. H. Quintana, “Microprocessor controlled
reactive power compensator for loss reduction in radial distribution feeders,” IEEE Trans. Power Delivery, vol. 6, pp. 1848-1855, Oct. 1991.
[49] H. A. Kojori, S. B. Dewan, and J. D. Lavers, “A large-scale PWM solid-state synchronous condenser,” IEEE Trans. Ind. Applicat., vol. 28, pp. 41-49, Jan./Feb. 1992.
[50] C. Schauder and H. Mehta, “Vector analysis, control of advanced static VAR compensators,” Proc. Inst. Elect. Eng., vol. 140, pt. C, no. 4, pp. 299-306, July 1993.
[51] J. Machowski and D. Nelles, “Simple robust adaptive control of static VAR compensator,” Eur. Trans. Elect. Power Eng., vol. 3, no. 6, pp. 429-435, Nov./Dec. 1993.
[52] Y. Tang and L. Xu, “A new converter topology for advanced static VAR compensation in high power
applications,” in Conf. Rec. IEEE-IAS Annu. Meeting, 1993, pp. 947-953.
[53] C. A. Gross and R. S. Sell, “Near-optimum capacitor allocation on distribution feeder for voltage control,” Elect. Mach. Power Syst, vol. 22, no. 4, pp. 311-315, 1994.
[54] F. Z. Peng and J. S. Lai, “A static VAR generator using a staircase waveform multilevel voltage-source converter,” in Proc. Power Quality Conf., 1994, pp. 58-66.
[55] A. Kern and G. Schroder, “A novel approach to power factor control, balancing problems,” in Proc. IEEE IECON’94, 1994, pp. 428-433.
[56] J. B. Ekanayake and N. Jenkins, “A three-level advanced static VAR compensator,” IEEE Trans. Power
Delivery, vol. 11, pp. 540-545, Jan. 1996.
[57] Y. Yoshioka, S. Konishi, N. Eguchi, and K. Hino, “Self-commutated static flicker compensator for arc
furnaces,” in Proc. IEEE APEC ’96, 1996, pp. 891-897.
[58] L. S. Czarnecki, “Power-factor improvement of three-phase unbalanced loads with nonsinusoidal supply voltage,” Eur. Trans. Elect. Power Eng., vol. 3, no. 1, pp. 67-74, Jan./Feb. 1993.
[59] K. Mikolajuk and A. Tobola, “A new method for reduction of current, voltage harmonic distortion in power systems,” Eur. Trans. Elect. Power Eng., vol. 3, no. 1, pp. 85-89, Jan./Feb. 1993.
[60] D. Lauria and E. Tironi, “Some considerations on active compensation devices,” Eur. Trans. Elect. Power Eng., vol. 3, no. 3, pp. 235-240, May/June 1993.
[61] T. N. Le, “Flicker reduction performance of static VAR compensators with arc furnaces,” in Conf. Rec. 2ndEPE Conf, 1987, pp. 1259-1263.
[62] L. Moran, P. Ziogas, and G. Joos, “Analysis, design of a 3-phase current source solid-state VAR compensator,” in Proc. IEEEPESC ’87, 1987, pp. 463-472.
[63] L. Gyugyi, “Power electronics in electric utilities: Static VAR compensators,”Proc. IEEE, vol. 76, pp. 483-494, Apr. 1988.
[64] C. W. Edwards, K. E. Mattern, E. J. Stacey, P. R. Nannery, and J. Gubernick, employing GTO thyristors,” IEEE T
[65] G. G. Richards, P. Klinkhachorn, O. T. Tan, and R. K. Hartana, “Optimal with uncertain nonsinusoidal source, load characteristics,” IEEE Trans. Power Syst., vol. 4 1989.

Saifullah Khalid is a Ph.D. student in Power Electronics from I.E.T., Lucknow (U.P. Technical University). He is a Member of International Association of Engineers (IAENG), Hong Kong. Presently he is working in the field of Power Quality, Power Electronics, and intelligent system application in Active power filter.

Dr. Bharti Dwivedi is professor & head in the Electrical Engineering Department of the Institute of Engineering and Technology, Sitapur Road, Lucknow, U.P., India. Her area of interest includes ANN, Power Quality Improvement.
Vol. 1,Issue 2,pp.1-11
Published by
Electrotek Concepts, Inc., 409 North Cedar Bluff Road, Suite 500, Knoxville, Tennessee 37923-3605, United States
Electric Power Research Institute, 3412 Hillview Avenue, Palo Alto, California 94304-1395, United States
The Distribution System Power Quality Project conducted by the Electric Power Research Institute (EPRI) consisted of monitoring power quality at nearly 300 sites on the primary distribution feeders of twenty-four utility systems throughout the United States. The data collection stage of the survey began on Jun-01-1993, and continued until Sep-01-1995. As the sites selected for monitoring represented a diverse sampling of feeder types, geographic locations, protection schemes, and voltage ratings, the project’s results are important at a national level. This paper will examine some of the project’s important final results while focusing on two important areas: rms voltage variations and harmonic distortion. The paper will also examine two other EPRI projects: the Power Quality Diagnostic System (PQDS) and the EPRI Reliability Benchmarking Methodology Project. The PQDS Measurement Module – PQView – is the software package used to produce the final results of the EPRI DPQ Project. The EPRI Reliability Benchmarking Methodology is a comprehensive effort designed to develop methodologies and software tools for benchmarking utility reliability. All three projects together form EPRI’s solutions to power quality monitoring needs.
Sags, swells, and momentary interruptions are not new phenomena; they have been characteristics of electric power systems for over a hundred years. Voltage sags, or dips, were not considered a significant problem decades ago because the loads connected to electric distribution systems were generally immune to their effects. For this reason, electric utilities did not need to maintain statistics which described power quality levels which could be used to determine what would be considered normal or abnormal. However, with the world-wide proliferation of advanced but sensitive power electronic equipment and the increasing integration of microcomputers in process control and automation, these same power system characteristics considered relatively unimportant before can now be very expensive in terms of process shut-downs and equipment malfunctions.
Some utilities are beginning to address this concern by taking a systems approach to solving power quality problems. They realize that in some cases significant savings are possible by providing higher levels of power quality, rather than having customers purchase distributed power conditioning systems (for example, UPS systems) with low efficiency and power quality problems of their own. In order to remain competitive in an ever-changing utility environment, these utilities are therefore beginning to explore premium power services as a means of keeping their most important customers. However, before they can implement these services, they must first determine existing power quality levels. They must first ask, “What is the baseline?” Premium power cannot be offered to customers without first answering this critical question. This is the role of wide-scale power quality monitoring projects. By collecting the statistics for power quality phenomena which have been largely ignored for decades, we provide the means to begin our redefinition of electric power reliability.
In order to better understand the statistics of power quality the Electric Power Research Institute (EPRI) of the United States conducted a power quality monitoring survey of 277 monitoring locations located on the primary distribution feeder of 24 electric utilities across the U.S. (Figure 1a). Commonly known as the EPRI Distribution System Power Quality Monitoring Project, or the EPRI DPQ Project, EPRI and its contractor Electrotek Concepts performed the study from June 1993 to September 1995. It resulted in the collection of over 6.7 million measurements which are stored in a 30-gigabyte database.
During the initial stage of the project, we designed a new monitoring device: the BMI 8010 PQNode, depicted in Figure 1b. This instrument permits simultaneous monitoring of steady-state quantities (e.g., rms voltage and current, harmonic distortion levels, power factor) and triggered disturbances (voltage sags, interruptions, transients, and impulses).
While the results of the project only provide statistically valid information about power quality on the distribution systems of the host utility population, it was essential for us to ensure that sufficient variation existed in the study population of utilities to yield useful results for distribution systems nationally. The accomplishment of these objectives required that all locations on the distribution systems of the host utilities, which were determined to offer the needed diversity, had a chance of being selected for study. The objectives also required that we could calculate selection probabilities at each stage to be used when weighting data for composite analysis. The reference given in (4) treats an in-depth description of the multistage process used to select the sites for monitoring. Reference (2) offers examples demonstrating the methods for using selection probabilities to weight measurements.
The chief goal of the project was to provide baseline statistics regarding quantities that fall under the general category of power quality:
• Voltage Disturbances: rms voltage variations, transient overvoltages
• Steady-State Characteristics: harmonic distortion, steady-state regulation
The project included the participation of 24 host utilities across the continental U.S., which provided geographical and operating-practice diversity. The result of the site selection process was a set of 100 distribution feeders in the voltage range of 4 to 33 kV. It was decided to arbitrarily place one monitor on the line side of every substation to create a subset of monitoring locations which could be identified as being distribution substations only. To still provide a level of randomness, two more monitors were placed downline of the substation on the feeder itself. This identified a total of 300 monitoring sites. We ultimately installed monitors at 277 sites on 95 feeders within the service territories of the utilities geographically illustrated in Figure 1a. The sites which were not installed generally were victims of individual utility budget cutbacks. However, the project’s statistician did not consider the missing sites to be of great concern.
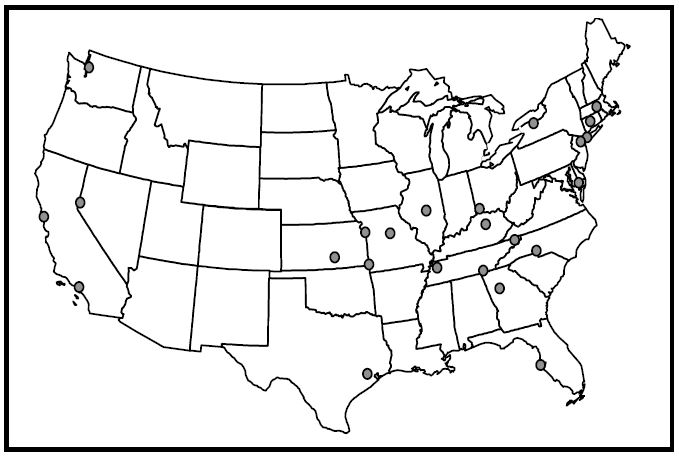
Figure 1a: Location of the 24 EPRI DPQ Project Host Utilities
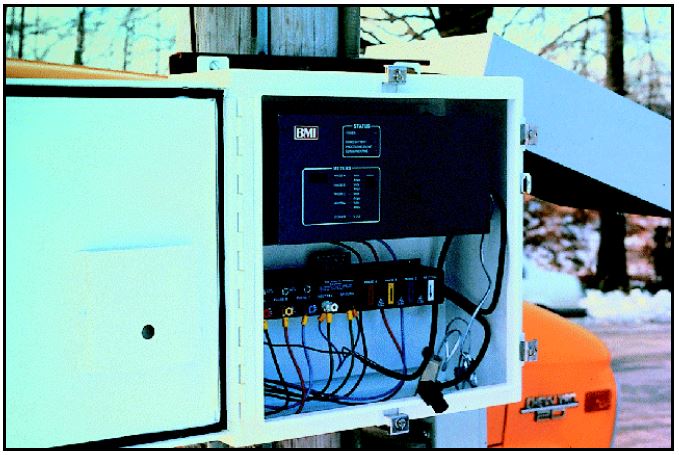
Figure 1b: Photograph of a BMI 8010 PQNode mounted on a distribution feeder pole within a NEMA 4 enclosure
With any discussion of rms voltage variation analysis, a frequently asked question is “What do you define to be an event?” The question is important because the total count of “events” would be very different if three-phase measurements were counted as three single-phase measurements. The approach we developed for our monitoring project was to collect small elemental components of measurements (i.e., measurement components) and aggregate them at analysis time. The verb “aggregate” literally refers to the collection of units or parts into a mass or whole. Power quality data aggregation refers to the data reduction technique of collecting many distinct measurement components into a single aggregate “event” for the purpose of computing system performance indices. How we combine the measurements depends on the specific needs of a particular analysis session. We have found that at different times it may be necessary to either break apart measurements into measurement components, or to combine them through aggregation. Figure 2 furnishes the hierarchy of rms variation measurement levels. A wider application of the hierarchy to more than just rms variations seems justifiable.
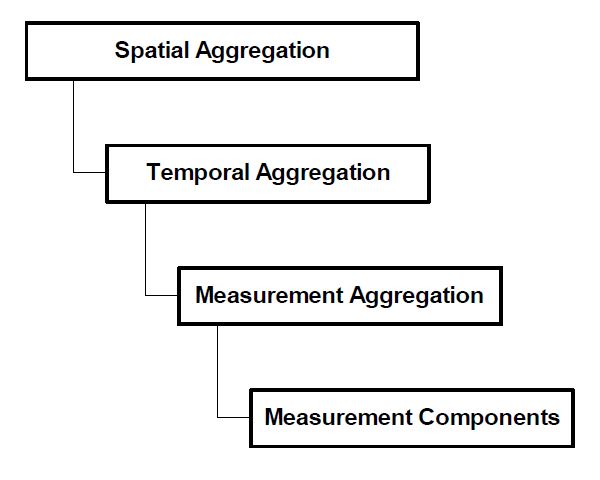
Figure 2: Hierarchy of Power Quality Aggregation Levels
Figure 3b illustrates the project’s sag and interruption magnitude rate, using one-minute temporal aggregation, for the events recorded during a two year period (Jun-1-1993 to Jun-1-1995). The results include the application of sampling weights and represent all project monitoring sites. From Figure 3b we can say that the average site in our project experienced 1.18 incidents in which the minimum voltage during a 60-second window was between 85% and 90% of the site’s base voltage, as well as 0.38 interruption incidents (less than 10% voltage). The only events which were excluded from this plot were those in which the duration below 0.90 per unit was longer than 60 seconds.
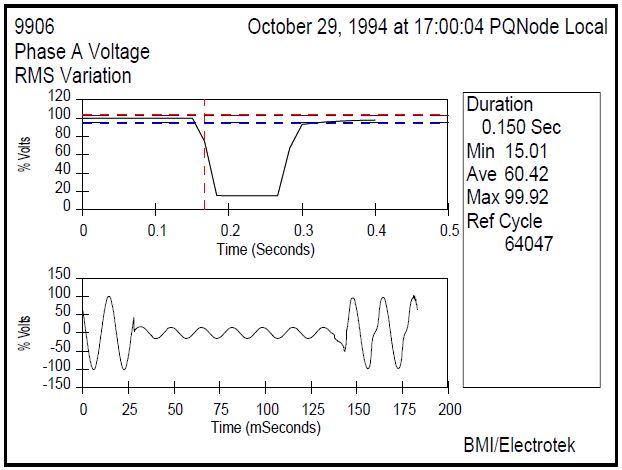
Figure 3a: Example of an rms voltage variation with a minimum voltage magnitude of 0.15 per unit and a duration of 9 cycles.
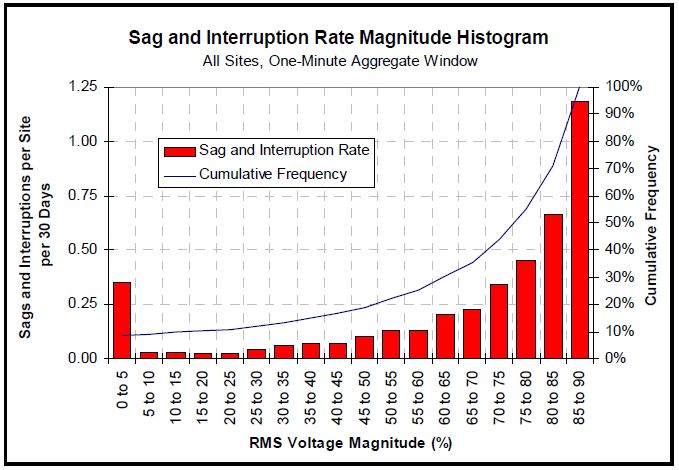
Figure 3b: RMS Variation Rate Magnitude Histogram, 60-Sec Aggregation, Jun-1-1993 to Jun-1-1995, Treated by Sampling Weights, All Sites.
Voltage disturbances which are shorter in duration than sags and swells are classified as transients and include two basic classes: (1) impulsive transients, often attributable to lightning and load switching, and (2) oscillatory transients, usually caused by capacitor bank switching (see Figure 4a). Utility capacitor banks are often switched into service early in the morning in anticipation of a higher power demand period. Transients with a high magnitude and fast rise times can lead to insulation breakdown in motors, transformers, capacitors, and switchgear.
The application of distribution system capacitor banks has long been accepted as a necessary step in the design of distribution feeders. Design considerations often include traditional factors such as voltage support, power factor, and released capacity. However, as customer systems evolve through the use of power electronics, the distribution system design of the future will include power quality as a consideration. The frequent switching of distribution capacitor banks coupled with the increasing application of sensitive customer equipment has led to a heightened awareness of some important events:
• Magnification of capacitor switching transients.
• Nuisance tripping of adjustable-speed drives.
These concerns have become particularly important as utilities institute higher power factor penalties, thereby encouraging customers to install power factor correction capacitors.
In Figure 4a we see the method of determining absolute peak magnitude from a phase measurement typical of those recorded during the EPRI DPQ Project. For each waveform, we can determine a peak magnitude, which can either be the absolute value of the positive or the negative peak depending upon which is larger. In the example provided, we identify a peak of 1.34 pu.
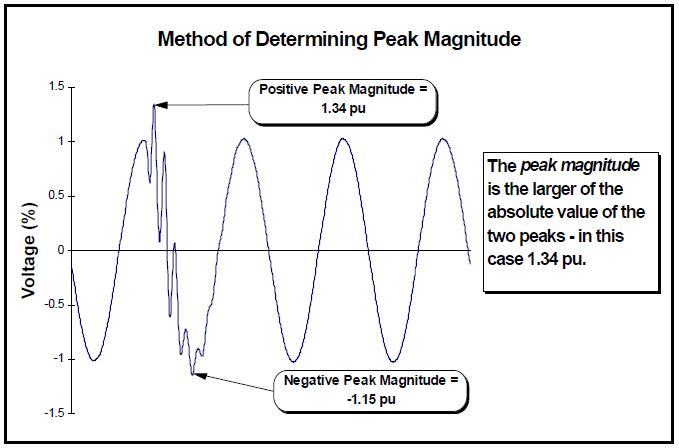
Figure 4a: Method of Determining Absolute Peak Magnitude
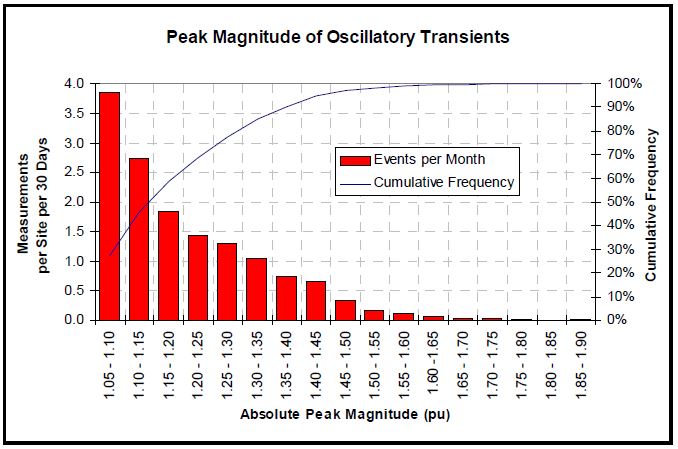
Figure 4b: Histogram for Magnitude of Oscillatory Transients, Measurement Events, Jun-1-1993 to Sep-1-1995, Treated by Sampling Weights, All Sites
The statistical tool to analyze many of these measurements is a histogram; Figure 4b displays this histogram for the period from Jun-1-1993 to Sep-1-1995. The data represents all sites that were active in the project during that time. The height of each column represents the number of times that a particular peak magnitude was recorded, while the value along the vertical axis provides the peak value itself. The height has been normalized by the 1389.13 monitor, months registered during this monitoring period. From Figure 4b we can say that a peak magnitude due to capacitor switching between 1.30 and 1.35 pu (>1.30 and ≤ 1.35 pu) was recorded on average 1.047 times per 30 days per site. Additionally, the cumulative frequency can be used to tell us that a capacitor transient larger than 1.35 pu occurred on average 2.158 times per 30 days per site (100% – 84.96%), (14.342 events/month).
Harmonic distortion on the utility system is the result of connecting nonlinear customer loads such as adjustable speed drives, arc furnaces, compact fluorescent lights, and rectifiers. Rectifier power supplies are found in nearly every modern computer, ubiquitous in offices today. The problem arises because these loads do not draw current for the entire power cycle, and can be modeled as actually “injecting” current of frequencies that are integer multiples (harmonics) of the fundamental power frequency (50 Hz or 60 Hz). When the current injected is large relative to the amount that the power system can absorb, the level of voltage distortion local to the area of the nonlinear load is increased. Large levels of harmonic distortion result in overheating of motors, generators, and transformers, premature operation of protective devices including fuses, and metering inaccuracies. IEEE Std. 519-1992 provides guidelines and limits for current and voltage distortion levels on transmission and distribution circuits. Harmonic distortion originates with nonlinear devices on the power system. Nonlinear devices produce non-sinusoidal current waveforms when energized with a sinusoidal voltage. Examples of these devices are adjustable speed drives, switching power supplies (including computers and other office equipment), fluorescent lighting, battery chargers, saturated transformers, and arc furnaces. Nearly all of these are nonlinear and are shunt elements, the bulk of which are loads.
For each three-month quarter of the project, basic statistics for each site were computed for voltage THD and the 2nd through 13th harmonics. Some of the statistics included 5th percentile and 95th percentile. Also known as the CP05 and CP95 values of the site’s distribution, they are excellent measures of lower and upper limits. As a basic interpretation, 5% of the samples were less than the 5th percentile, and 5% of the samples were larger than the 95th percentile. Figure 5a presents a graphical method of understanding these percentile values. Also computed for each site during the quarter was the arithmetic mean, which was performed by summing all of the values of the distribution and dividing by the number of samples. The voltage THD and harmonic components were normalized using the fundamental (60 Hz) voltage component of each sampled waveform (V1).
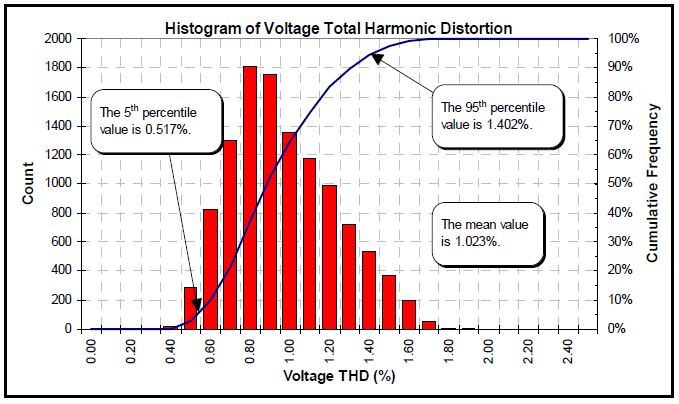
Figure 5a: Voltage THD histogram illustrating percentiles at one monitoring site for one quarter
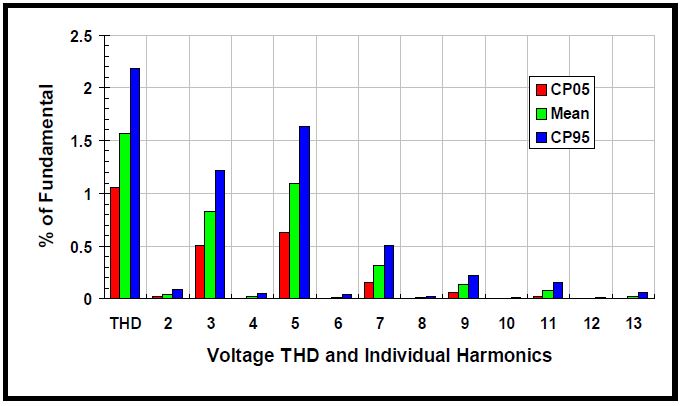
Figure 5b: Voltage THD and Individual Harmonics, Jun-1-1993 to Mar-1-1995, Treated by Sampling Weights, All Sites
We computed a set of CP05, mean, and CP95 values for each site and each quarter. In constructing Figure 5b, which is a summary chart for voltage harmonic distortion, each of the values was weighted and averaged using the ratio estimator method described (2). This method provides us with estimate of the true CP05, mean, and CP95 for the population of every feeder of the twenty-four EPRI DPQ utilities.
We see that even harmonics are rare, as are harmonics above the 13th. This is not to say that these harmonics did not appear in the project’s five million samples; they just were not common to all sites in general. The harmonic orders with the largest magnitudes were the 3rd, 5th and 7th. Single-phase power supplies are a source of the 3rd harmonic, while the 5th and 7th harmonics are characteristics of six-stepped inverters. From Figure 5b, we can say that the average value of voltage THD at a site is 1.57%. Additionally, 95% of the samples had a mean 3rd harmonic component of less than 1.21%.
The data collected during the EPRI DPQ Project was enormous, considering the technology available to us at the project’s onset. Its analysis would have been an all but insurmountable task without a software system for automatically characterizing measured events and storing the results in a well-defined database. PQView® is the tool we developed to pull together all of the facets involved in that monitoring project. PQView has now become part of the EPRI Power Quality Diagnostic System (PQDS).
PQDS is a general purpose tool being developed by Electrotek Concepts and funded by EPRI that helps a utility organize the data collection, processing, and analysis tasks associated with power quality issues. It should orchestrate a much more efficient power quality investigation, allowing a power provider better customer support with less work force. A PQDS user will be able to use various modules to help conduct a case study with the results being stored in an Investigation Database. Two modules completed for 1997 included a Measurement Module and an Event Identification Module.7
PQView is the PQDS Measurement Module. It provides data collection, characterizing, analysis, and reporting roles. This module maintains the database of all monitoring results utilized by the PQDS, including both raw measurement data and data characterized for statistical analysis and reporting. We have designed the Measurement Module for interfacing with the monitoring equipment software provided by the vendors of the third-party monitoring equipment. The measurement module will acquire data from the databases or files recorded by the actual monitoring equipment software, characterize the data, and provide analysis tools.
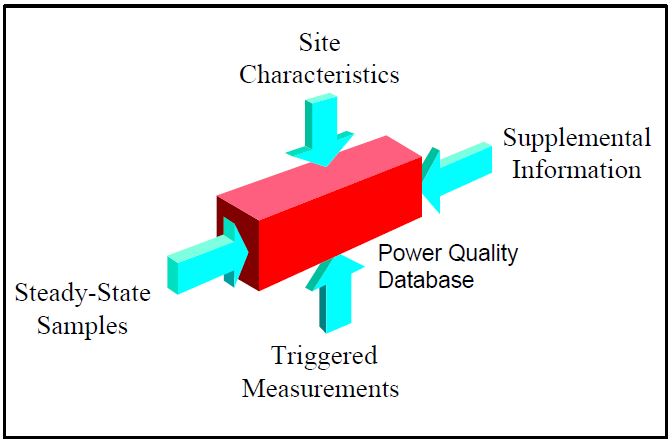
Figure 6: PQView builds power quality databases
Table 1: Monitoring platforms and standard formats currently supported by PQView
| Basic Measuring Instruments | Dranetz Technologies | Reliable Power Meters | Standard Formats |
|---|---|---|---|
| • EPRI PQPager 3100 • PQNode Models 7100, 8010, 8020 | • DRAN-SCAN® 2000 | • Omega Power Analyzer | • Power Quality Data Interchange Format (PQDIF) |
PQView allows a user to create any number of power quality databases and to decide which data are loaded into the database, conceptually illustrated in Figure 6. This provides flexibility in deciding how to organize the information. The power quality database created and managed by PQView can also include data from other sources, such as site surveys with other measuring equipment. Input filters, listed in Table 1, have been developed in PQView to incorporate measurement results from a variety of commonly used instruments.
With PQView, a power quality investigator can choose from a number of pre-defined charts and reports. For steady-state analysis, PQView provides a Steady-State Wizard which can generate both trends and histograms for these steady-state characteristics:
• peak, rms, and harmonic rms values
• even, odd, and total harmonic distortion
• crest, form, and telephone interference factors
• negative- and zero-sequence unbalance
• magnitudes and phase angles of individual harmonics
Figures 7a and 7b display examples of steady-state analysis. For analyzing sags, swells, and interruptions, we provide an RMS Variation Analysis Panel which gives the user flexibility in analyzing and displaying statistical graphs. Some of the reporting options are displayed in Figure 7c and 7d. Event summaries are informational reports providing the information for where, when, and what happened at different monitoring sites in a system. PQView bases voltage sag analysis upon both statistical and graphical representations of measurements.
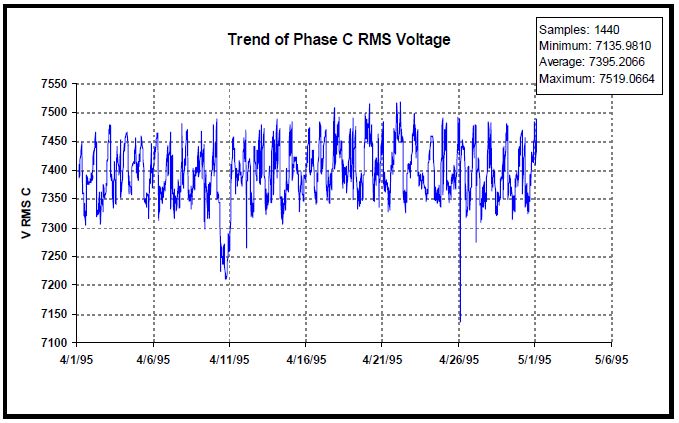
Figure 7a: Trend of Steady-State Sampled Data
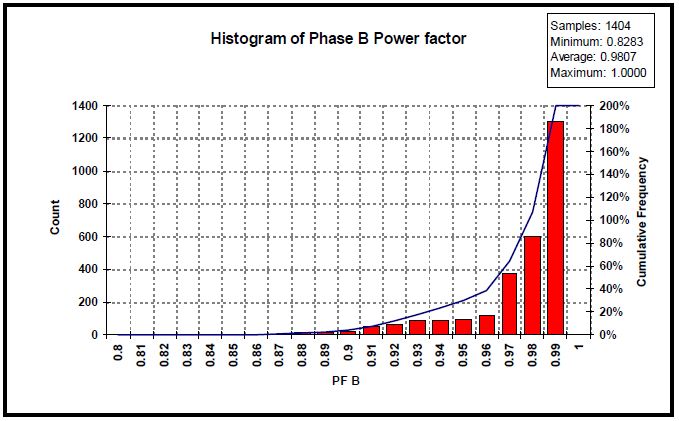
Figure 7b: Histogram of Steady-State Sampled Data
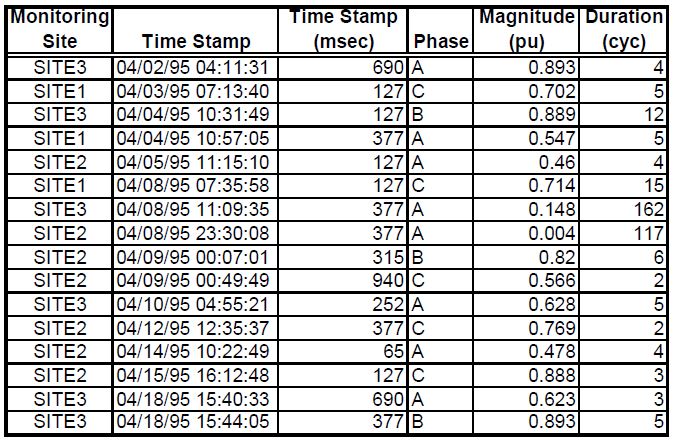
Figure 7c: Event Summaries
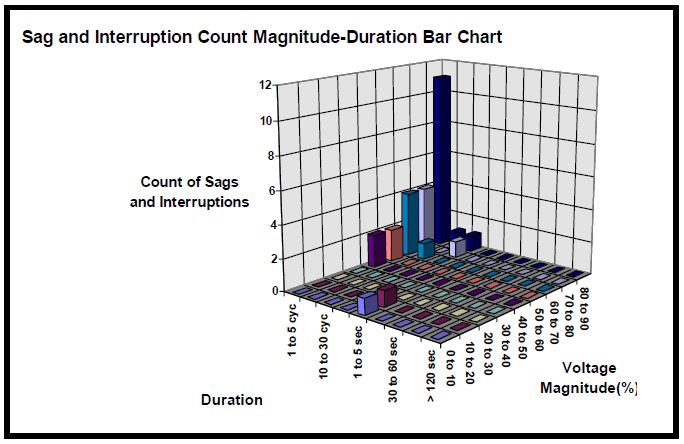
Figure 7d: Voltage Sag Statistical Analysis
Power quality problems are customer problems. If voltage variations do not cause any problems with customer equipment, they are not power quality problems. Since customers are an integral part of the power quality equation, it is important to include them in the power quality monitoring effort. The PQView power quality monitoring system is designed to include the customer and utility field personnel through direct communication. Although the data management tasks are still performed by PQView’s data manager module, the data analysis tasks can be performed by a server computer that accepts remote instructions from a world wide web browser such as Netscape™ or Microsoft’s Internet Explorer™. By using a web browser, PQView becomes a multi-platform application, being able to cross boundaries based on incompatible operating systems.
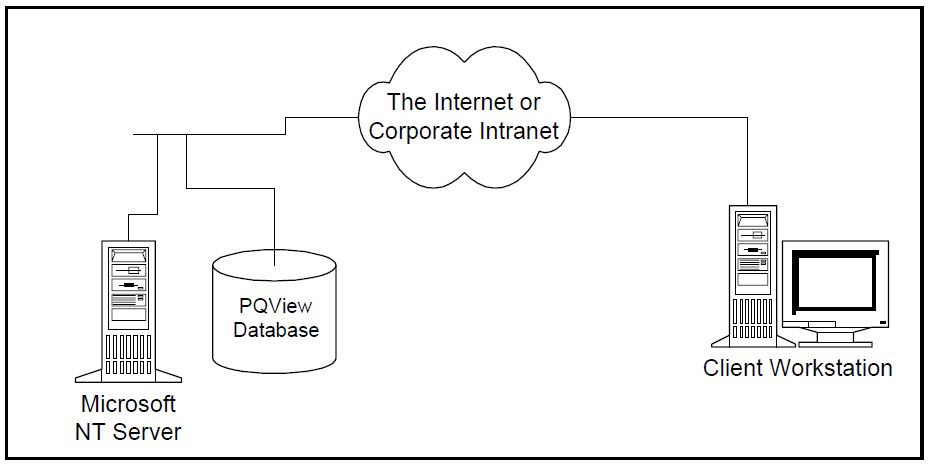
Figure 8: PQView can operate either in either Microsoft Access 95 workstation mode or in a client/server mode. In client/server mode, a server computer maintains the power quality measurement database and runs queries to satisfy the analysis needs of remote clients. The client workstation needs only a World Wide Web browser to access the server’s data.
The EPRI Distribution Power Quality Project provides a statistical assessment of existing power quality levels on a large-scale basis. Many utilities, however, lack the expertise to devise and implement an assessment of their individual distribution systems. The EPRI Reliability Benchmarking Methodology (RBM) will provide utilities with the methodology required to make these individual utility assessments. One of the primary objectives of the RBM Project is to define an extensive set of service performance indices which assess all areas of power quality based on monitored data. In the past, sustained interruption indices such as SAIFI (System Average Interruption Frequency Index) and SAIDI (System Average Interruption Duration Index) were often sufficient for assessing service quality because reliability could be equated to continuity of service. The proliferation of high-efficiency, highly sensitive power electronic devices in all customer sectors has increased customer expectations concerning the electricity delivered from the power supplier. For these sensitive customers, indices assessing only sustained interruptions do not adequately assess utility service quality.
The purpose of the EPRI DPQ Project was to compile the power quality data required to develop a national baseline and to provide a database against which utilities can benchmark themselves. The results of the EPRI RBM Project provide the methodology and the tools needed for individual utilities to monitor and quantify distribution system reliability in terms of the quality of service provided. The RBM Project consists of four main tasks:
The methodologies developed are integrated into software tools allow users to automatically calculate specified indices. One of these software modules implements the distribution disturbance state estimation that provides power quality profiles at points across the system where monitoring may not be implemented. We have developed another software tool which is an index calculation module integrated with the EPRI PQView software package. Figure 9 shows a block diagram representing how these two software tools are used together to allow a utility to assess the reliability of an entire distribution system or of any subsystem in terms of the developed indices. Utilities will also be able to compare calculated indices to the baseline values obtained by benchmarking the EPRI DPQ Project database.
The EPRI RBM Project indices provide utilities with the means to more fully assess the quality of service which they are providing their customers. We have categorized the new indices into four service quality disturbance groups: short duration rms voltage variation, harmonic distortion, transient overvoltages, and steady-state voltage variations. This paper will focus on only one index, considered one of the most important for general use among EPRI utilities.
System Average RMS (Variation) Frequency IndexThreshold (SARFIx ). SARFIx represents the average number of specified rms variation measurement events that occurred over the assessment period per customer served, where the specified disturbances are those with a magnitude less than x for sags or a magnitude greater than x for swells.

where
• x ≡ rms voltage threshold; possible values − 140, 120, 110, 90, 80, 70, 50, and 10
• Ni ≡ number of customers experiencing short-duration voltage deviations with magnitudes above X% for X >100 or below X% for X <100 due to measurement event i
• NT ≡ number of customers served from the section of the system to be assessed
Note that SARFI is defined with respect to the voltage threshold x. This allows for an assessment of rms variations of a specified voltage level. For example, if a utility has customers which are only susceptible to sags below 70% of nominal voltage, this disturbance group can be assessed using SARFI70. All of the rms variation indices are defined using this voltage threshold. Note also, that the eight defined values for the index voltage threshold are not arbitrary values. They are chosen to coincide with the following:
• 140, 120, and 110: Overvoltage segments of new guidelines proposed for information technology equipment
• 90, 80, and 70: Undervoltage segments of new guidelines proposed for information technology equipment
• 50: Typical break point for assessing motor contactors
• 10: IEEE Std. 1159-1995 definition of an interruption1
This index is similar to the System Average Interruption Frequency Index (SAIFI) value that many U.S. utilities have calculated for years. SARFIx, however, assesses more than just interruptions. The frequency of occurrence of rms variations of varying magnitudes can be assessed using SARFIx. Note that SARFIx is defined for short-duration variations as defined by IEEE 1159-1995 (i.e., events less than sixty seconds). Other indices not discussed in this paper are defined for long-duration variations, undervoltages and overvoltages.6
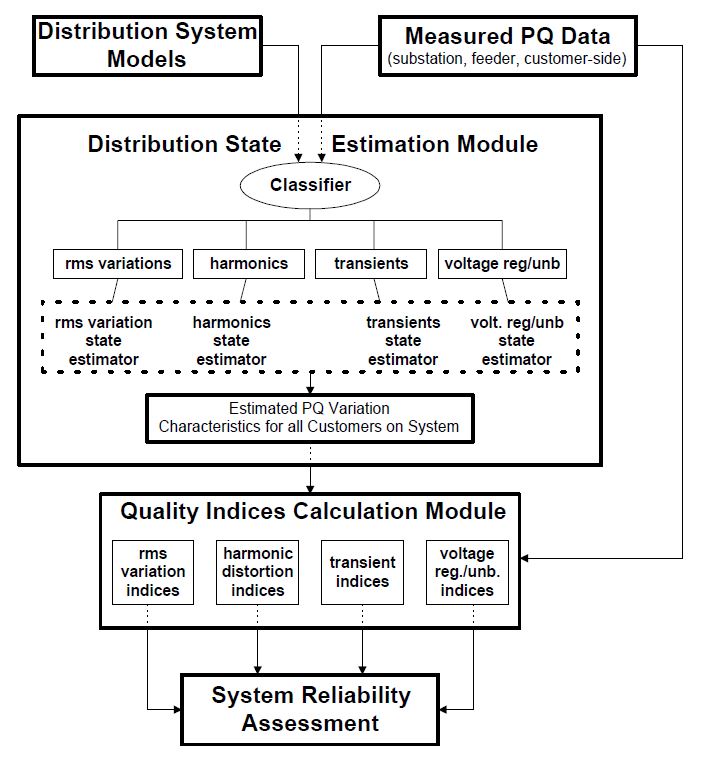
Figure 9: Flow diagram illustrating the process of assessing system reliability based on the system model and the measured power quality data
The primary goal of the EPRI DPQ Project’s final report was to present the statistics of power quality measurements collected during the project’s two-year monitoring period. However, all aspects of power quality were addressed in order to establish a reference for the data results presented.
The site selection process is fully described and serves as a useful model for monitoring projects which are designed to be compared with the DPQ Project. The monitoring instrument designed to collect the project’s data – the PQNode – was the first instrument designed to describe the full range of power quality variations including steady-state variations (harmonic distortion, unbalance, regulation) and disturbances (rms voltage variations and transients). Its specifications and capabilities are addressed here. The project’s data collection process is explained, another useful reference for conducting large and small monitoring projects. Triggering methods, characterization algorithms, and statistical analysis are presented for four categories: rms voltage variations, transient overvoltages, harmonic distortion, and voltage regulation. The report also presents definitions and references to power quality standards.
Monopolistic, vertically integrated utilities are becoming an institution of the past as electric power deregulation changes the utility industry worldwide. Increasing pressures for cheaper and higher quality power has forced each utility to seek to reduce waste within their own organizations, as well to market their product − electric power − as more desirable than its neighboring systems. Power monitoring will be the method for utilities to prove their quality to their customers, while at the same time it will serve as the means for power consumers to keep a check on their utility. Both sides will utilize enhanced reliability indices to close the compatibility gaps between what power quality sensitive electronics can tolerate and the electrical environment in which they are used.
References
Published by
Electrotek Concepts, Inc., 408 North Cedar Bluff Road, Suite 500, Knoxville, TN, 37932 USA, Tel: +1-423-470-9222, Fax: +1-423-470-9223
EPRI, 3412 Hillview Avenue, Palo Alto, CA, 94304 USA, Tel: +1-650-855-2304, Fax: +1-650-855-8997
This paper describes the methods for collecting, characterizing, storing, and analyzing rms voltage variation measurements during a distribution system power quality monitoring program. The measurements were collected from the primary distribution systems of 24 utilities in different geographic regions of the United States. The objectives for the site selection process are offered. The techniques for measurement triggering are explained. Novel techniques regarding the characterization of rms voltage variation quantities by resolution into measurement components are described. Key results with regard to rms variation magnitude statistics are submitted.
This paper provides a discussion of rms voltage variations − power system disturbances characterized by a deviation in the rms value of voltage waveforms from a normal operating value. The chief causes of rms voltage variations on the distribution system are faults; less frequent causes include the switching of large loads and regulation problems.
This power quality phenomenon involves events typified by either a fall or a rise in the rms value of the system voltage. Listed in order of the probability of occurrence on a distribution system, we are interested in sags (also known as voltage dips), swells, interruptions, undervoltages, and overvoltages. IEEE Std. 1159-1995, Recommended Practice on Monitoring Electric Power Quality, provides definitions for these five terms [1]. Note that IEEE 1159 suggests that sag, swell, and interruption events should usually be used in conjunction with a modifying prefix to signify the duration of the event (i.e., instantaneous, momentary, or temporary).
An example rms voltage variation appears in Fig.1, recorded by a power quality monitoring instrument during an atypically severe instantaneous voltage sag. The voltage reduction resulted from the increased voltage drop across the power system’s impedance during an up-line fault. In the plot, the upper trace represents the rms voltage during the full duration of the measurement, while the lower trace displays one cycle of the instantaneous voltage before the measurement began followed by the ten cycles after trigger.
Sags, swells and momentary interruptions are not new phenomena; they have been characteristics of electric power systems for over a hundred years. Voltage sags were not considered a significant problem decades ago because the loads connected to electric distribution systems were generally immune to their effects. For this reason, electric utilities did not need to maintain power quality statistics to determine what was normal or abnormal. However, with the world-wide proliferation of advanced but sensitive power electronic equipment and the increasing integration of microcomputers in process control and automation, these same power system characteristics considered relatively unimportant before can now be very expensive in terms of process shut-downs and equipment malfunctions.
In order to better understand the statistics of rms voltage variations, as well as other power quality phenomena, the Electric Power Research Institute (EPRI) conducted a power quality monitoring survey of 277 monitoring locations located on the primary distribution feeder of twenty-four electric utilities across the United States [2]. Commonly known as the Distribution System Power Quality Monitoring Project, or the EPRI DPQ Project, the study spanned the period from June 1993 to September 1995. It resulted in the collection of over 6.7 million measurements now stored in a 30-gigabyte database. This paper focuses on only one component of the total monitoring effort by describing the methods used to collect, characterize, store, and statistically analyze the rms voltage variation measurements. We will also present some key statistical results from the project’s final report.
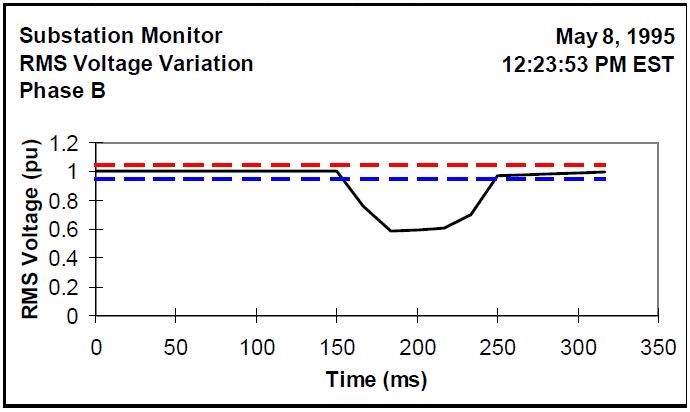
Fig.1. Example of an rms voltage variation with a minimum rms voltage magnitude of 4374 V (0.59 per unit) and a duration of 5 cycles
Initial plans of the power quality monitoring program involved placing three hundred monitors on sites on the twenty-four volunteer utility systems over a two-year period. Consistent with the first objective noted above, the researchers found it necessary to select one hundred feeders from the twenty-four electric utilities that volunteered to host the project. The utility names are listed in [3]. These feeders needed to adequately represent the range of characteristics seen on distribution systems throughout the United States. This required the researchers to use a controlled selection process to ensure that both common and uncommon characteristics of the national distribution systems were well represented in the study sample. When relating the results of the study to the volunteer utility population, weighting is employed to reflect the resulting unequal sampling probabilities. The paper given in [4] provides an in-depth description of the multistage process used to select the sites for monitoring. It also provides the distribution characteristics of the sites actually selected, including length of feeder, voltage rating, type of customers, type of construction, and size of substation. Examples demonstrating the methods for using selection probabilities to weight measurements are found in the report listed in [2].
The result of the site selection process was a set of 100 primary distribution feeders in the voltage range of 4 to 33 kV. The project team decided to arbitrarily place one monitor on the line side of the feeder substations to create a subset of monitoring locations which could be identified as being distribution substations only. To still provide a level of randomness, the project team decided to place two more monitors downline of the substation on the feeder itself. This identified a total of 300 sites for monitoring. The actual number of sites at which monitors were installed by the host utilities totaled 277 on 95 feeders. The sites not installed generally were victims of individual utility budget cutbacks. However, the project’s statistician did not consider the missing sites to be of great concern since they were in the limits set by the project design.
The power quality monitoring instrument designed for the study had eight input channels, four of which were devoted to voltage and four to current. Its sampling rate was 256 points per 60 Hz cycle for voltage and 128 points per cycle for current. Although IEEE Std. 1159-1995 defines the minimum possible duration of an rms voltage variation to be half of one cycle, the minimum duration of rms measurements possible with the project’s instrument was one cycle. It was designed to compute rms by integrating the sampled points during successive full cycles.
The power quality monitor was designed to trigger a disturbance recording to variations in both instantaneous and rms voltage. For the purposes of this paper, which focuses on rms voltage variation analysis, we will only discuss the rms triggering methods. Reference [3] provides a more detailed explanation of other triggering.
Measurement Count
Between 1 June 1993 and 1 June 1995, a total of 277 instruments recorded 107834 rms variation three-phase measurements during 146661 days of monitoring. Of these, 68% of the three-phase measurements was triggered by only one voltage phase; the voltage on the other two phases remained in the normal operating range. Another 19% was triggered by two phases, meaning that the rms voltage dropped below 0.95 pu or rose above 1.05 pu on two phases. The remaining 13% of the 107834 rms variation measurements was triggered by all three phases.
With any discussion of rms voltage variation analysis, a frequently asked question is “What do you define to be an event?” The question is important because the total count of “events” would be very different if three-phase measurements were counted as three single-phase measurements. The approach the project team developed for the monitoring project was to collect small elemental components of measurements (i.e., measurement components) and aggregate them at analysis time. The word “aggregate” literally refers to the collection of units or parts into a mass or whole. Power quality data aggregation refers to the data reduction technique of collecting many distinct measurement components into a single aggregate “event” for the purpose of computing system performance indices. How the measurements were combined depended on the specific needs of a particular analysis session.
Temporal Aggregation
The goal of temporal aggregation was to collect all measurements taken by a monitoring instrument or instruments that were due to the same power system occurrence, and identify them as one event. A system event is the real-world incident that triggers any number of measurements to be recorded by a monitoring instrument. Examples include two conductors being blown together, a tree branch being brushed against one or more lines, lightning strikes, or the unfortunate act of an animal that creates an arc between part of the system and a grounded object. Other system events are planned, such as capacitor switching, and voltage reductions. The chief goal here is to create a one-to-one relationship between temporally aggregated data and power system occurrences when computing system performance indices.
A good method of obtaining the one-to-one relationship is to use time stamps. Once the first measurement has been identified, all measurements recorded by a single instrument within the next one to five minutes were considered part of the same temporal aggregate period. The time length chosen for aggregation is arbitrary. However, a one-minute aggregation time period agrees with the IEEE Std. 1159-1995 definition of the minimum length of a sustained interruption. A five-minute period concurs with the maximum length of a momentary interruption event defined by the final draft of IEEE Std. 1366-1999, IEEE Trial Use Guide for Electric Power Distribution Reliability Indices [6]. To consider the impact of voltage sags to an industrial load, some utilities have adopted a 15-minute or 30-minute aggregation period.
The measurement collection and characterization process of the monitoring project resulted in a database of single-phase measurement components, each with a number of rms voltage magnitude and duration characteristics. The project team took care to preserve as much information about the measurements without having to maintain all measured data on-line at one time. Note that the original measurements were not deleted, but rather archived on magneto-optical storage media for future investigations. The resulting database was manageable in size to facilitate any number of different statistical analyses.
Calculation of Unbiased Estimated Averages
We needed to complete several important steps in order to compute the unbiased estimated average made possible by each site’s selection probability. The calculation of any unbiased estimated average is given by (1), where Wi is the sampling weight computed for site i.
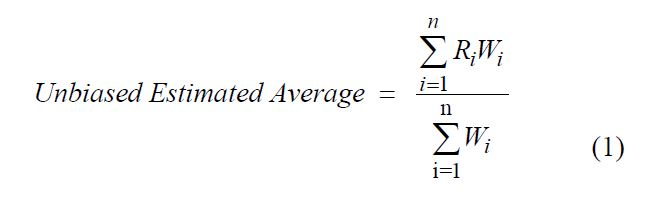
Monitor Availability
We considered another factor when computing composite statistics for the project’s measurements: monitor availability. Most rms variation power quality indices relate a rate of some sort, e.g, the number of voltage sags per thirty days. When combining indices taken from different monitoring sites, it is vital that the total time that each monitor was available is taken into account. To compute a measurement rate index, the count of measurements should be divided by the number of actual days (i.e., monitor·days) that an instrument was available rather than by the number of days between the start and end of the monitoring period. It was not unusual during the course of this monitoring project to experience periods when an instrument was off-line due to instrument calibration or malfunction. Poor data management practices can also result in missing measurements.
Fig. 2 illustrates the project’s final results for sag and interruption magnitude rate, using one-minute temporal aggregation, for the events recorded during a two-year period (1 June 1993 to 1 June 1995). The results include the application of sampling weights and represent all project monitoring sites. Spatial aggregation was not necessary as rate data is not impacted by multiple monitors experiencing the same power system occurrence. From Fig. 3 we can say that the average site in our project experienced 1.18 incidents in which the minimum voltage during a 60-second window was between 85% and 90% of the site’s base voltage, as well as 0.38 interruption incidents (less than 10% voltage). The only events which were excluded from this plot were those in which the duration below 0.90 per unit was longer than 60 seconds.
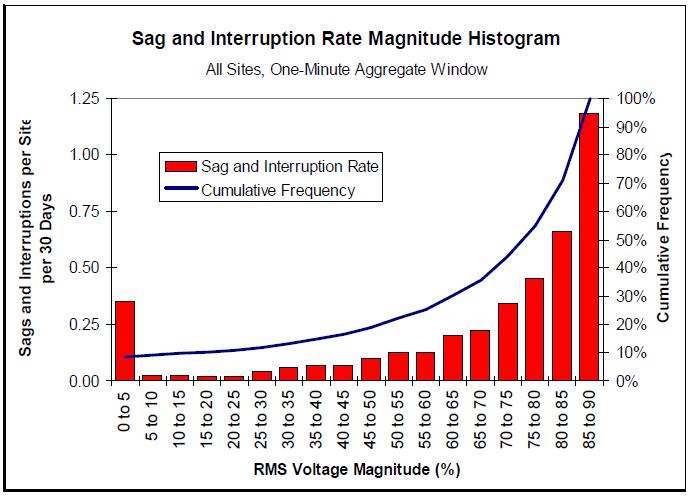
Fig. 2. Sag and Interruption Rate Magnitude Histogram, 1-Minute Temporal Aggregation, 1/6/93 to 1/6/95, Treated by Sampling Weights, All Sites
Ignoring the interruption voltages, the height of each column from Fig. 2 can be fit to a function with a surprising degree of accuracy. In (2) we present a function which we determined to be an adequate estimate of the project’s sag rate for a given voltage range. A similar equation was derived in [10] that assumed that a faulted distribution system could be modeled as a source voltage and impedance with two parallel current paths − one to a load and one to a fault. The expression derived in [10] is similar to (2).

where 0.10≤ V ≤ 0.90
Fig. 2 represents equal weighting of each of the three sites on the feeder in order to arrive at an average feeder rate. How the rates differ, between the substation and feeder sites, is important because many of the feeders in the project had reclosers installed downline from the substation circuit breaker. Since the reclosers were capable of interrupting independently of the breaker, one would expect to see more interruptions at the feeder sites than at the substation sites (which only would experience an interruption if the substation breaker or a transmission breaker operated). Table 1 summarizes the individual sag and interruption rates for substation and feeder monitors. As indicated in the table, the feeder interruption rate is approximately 140% of the substation value.
TABLE 1 Summary of sags and interruptions per Site per 365 days, 1/6/93 to 1/6/95, treated by sampling weights, all sites, One-Minute Temporal Aggregation
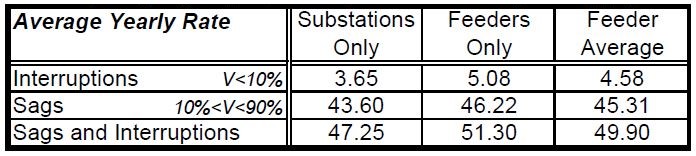
Another interesting question regarding interruptions involves the number of recloser/breaker operations recorded during a single event. Results for the one-minute aggregation indicate that 87% of the events involve a single operation, 9% involve two operations, 2% involve three operations, and 2% involve greater than four operations. We excluded sustained interruptions from our calculations. These rates would seem to substantiate the widely held belief that a vast majority of power system faults are temporary in nature. Fig. 3 summarizes this information.
While Fig. 2 provides valuable information regarding average sag and interruption rates, an understanding of the range on values measured at different sites is also useful. To plot a range of values, we need to identify just one value of interest. If we consider just the incidents in which the minimum voltage fell below 0.90 per unit and temporally aggregate them with a 60-second period, then we can compute an index identified in [12] to be SARFI90, which is a special case of SARFIx, an index first introduced in reference [12]. SARFIx, defined by (3), represents the average number of specified rms variation measurement events that occurred over the assessment period per customer served, where the specified disturbances are those with a magnitude less than x for sags or a magnitude greater than x for swells. SARFIx only includes IEEE 1159 short duration measurements (i.e., less than 60 seconds in duration).
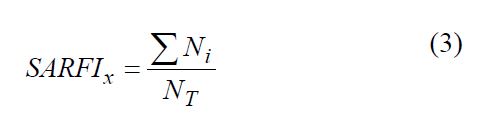
where
x ≡ rms voltage threshold; possible values – 140, 120, 110, 90, 80, 70, 50, and 10
Ni ≡ number of customers experiencing short-duration voltage deviations with magnitudes above X% for X >100 or below X% for X <100 due to measurement event i
NT ≡ number of customers served from the section of the system to be assessed
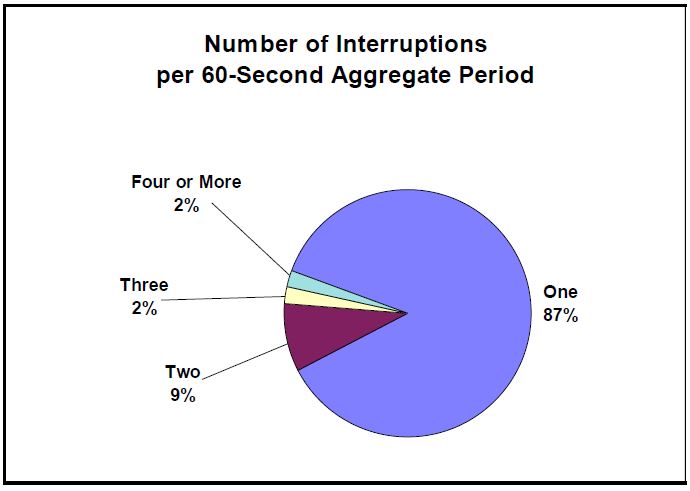
Fig. 3. Number of Interruptions per One-Minute Temporal Aggregate Period, 1/6/93 to 1/6/95, Treated by Sampling Weights, All Sites
Note that the calculation of the SARFI90 index is not complete unless the number of customers impacted by the depressed voltage is known. We did not have that information available to us when computing our project results. We would have had to perform some sort of our power quality state estimation to determine the voltage sag experienced by customers throughout the systems we were monitoring. Without the added information provided by state estimation, the assessed system must be segmented so that every point in the system is contained within a section monitored by an actual power quality measuring instrument. Thus, the number of monitoring locations within the assessed system becomes the number of constant voltage segments upon which the indices are calculated. Because this process of monitor-limited segmentation (MLS) results in only a few segments per circuit, the calculated index values are less accurate than those calculated using state estimation concepts. Nonetheless, MLS still yields indices that are informative.
Fig. 4 summarizes the number of one-minute aggregate periods during which the rms voltage dropped below 0.90 pu, 0.70 pu, 0.5 pu, and 0.10 pu for each site – hence distributions of SARFI90, SARFI70, SARFI50, and SARFI10 values using MLS. Normalizing by the number of days which the site’s monitor was on-line and weighting using sampling factors resulted in a SARFI70 distribution centered at 15 incidents per year with a maximum of 82 and a minimum of 0. The mean and standard deviation were computed using ratio estimators, which means that the sites with larger sampling factors contributed more to the calculation of mean and standard deviation than the sites with smaller sampling factors. The mean and standard deviation were used to estimate the 95% confidence interval for the population of all feeders on the host utilities’ distribution systems. For Fig. 4 we can say, with 95% confidence, that the true mean rate of voltage with drops below 0.70 pu per site per year is between 14 and 20. Table 2 summarizes Fig. 4 by showing the mean rate measured at all of the project’s monitoring locations.
TABLE 2 MLS Mean for Different SARFI Values, One-Minute Temporal Aggregation, 1/6/93 to 1/6/95, Treated by Sampling Weights, All Sites
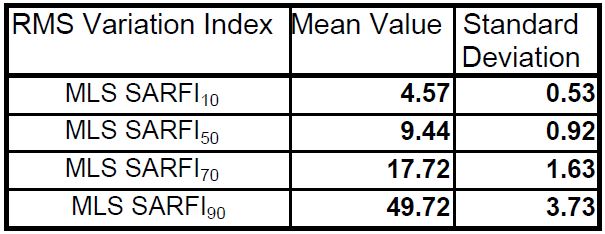
Stormy weather has long been to blame for many rms voltage variations. Strong winds often blow branches onto conductors or bring conductors together, while lightning strikes cause insulation flashover that may lead to faults. During the winter, the weight of ice and snow build-up sometimes leads to downed conductors. It should not be a surprise then to see a relationship between the seasons and sag and interruption rates.
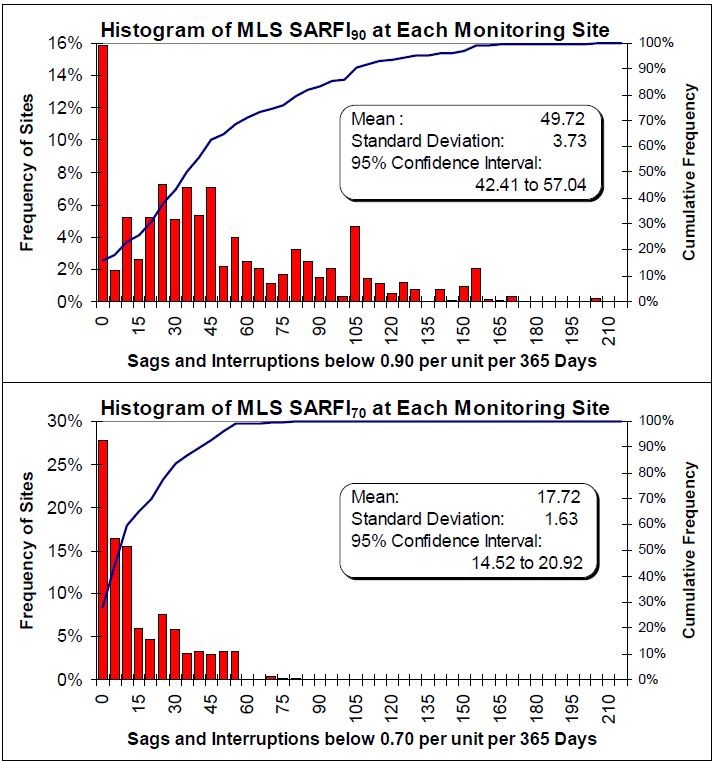
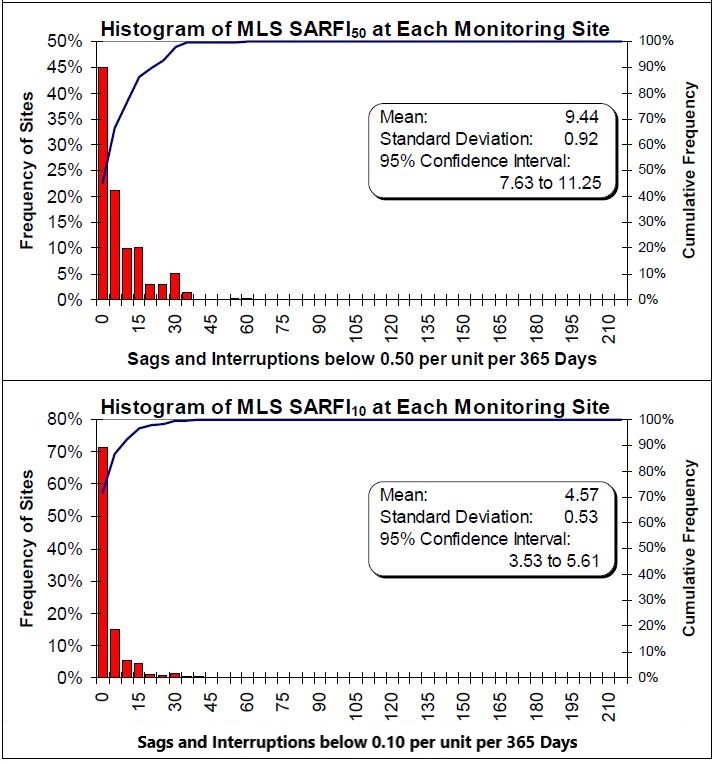
Fig. 4. Sag and Interd 10% Voltage per Site peYear, One-Minute Temporal Aggregation, 1/6/93 to 1/6/95, Treated by Sampling Weights, All Sites
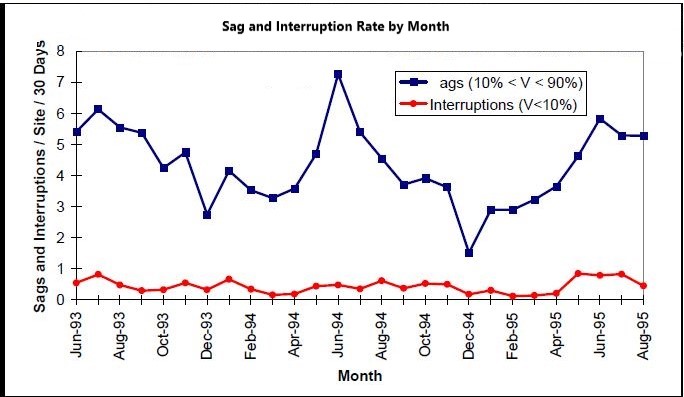
Fig. 5. Sag and Interruption Rate by Month, One-Minute Temporal Aggregation, 1/6/93 to 1/6/95, Treated by Sampling Weights, All Sites
We recalculated the data for Fig. 2, but this time separated the data by month. The resulting table was cross tabulated and plotted in Fig. 5. Clearly, peaks in sag measurements occurred during the summer periods of June, July, and August during 1993, 1994, and 1995.
To Explore Further
We also found it very important to analyze both the magnitude and the duration of rms variations. We refer the reader to [2] for a work that focuses on this two-variable examination. Additionally, recent work in characterizing voltage sags by both magnitude and phase shift is proving valuable in terms of predicting equipment sensitivity.
Electric utilities traditionally have been committed to supplying their customers with reliable power. However, customer needs are changing with the addition of sophisticated − but sensitive − power-electronic based end-use equipment. This industry revolution is increasing the need for a better power quality − uninterrupted, high-quality power with minimal voltage variations. Results from this project provide critical data regarding existing rms variation statistics from a study performed at a national level.
[1] IEEE Std. 1159-1995, Recommended Practice for Monitoring Electric Power Quality.
[2] Electric Power Research Institute, An Assessment of Distribution System Power Quality,
[3] E. W. Gunther, H. Mehta, “A Survey of Distribution System Power Quality – Preliminary Results,” IEEE Trans. Power Delivery, vol. 10, no. 1, January 1995, pp. 322-329.
[4] L. C. Markel, C. J. Melhorn, S. R. Williams, and H. Mehta, “Design of a Measurement Program to Characterize Distribution System Power Quality,” Proceedings of the Twelfth International Conference on Electricity Distribution (CIRED’93), Birmingham, England, May 1993.
[5] IEEE Std. 1366-1999, IEEE Trial Use Guide for Electric Power Distribution Reliability Indices.
[6] D. S. Door, “Point of Utilization Power Quality Study Results,” IEEE Trans. Industry Applications, vol. IA-31, no. 4, July 1995.
[7] DISDIP Group, “Voltage Dips and Short Interruptions in Medium Voltage Public Electricity Supply Systems,” Report from the International Union of Producers and Distributors of Electrical Energy (UNIPEDE), 1990.
[8] M. H. J. Bollen, “Fast Assessment Methods for Voltage Sags in Distribution Systems,” Conference Record of the 1995 IEEE Industry Applications Society Meeting, Orlando, Florida, October 1995, vol. 3, pp. 2282 – 2289.
[9] M. B. Hughes, J. S. Chan, “Canadian National Power Quality Survey Results,” Fourth International Conference on Power Quality: Applications and Perspectives (PQA ’95), New York, New York, May 1995.
[10] D. L. Brooks, R. C. Dugan, M. Waclawiak, A. Sundaram. “Indices for Assessing Utility Distribution System RMS Variation Performance,” IEEE Trans. Power Delivery, PE-920-PWRD-1-04-1997.
[11] Bollen, M. H. J., L.E. Conrad, Gold Book Voltage Sag Working Group Members, “Voltage Sag Coordination for Reliable Plant Operation.” Conference Record of the 1996 IEEE Industry Applications Society Annual Meeting, San Diego, California, October 1996, Vol. 3, pp. 2366 – 2377.
D. Daniel Sabin is a Project Manager at Electrotek Concepts, Inc. in Knoxville, Tennessee. Dan was the principal engineer for the EPRI Distribution System Power Quality Monitoring Project during its data collection and analysis stages. In addition to developing the project’s databases, he performed power quality event and statistical analysis for its monthly, quarterly, and final reports. Dan has a BS degree in electrical engineering from Worcester Polytechnic Institute of Worcester, Massachusetts and a ME degree in electric power from Rensselaer Polytechnic Institute in Troy, New York. He is the chair of the IEEE Custom Power Task Force. He is a registered professional engineer in the state of Tennessee.
Thomas E. Grebe is the General Manager of Electrotek Consulting at Electrotek Concepts, Inc. in Knoxville, Tennessee. His primary responsibilities include investigations for electric utilities in the areas of power system and power quality analysis. He served as Electrotek’s project manager for the EPRI Distribution Power Quality Project. His engineering efforts have focused primarily on power system modeling and analysis using the Electromagnetic Transients Program. Tom is a member of IEEE and is actively involved in various working groups including serving as secretary of the digital transients programs working group. Prior to joining Electrotek, Tom worked in the System Protection Department of Virginia Power. He received his BS degree in Electrical Engineering from the Pennsylvania State University in 1984 and is a registered professional engineer in the state of Virginia.
Mark F McGranaghan is a General Manager of Power Systems Engineering at Electrotek Concepts. He is responsible for a wide range of studies, seminars, and products involving the analysis of power quality concerns. He has worked closely with EPRI, electric utilities, and end users throughout the country performing case studies and monitoring projects to benchmark power quality levels and to characterize power quality problems and solutions. These include industrial and commercial power quality, harmonics, transients, measurements, voltage sags, power conditioning, adjustable speed drive applications, power factor correction, and power quality concerns for energy management.
Ashok Sundaram is a Manager of Power Electronics projects in the Energy Delivery and Utilization Division of EPRI in Palo Alto, California. He served as EPRI’s project manager for the Distribution System Power Quality Monitoring Project. Ashok received a BSEE degree from the University of Madras, India, in 1978, an MSEE from Southern Illinois University in 1984. He has also completed his course requirements for his Ph.D. in Electrical Engineering. He is a member of the IEEE.
Have a WordPress.com account? Log in now.

