Published by testguy, November 23, 2019. Website: testguy.net
Power Quality Reports
A power quality meter can plot the voltage and current waveforms as functions of time, this is called an oscillogram. Data can be extracted from the power quality recorder and analyzed to determine the overall condition of the power system using various timeplots and tables.
The actual data analysis is usually performed by an electrical engineer, who will generate a report that provides a summary of the various power conditions, a list of events that occurred during the analysis, and any corrective action or recommendations that should be considered.

Figure 1. Data can be extracted from the power quality recorder and analyzed to determine the overall condition of the power system using specialized computer software.
Power Quality Meters are capable of calculating a large number of power measurements at extremely high speeds. These measurements may include minimum, average, and maximum values for parameters such as:
- current and voltage RMS
- phase relationship between waveforms
- power factor and frequency
- Active power (kW), reactive power (kVAr), apparent power (kVA)
- active energy (kWh), reactive energy (kVArh) and apparent energy (kVAh)
- Harmonic spectrum, THD, TDD
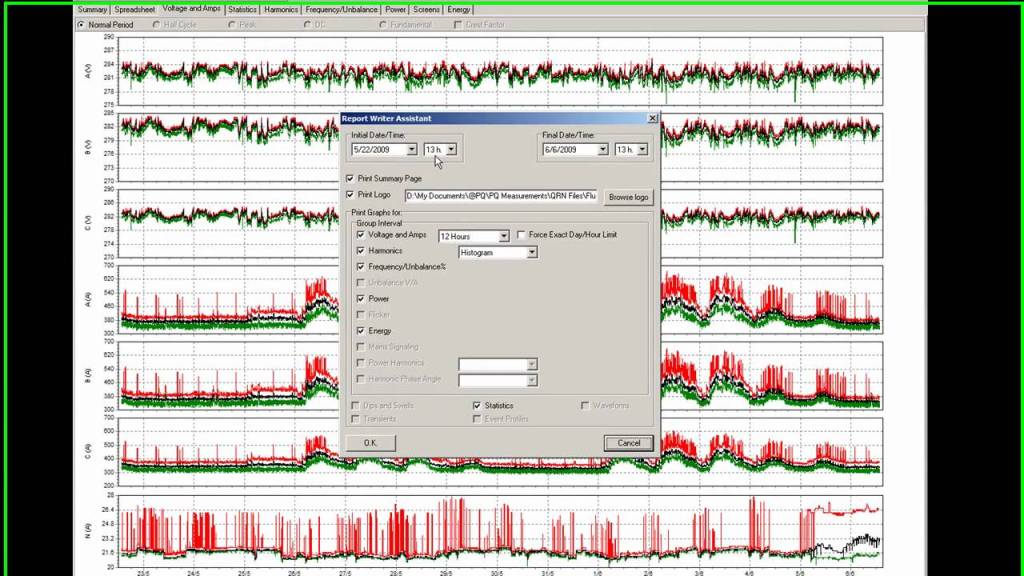
Figure 2. Power Quality Meters are capable of calculating a large number of power measurements at extremely high speeds.

Your style is unique in comparison to other people I’ve read stuff from. Thanks for posting when you’ve got the opportunity, Guess I’ll just bookmark this web site.
LikeLike
That is a good tip particularly to those fresh to the blogosphere. Simple but very precise info… Thanks for sharing this one. A must read article!
LikeLike
Hello Gerry, Thank you for your message!
LikeLike