Published by Nikola Zlatanov*
Voltage Classifications
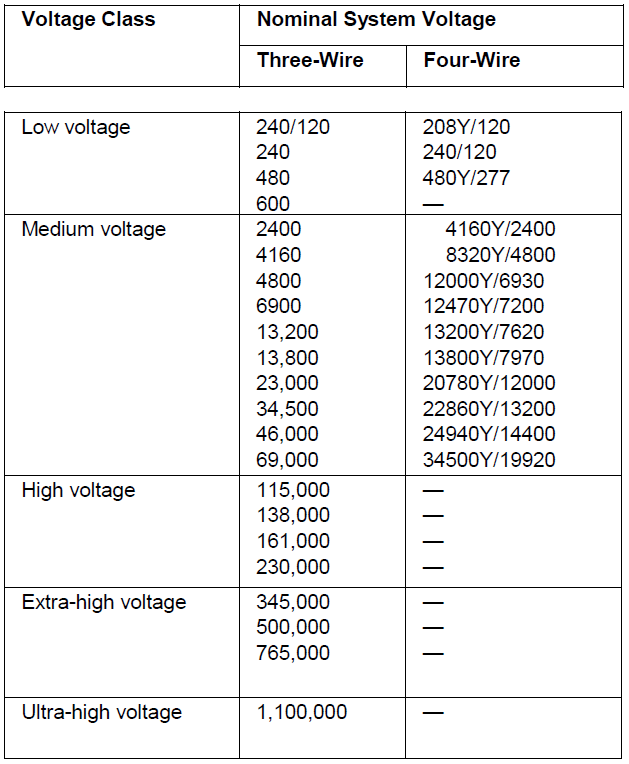
ANSI and IEEE® standards define various voltage classifications for single-phase and three-phase systems. The terminology used divides voltage classes into:
- Low voltage
- Medium voltage
- High voltage
- Extra-high voltage
- Ultra-high voltage
Table 1.1-1 presents the nominal system ese classifications. Voltages and Voltage Ranges (From IEEE Standard 141-1993)
BIL—Basic Impulse Levels
ANSI standards define recommended and required BIL levels for:
- Metal-clad switchgear (typically vacuum breakers)
- Metal-enclosed switchgear (typically load interrupters, switches)
- Pad-mounted and overhead distribution switchgear
- Liquid immersed transformers
- Dry-type transformers
Table 1.1-2 through Table 1.1-6 contain those values.
Table 1.1-2. Metal-Clad Switchgear Voltage and Insulation Levels (From IEEE Std. C37.20.2-2015) Levels td. C37.20.3-2013)
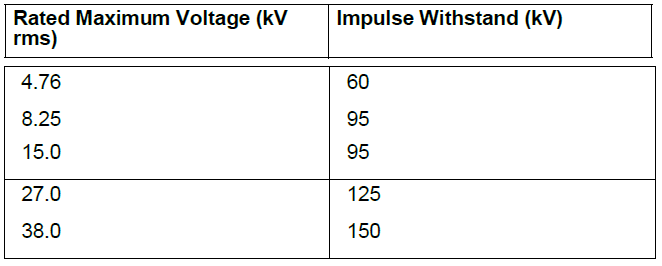
Table 1.1-3. Metal-Enclosed S ear Voltage and Insulation Levels (From IEEE Std. C37.20.3-2013)
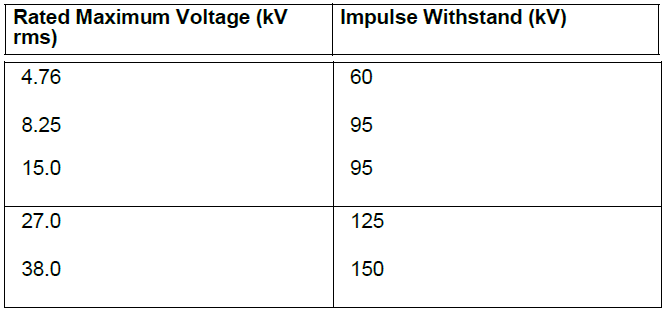
Table 1.1-4. Pad Mounted and Overhead Distribution Switchgear, Voltage and Insulation Levels
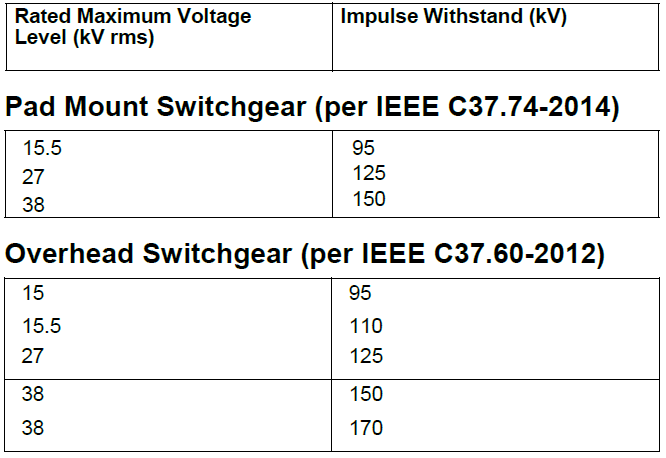
Table 1.1-5. Liquid-Immersed Transformers Voltage and Basic Lightning Impulse Insulation Levels (BIL) (From ANSI/IEEE C57.12.00)

Table 1.1-6. Dry-Type Transformers Voltage and Basic Lightning Impulse Insulation Levels (BIL)—From ANSI/IEEE C57.12.01-1998)
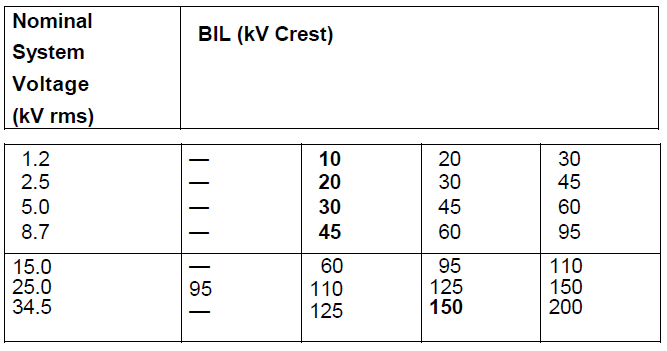
BIL values in bold typeface are listed as standard. Others listed are in common use. Optional higher levels used where exposure to overvoltage occurs and higher protection margins are required. Lower levels where surge arrester protective devices can be applied with lower spark-over levels.
Voltage Recommendations by Motor Horsepower
Some factors affecting the selection of motor operating voltage include:
- Motor, motor starter and cable first cost
- Motor, motor starter and cable installation cost
- Motor and cable losses
- Motor availability
- Voltage drop
- Qualifications of the building operating staff; and many more
The following table is based in part on the above factors and experience. Because all the factors affecting the selection are rarely known, it is only an approximate guideline.
Table 1.1-7. Selection of Motor Horsepower Ratings as a Function of System Voltage

Types of Systems
In many cases, power is supplied by the utility to a building at the utilization voltage. In these cases, the distribution of power within the building is achieved through the use of a simple radial distribution system. In cases where the utility service voltage is at some voltage higher than the utilization voltage within the building, the system design engineer has a choice of a number of types of systems that may be used. This discussion covers several major types of distribution systems and practical modifications of them.
- Simple radial
- Loop-primary system— radial secondary system
- Primary selective system— secondary radial system
- Two-source primary— secondary selective system
- Sparing transformer system
- Simple spot network
- Medium voltage distribution system design
Table 1.1-7. Three-Phase Transformer Winding Connections

1. Simple Radial System
The conventional simple radial system receives power at the utility supply voltage at a single substation and steps the voltage down to the utilization level. In those cases where the customer receives his supply from the primary system and owns the primary switch and transformer along with the secondary low voltage switchboard or switch- gear, the equipment may take the form of a separate primary switch, separate transformer, and separate low voltage switchgear or switchboard. This equipment may be combined in the form of an outdoor pad-mounted transformer with internal primary fused switch and secondary main breaker feeding an indoor switchboard. Another alternative would be a secondary unit substation where the primary fused switch, transformer and secondary switchgear or switch- board are designed and installed as a close-coupled single assembly. In those cases where the utility owns the primary equipment and transformer, the supply to the customer is at the utilization voltage, and the service equipment then becomes low voltage main distribution switchgear or a switchboard.
Low voltage feeder circuits run from the switchgear or switchboard assemblies to panelboards that are located closer to their respective loads as shown in Figure 1.1-1. Each feeder is connected to the switch- gear or switchboard bus through a circuit breaker or other overcurrent protective device. A relatively small number of circuits are used to distribute power to the loads from the switch- gear or switchboard assemblies and panelboards. Because the entire load is served from a single source, full advantage can be taken of the diversity among the loads. This makes it possible to minimize the installed transformer capacity. However, the voltage regulation and efficiency of this system may be poor because of the low voltage feeders and single source. The cost of the low voltage- feeder circuits and their associated circuit breakers are high when the feeders are long and the peak demand is above 1000 kVA.
A fault on the secondary low voltage bus or in the source transformer will interrupt service to all loads. Service cannot be restored until the necessary repairs have been made. A low voltage feeder circuit fault will interrupt service to all loads supplied over that feeder. A modern and improved form of the conventional simple radial system distributes power at a primary voltage. The voltage is stepped down to utilization level in the several load areas within the building typically through secondary unit substation transformers. The transformers are usually connected to their associated load bus through a circuit breaker, as shown in Figure 1.1-2. Each secondary unit substation is an assembled unit consisting of a three-phase, liquid- filled or air-cooled transformer, an integrally connected primary fused switch, and low voltage switchgear or switch- board with circuit breakers or fused switches. Circuits are run to the loads from these low voltage protective devices.

Figure 1.1-1. Simple Radial System
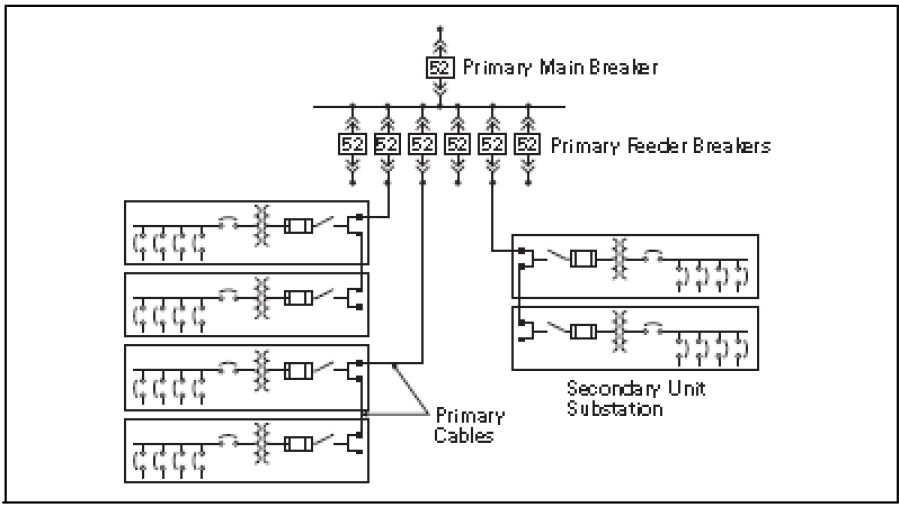
Figure 1.1-2. Primary and Secondary Simple Radial System
Because each transformer is located within a specific load area, it must have sufficient capacity to carry the peak load of that area. Consequently, if any diversity exists among the load area, this modified primary radial system requires more transformer capacity than the basic form of the simple radial system. However, because power is distributed to the load areas at a primary voltage, losses are reduced, voltage regulation is improved, feeder circuit costs are reduced substantially, and large low voltage feeder circuit breakers are eliminated. In many cases the interrupting duty imposed on the load circuit breakers is reduced. This modern form of the simple radial system will usually be lower in initial investment than most other types of primary distribution systems for buildings in which the peak load is above 1000 kVA. A fault on a primary feeder circuit or in one transformer will cause an outage to only those secondary loads served by that feeder or trans- former. In the case of a primary main bus fault or a utility service outage, service is interrupted to all loads until the trouble is eliminated. Reducing the number of transformers per primary feeder by adding more primary feeder circuits will improve the flexibility and service continuity of this system; the ultimate being one secondary unit substation per primary feeder circuit. This of course increases the investment in the system but minimizes the extent of an outage resulting from a transformer or primary feeder fault. Primary connections from one secondary unit substation to the next secondary unit substation can be made with “double” lugs on the unit substation primary switch as shown, or with separable connectors made in manholes or other locations.
Depending on the load kVA connected to each primary circuit and if no ground fault protection is desired for either the primary feeder conductors and trans- formers connected to that feeder or the main bus, the primary main and/or feeder breakers may be changed to primary fused switches. This will significantly reduce the first cost, but also decrease the level of conductor and equipment protection. Thus, should a fault or overload condition occur, downtime increases significantly and higher costs associated with increased damage levels and the need for fuse replacement is typically encountered. In addition, if only one primary fuse on a circuit opens, the secondary loads are then single phased, causing damage to low voltage motors.
Another approach to reducing costs is to eliminate the primary feeder breakers completely, and use a single primary main breaker or fused switch for protection of a single primary feeder circuit with all secondary unit substations supplied from this circuit. Although this system results in less initial equipment cost, system reliability is reduced drastically because a single fault in any part of the primary conductor would cause an outage to all loads within the facility.
2. Loop Primary System— Radial Secondary System
This system consists of one or more “PRIMARY LOOPS” with two or more transformers connected on the loop. This system is typically most effective when two services are available from the utility as shown in Figure 1.1-3. Each primary loop is operated such that one of the loop sectionalizing switches is kept open to prevent parallel operation of the sources. When secondary unit substations are used, each transformer may have its own duplex (2-load break switches with load side bus connection) sectionalizing switches and primary load break fused switch as shown in Figure 1.1-4 or utilizing three on-off switches or a four-position sectionalizing switch and vacuum fault interrupter (VFI) internal to the transformer saving cost and reducing footprint. When pad-mounted compartmentalized transformers are used, they are furnished with loop-feed oil-immersed gang-operated load break sectionalizing switches and Bay-O-Net expulsion fuses in series with partial range back- up current-limiting fuses. By operating the appropriate sectionalizing switches, it is possible to disconnect any section of the loop conductors from the rest of the system. In addition, it is possible to disconnect any transformer from the loop. A key interlocking scheme is normally recommended to prevent closing all sectionalizing devices in the loop. Each primary loop sectionalizing switch and the feeder breakers to the loop are interlocked such that to be closed they require a key (which is held captive until the switch or breaker is opened) and one less key than the number of key interlock cylinders is furnished. An extra key is provided to defeat the interlock under qualified supervision.
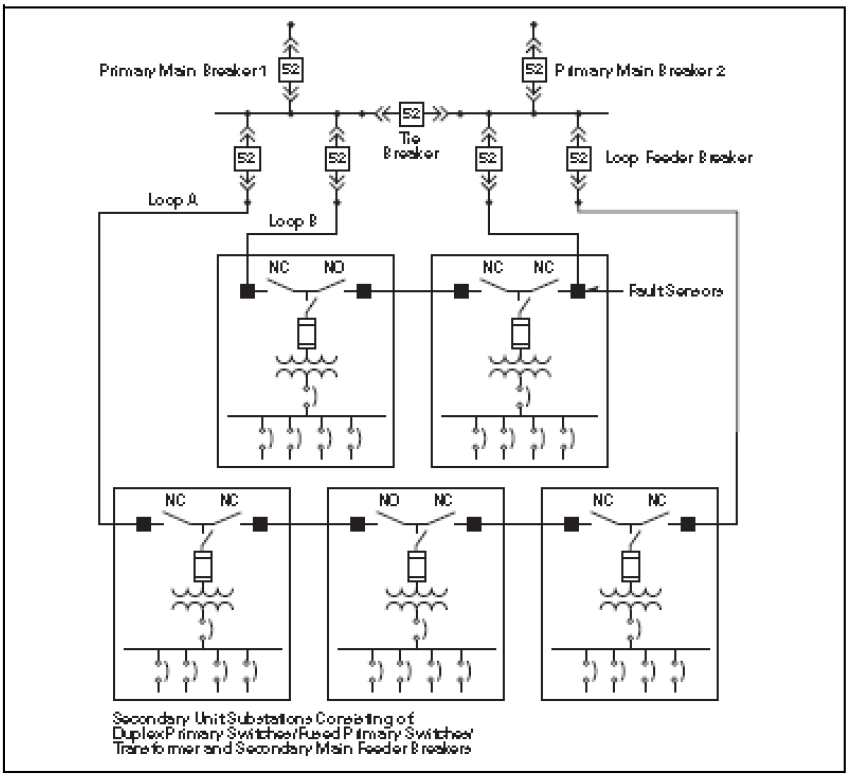
Figure 1.1-3. Loop Primary—Radial Secondary System
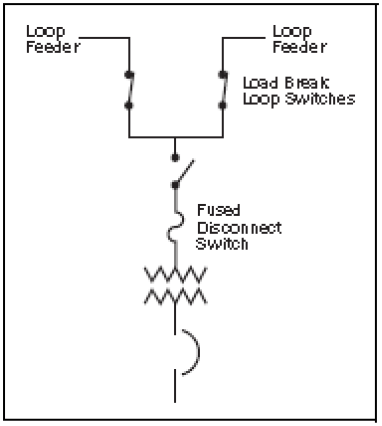
Figure 1.1-4. Secondary unit
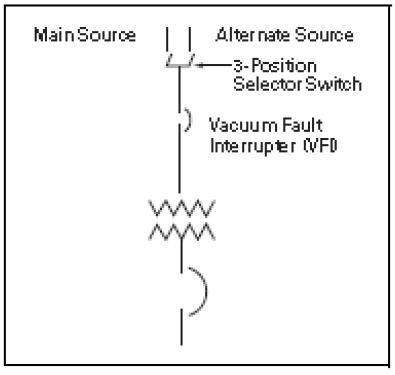
Figure 1.1-5. VFI/Selector Switch
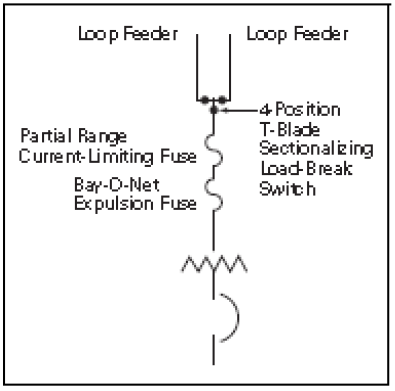
Figure 1.1-6. Pad-Mounted Switching Substation Loop Switching Combination Transformer Loop
In addition, the two primary main breakers, which are normally closed, and primary tie breaker, which is normally open, are either mechanically or electrically interlocked to prevent paralleling the incoming source lines. For slightly added cost, an automatic throw-over scheme can be added between the two main breakers and tie breaker. During the more common event of a utility outage, the automatic transfer scheme provides significantly reduced power outage time.
The system in Figure 1.1-3 has higher costs than in Figure 1.1-2, but offers increased reliability and quick restoration of service when 1) a utility outage occurs, 2) a primary feeder conductor fault occurs, or 3) a transformer fault or overload occurs.
Should a utility outage occur on one of the incoming lines, the associated primary main breaker is opened and the tie breaker closed either manually or through an automatic transfer scheme.
When a primary feeder conductor fault occurs, the associated loop feeder breaker opens and interrupts service to all loads up to the normally open primary loop load break switch (typically half of the loads). Once it is determined which section of primary cable has been faulted, the loop sectionalizing switches on each side of the faulted conductor can be opened, the loop sectionalizing switch that had been previously left open then closed and service restored to all secondary unit substations while the faulted conductor is replaced. If the fault should occur in a conductor directly on the load side of one of the loop feeder breakers, the loop feeder breaker is kept open after tripping and the next load side loop sectionalizing switch manually opened so that the faulted conductor can be sectionalized and replaced.
Note: Under this condition, all secondary unit substations are supplied through the other loop feeder circuit breaker, and thus all conductors around the loop should be sized to carry the entire load connected to the loop. Increasing the number of primary loops (two loops shown in Figure 1.1-8) will reduce the extent of the outage from a conductor fault, but will also increase the system investment.
When a transformer fault or overload occurs, the transformer primary fuses open, and the transformer primary switch manually opened, disconnecting the transformer from the loop, and leaving all other secondary unit substation loads unaffected.
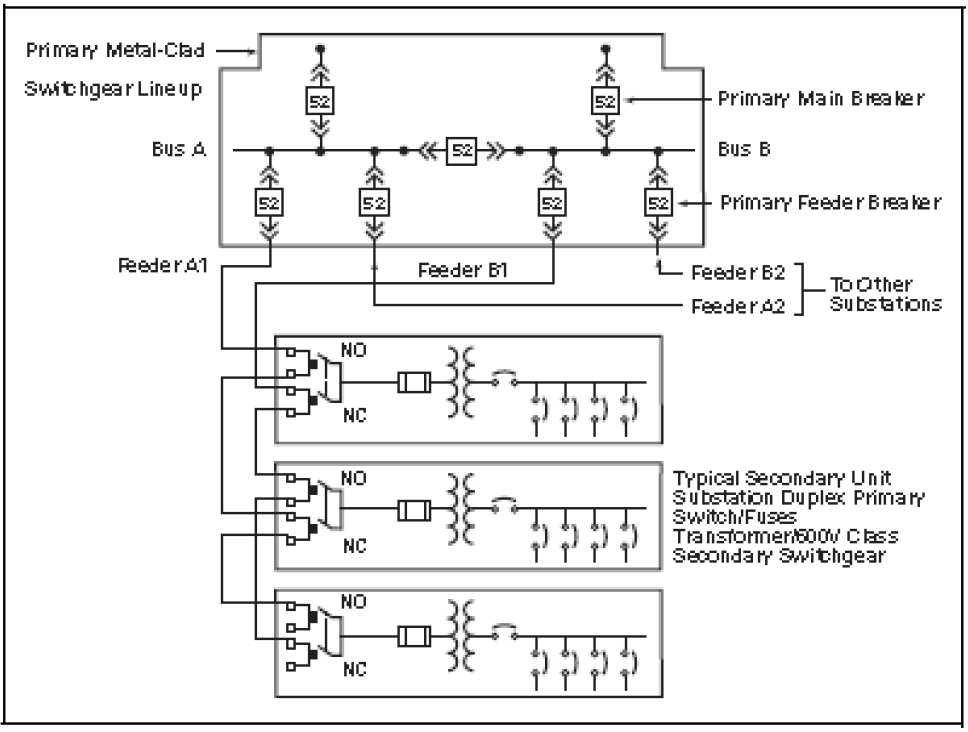
Figure 1.1-7. Basic Primary Selective—Radial Secondary System
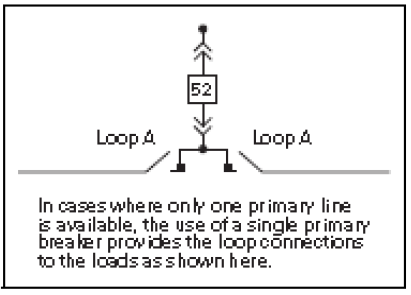
Figure 1.1-8. Single Primary Feeder – Loop System
A basic primary loop system that uses a single primary feeder breaker connected directly to two loop feeder switches which in turn then feed the loop is shown in Figure 1.1-8. In this basic system, the loop may be normally operated with one of the loop sectionalizing switches open as described above or with all loop sectionalizing switches closed. If a fault occurs in the basic primary loop system, the single loop feeder breaker trips, and secondary loads are lost until the faulted conductor is found and eliminated from the loop by opening the appropriate loop sectionalizing switches and then reclosing the breaker.
3. Primary Selective System— Secondary Radial System
The primary selective—secondary radial system, as shown in Figure 1.1-7, differs from those previously described in that it employs at least two primary feeder circuits in each load area. It is designed so that when one primary circuit is out of service, the remaining feeder or feeders have sufficient capacity to carry the total load. Half of the transformers are normally connected to each of the two feeders. When a fault occurs on one of the primary feeders, only half of the load in the building is dropped.
Duplex fused switches as shown in Figure 1.1-7 and detailed in Figure 1.1-9 may be utilized for this type of system. Each duplex fused switch consists of two (2) load break three-pole switches each in their own separate structure, connected together by bus bars on the load side. Typically, the load break switch closest to the transformer includes a fuse assembly with fuses. Mechanical and/or key interlocking is furnished such that both switches cannot be closed at the same time (to prevent parallel operation) and interlocking such that access to either switch or fuse assembly obtained unless both witches are opened.
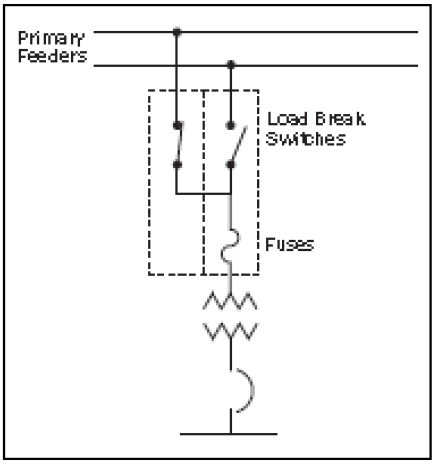
Figure 1.1-9. Duplex Fused switch in Two Structures
One alternate to the duplex switch arrangement, a non-load break selector switch mechanically interlocked with a load break fused switch can be used as shown in Figure 1.1-10. The non- load break selector switch is physically located in the rear of the load break fused switch, thus only requiring one structure and a lower cost and floor space savings over the duplex arrangement. The non-load break switch is mechanically interlocked to prevent its operation unless the load break switch is opened. The main disadvantage of the selector switch is that conductors from both circuits are terminated in the same structure.
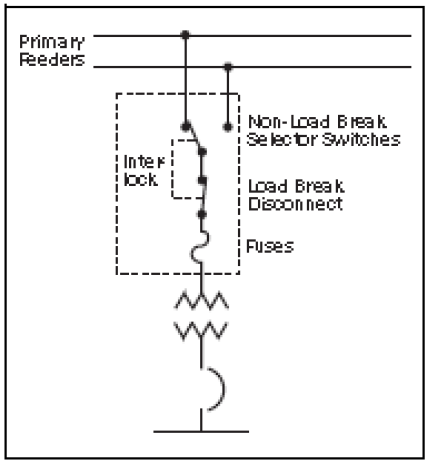
Figure 1.1-10. Fused Selector Switch in One Structure
This means limited cable space especially if double lugs are furnished for each line as shown in Figure 1.1-7 and should a faulted primary conductor have to be changed, both lines would have to be de-energized for safe changing of the faulted conductors. A second alternative is utilizing a three-position selector switch internal to the transformer, allowing only one primary feeder to be connected to the transformer at a time without the need for any interlocking. The selector switch is rated for load-breaking. If overcurrent protection is also required, a vacuum fault interrupter (VFI), also internal to the transformer, may be utilized, reducing floor space.
In Figure 1.1-7 when a primary feeder fault occurs, the associated feeder breaker opens and the transformers normally supplied from the faulted feeder are out of service. Then manually, each primary switch connected to the faulted line must be opened and then the alternate line primary switch can be closed connecting the trans- former to the live feeder, thus restoring service to all loads. Note that each of the primary circuit conductors for Feeder A1 and B1 must be sized to handle the sum of the loads normally connected to both A1 and B1. Similar sizing of Feeders A2 and B2, etc., is required. If a fault occurs in one transformer, the associated primary fuses blow and interrupt the service to just the load served by that transformer. Service cannot be restored to the loads normally served by the faulted transformer until the transformer is repaired or replaced.
Cost of the primary selective— secondary radial system is greater than that of the simple primary radial system of Figure 1.1-1 because of the additional primary main breakers, tie breaker, two-sources, increased number of feeder breakers, the use of primary- duplex or selector switches, and the greater amount of primary feeder cable required. The benefits from the reduction in the amount of load lost when a primary feeder is faulted, plus the quick restoration of service to all or most of the loads, may more than offset the greater cost. Having two sources allows for either manual or automatic transfer of the two primary main breakers and tie breaker should one of the sources become unavailable.
The primary selective-secondary radial system, however, may be less costly or more costly than a primary loop— secondary radial system of Figure 1.1-3 depending on the physical location of the transformers while offering comparable downtime and reliability. The cost of conductors for the two types of systems may vary greatly depending on the location of the transformers and loads within the facility and greatly override primary switching equipment cost differences between the two systems.
4. Two-Source Primary— Secondary Selective System
This system uses the same principle of duplicate sources from the power supply point using two primary main breakers and a primary tie breaker. The two primary main breakers and primary tie breaker being either manually or electrically interlocked to prevent closing all three at the same time and paralleling the sources. Upon loss of voltage on one source, a manual or automatic transfer to the alternate source line may be used to restore power to all primary loads.
Each transformer secondary is arranged in a typical double-ended unit substation arrangement as shown in Figure 1.1-11. The two secondary main breakers and secondary tie breaker of each unit substation are again either mechanically or electrically interlocked to prevent parallel operation. Upon loss of secondary source voltage on one side, manual or automatic transfer may be used to transfer the loads to the other side, thus restoring power to all secondary loads.
This arrangement permits quick restoration of service to all loads when a primary feeder or transformer fault occurs by opening the associated secondary main and closing the secondary tie breaker. If the loss of secondary voltage has occurred because of a primary feeder fault with the associated primary feeder breaker opening, then all secondary loads normally served by the faulted feeder would have to be transferred to the opposite primary feeder. This means each primary feeder conductor must be sized to carry the load on both sides of buses it is serving under secondary emergency transfer.
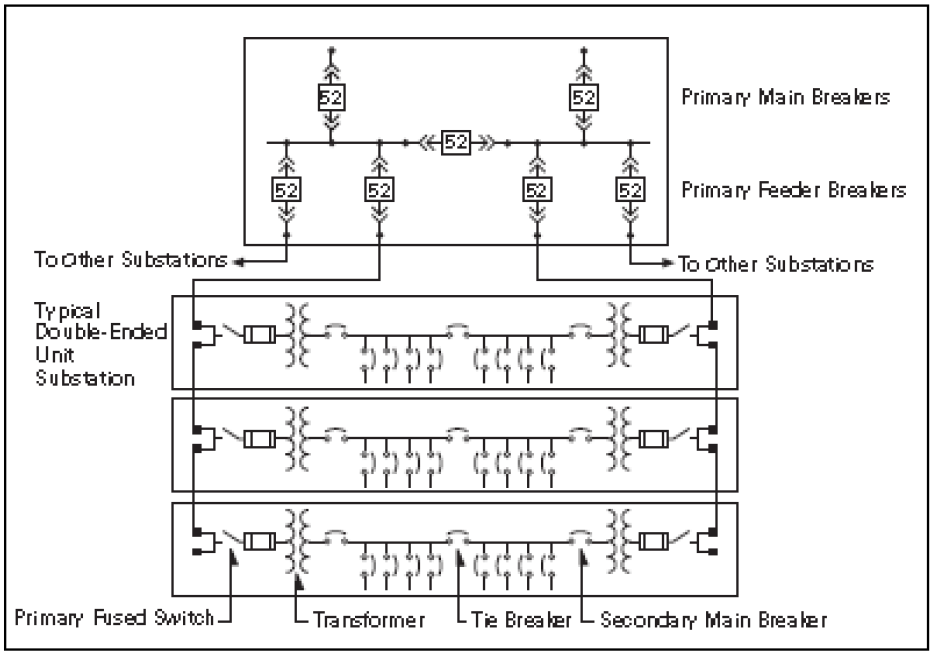
Figure 1.1-11. Two-Source Primary – Secondary Selective System
If the loss of voltage was due to a failure of one of the transformers in the double-ended unit substation, then the associated primary fuses would open taking only the failed transformer out of service, and then only the secondary loads normally served by the faulted transformer would have to be transferred to the opposite transformer. In either of the above emergency conditions, the in-service transformer of a double-ended unit substation would have to have the capability of serving the loads on both sides of the tie breaker. For this reason, transformers used in this application have equal kVA rating on each side of the double- ended unit substation and the normal operating maximum load on each transformer is typically about 2/3 base nameplate kVA rating. Typically these transformers are furnished with fan-cooling and/or lower than normal temperature rise such that under emergency conditions they can carry on a continuous basis the maximum load on both sides of the secondary tie breaker. Because of this spare trans- former capacity, the voltage regulation provided by the double-ended unit substation system under normal conditions is better than that of the systems previously discussed. The double-ended unit substation arrangement can be used in conjunction with any of the previous systems discussed, which involve two primary sources. Although not recommended, if allowed by the utility, momentary retransfer of loads to the restored source may be made closed transition (anti-parallel interlock schemes would have to be defeated) for either the primary or secondary systems. Under this condition, all equipment interrupting and momentary ratings should be suitable for the fault current available from both sources. For double-ended unit substations equipped with ground fault systems special consideration to transformer neutral grounding and equipment operation should be made. Where two single-ended unit substations are connected together by external tie conductors, it is recommended that a tie breaker be furnished at each end of the tie conductors.
5. Medium Voltage Distribution System Design
A. Single Bus, Figure 1.1-14
The sources (utility and/or generator(s)) are connected to a single bus. All feeders are connected to the same bus
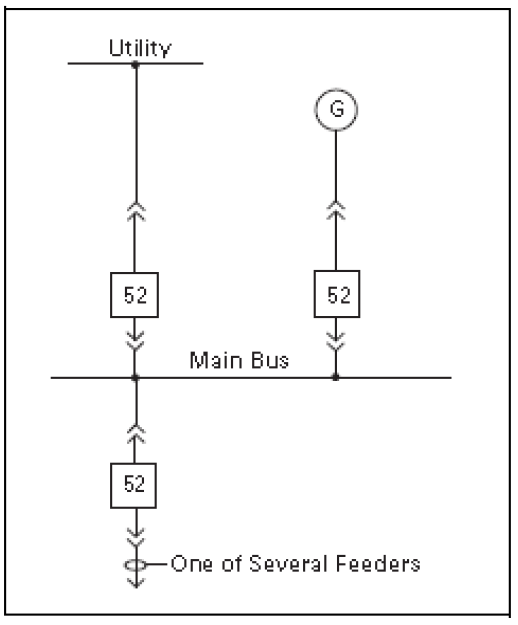
Figure 1.1-14. Single Bus
This configuration is the simplest system; however, outage of the utility results in total outage. Normally the generator does not have adequate capacity for the entire load. A properly relayed system equipped with load shedding, automatic voltage/ frequency control may be able to maintain partial system operation. Any future addition of breaker sections to the bus will require a shutdown of the bus, because there is no tie breaker.
B. Single Bus with Two Sources from the Utility, Figure 1.1-15
Same as the single bus, except that two utility sources are available. This system is operated normally with the main breaker to one source open. Upon loss of the normal service, the transfer to the standby normally open (NO) breaker can be automatic or manual. Automatic transfer is id service restoration specially in unattended stations.
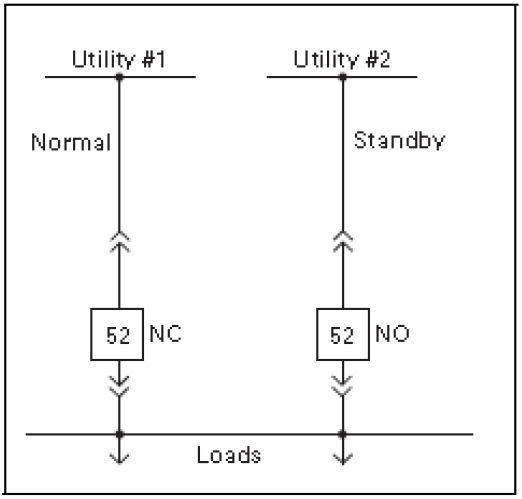
Figure 1.1-15. Single Bus with Two-Sources
Retransfer to the “Normal” can be closed transition subject to the approval of the utility. Closed transition momentarily (5–10 cycles) parallels both utility sources. Caution: when both sources are paralleled, the fault current available on the load side of the main device is the sum of the available fault current from each source plus the motor fault contribution. It is recommended that the short-circuit ratings of the bus, feeder breakers and all load side equipment are rated for the increased available fault current. If the utility requires open transfer, the disconnection of motors from the bus must be ensured by means of suitable time delay on reclosing as well as supervision of the bus voltage and its phase with respect to the incoming source voltage This busing scheme does not preclude the use of cogeneration, but requires the use of sophisticated automatic synchronizing and synchronism checking controls, in addition to the previously mentioned load shedding, automatic frequency and voltage controls.
This configuration is more expensive than the scheme shown in Figure 1.1-14, but service restoration is quicker. Again, a utility outage results in total outage to the load until transfer occurs. Extension of the bus or adding breakers requires a shutdown of the bus. If paralleling sources, reverse current, reverse power and other appropriate section should be added as requested by the utility.
Systems Analysis
A major consideration in the design of a distribution system is to ensure that it provides the required quality of service to the various loads. This includes serving each load under normal conditions and, under abnormal conditions, providing the desired protection to service and system apparatus so that interruptions of service are minimized consistent with good economic and mechanical design.
Under normal conditions, the important technical factors include voltage profile, losses, load flow, effects of motor starting, service continuity and reliability. The prime considerations under faulted conditions are apparatus protection, fault isolation and service continuity. During the system preliminary planning stage, before selection of the distribution apparatus, several distribution systems should be analyzed and evaluated, including both economic and technical factors. During this stage, if system size or complexity war- rant, it may be appropriate to provide a thorough review of each system under both normal and abnormal conditions.
- The principal types of computer programs used to provide system studies include:
- Short circuit—identify three-phase and line-to-ground fault currents and system impedances
- Arc flash—calculates arc flash energy levels, which leads to the selection of personal protective equipment(PPE)
- Circuit breaker duty—identify asymmetrical fault current based on X/R ratio
- Protective device coordination— determine characteristics and set- tings of medium voltage protective relays and fuses, and entire low voltage circuit breaker and fuse coordination
- Load flow—simulate normal load conditions of system voltages, power factor, line and transformer loadings
- Motor starting—identify system voltages, motor terminal voltage, motor accelerating torque, and motor accelerating time when starting large motors
Short-circuit calculations define momentary and steady-state fault currents for LV and MV breaker and fuse duty and bus bracings at any selected location in the system, and also determine the effect on the system after removal of utility power due to breaker operation or scheduled power outages. Computer software programs can identify the fault current at any bus, in every line or source connected to the faulted bus, or to it and every adjacent bus, or to it and every bus that is one and two buses away, or currents in every line or source in the system. The results of these calculations permit optimizing service to the loads while properly applying distribution apparatus within their intended limits.
The following additional studies should be considered depending upon the type and complexity of the distribution system, the type of facility and the type of loads to be connected to the system:
- Harmonic analysis
- Transient stability
- Insulation coordination
- Grounding study
- Switching transient
*Mr. Nikola Zlatanov spent over 20 years working in the Capital Semiconductor Equipment Industry. His work at Gasonics, Novellus, Lam and KLA-Tencor involved progressing electrical engineering and management roles in disruptive technologies. Nikola received his Undergraduate degree in Electrical Engineering and Computer Systems from Technical University, Sofia, Bulgaria and completed a Graduate Program in Engineering Management at Santa Clara University. He is currently consulting for Fortune 500 companies as well as Startup ventures in Silicon Valley, California.