Published by
- John D. Kueck and Brendan J. Kirby, Oak Ridge National Laboratory
- Philip N. Overholt, U.S. Department of Energy
- Lawrence C. Markel, Sentech, Inc.
Published in Measurement Practices for Reliability and Power Quality: A Toolkit of Reliability Measurement Practices, 2004
Prepared by Oak Ridge National Laboratory Oak Ridge, Tennessee 37831-6285 managed by UT-BATTELLE, LLC for the U.S. Department of Energy under contract DE-AC05-00OR22725
Appendix D Summary Table: Power Quality Standards Development Activities
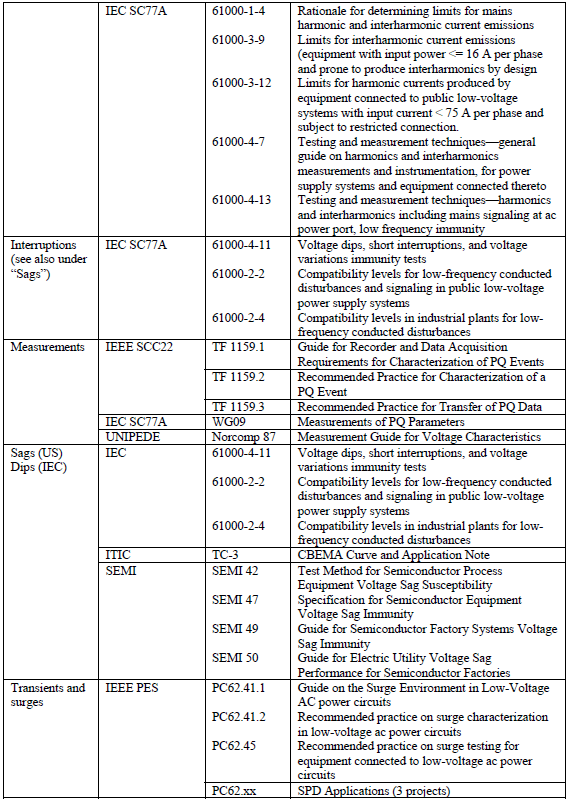
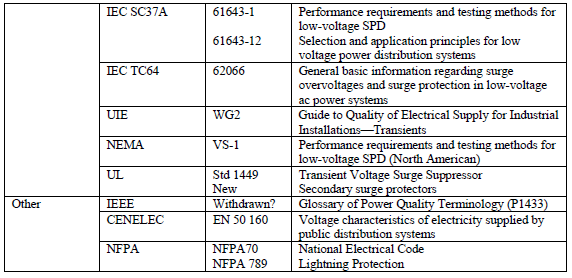
Table 2, provided by courtesy of EPRI-Power Electronics Applications Center, provides a listing of various power quality topics, the standards body working on the topic, the project reference, and the subject of the document.
Table 2. Power quality topics and related documents

Appendix E Discussion of the Quality–Reliability–Availability Approach
The electric power industry is beginning to look at reliability and quality of service as interrelated aspects of utility performance. Utility performance is no longer being considered independently of customer needs and responsibilities. The quality-reliability-availability (QRA) approach takes an integrated approach to power quality, service interruptions, end user requirements, and the service contract (written or implied) between the utility and its customers.
The Consortium for an Electric Infrastructure to Support a Digital Society (CEIDS) is proposing an alternative method for assessing power quality and reliability that uses the QRA approach. CEIDS is a joint initiative by EPRI and the Electricity Innovation Institute. The method includes definitions of power quality levels that add consideration of mean time between failure and mean time to repair, and assessment of QRA-enhancing options that maximize digital system uptime at optimal cost.
When quantifying the QRA of supply, it is important to define what constitutes a failure. Different loads respond in different ways to various voltage disturbances. It is appropriate to define several levels of quality because of this difference in response. The definition must go beyond traditional utility definitions of reliability (interruptions greater than 5 minutes) and include shorter-duration events that cause customer disturbances.
In order of the most sensitive definition of a failure to the least sensitive, the levels that are initially proposed by CEIDS are these:
- Level 1: Any voltage sags below those established by the Information Technology Industry Council (ITIC) in the guideline known as the “ITIC curve.” A failure is any voltage below 70% of nominal for greater than 0.02 seconds or below 80% of nominal for greater than 0.5 seconds. The steady-state values on the ITIC curve (voltage below 90% of nominal for more than 10 seconds) are excluded. The overvoltage portion of the ITIC curve is also excluded.
- Level 2: A failure occurs if the voltage drops below 70% of nominal voltage for more than 0.2 seconds.
- Level 3: A failure is an interruption of at least 1 second.
- Level 4: A failure is an interruption of at least 5 minutes.
For the QRA approach, assessing the effects of an outage on a customer helps indicate what reliability indices and statistics are important. For a factory, even a momentary outage may shut down a production line and require 6 hours of in-plant work to remove in-process material and restart the line. For this factory, it does not matter whether the utility has restored service in 5 minutes or in 3 hours. The factory wants fewer interruptions, not necessarily shorter ones. QRA looks at which types of reliability or service quality are most important. A recloser will cause a momentary outage on an entire feeder, but in doing so it will prevent a fuse blowing on a feeder branch, which would result in an extended outage for all the customers on that branch. The factory used as an example would rather have the occasional extended outage (fuse) than the more frequent momentary outage (recloser). However, if the customer can install an uninterruptible power supply (UPS) or storage that allows it to ride through a momentary or short outage (1 to 2 minutes), then the recloser plus UPS may dramatically reduce outage-related costs.
For a factory, even a momentary outage may shut down a production line and require hours of work to restart. For this factory, it does not matter whether the utility restores services in 5 minutes or in 3 hours. The factory wants fewer interruptions, not necessarily shorter ones.
This is not a radical departure from the types of calculations and assessments that utilities, customers, and regulators have always done; but if the process is formalized, electricity consumers can know what level of reliability they should expect and all parties can compare the costs of improving reliability through system improvements (e.g., installing an alternate feed), versus improving reliability through customer-side measures (e.g., installing a UPS), versus costs incurred by the customers if reliability is not improved. The QRA approach begins to bridge the gap between generation, transmission, and distribution reliability assessment because it looks not only at the value of reliability but also at how best to improve the reliability (e.g., frequency versus duration of outages).
We anticipate that QRA may become a “best practice” for assessment of reliability and service quality.
