John D. Kueck and Brendan J. Kirby, Oak Ridge National Laboratory
Philip N. Overholt, U.S. Department of Energy
Lawrence C. Markel, Sentech, Inc.
Published in Measurement Practices for Reliability and Power Quality: A Toolkit of Reliability Measurement Practices, 2004
Prepared by Oak Ridge National Laboratory Oak Ridge, Tennessee 37831-6285 managed by UT-BATTELLE, LLC for the U.S. Department of Energy under contract DE-AC05-00OR22725
Reliability: Definition and Discussion
In brief, reliability has to do with total electric interruptions – complete loss of voltage, not just deformations of the electric sine wave. Reliability does not cover sags, swells, impulses or harmonics. Reliability indices typically consider such aspects as
the number of customers;
the connected load;
the duration of the interruption measured in seconds, minutes, hours, or days;
the amount of power (kVA) interrupted; and
the frequency of interruptions.
Power reliability can be defined as the degree to which the performance of the elements in a bulk system results in electricity being delivered to customers within accepted standards and in the amount desired. The degree of reliability may be measured by the frequency, duration, and magnitude of adverse effects on the electric supply.1
There are many indices for measuring reliability. The three most common are referred to as SAIFI, SAIDI, and CAIDI, defined in IEEE Standard 1366 (see Appendix A).
SAIFI, or system average interruption frequency index, is the average frequency of sustained interruptions per customer over a predefined area. It is the total number of customer interruptions divided by the total number of customers served.
SAIDI, or system average interruption duration index, is commonly referred to as customer minutes of interruption or customer hours, and is designed to provide information as to the average time the customers are interrupted. It is the sum of the restoration time for each interruption event times the number of interrupted customers for each interruption event divided by the total number of customers.
CAIDI, or customer average interruption duration index, is the average time needed to restore service to the average customer per sustained interruption. It is the sum of customer interruption durations divided by the total number of customer interruptions.
A reliability index that considers momentary interruptions is MAIFI, or momentary average interruption frequency index.
MAIFI is the total number of customer momentary interruptions divided by the total number of customers served. Momentary interruptions are defined in IEEE Std. 1366 as those that result from each single operation of an interrupting device such as a recloser.
The major drawback to reliability metrics is that there is a great deal of debate about comparing these indices from one geographic area to another and exactly how the input data is to be applied in making the calculations. This is discussed further in Chapter 6, “Pitfalls in Methods for Reliability Index Calculation.” In addition, there are concerns about how to “normalize” the indices for adverse weather. Many state public utility commissions require utilities to compute and track certain reliability indices, but comparing them from region to region and utility to utility has been problematic due to differences in how the data is applied, system designs, weather differences, and even differences in vegetation growth. Because of this, the indices are limited in their usefulness. If the calculation method is kept the same, they are useful within a specific geographic area in evaluating changes in reliability over time, perhaps as a measurement of the effectiveness of maintenance practices.
Reference
Electric Power Research Institute, Dynamics of Interconnected Power Systems, A Tutorial for System Dispatchers and Plant Operators, prepared by Power Technologies, Inc., Schenectady, N.Y., for the Electric Power Research Institute, Palo Alto, Calif., May 1989.
Appendix A Terms and Definitions of Reliability
Major Sources for Terms and Definitions
The following is a list and brief synopsis of many of the major sources for terms and definitions of reliability and service quality. This list is not intended to capture every single definition, but rather, the important ones that are in common use or practice today.
IEEE Tutorial Course:“Probability Analysis of Power System Reliability,” Course Text 71 M30-PWR (1971)
Organization: The Institute of Electrical and Electronics Engineers (IEEE) Targeted industry segment: Utility power system planners—bulk power and distribution systems
Limitations: This defines the terms and introduces the calculation techniques for power system reliability indices, but it does not address variations in methods for calculating the indices. As an older reference, it is not current on some reliability issues, such as demand-side management. Power quality is not addressed.
Strengths: It introduces concepts of power system reliability and provides consensus definitions of reliability terms and indices.
IEEE Std. 1366-1998:Trial Use Guide for Electric Power Distribution Reliability Indices
Organization: IEEE
Targeted industry segment: Utility distribution systems and substations and defined regions
Limitations: This standard deals primarily with interruptions over one minute and defines such indices as SAIFI (system average interruption frequency index), SAIDI (system average interruption duration index), and CAIDI (customer average interruption duration index). The indices are concerned with both the duration and frequency of interruption.
Strengths: These are the indices that are commonly reported in reliability surveys. The standard shows the mathematical definition of the indices and gives examples of their calculation.
Other: Although these are the most common indices, they do not include the voltage sag and dip disturbances that are so troubling to digital equipment. Also, there is a great deal of debate about comparing these indices from one geographic area to another, because rural areas, or areas with high lightning activity, are expected to have a higher number of outages than densely populated urban areas with network distribution systems, for example.
IEEE Std. 762:Definitions for Use in Reporting Electric Generating Unit Reliability, Availability and Productivity
Organization: IEEE
Targeted industry segment: Utility power system planners
Limitations: Does not treat intermittent generation, as from renewable sources (wind, solar), according to the generally accepted method.
Strengths: Defines and classifies parameters for use in generation availability reporting. Terms such as “maximum capacity,” “planned derating,” and “forced outage hours” are defined.
IEEE Std. 859-1987:Standard Terms for Reporting and Analyzing Outage Occurrences and Outage States of Electrical Transmission Facilities
Organization: IEEE
Targeted industry segment: Transmission system modeling and reliability evaluation
Limitations: The standard provides outage definitions and indices that are intended for use in system planning models, operations and maintenance planning, and system design. It is not intended to provide guidance on how to perform quantitative evaluations of system reliability, and it provides no guidance other than to give definitions for key indices.
Strengths: The standard provides the definitions of a number of common transmission indices such as “outage rate,” “failure rate,” and “mean time to outage.”
Other: The standard also provides definitions for terms such as “component availability” and “probability of failure to operate on command.” These indices are used by engineers involved in analyzing and predicting outages of transmission facilities.
IEEE Std. 493-1997:Recommended Practice for Design of Reliable Industrial and Commercial Power Systems (IEEE Gold Book)
Organization: IEEE
Targeted industry segment: Industrial and commercial electric power distribution systems. This standard could be used for microgrids.
Limitations: This standard is directed toward the designers and users of industrial power systems. It is not intended for utility distribution or transmission systems.
Strengths: The standard provides historical component reliability data that can be used in a quantitative evaluation of the industrial power system to compute load interruption frequency, expected duration of load interruption events, total expected interruption time per year, and system availability as measured at a specific load supply point.
Other: The method used for the evaluation is the minimal-cut-set method. System weak points can readily be identified.
Electricity Distribution Price Review—Reliability Service Standards, working document to benchmark Australian utility service quality
Organization: Office of the Regulator General, Australia
Targeted industry segment: Australian utilities and their customers
Limitations: This is an ongoing activity; therefore, the standards being developed are not yet available to the general public.
Strengths: The objective of this activity is to develop performance-based rates, including both reliability and service quality, by applying IEEE 1366 and monitoring the performance of distribution feeders. Observed levels of reliability and power quality will be used to establish benchmarks for feeders (by type of feeder and types of customers served) to set service quality targets. The utility’s incentive to meet or exceed the targets is through performance-based rates. This is an important attempt to apply indices to setting service quality and reliability standards, relating system performance to price (tariffs), and establishing benchmark levels for power system performance that are related to characteristics of the customers being served.
Other: The Electric Power Research Institute (EPRI) is developing a similar approach for U.S. utilities that goes beyond performance-based rates and IEEE 1366 to a QRA approach (see “Assessing and Evaluating Reliability,” in Chapter 2).
State of Illinois: Title 83 Public Utilities, Chapter 1: “Illinois Commerce Commission,”
Subchapter C: “Electric Utilities,” Part 411, “Electric Reliability”
Organization: Illinois Commerce Commission
Targeted industry segment: Illinois utilities
Limitations: Code language for the state of Illinois. Does not specify reliability levels: “design according to generally accepted engineering practices.” The utility is required to state what those practices are.
Strengths: Defines reliability terms and record-keeping requirements for Illinois utilities. Classifies outage causes, defines procedures and formats for annual reliability reports and assessments.
Other: Unique to one state’s requirements
Emerald Contract: power supply contract under the “Green Rate”
Organization: Electricite de France (EdF)
Targeted industry segment: Green Rate customers of EdF
Limitations: The topology of the French power system, particularly the distribution system, is unlike that of the U.S. power system. Also, EdF is a government-owned, vertically-integrated monopoly; it doesn’t operate in the same type of competitive environment as U.S. utilities. (However, European union rules on competition and third party access may change this.) This is a contract of a single utility.
Strengths: The contract contains an appendix that lists disturbances that may affect the quality of electric power, includes simplified definitions, and delineates EdF commitments and minimum acceptable levels of service quality and reliability. It also specifies the tolerances with which the customer should comply concerning disturbances generated by customer-owned equipment that could be injected into the EdF network.
Other: Provides an example of service quality commitments from the utility to the customer and requirements imposed upon the customer by the utility. Even if the numbers are not directly applicable to the United States, this approach could be applicable.
Quality of Supply Standards, User Specification, ESKOM, South Africa, NRS 048-1996
Organization: ESKOM and South Africa’s National Electricity Regulator
Targeted industry segment: Electric utility and customers
Limitations: This is one utility’s guideline, applied to a non-U.S. power system.
Strengths: This specification provides the South African electricity supply industry with a basis for evaluating the quality of supply delivered to customers by the industry, and with a means of determining whether utilities meet the minimum standards required by the National Electricity Regulator. The underlying principle is that, on a national basis, the combined cost of supply and usage of electricity be minimized. The specification recognizes that quality is affected by the users (as a result of the nature of the loads connected), as well as by the producers or suppliers. Customers are therefore essential partners with utilities in the effort to maintain the quality of supply while the supply networks are expanded and developed to allow electrification of South Africa to proceed effectively and economically. The specification deals with the voltage characteristics in statistical or probabilistic terms. NRS 048 provides an overview of standards and procedures for the management of the quality of supply in the electricity supply industry, with particular reference to the application of minimum standards to meet the requirements of the National Electricity Regulator. NRS 048 does not cover safety requirements, network design or equipment performance.
Reliability and Power Quality Performance-based Tariffs
Organization: DTE Energy (Detroit Edison Company)
Targeted industry segment: Three large industrial customers
Limitations: This is one utility’s strategy to retain customers by guaranteeing that the power supply system will meet performance criteria. Manufacturing facilities of the Big Three automakers had experienced higher-than-normal outages and voltage sags that had resulted in significant manufacturing losses. Faced with the possibility that these customers would turn to another energy supplier or self-generate, DTE offered a performance guarantee. The initial contract specified that DTE would pay stipulated “damage” costs to customers if they experienced more interruptions than specified in the contract. This performance guarantee was later expanded to include instances of voltage sags (i.e., power quality). DTE implemented measures to improve the reliability, and the resulting performance has almost completely met the reliability criteria. The power quality criterion has not been violated. The criteria were set based on historical performance, with an assumed year-by-year reliability improvement. The utility did a reliability assessment for each plant, and since existing problems or weak points were corrected, the plants’ reliability has been acceptable. The corrective actions seemed consistent with standard utility practices to provide acceptable quality service; it appears that the tariff and its penalty levels were designed more on a marketing basis than from a cost analysis. The tariff (1) retained the customers and protected DTE from competition for 5 years, (2) was used to economically justify reliability improvements that might have been within current best practices anyway, and (3) has not resulted in any significant performance payments to the customers.
Strengths: Despite its limitations, this is the first well-documented instance of service quality guarantees being included in customer agreements that recognized the utility’s obligation to meet at least a minimum level of reliability and power quality.
Other: The concept of performance-based rates and service quality guarantees seems to be gaining acceptance by utilities and regulators.
Other Sources for Terms and Definitions
Several sources define terms such as “sag,” “notch,” “undervoltage,” and “swell,” but not always consistently. Some of the more prominent references are these:
IEEE Std. 100-1988, IEEE Standard Dictionary of Electrical and Electronic Terms
IEEE Std. 1100-1999, IEEE Recommended Practice for Powering and Grounding Electronic Equipment
IEEE Std. 1159-1995, IEEE Recommended Practice for Monitoring Electrical Power Quality
American National Standards Institute/National Fire Protection Association, Standard 70, National Electric Code
B. Kennedy, Power Quality Primer, New York: McGraw Hill, 20
Organizations: Various organizations
Targeted industry segment: All in the power industry, including consumers, designers and electricians
Limitations: Terminology and definitions are still evolving, both within the United States and internationally, although there are attempts to make U.S. definitions consistent with international [International Electrotechnical Commission (IEC)] definitions. A major problem has been inconsistencies among utility power system designers, industrial power distribution designers, and end users. The rise in electronic loads (“the digital society”) means that some power system phenomena that previously were of no consequence are now critically important to the end users’ processes or can threaten personnel safety. There is not yet a single recognized standard for definitions and calculation techniques, but many industry groups are working together to remedy this situation.
Strengths: The references cited will provide a good foundation for power quality terminology. The Power Quality Primer provides an excellent overview of power quality concerns for both the provider and consumer.
Other: Industry groups, such as IEEE, are close to agreement on common terminology and definitions. Some of these standards (i.e., 1100, 1159) are listed again in the Power Quality Standards, as they provide requirements or guidelines in addition to definition
John D. Kueck and Brendan J. Kirby, Oak Ridge National Laboratory
Philip N. Overholt, U.S. Department of Energy
Lawrence C. Markel, Sentech, Inc.
Published in Measurement Practices for Reliability and Power Quality: A Toolkit of Reliability Measurement Practices, 2004
Prepared by Oak Ridge National Laboratory Oak Ridge, Tennessee 37831-6285 managed by UT-BATTELLE, LLC for the U.S. Department of Energy under contract DE-AC05-00OR22725
Introduction and Discussion of the Measurement “Toolkit”
This report provides a distribution reliability measurement “toolkit” that is intended to be an asset to regulators, utilities and power users. The metrics and standards discussed range from simple reliability, to power quality, to the new blend of reliability and power quality analysis that is now developing. This report was sponsored by the Office of Electric Transmission and Distribution, U.S. Department of Energy (DOE).
Inconsistencies presently exist in commonly agreed-upon practices for measuring the reliability of the distribution systems. However, efforts are being made by a number of organizations to develop solutions. In addition, there is growing interest in methods or standards for measuring power quality, and in defining power quality levels that are acceptable to various industries or user groups. The problems and solutions vary widely among geographic areas and among large investor-owned utilities, rural cooperatives, and municipal utilities; but there is still a great degree of commonality. Industry organizations such as the National Rural Electric Cooperative Association (NRECA), the Electric Power Research Institute (EPRI), the American Public Power Association (APPA), and the Institute of Electrical and Electronics Engineers (IEEE) have made tremendous strides in preparing self-assessment templates, optimization guides, diagnostic techniques, and better definitions of reliability and power quality measures. In addition, public utility commissions have developed codes and methods for assessing performance that consider local needs. There is considerable overlap among these various organizations, and we see real opportunity and value in sharing these methods, guides, and standards in this report.
This report provides a “toolkit” containing synopses of noteworthy reliability measurement practices. The toolkit has been developed to address the interests of three groups: electric power users, utilities, and regulators. The report will also serve to support activities to develop and share information among industry and regulatory participants about critical resources and practices.
The toolkit has been developed by investigating the status of indices and definitions, surveying utility organizations on information sharing, and preparing summaries of reliability standards and monitoring requirements—the issues, needs, work under way, existing standards, practices and guidelines—for the following three classifications:
terms and definitions of reliability;
power quality standards, guidelines, and measurements;
activities and organizations developing and sharing information on distribution reliability.
As these synopses of reliability measurement practices are provided, it must be noted that an economic penalty may be associated with requiring too high a reliability level from the distribution system for all customers. It may be appropriate for the distribution system to supply only some base, generally accepted level of reliability. This base level would be adequate for the majority of customers. Users who need a higher level may find it economical to supply using distributed energy resources (DER) and other local solutions to reliability and power quality needs. Local solutions implemented by the customer may be the most cost-effective method for addressing the more stringent needs of a digital economy. These local solutions include energy storage, small distributed generators, and microgrids.
This report also considers the market’s role in addressing reliability issues and requirements. The customer’s needs are discussed in view of issues such as power quality requirements of digital electronic equipment, the cost of outages, the cost of storage and new infrastructure, and natural gas prices. The market role in addressing these issues and requirements is explored. The economic considerations associated with the reliability issues are discussed, as well as the levels at which these economic decisions could be made. Finally, a discussion is provided of the role DER could play in addressing reliability needs, and the possible role of the market in providing needed levels of reliability. The toolkit is provided in a set of appendices. These appendices are summarized as follows:
A. Terms and Definitions of Reliability—a listing and synopsis of the major standards and codes for reliability
B. Power Quality Standards, Guidelines, and Measurements—a listing and synopsis of the significant standards for power quality
C. Activities and Organizations Developing and Sharing Information on Reliability and Power Quality—a list of organizations having a significant ongoing activity in power quality and reliability
D. Summary Table: Power Quality Development Activities—a succinct table which provides the power quality topic, the standards body, the project identification, and the title of the document
E. Discussion of the Quality–Reliability–Availability Approach—an EPRI initiative that takes an integrated look at power quality, reliability, end user needs, and the service contract
F. Industry Initiatives to Define Power Quality (SEMI, CBEMA, ITIC)—a summary of specific acceptable levels of power quality established by three industry organizations.
This report provides a measurement “toolkit” to address the interests of electricity users, utilities, and regulators.
Acknowledgments
The authors wish to thank Thomas Key and Arshad Mansoor of EPRI-PEAC, Georg Shultz of Rural Utilities Service, Mike Hyland of the American Public Power Association, Steven Lindenberg and Robert Saint of NRECA, Bernard Ziemaniek of EPRI, and Diane Barney of the NARUC Subcommittee on Electric Reliability Review for their kind contributions and review of this document.
Published by Vladimir Kraz, OnFILTER, Inc. 3601-B Soquel, CA 95073 USA, Tel. +1-831-824-4052, Email: vkraz@onfilter.com
Abstract
This paper describes some aspects of methodology, instrumentation and techniques of measuring high-frequency electrical noise (EMI) in electronic manufacturing environment. High frequency measurements are quite different from typical ESD-related measurements which this paper explores.
Introduction
High-frequency noise (often, albeit technically incorrectly, called “EMI”) is one of the sources of electrical overstress (EOS) that damages sensitive components. It also causes malfunction of electronic equipment.
A parameter that cannot be measured cannot be controlled. Measurements of high-frequency signals differ radically from measurements of traditional ESD parameters. This paper will present methodology and techniques for some common high-frequency measurements in manufacturing environment as well as outline critical properties of the EMI and EOS signals as related to a manufacturing environment. Many details are omitted due to limitations of space.
The basic differences between EMI and ESD measurements
Most ESD measurements deal with DC or extremely low-frequency signals of very high impedance. Examples include static field or voltage, high resistance values of dissipative materials, ionization balance and alike. This is exactly opposite to measurements of high frequency signals which require high bandwidth, often to up to gigahertz range, and, especially for conducted measurements, matched low impedance of the instrument. Use of common-type ESD instrumentation or other general-purpose tools produces not only inaccurate results, it simply cannot produce any relevant results at all. As an example, consider ubiquitous static field meter. Its vibrating sensor works at a frequency of ~300…600Hz and after signal processing the theoretical bandwidth of 1/2 of that frequency ends up to be of less than 10…15Hz. The refresh rate of the display further limits it to ~3Hz or less.
Feedback-operated instruments, such as certain static voltmeters and CPMs have similarly low bandwidth. As a reference, conducted EMI on power lines starts at several tens of kilohertz and radiated emission of consequence starts at low megahertz. Common multimeter or current clamp have typical bandwidth of up to several kilohertz with the best of them up to few hundred kilohertz, which is grossly insufficient. Thus, a completely different set of tools and a very different methodology needs to be used by an ESD specialist for analysis of EMI environment.
Fundamentals of High-Frequency Signal Metrology
Measurement Types: High-frequency signal measurements can be of time domain, frequency domain, or broadband.
Frequency domain
Frequency domain measurements while incapable of discerning the waveform of the signal, are capable of providing the spectral characteristics of the signal. Most of applications for frequency domain measurements are in EMC compliance tests, wired and wireless communication and broadcast. Frequency domain measurements are performed with specialized instruments – spectrum analyzers – and to a lesser degree using FFT function of some oscilloscopes.
Time Domain
In time domain the waveform of the signal is studied and a variety of parameters are collected, among them are peak, average or RMS values, rise and fall times, energy, repetition rate and others. Time domain measurements are especially suited for transient signals, such as artifacts of ESD Events, noise on power (AC and DC) lines, ground and alike. Time domain measurements are made with an oscilloscope. Most high-frequency measurements in electronic manufacturing environment are time domain.
Broadband
Broadband measurements provide data only on one parameter of the signal – its amplitude regardless of signal frequency, waveform and anything else. A ubiquitous multimeter is a broadband instrument. Since time-domain measurements are prevalent for electronic manufacturing environment the rest of this paper focuses of this type of measurements.
Coaxial Cables
Essential test accessory for measurement of high frequency signals is coaxial cable of the right type. Coaxial cable provides two benefits for high frequency measurements: shielding of often weak measured signal from outside influence and elimination of induced loop currents that would be present in case of conventional test leads spread apart. Of course, a proper coaxial cable need to be selected. Among the parameters to watch for are cable impedance and attenuation at high frequencies within the band of interest. A note of caution: coaxial cables are fragile by nature. Bending and kinking them will irreversibly damage them causing signal distortion.
Impedance Matching
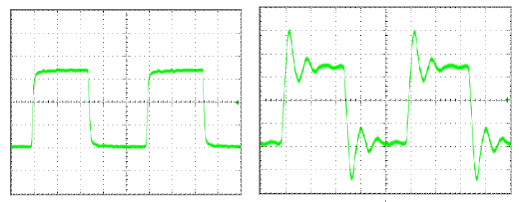
At high frequencies the impedance matching is a must for most cases – impedance mismatch leads to signal distortions and ringing. The most typical output and input impedance of high-frequency instruments is 50 Ohms, although in some cases, such as TV cable, it may be 75 Ohms. Figure 1 shows the same signal measured with matched impedance (50 Ohms) and mismatched impedance (an oscilloscope set to 1M). As seen, mismatched impedance causes significant ringing of the signal and also readings of higher peak amplitude.
Figure 1. The same signal measured with matched (a) and mismatched (b) impedance
A good example of a mismatch is measurements of ESD Events using a passive near field probe (usually “ball” or “stick” antenna) and an oscilloscope as described in [1] and [2]. Such passive near-field probes which are, in essence, small antennae, may have 50 Ohms impedance only at some particular frequency. Since an ESD Event signal has wide spectrum, there will be plenty of frequencies at which the output impedance of an antenna is not 50 Ohms and this causes significant ringing.
Ringing due to Boundary Effects
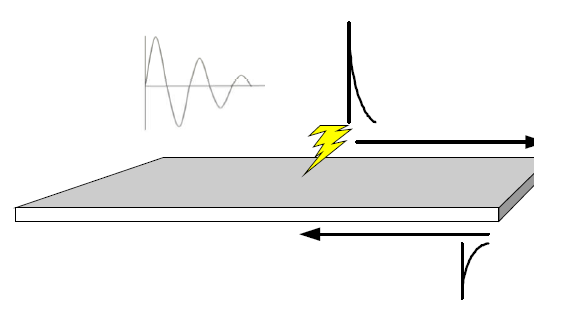
Reflections from the edges of board or other metal surface also cause ringing – ultimately, it is also an impedance mismatch. Figure 2 shows how the reflections at the edge of the PC board occur. This document provides good examples of ringing caused at least in part by the boundary reflections and how the timing of the reflections is defined by the size of the board [3].
Figure 2. Signal reflections due to boundary conditions
Not all ringing of ESD Event signals is artifacts of measurements – some are genuine signal, but separating it from the measurement errors need to be meticulously done.
Frequency Response
Radiated emission is measured using antennae. Most antennae do not have flat frequency response. Many are tuned to a specific frequency or band. Even broadband antennae, such as log periodic ones used for EMC test may have very uneven frequency response offering up to more than 20dB (10 times) difference in sensitivity (Antenna Factor – AF) within the band of interest (see Figure 3) [4]. When the measurements are done using spectrum analyzer which measures one frequency at a time, a correction factor can be applied for each frequency. However, no correction can be applied for time domain measurements since all frequencies are measured at once.
Figure 3. Log-periodic antenna and its antenna factor
The result is distorted waveform that misrepresent the amount of energy of the discharge. Figure 4 shows comparison between frequency responses and transient responses of a regular passive antenna (equivalent to the abovementioned “ball” antenna) and a specially-designed active antenna for ESD measurements with the flat frequency response. As seen, the regular frequently-used passive antenna has very poor response at low end of the spectrum.
Figure 4. Comparison between regular passive antenna and a special flat-frequency active antenna
This results in apparent absence of energy component of an ESD Event and misjudgment of its effect. A note: this active antenna has an inverting amplifier inside, therefore the polarities of the picked up signal appear to be opposite.
Oscilloscope Triggering
A typical oscilloscope triggers on either positive or negative threshold, but not on both. However, EMI transient signals can have peaks at either polarity. It is important to do signal capture using trigger on both polarities – positive and then negative. Neglecting any one polarity may cost you missed signal.
Many EMI events are multiple. If Single mode of triggering is used, only first such event is captured. If Normal mode is used, it would the display the last captured event. What happens between these events is thus lost. Some digital storage oscilloscopes have memory that can store more than one captured event which helps. Where the problem rises is in trying to observe both the waveforms of each event and the interval between them on one screen to understand the timing. The duration of an ESD Event may be only few nanoseconds but the spacing between multiple discharges may be several milliseconds or longer. Screen resolution is not sufficient to display such short events if several of them are captured in one shot. In such cases specialized monitors and data acquisition system may be required.
Multiple non-ESD EMI Events are much easier to capture and observe because such events have longer duration and their repetition rate is in the same range as the event’s duration.
Differential Signals and Ground Loops
Measurements of conducted emission with the scope are often made using regular oscilloscope probe. The problem is that ground contact of the probe is connected to mains’ ground via power cable of the scope. This creates ground loop because ground in the electrical outlet is not necessarily, and most likely not, ground vs. which the measurements should be made. In addition, this may add noise coming from the mains’ ground to the measured signal.
There are several ways to avoid the above problems. One is to use battery-powered oscilloscope. This would resolve ground loop problem, but will leave in place a problem of capacitive coupling between the chassis of the scope and grounded surfaces nearby. Another way is to use either a differential probe or two probes on two channels and use “A-B” function. This would eliminate the parasitic capacitance problem.
Figure 5. Special power line EMI Adapters
A third way is using special power line EMI adapters (Fig. 5) which provide balanced input and have single-channel output. They also protect oscilloscope from the potentially damaging voltages on measured conductors, such as power lines.
Measurements of noise on power lines
Noise on power lines of all kinds is the prime source of EMI in manufacturing environment. The biggest challenge of this type of measurements is that the signal of interest, i.e. high-frequency noise is significantly smaller than the AC mains voltage. In addition to not being able to see the desired signal, this also causes triggering problems. Another challenge is that high voltage on mains (250V RMS corresponds to 353V peak and required scope range of at least 700V on the screen. The solution to this problem is special power line EMI adapters which perform several functions: complete blockage of AC mains voltage while passing through high-frequency signals without alteration; balanced input and overload protection.
Waveform Properties
Once the waveform is captured by a high-speed digital storage oscilloscope, it needs to be properly analyzed. Depending on the purpose of the measurements sometimes different parameters may need to be considered.
Figure 6. Fundamental properties of ESD Event
ESD Events
The three critical parameters for analysis of properties of ESD Events as shown in Figure 6 are peak amplitude (either polarity), rise time and energy (area under the curve) [5]. Peak amplitude is a function of maximum discharge current through the device. Rise time indicates how fast the discharge energy flows into the device – the faster the worse for the device. “Area under the curve” of the pulse is an indication of how much energy was injected into the device. Another parameter to consider is whether multiple discharges are taking place (a frequent occurrence). This is important for two different reasons. One is that closely-spaced multiple discharges add to the energy of the discharge and may have cumulative effect; another is that measurements of multiple discharges requires special equipment and special techniques.
EMI of non-ESD Origin
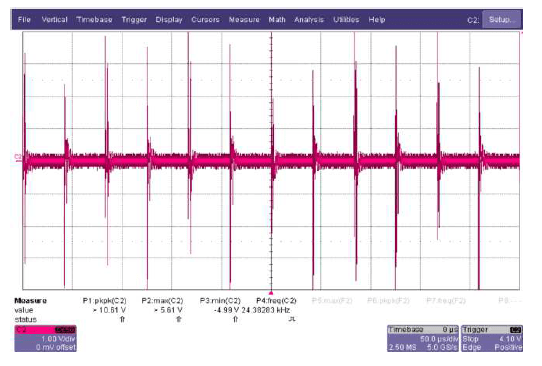
High-frequency noise in manufacturing environment is largely transient signals and repeatable pulsed signals. The waveform of the signals is quite different from the ESD Events. There is no sharp rise time; the ringing is frequently present and the signal is often periodic (Figure 7). The repetition of EMI signal is largely synchronized with one of the following:
AC mains. Note that the repetition frequency is twice the mains frequency, i.e. 100Hz for a 50Hz system and 120Hz for a 60Hz system.
Switching power supply frequency. This typically ranges anywhere from 40kHz to 1MHz
Servo motors. This frequency is often ranges from 8kHz to 20kHz.
Figure 7. Typical noise on power lines caused by light dimmer
There are also plenty of non-synchronized occasional EMI signals caused by turning on and off lights, motors and other electrical equipment, as well as operation or end switches and solenoids. For the narrow scope of electronic manufacturing environment, the following parameters are of interest: peak amplitude (both positive and negative), rise and fall times and energy (the area under the curve of the waveform). All these parameters except the last one are easily obtainable from the scope itself. The energy needs may need to be calculated from the collected captured waveform data. This is where flat frequency response of an antenna makes a difference between correct and incorrect data.
Real-Life Example: Servo Motor Noise
Semiconductor manufacturing tools such as wire bonders, IC handlers and alike use servo and variable-frequency motors. These motors utilize pulses that generate significant currents in tool’s ground which, in turn, can cause electrical overstress (EOS) in the devices. Two types of measurements can be made – voltage and current. Figure 8 shows current measurements in ground synchronized with the rise of the drive pulse.
Figure. 8 Ground Current in Servo Motor
Current measurements were made with Tektronix’ CT1 current probe.
Figure 9 shows reduction of ground current after connecting OnFILTER’ servo motor filter between the servo amplifier and the motor.
Figure 9a. Ground Current in Servo Motor without Filter: 1.12A
Figure 9b. Ground Current in Servo Motor with the Filter: 0.0186A
Figure 9c. Measurement Setup
As seen, the EMI and a possible EOS problem was easily identified, the mitigating measures were implemented (special servo motor filter) and the improvements were verified.
Conclusion
Proper measurement methodology and techniques are essential for effective management of EMI environment in manufacturing environment. Understanding of properties of high frequency signals and specifics of their measurements help ESD specialists at the factory to be successful in this endeavor.
References
[1]Unifying Factory ESD Measurements and Component ESD Stress Testing, J. Montoya et. al., ESD Symposium Proceeds, 2005 [2] Electrostatic Discharge Detection: Antenna and Oscilloscope, Intel instructional video, http://www.intel.com/content/www/us/en/quality/esd-detection-antenna-and oscilloscopevideo.html?wapkw=ball+antenna [3] Investigation on Discharge Current Waveforms in Board-Level CDM ESD Events With Different Board Sizes” Yuan-Wen Hsiao and Ming-Dou Ker, International ESD Workshop 2008 [4] Inside EMC Antennas, Tom Lecklider, Feb. 2010 [5] Verification of ESD Environment in Production, V. Kraz, Il Controllo dell’Elettricita Statica, Milano 29 Ottobre 2002
Published by Qing Zhong1, Wei Huang2, Shun Tao3, and Xiangning Xiao4
Abstract
Power quality (PQ) issues cause a lot economic loss. It is very helpful for the governmental decisions of the PQ policies and supervisions to know the PQ loss from macroscopical aspects. This paper presents the procedure and some interesting findings of the survey of PQ cost of the customers in Shanghai during 2010-2011. The survey was carried out in two steps with 147 valid questionnaire samples among 18 sectors and 40 face to face interviews among 7 sectors. Based on the statistics of the answer of the respondents, there is a lot of information about PQ issues in Shanghai, such as the most frequent PQ events, the most PQ sensitive devices, the causes of PQ events, the effectiveness of the mitigation devices and so on. Finally, the total PQ loss of respondents were counted. By the linear fitting analysis, the PQ cost and annual PQ loss in Shanghai can be estimated. The PQ cost estimation is with high reference value for the government who is in charge of the policies of PQ issues and the customers who select the technical and economic strategies for PQ problems.
Index Terms— Power Quality; Cost Analysis; Relevance Analysis; Macro Prediction
INTRODUCTION
With the development of the digital economics, the digital devices will play more and more important roles in the society. There is hardly a commercial or industrial facility that can suffer a loss of productivity if a serious PQ event were to impact its digital environment [1]. Therefore the economic impact of PQ issues on the whole society is to take serious consideration for the governments, utilities, device manufactures and power customers. PQ cost assessment is to know the PQ loss of the country or areas from macro-approach, which is helpful to execute the PQ management and select the right solution with optimal economic benefit.
IEEE published IEEE Standard 1346-1998 to give a guideline to investigate the economic aspect of PQ [2]. People focused on the cost of harmonics at first, including the additional energy loss, premature ageing and misoperation of the equipment [3][4]. Then with the high demand of the reliability, the methods to evaluate cost of outage had been developed [5][6]. In the recent digital society, the methods to estimate the loss of the voltage sag and short interruption was the hot point of the researches nowadays [7-9]. All the methods can be sorted as two approaches: deterministic and probabilistic. Probabilistic assessment has considered the probability of the PQ events, which is more flexible. The deterministic methods need a lot of economical data, which is very hard work.
There were many countries and areas had surveyed such questions including the loss of power interruption and other PQ issues. In 2001, EPRI published a report based on Primen survey in the United States, which showed that the collectively loss is $45.7 billion a year due to outages and another $6.7 billion a year due to other PQ phenomena. It was estimated that the U.S. economy loss between $104 billion to $164 billion due to outages and another $15 billion to $24 billion due to other PQ phenomena [10]. The Leonardo Power Quality Initiative (LPQI) team published a report about the results of European PQ survey, which comprised of 62 face-to-face interviews across eight European countries in 2008 [11]. The report showed that the PQ loss was about €150 billion, with industrial and services customers wasting around 4% and 0.142% of their annual turnover. In 2001, Taiwan did a survey of interruption cost for 284 high-tech factories. The cost of interruptions was represented as a customer damage function, which gave interruption cost as function of interruption duration. The cost in high-tech was about $37.03/kW for 2 seconds interruption, which was higher than traditional industries [12]. In South Korea, the Korea Electrotechnology Institute in cooperation with Gallup Korea conducted an interview-based survey on 660 industrial customers of various sizes and sectors. The survey presented a method to evaluate productions, sales and extra labor costs respectively, which was incurred from interruption duration and a method to evaluate interruption costs per power use according to interruption durations by industrial customer types [13]. There were many approximate works had done around work and achieve different results, from macro level, the impact of PQ on the society was very obvious and enormous.
In 2010, a survey on PQ cost of power customers was organized by Economic Operation Bureau, Development and Reform Commission, China and executed by Asia Power Quality Initiative (APQI), China Chapter. The survey made experiments in Shanghai, China, one of the largest international cities. The survey team was composed of governments, universities, institutes, utilities and customers. The survey was carried out in two steps with a duration from April 2010 to April 2011. The survey distributed about 500 questionnaires in 18 sectors and did 40 face-face interviews in 7 sectors. By the statics of the answer of the respondents, the PQ cost and annual loss could be estimated. The macro results of survey can help the government improving the PQ management policy and the customer understanding the true effect of PQ issues too.
This paper presents the designation, procedure some key results of the survey. The paper is organized as follows. Section II gives the scope and procedure of survey; section III gives the key results of PQ concerns from the statistics of the first step; section IV gives the key results from economic aspect of PQ, including the PQ loss statistics of the respondents and the PQ cost analysis in the second step. Finally, the survey is summarized and the main conclusions are drawn in the final section.
SURVEY DESIGNATION AND PROCEDURE
Scope of survey
There were 8 PQ problems investigated in the survey:
Long interruption (including planned and unplanned)
Short interruption
Voltage sag and swell
Harmonic
Unbalance
Flicker and fluctuation
Surge and transient
Power rationing
The respondents were distributed in 18 key sectors in Shanghai such as banks, foods, semiconductors and so on.
The structure of the PQ cost was in reference to the survey executed by LPQI in Europe [11]. The cost of PQ was composed of two categories: process interruption and noninterruption. The cost of process interruption was composed of six components:
Works in process (WIP)
Process slowing down
Process restarting
Equipments
Others
Savings
The cost of process non-interruption was the same as the cost of process interruption but excluding the WIP.
Survey designation and procedure
The survey was designed with two steps. Step one was carried out with questionnaire to evaluate the PQ concerns of the power customers and select the respondents for step two. Step two was carried out with face to face interviews. The respondents were acquired to fix the loss statistical forms which show the loss data of the power customers including 6 components of the PQ cost.
In step one, there were more than 500 questionnaires distributed to the power customers with different product values, power consumptions and supply voltage levels in 18 key sectors of Shanghai. But only 147 answers were valid. In step two, there were 40 face to face interviews with the respondents among 7 sectors, who were selected from step one. But only 29 answers were valid.
PQ EVENTS STATISTICS
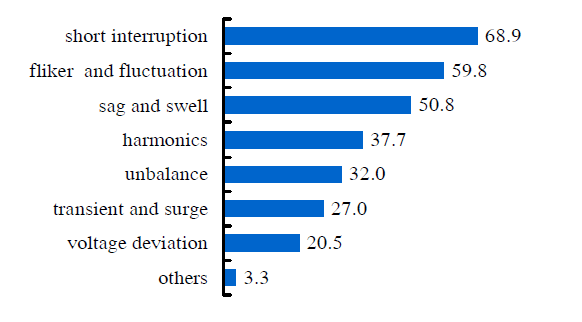
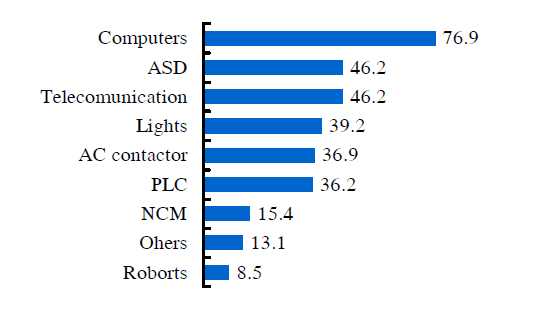
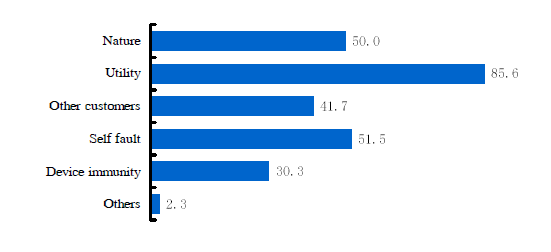
In step one, some aspects of PQ problem can be drawn from the questionnaires of respondents. The respondents chose the sort of PQ events which took effect on the production mostly. The results show in figure 1. 68.9% of respondents consider the short interruption is the first one. The second most PQ event was the flicker and fluctuation. But unfortunately, the customers often misunderstood the voltage sag as the voltage fluctuation. The devices affected by PQ events were shown in figure 2. The most sensitive device affected by PQ issues was computers, which was accepted by 76.9% of respondents. Considering the reasons which cause the PQ problem, the statistic results show in figure 3. Most customers (85.6%) think that the utilities should take responsibility of PQ problems. The customers also thought that the nature (50%) and self faults (51.5%) were the main causes.
(%) N=122
Fig.1 statistics of PQ events affecting on the customers
(%)N=122
Fig.2statistics of devices affected by PQ events
(%)N=132
Fig.3statistics of reasons causing PQ events
(%)N=128
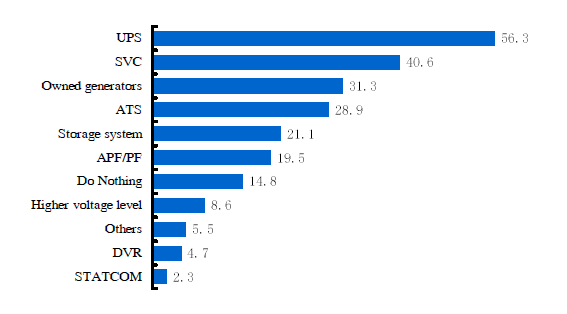
Fig.4statistics of devices mitigating PQ problem
Many respondents chose some devices to mitigate the PQ problem, and the statistic results was given in figure 4. The most popular device is UPS (Uninterrupted Power Supply). 56.3 percent customer applied UPS to mitigate the effect of PQ issues. At the same time, 40.6% of respondents selected SVC (Static var Compensator). Still 14.8% of respondents did nothing for PQ problems. Therefore, to evaluate the PQ cost can help the customers select the correct strategies to solve the PQ problems.
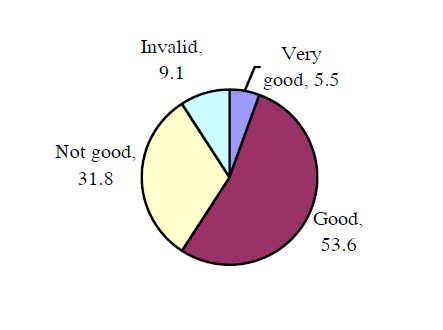
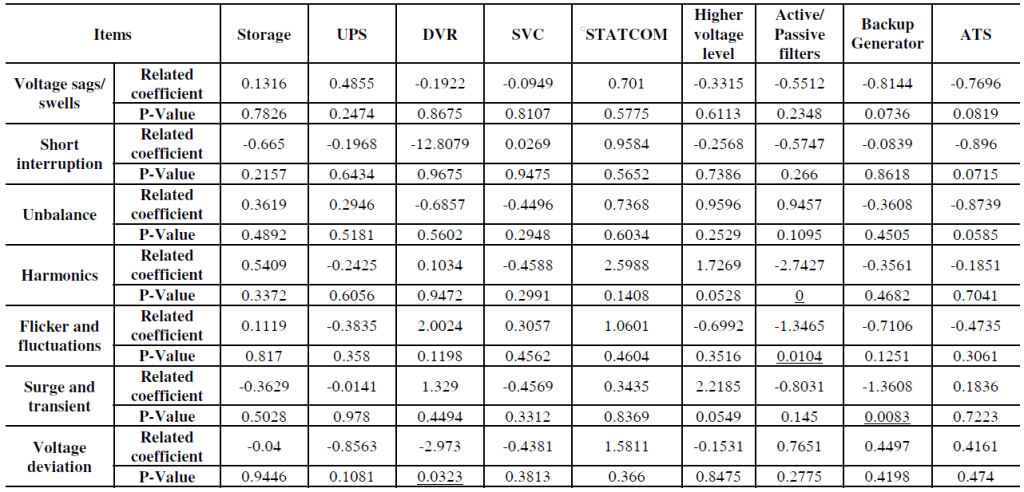
Most of the customers, who applied some approach to reduce the impact of PQ problems, were not satisfied with effectiveness of the mitigation devices. 9.1% of respondents considered that the devices are invalid at all, while only 5.5% of respondents consider the effectiveness is very good as shown in figure 5. Relevance analysis between the device and PQ problems was done according the answers of the respondents and the results were given in table 1. In table 1, when P-value is smaller than 0.05, the two components is consider as related. So, according to table 1, the relationship between harmonics and active/passive filters was correct as we know, but other relationship is not suitable for the mitigating strategies. The conclusion can be drawn that the customer cannot choose the correct solutions for PQ problems excepted for the harmonics, which also cause the effectiveness of solutions is not satisfied.
(%) N=132
Fig.5statistics of effectiveness of devices mitigating PQ problem
TABLE 1RELEVANCE BETWEEN PQ PROBLEMS AND MITIGATING DEVICES
ECONOMIC ASPECT OF PQ
PQ loss statistics
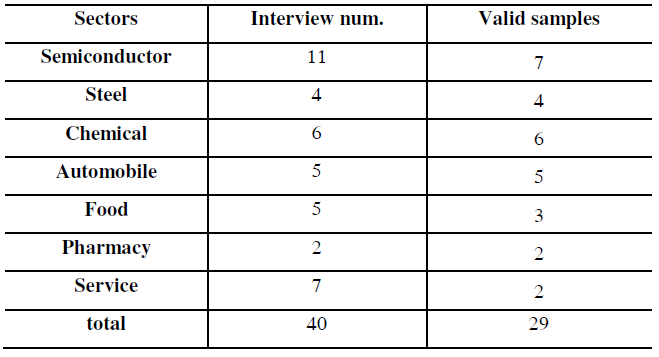
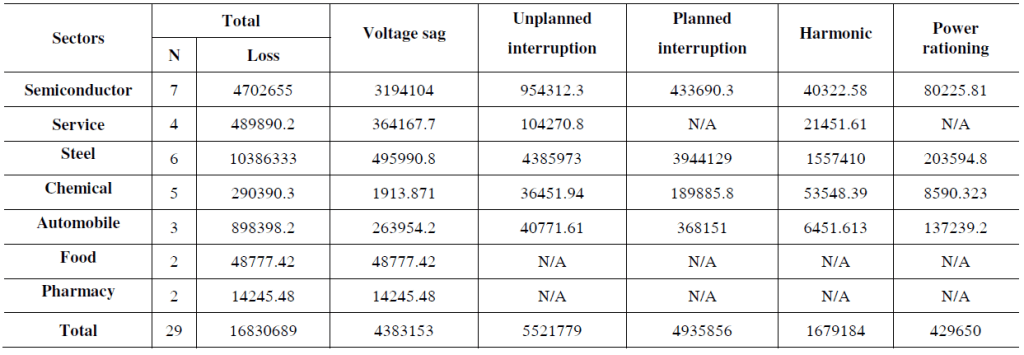
In step two, there were 40 respondents accepting the face to face interviews and 29 valid samples with the detail statistics of the economic loss of PQ in the factories. The respondents were distributed in 7 sectors: semiconductor, steel, chemical, automobile, food, pharmacy and service, as shown in table 2. The PQ loss was divided into two parts. One was the direct loss which is the loss per PQ events multiplying the times of the PQ events happening; the other was indirect loss of PQ problem which is the investment of the mitigating devices in every year. And the total PQ loss was shown in table 3. The total PQ loss according to the 29 respondents was about $17 million collectively in 2010. In the table, N was the number of the samples.
And the structure of the PQ loss was given in figure 6. In food and pharmacy, the PQ loss was all caused by voltage sags. In semiconductor, the loss caused by voltage sags was the most. While in steel and service, the PQ loss caused by unplanned interruption was the most.
Fig.6 Structure of PQ loss of the respondents
TABLE 2STATISTICS OF THE RESPONDENTS IN STEP T
TABLE 3TOTAL PQ LOSS OF THE RESPONDENTS ($)
PQ Cost analysis by confidence levels
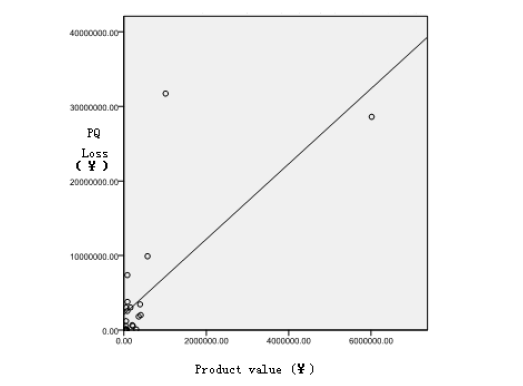
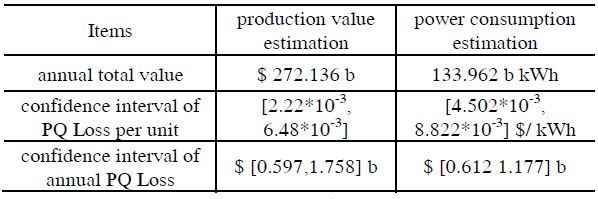
The PQ cost analysis was to achieve the total annual PQ loss in Shanghai city. The linear fitting analyses between the PQ loss and product values or power consumptions were done according to the statistics of the respondents. The analysis result between PQ loss and product values is shown in figure 7. The confidence interval of PQ cost per product values is [2.218*10-3, 6.478*10-3] when confidence level is 95%. The analysis result between PQ loss and power consumptions is shown in figure 8. The confidence interval of PQ cost per kWh is [4.502*10-3, 8.822*10-3] $/ kWh when confidence level is 95%. The PQ cost in Shanghai was less than in Europe (2008), which is about 8.353754*10-4 for product value and 8.055854*10-3€/ kWh. The reason may be that the proportion of high technology industries in the total economics in Shanghai is smaller than Europe.
With the statistics of total annual product value and power consumption of the city, the confidence interval of total annual PQ loss in Shanghai can be calculated as table 4. The annual PQ loss in Shanghai was about $0.597-1.758 billion according to the product value and about $0.612-1.177 billion according to the power consumption in 2010.
Fig.7Linear relevance analysis between PQ loss and product value
Fig.8Linear relevance analysis between PQ loss and power consumptions
TABLE 4THE CONFIDENCE INTERVAL OF TOTAL ANNUAL PQ LOSS (2010)
PQ Cost analysis by each sector
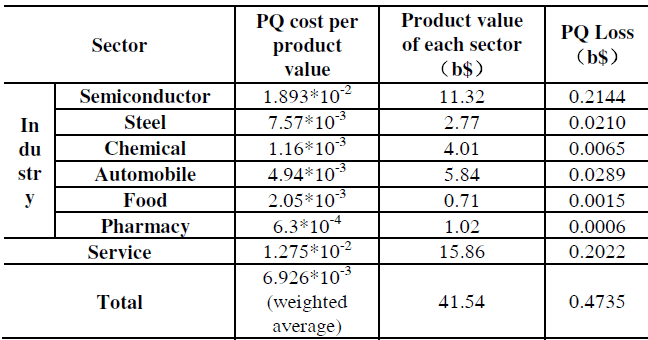
The other way to estimate the PQ cost is to evaluate the PQ cost per product value in every sector with the statistics of the respondents. The PQ cost per product value of semiconductor was the largest which is 1.893*10-2. The PQ cost per product value of service was 1.275*10-2. Therefore the total annual PQ loss was $0.4735 billion for the 7 sectors in 2010. For “Industry” sector, the PQ loss was $0.271 billion. The results are given in table 5.
TABLE 5THE TOTAL ANNUAL PQ LOSS WITH EACH SECTOR (2010)
For the “Industry” sector the estimation of how much wastage was caused by poor PQ is 0.164% of annual product value, for “Service” sector, the proportion was 4.12%. While in Europe the proportion was 4% for “industry” and 0.1419% for “service”. This shows that the industry in China is rely on the PQ less than Europe, and the conclusion for “service” is contrary.
With the comparison with the total PQ loss annual achieved by the two approaches, the result of analysis from each sector close to the result from the total amount. So for the macro analysis focusing on the PQ loss, the total annual PQ loss in Shanghai can be set as $ 0.597-1.77 billion.
CONCLUSIONS
This paper gives the procedure and some key results of the survey on the assessment of PQ cost in Shanghai. The Survey is executed by APQI China Chapter from April 2010 to April 2011. The survey was carried out in two steps. In step one, there were 147 valid samples in 18 sectors. In step two, there are 40 face to face interviews in 7 sectors, including 29 valid respondents. The survey focused mainly on the 8 PQ problems and designed 6 parts of the PQ loss. With the analysis of the answers of the respondents, some main conclusions can be drawn:
The respondents thought that the most frequent PQ event which affects the procedure of the customers in Shanghai is short interruption. But there was some confusion when the customers distinguished the difference about the flicker and voltage sags.
The respondents thought that the most sensitive device for the PQ issues is computer and the most mitigation device is UPS. But the effectiveness of the mitigation device is not very satisfied for 40.9% of respondents. The relevance analysis between PQ problems and mitigation devices show that the customer cannot select the right solutions.
85.6% of respondents thought that the utilities should take the responsibility of the PQ events.
There was linear relationship between PQ loss and the product values or power consumptions. The confidence interval of linear coefficient was [2.2210-3, 6.48*10-3] between PQ loss and the product values and [4.502*10–3, 8.822*10-3] $/kWh between PQ loss and the power consumptions, when confidence level was 95%. The coefficient was less than that in Europe.
The total annual PQ loss of 29 valid samples was $16,830,689 in 2010 collectively. It was estimated that the total annual PQ loss in Shanghai is about $ 0.597-1.77 billion in 2010 with 95% confidence level.
ACKNOWLEDGEMENT
Thanks for the Economic Operation Bureau, Development and Reform Commission, China, who organized this survey. Thanks for the Shanghai Municipal Commission of Economy and Information and Shanghai Municipal Electric Power Company who supported this survey a lot. Thanks for the other members in APQI China Chapter who contributed their hard works for this survey.
REFERENCES
[1] DOE/NETL. Provide power quality for the digital economy. Oct. 2009, http://www.netl.doe.gov/martgrid/referenceshelf/whitepapers/Provides%20Power%20Quality_APPROVED_2009_11_02.pdf. [2] IEEE recommended practice for evaluating electric power system compatibility with electronic process equipment. IEEE Standard 1346-1998, 1998. [3] E. Emanuel, M. Yang, and D. J. Pileggi. The engineering economics of power system harmonics in subdistribution feeders: A preliminary study”, IEEE Transactions on Power Systems, Vol. 6, No. 3, August 1991, pp. 1092 – 1098. [4] P. Caramia, G. Carpinelli, E. Di Vito, A. Losi, and P. Verde. Probabilistic evaluation of the economical damage due to harmonic loss in industrial energy systems”, IEEE Transactions on Power Delivery, vol. 11, no. 2, April 1996, pp. 1021 – 1031. [5] J. T. Crozier, W. N. Wisdom. A PQ and reliability index based on customer interruption costs. IEEE Power Engineering Review, vol. 19, pp. 59 – 61, 1999. [6] K. K. Kariuki and R. N. Allan, “Evaluation of reliability worth and value of lost load,” IEE Proceedings: Generation, Transmission and Distribution, vol. 143, pp. 171 – 180, 1996. [7] P. Heine, P. Pohjanheimo, M. Lehtonen, and E. Lakervi. A method for estimating the frequency and cost of voltage dips. IEEE Transactions on Power Systems, vol. 17, pp. 290 – 296, 2002. [8] J. V. Milanovic, C. P. Gupta. Probabilistic assessment of financial loss due to interruptions and voltage dips – Part I: The methodology. IEEE Transactions on Power Delivery, vol.21, pp. 918 – 924, 2006. [9] J. V. Milanovic, C. P. Gupta. Probabilistic assessment of financial loss due to interruptions and voltage dips – Part II: Practical implementation,” IEEE Transactions on Power Delivery, vol. 21, pp. 925 — 932, 2006. [10] Primen. The cost of power disturbances to industrial & digital economy companies. EPRI CEIDS, June 2001. [11] Targosz, Roman, Jonathan Manson. European Power Quality Survey Report. LPQI, 2008. [12] Y. Shih-An, S. Chun-Lien, C. Rung-Fang. Assessment of PQ cost for high-tech industry. Power India Conference, 2006 IEEE, 2006. [13] S. B. Choi, K. Y. Nam, D. K. Kim, S. H. Jeong, H. S. Ryoo, J. D. Lee. Evaluation of interruption costs for industrial customers in Korea. Power System Conference and Exposition, 2006. PSCE’06.
1Qing Zhong, received Ph. D and MSc in South China University of Technology in 2003 and 2000, and BSc in North China University of Technology in 1997, all in Electrical Engineering. He is now teaching in School of electric power, South China University of Technology. His main fields of interest include Power Quality, HVDC transmission control, and power electronics control.
2Wei Huang, works for International Copper Association. He is the project manager of Power Quality and is also the coordinator of APQI. APQI is aiming at improving power quality in Asian industries by creating awareness on the origins of the problems and building capability on the technical, financial and managerial aspects of power quality. He received a bachelor’s degree in Economics from Zhejiang University and MBA degree from Shanghai Jiaotong University. His main fields of interest include PQ, energy efficiency and distributed energy.
3Shun Tao was born in P.R.China, on Nov. 18, 1972. She received PhD degree and M.S. degree in North China Electric Power University (NCEPU) in 2008 and in 2005 respectively. She has been with the NCEPU since 2008, and she had a Postdoc procedure at the Electrical Engineering Laboratory de Grenoble (G2Elab), Institute National Polytechnique de Grenoble (INPG), France in 2010. Her research interests include Smart Distribution network technologies and power quality.
4Xiangning Xiao was born in P.R.China on March 5, 1953, is currently a professor in North China Electric Power University. He became a Member (M) of IEEE in 2003. His research interests include power quality and power electronics applications.
Published by J&D is a world leader for high technology, high-performance current sensor that perfectly meet the needs of the metering sector. Email support@hqsensing.com
Published in SMART ENERGY INTERNATIONAL ISSUE – 5 | 2018
A recent report by the US Electric Power Research Institute (EPRI) predicts that by 2020, the DC distribution market will account for 50% of the total load, as the use of microgrid and other digital loads increases globally.
However, for use in conjunction with existing AC distribution systems, it is necessary to convert AC power to DC power, or DC power to AC power, which inevitably results in power loss.
To remedy this situation, there is an increasing trend to utilize DC distribution systems. Within a DC distribution system, power conversion is not needed, which leads to increased energy efficiency. Furthermore, since DC has no frequency, there is the added advantage of eliminating reactive power loss and inductive interference on the line (refer Figure 1).
To enable the construction of DC distribution systems, components for low-voltage DC (LVDC) power distribution infrastructure systems are being developed all over the world. As part of that effort, a new standard is currently being determined for DC metering and monitoring for LVDC distribution systems. IEC62053-41 Ed.1, the standard for DC electric meters, is currently under development by the project team TC13, and the standard is scheduled for completion in September 2019. In parallel, a NEMA DC sub-metering ANSI standard for DC electric meters is being established as part of a separate project called ESM1. The EMerge Alliance1 announced in 2016 the formation of a new committee to establish revenue-grade DC metering requirements for low and medium-voltage applications.
Currently, the requirements for this task are being updated.
In South Korea, KEPCO has defined LVDC for DC voltages of 1500V with single polarity and 750V with dual polarity. Based on this definition, KEPCO is currently pilot testing LVDC distribution lines at the Gochang Power Testing Centre. In particular, KEPCO is conducting research on power devices for microgrids that can use DC and AC power distribution as well as energy storage systems (ESS) and EV fast chargers. Also, LG Electronics is accelerating the development of home appliances for DC.
KEPCO is developing a new standard for the Korean market based on two existing standards – the EMerge Alliance standard for DC distribution systems, and the IEC62053-41 standard for DC power billing in electricity meters.
Since March 2016, J&D has begun three projects to develop new products for DC metering (refer Figure 2).
The first project is to develop two types of DC electricity meters with accuracy per the 1.0 and 0.5 class. One meter is a single meter for EV fast chargers, and the other one is a transformer-operated meter for ESS.
The single meter is designed with an internal DC current sensor, whereas the DC voltage is obtained using a resistive voltage divider. The DC power is calculated based on signals from both sensors. The DC voltage sensor has a measuring range of 150V~500V and combining it with a DC current sensor for 100A and 200A enables a DC electricity meter capable of DC power billing for EV fast chargers with 50kW and 100kW capacity.
The transformer-operated meter under development uses a J&D DC high-voltage sensor and a DC high-current sensor. It will be used primarily for ESS and DC microgrid applications.
The second project is the development of a high-precision DC current sensor to be used for DC single meters and transformer-operated meters. Currently, most of the DC current sensors on the market are specified for full-scale accuracy. Naturally, these sensors are not suitable for DC electric meters, since these require accuracy relative to the measured current. Sensors specified for full-scale accuracy result in increased errors at lower currents (refer Figure 3).
Sensors with sufficient accuracy are usually not competitive for the meter market due to their high price and high power consumption. Due to the large size required for a suitable power supply, it is not easy to develop a compact DC electric meter.
For DC current sensors, three technologies are usually used:
The first one is the Fluxgate technology, which is highly accurate but not competitive in price.
The second one is a closed-loop technology that can have a medium level of precision but is not very competitive in price.
Finally, the open-loop technology has adequate precision. However, this technology is vulnerable to magnetic fields.
J&D has analysed the three technologies described above and found a way to design an optimal DC current sensor that could be applied to DC electricity meters. For the design of a compact DC electricity meter with the lowest possible power consumption, the DC current sensor must have adequate reading accuracy with minimal power consumption. To have a competitive advantage, research is focused on developing an optimal DC current sensor that is also economical.
The results for this intense research are the JOM and JCM series of sensors:
The JOM series is a DC current sensor designed for DC single meters with a 1.0 accuracy class. It is also designed to achieve a 0.5 accuracy class by applying open-loop technology. It uses a zero drift operational amplifier and a high permeability core to minimize DC offset and to achieve a compact size. Also, it has been designed to operate at low power. Therefore, it is possible to design a compact DC single meter for 100A and 200A, using the JOM series of sensors.
The JCM series is a product for DC single meters with 0.5 accuracy class (100A and 200A), and for transformer operated meters with 1.0 accuracy class (200A~4000A). Using AOCT technology to remove the DC offset from the hall sensor front-end circuit and the differential amplifier, based on closed-loop technology, and using high-permeability cores, the JCM series support accuracy class 0.2 meters. The design minimizes voltage loss caused by the DC resistance and inductance of the feedback coil. Notably, the JCM series sensors have been designed to have low operating power. Therefore, by using the J&D JCM series CTs, it is possible to develop a compact DC transformer operated meter.
The third project was to develop a DC voltage sensor for DC transformer operated meters. J&D’s new DC voltage sensor is a closed-loop product utilising a stable isolation design and the AOCT technology from the DC current sensor. This sensor achieves accuracies of 0.3% in the 1500V~5000V DC range.
Based on the advances of DC voltage accuracy and DC current sensor accuracy, J&D developed a high precision DC electricity meter that addresses the growing demand for LVDC distribution systems.
When J&D discovered at the development stage that conventional metering ICs could not meet the requirements for DC electricity meters, J&D engineers consulted Silergy Corp, a leading metering IC manufacturer for support, which resulted in a fruitful phase of cooperation.
MAX71315C, a single-phase metering IC was selected as the best solution for the application. Silergy provided J&D with broad technical support and assistance. We want to take this opportunity to send our gratitude to Silergy.
The accuracy and overall performance of J&D’s DC electric meter has been evolving, and its first solution will be presented at European Utility Week 2018 (Vienna, November 2018).
J&D’s strategy is to lead by preparing ahead of the market rather than following it. We would like to cooperate with leaders from around the world in developing DC electric meters or DC distribution systems. With J&D’s leading technology, it will be possible to enable our partners to capitalize on the new market trend.
1 The EMerge Alliance, is a not-for-profit industry association founded in 2008 with the goal of setting standards for industrial LVDC distribution.
Puneet Chawla, Assistant Professor, Electrical Eng. Department, Ch. Devi Lal State Institute of Eng. & Tech., Panniwala Mota (Sirsa)
Rajni Bala, Lecturer, Electrical Eng. Department, Ch. Devi Lal State Institute of Eng. & Tech., Panniwala Mota (Sirsa)
ABSTRACT
Power Quality is deteriorating continuously in developed countries. Poor power quality, also known as dirty electricity, ubiquitous pollutant, refers to a combination of harmonics and transients generated primarily by electronic devices and by non-linear loads. It flows along wires and radiates from them and involves both extremely low frequency electromagnetic fields and radio frequency radiation. Until recently, dirty electricity has been largely ignored by the scientific community but dirty electricity is adversely affecting the lives of millions of people.
Recent inventions of metering and filter equipment provide scientists with the tools to measure and reduce dirty electricity on electrical wires. Several case studies and anecdotal reports are presented regarding the existence of electrical pollution in this paper.
Electrical pollution is not something you can see, smell, taste, or touch. It is not something that you can sense, making it difficult for one to be aware of the presence of electrical pollution. With this in mind, it is important to understand what causes electrical pollution and what to look for in our everyday environment and home.
Electrical pollution”[1] is a misused and misunderstood term that has no basis in engineering or electrical science. There are a variety of normally occurring electrical phenomena that arise from our everyday use of electricity. “Electrical pollution” is being loosely used to describe these phenomena. These electrical phenomena include:
Stray voltage
Electric and magnetic fields
Earth currents
Transients and high frequency noise
Harmonics
Flickering
Surge Voltages
Lightning
Floating Neutral on power system
Stray voltage is current from on and off farm sources. Stray voltage on farms has been detected by observing behavioral changes in farm animals and some health problems for humans. This is often a localized condition due to poor grounding of the farm or utility electrical system, or a failure of some electrical application.
Electric and magnetic fields, or EMF are weak, invisible fields of energy that exist around anything that carries or uses electricity. The strength of these fields quickly decreases as you move away from the source.
Earth currents are very low magnitude electrical currents that can be detected in the soil. Natural activity such as movement of magma deep within the earth and solar flares create some of these currents, while the delivery and use of electrical energy create others. Most of the earth currents are the result of local electrical loads by the end consumer of electrical power.
Transientsand high frequency noise on the wiring of our homes and businesses are created by the use of modern electronic devices such as radios, televisions, cell phones and microwaves. This “noise” is normally very small (a tiny fraction of one volt) compared to the standard 120 volts at a typical wall outlet. As with earth currents, the source of transients and high frequency noise is primarily the end user. Because of the design of the electrical distribution system, this noise cannot be transmitted very far from its source. We occasionally experience this noise as momentary interference (snow) on a television screen or a fuzzy buzz in our communications systems.
Electromagnetic spectrum
Dirty Electricity from 2 kHz-150 kHz (transient bursts)
Harmonics is a component of waveform of alternating current of a frequency which is a multiple of fundamental current is called harmonic component.
The quality of power can be simply defined with parameters as below:
The supply voltage should be within guaranteed tolerances of declared value. A lower voltage called a sag and a high voltage are undesirable, long duration of cut offs are to be abhorred up to 10%.
The supply frequency must lie within guaranteed parameter of 3% in the country.
The wave should be a pure sine with allowable limits for distortion.
Sudden voltage distortion must be contained.
Supply of three phases of a 3-Φ system should be balanced.
The earthing system should serve its purpose satisfactory.
The utility’s main duty is that to provide the electricity which satisfy all above factors. Bu the harmonic injection by various industries is the main reason of bad quality of power.
Flicker is defined as the impression of unsteadiness of the visual sensation induced by a light stimulus whose luminance or spectral distribution fluctuates with time. It is caused by the voltage variations in the electrical power system and brings annoyance to human beings. The human eye is the most important responder to the light.
There is a lamp-eye-brain model built called as IEC flickmeter. It is able to simulate the physiological sensitivity of the human eye that is subjected to are reference incandescent lamp of 60W, 230V.
Lightning and Surge Voltages Overvoltages are designed as transient voltages at transient surges. This means that they are short-lived, temporary oscillations. Their shape and frequency depends on the impedance of the circuit. A transient surge is a sudden (shorter than a milliseconds) rise in the flow of power. Voltages can peak up to 12 times the nominal system voltages. Transient surges result from a number of resources, the most common of which are internal, such as load switching and even normal equipment operations. In fact, 80% of transients are generated internally. External transient are the result of lightning and load switching by utilities and upstream facilities. Overvoltages are primarily caused by:
Lightning due to atmospheric discharges.
Transient Switching operations.
Faulty Switching operations.
Electrostatic discharges.
Floating Neutral If the star point of Unbalanced load is not joined to the star point of its power source (Distribution Transformer or Generator) then phase voltage do not remain same across each phase but it vary according to the unbalanced of the load.
As the potential of such as isolated Star point or Neutral point is always changing and not fixed s it is called as Floating Neutral. Power flows in and out of customers premises from the distribution network, entering via the phase and leaving via the neutral. If there is a break in the neutral, return path electricity may then travel by a different path. Power flow entering in one phase returns through remaining two phases. Neutral point is not at ground level but it floats up to Line voltage. This situation can be very dangerous and customers may suffer serious electric shocks if they touch something where electricity is present.
Broken neutrals can be difficult to detect and in some instances may not be easily identified. Sometimes broken neutrals can be indicated by flickering lights or tingling taps. If you have flickering in lamps, this may cause a serious injury or even death.
E-waste [2] The e-waste is influenced by several factors, but it can be broadly classified into two categories: E-waste Generated and E-waste imported.
The center of Science and Environment reports that the E-waste generated in the country ranges from 350,000 tones to 400,000 tones, where 50,000 tones of e-waste is illegally imported into the country every year. The growth of e-waste in the country is influenced by low end of life of electronic and electrical products due to frequent release of new models, reasonable and attractive prices, low refurbishing and most importantly lack of recycling infrastructure in the country. This is also due to the lack of balance between the wastes generated and recycled (252,868 MTA). The Indian government is in full swing to contain this situation through the implementation of Hazardous Wastes (Management, Handling and Transboundary Movement) Rules.
In these characterizations of electrical pollution, high frequency signals pollute regular electrical currents traveling in wires and currents through the earth. To better understand the background for the causes of electrical pollution, it is helpful to learn the basics of how the electrical current works.
Direct current is similar to battery power where current flows back and forth between energy terminals.
Alternating current is a wave-like movement of energy that oscillates back and forth, and the energy flows in the direction of the load. The rate of oscillation is defined as frequency. At an electrical grid base, the current oscillates at 50 times per second, or 50 Hz. Regular “clean” power enters homes, buildings, and offices at 50 Hz. The increased use of electrical power overloads electrical grid base, which distributes the power. Power is “dirty” or polluted when it contains the high frequency signals flowing through overloaded wires, and not just clean 50 Hz power.
The pollution of electricity is often compared to how water is polluted. At the source, water is clean. It is what comes with the water and pollutants along its path to the recipient that makes the water harmful to humans. However, like water pollution in many ways, electrical pollution is complex and often difficult to understand for the common consumer. The causes are varied and sometimes cannot be identified with certainty. However, the bulk of overloaded electricity bases can be attributed to the reliance on electrical appliances in today’s environment. In the 1950’s, the National Electrical Safety Code required a neutral wire to return wire to utilities. In this code it was forbidden to use the earth as a neutral return. This was a worsening problem in rural, farm areas where the currents were being returned to the soil affecting the feeding of animals. Later, the Public Service Commission allowed utilities to use grounding rods to serve as neutral wires for return. This was done instead of increasing the size of the neutral rods. Installing ground rods is a less costly solution than making the neutral rods larger in size.
The grounding rods serve as an alternate and additional pathway for the energy to return to the substation instead of to the earth. The use of electricity has dramatically increased in the past 50 years causing stress on the electrical infrastructure. Those concerned about electrical pollution say the size of neutral wires to make sure energy is returned to its source needs to be much larger. The current regulated size of the neutrals is not large enough to handle the load due to the greater use of electricity. The currents that are not properly directed are emitted into the environment or into homes or offices where electrical devices are widely relied upon by consumers.
Neutral wires are not often sized for the modern electrical load. Power that is misdirected into the earth or home environments contains a much higher frequency that the 50 Hz classification making it “dirty” or unclean. Knowing that consumers use a more significant amount of electricity in today’s modern environment, there is a concern that electrical pollution is affecting humans. Those concerned about electrical pollution advocate for stricter regulations and for the widespread use of filters to measure and control “dirty” electricity. Considering electrical pollution can come from a variety of sources, the subject is complex and there is still a lot to be learned on the topic. In the meantime, some technology has been created to measure and control electrical pollution. This is especially important for those who have realized they are “electrically sensitive” and are experiencing health problems which are attributed to electrical pollution.
ARC FLASH HAZARDS IN POWER SYSTEM [3]
The consideration of arc flash hazards is a relatively new concern for power system analysis, working and design. However, it is a concern that is rapidly momentum due to increasingly strict worker safety standards and system reliability requirements that demand work on live electrical equipment’s. Recently, enacted guidelines and regulations regarding arc flash hazards have focused power industry attention on quantifying the dangers of arc flash events n low and medium power electrical equipment. The arc flash hazard analysis is mandatory and more popular in European countries and US to ensure safety of the personnel working under live conditions. However, it is becoming popular in India as well so as to ensure the system reliability. Since the incident energy from an arcing fault is directly proportional to the arc clearing time, reducing the arc time is very beneficial. It results in reducing the personnel protective equipment (PPE) level requirements and limiting direct damage to the equipment.
An arcing fault is the flow of current through the air between the phase conductors or phase conductor & neutral ground. Arc flash is the ball of fire and molten metal as well as a pressure force or blast that explodes from an electrical short circuit. Electrical arcs from, which a medium that is normally an insulator, such as air, is subjected to an electric field strong enough to cause it to become ionized. This ionization causes the medium to become a conductor which carry the electric current. An arcing fault can release tremendous amount of concentrated radiant energy at the point of the arcing in a small fraction of a second, resulting in extremely high temperature, tremendous pressure blast and shrapnel hurling at high velocity. Arc flash temperatures can easily reach 14,000 to 16,0000F (77600C to 88710C). These temperatures can be reached by a fault in several seconds. The heat generated by the high current flow may melt or vaporize the material and create an arc. This arc flash creates a brilliant flash, intense heat, and a fast moving pressure wave that propels the arcing products. Some of the effects of arcing fault include:
Extreme heat, Pressure waves and Sound waves.
Molten metal, shrapnel and vapor
Intense light.
Arc flash is related to the available fault current and total clearing time of the over current protective device during a fault. It is not necessarily linear as lower fault currents can be sometimes result in a breaker or fuse taking longer to clear, thus extending the arc duration and raising the arc flash energy. To perform an accurate arc flash hazard analysis, a realistic value for three-phase bolted fault and total clearing time for the affected over current protective device must be known. Arc flash hazard analysis and study is required to be carried out in the installations where the worker is operating under live conditions.
Arc flash is measured in thermal energy units of cal /cm2 and for arc flash analysis is referred to as the incident energy of the circuit. 1.2cal/cm2 of thermal energy on a person’s skin for a short period of time generally produces a second degree burn. Second degree burn is considerably curable and painful and occur if the temperature of human skin is raised to 80oC for 0.1 seconds. Depending on the material clothing may ignite when temperature reach between 370-760oC (700-1400oF). if clothing and equipment are worn to limit the exposure of the worker to limits below those identified above, the worker should walk away from an accident with minimal injury.
Types of Faults A bolted short circuit occurs when the normal circuit current by-pass the load through a very low impedance path resulting in current flow that can be thousands of times the normal current. All equipment needs to have adequate interrupting ratings to safely contain and clear the high fault currents associated with the faults.
In contrast, the arcing fault is the flow of current through a higher impedance medium, typically the air, between phase conductors or between phase conductor and neutral or ground. Arcing fault currents can be extremely high in current magnitude approaching the short-circuit current but are typically between 38% to 89% of the fault. The inverse characteristics of typical over-current protective devices results in longer clearing time for an racing fault due to lower fault values. The amount of energy released during an arcing fault depends upon the voltage, the current and the duration of arc. The arc duration is dependent on the arcing fault current magnitude and the protective device settings. Due to its nature, the magnitude of an arcing fault is subject to many variables and is difficult to perfectly predict.
Causes of Electric Arc Arcs can be initiated by the following:
Accidental touching.
Accidental dropping of tools.
Failure of insulating materials.
Improperly designed or utilized equipment.
Improper work procedures.
Spark discharges.
Over Current across the narrow gaps between conductors of different phases.
Dust and impurities on insulating surfaces.
Fumes or vapor of chemicals.
Corrosion of equipment parts, thus weakens the contacts between terminals.
Condensation of vapor and water dripping on the surface of insulating surface.
Reasons of Address arc Flash The following are the reasons to address the arc flash:
Protect the workers from potential beam and prevent the loss of life.
Comply with Occupational safety and Health Administration (PSHA) codes with National Fire Protection Association (NFPA) standards on employee safety, NFPA-70E.
Prevent loss to organization through loss of skilled manpower, litigation fees, higher insurance costs.
Increases production uptime by reducing accidents.
Classification of Hazard Risk category NFPA 70E defines 5 levels of risk category for arc flash hazard based upon the calculated indecent energy at the working distance. As per the risk category, different Personnel Protective Equipment (PPE) are required to be worn by the person working near to live equipment.
Table 1: Classification of Hazard Risk Category
Category
Energy Level
PPQ Requirement
Remarks
0
N/A
Non-melting, flammable materials
1
5 cal/cm2
Hard hat, Safety glasses or safety goggles. Hearing protection (ear canal inserts) Heavy duty leather gloves
The Hazard Risk category levels should be restricted up to category 2 as the PPE required to be worn are easy to work with.
2
8 cal/cm2
Hard hat, Safety glasses or safety goggles. Hearing protection (ear canal inserts) Heavy duty leather gloves.
The Hazard Risk category levels should be restricted up to category 2 as the PPE required to be worn are easy to work with.
3
25 cal/cm2
Hard hat, Safety glasses or safety goggles. Hearing protection (ear canal inserts) Heavy duty leather shoes.
Hazard Risk category of category 3 and category 4 shall not be recommended as the PPE used will be bulky.
4
40 cal/cm2
Hard hat, Safety glasses or safety goggles. Hearing protection (ear canal inserts) Heavy duty leather shoes.
Hazard Risk category of category 3 and category 4 shall not be recommended as the PPE used will be bulky.
Benefits of performing Arc Flash study Below are some of the benefits of performing an accurate arc flash hazard analysis:
Enhance the system reliability with proper protective device coordination study.
Equipment evaluation analysis is very important.
Since the system can be modeled on software, it will be very easy to make future changes or upgrade with minimal expense and efforts.
Drastically lessen chances of having to make a very unpleasant visit.
Provide the best possible PPE for workers and technicians.
Possibly lower insurance premiums.
Brings electrical system up to date by providing current one-line diagram.
Harmonics is a component of waveform of alternating current of a frequency which is a multiple of fundamental current is called harmonic component. The harmonic component of twice the fundamental frequency is called as second order harmonics and the triple frequency harmonics is triple harmonic component. Complex waveforms are produced due to superposition of sinusoidal wave of lowest frequency f ,i.e. fundamental frequency and waves of different frequencies whose frequency are an integral multiples of basic frequency, such as waves of frequencies 2f, 4f, 6f called as even harmonics and of 3f, 5f, 7f are called odd harmonics.
Types of harmonics various types of harmonics are
Harmonic voltage distortion.
Harmonic current distortion.
Interchange voltage & current component.
Subharmonic distortion
Voltage harmonic distortion which is generally present in supply of power from utility. The distortion of current waveform is called current harmonic distortion which is generally injected by the non-linear loads to supply the utility and corrupts it.
Non-Linear loads When the current drawn through the circuit is non sinusoidal even there is a pure sinusoidal supply from the utility, then the load is called as non-linear load. Some examples of non-linear loads are:
Transformer saturation.
Thyristor controlled equipments.
Ac/dc, ac/ac, dc/ac converters.
Battery chargers.
Electronic and medical test equipment.
PCs and office machines.
Induction heaters.
Synchronous machines (non-sinusoidal air gap flux).
Evaluation of Harmonic distortion Any real waveform can be produced by adding sine waves together. It can also be shown that this combination is unique. It may be note that fundamental and third harmonic component waveforms for two cases (in phase and out of phase) result in two waveforms with no change in amplitude. So, when the odd harmonics are in phase with fundamental component, distorted resultant waveform of square type wave and when harmonic is shifted by 900 phase, the distorted resultant becomes more like as a spikes.
Table 2: Evaluation of Harmonic distortion
Name/Order
Frequency
Sequence
Relative Voltage(%)
1
50
+
3
2
100
–
–
3
150
0
5
4
200
+
–
5
250
–
6
6
300
0
–
7
350
+
5
8
400
–
–
9
450
0
1.5
10
500
+
–
11
550
–
3.5
12
600
0
–
13
650
+
3.5
14
700
–
–
15
750
0
3
17
850
–
2
19
950
+
1.5
21
1050
0
0.5
23
1150
–
1.5
Effects of harmonics The effects of harmonics on power system are as follow:
Over voltages and excessive currents due to series and parallel resonance.
Increase in losses and consequence heating of transformers and rotating machines.
Overloading of power factor correction shunt capacitors leading to excessive current to fuse blowing.
Ageing of insulation of the electrical equipments. Hence reduction of efficiency of power system.
Increases errors in energy meters.
Mal functioning of protective gears such as relays, circuit breakers.
Inductive interference with neighboring communication network.
Tripping of machines at smaller loads.
Fire hazards
Sources of harmonics [4]: Harmonic pollution in power system is generally caused by non-linear loads. The sources of harmonics in power system can be classified as follows:
a) Harmonic originated at high voltages by supply authorities:
HVDC system.
Back to back system.
Static VAR compensation system.
Wind and Solar power converters with interconnection.
b) Harmonics originated at medium voltages like large industrial loads like Traction equipment, variable speed drives, thyristors controlled drives, induction heaters, Arc furnaces, Arc welding, capacitor bank, electronic energy controllers.
c) Harmonic originated at low voltages at consumers end like single phase loading, uninterrupted power supplier, semiconducting devices, CFL, solid state decies, domestic appliances and accessories using electric devices, electronics chokes, electronic fan regulators/light dimmers.
Solution for minimizing harmonic current effects [5]
Over-sizing or derating of the installation- This solution does not eliminate harmonic currents flowing in the low voltage (less than 1000V AC) distribution system but masks the problems and avoid the consequences. The most widely implemented solution in a new installation is over sizing of neutral conductor.
Specially connected Transformer- This solution eliminates 3rd order harmonic currents. It is centralized solution for a set of single phase loads.
Series Reactors- This solution consists of connecting a reactor in series with non-linear load.
Tuned Passive filters- A filter may be installed for one load or a set of loads. The filter rating must be coordinated with the reactive power requirements of the loads.
Active harmonic filters- The active harmonic filters are used to introduce the current component to cancel die harmonic component of the non-linear loads, such as Series Filters, Parallel Filters & Hybrid Filters.
Lightning and Surge Protection [6]
Bolts of lightning exhibit extremely high currents. So, they cause a large voltage drop and accordingly, a large rise in potential even in well-earthed building or system despite low earthing resistance.
Overvoltages due to direct lightning strokes When lightning strikes a lightning conductor or the roof of a building which is grounded, the lightning current is dissipated in to the ground. The impedance of the ground and the current flowing through it create large difference of potential, this is called as overvoltage. This overvoltage then propagates throughout the equipment via the cables, damaging equipment and results in explosion.
Overvoltages due to indirect effects of lightning strokes Overvoltages are also produced lightning strikes in the vicinity of a building due to increase in potential of the ground at the point of impact. The electromagnetic fields created by the lightning currents generate inductive and capacitive coupling, leading to other overvoltages. Within a radius upto several kilometers, the electromagnetic field caused by the lightning in clouds can also create sudden increase in voltage. Thus causes, irreparable damage to the sensitive equipment’s such as fax machines, computer power supplies and safety & communication systems.
A lightning strike (direct or indirect) can have a destructive and disturbing effect on installations located up to several miles from the actual point of the strike. During a storm, underground cables can transmit energy from a lightning strike to equipment installed inside building. A lightning protection device such as lightning rods or Faraday cage, installed in a building to protect against the risk of a direct strike can increase the damage to electrical equipment connected to the main power supply near or inside the building.
Conducive coupling Overvoltages are transferred directly into circuits via common earthing impedances. The magnitude of the overvoltages depends on the ampereage of the lightning and the earthing conditions. The frequency and wave behavior are mainly determined by the inductance and speed of the current rise. Even distant lightning strikes can lead to overvoltages in the form of travelling waves which affect the different parts of electric systems by the conductive coupling.
Inductive coupling A high-ampere lightning strike generates a strong magnetic field. Starting from here, overvoltages reach nearby circuits by means of induction effects, according to the transformer principle, e.g. directly earthed conductor, power supply lines, data lines etc.
Capacitive coupling A capacitive coupling of overvoltages is also possible. The high voltage of the lightning generates as electric field of high electric strength. The transport of electrons can cause a capacitive decay to circuits with lower potentials and raise the potential concerned to an overvoltage level.
Radiation coupling Electromagnetic wave fields (E/H field), that also ensue during lightning (distant field condition, E/H field vectors perpendicular to each other), affect conductor structures in such a way that coupled overvoltages must be expected even without direct lightning strikes. Permanent wave fields from strong transmitters are also able to cause coupled interference voltages in lines and circuits.
Lightning protection on Motors However, during lightning and switching of circuit breakers, re-strikes are pre-strikes during opening and closing of a circuit breaker may lead to a broad band frequency spectrum of overvoltages. Such overvoltages may have an oscillating character and lower amplitude at the Motor terminals. In addition they may arrive at the motor input without any changes in amplitude and waveform so the lightning arresters will not able to detect any overvoltage near the terminals as well as the input sides. If the oscillating frequency component of the external overvoltage is equal to the natural frequency of windings, then magnitude of the internal resonance overvoltage has its maximum value. So, overvoltages generated in transient and lightning strikes in electrical power equipment may be dangerous for insulating system despite the applied overvoltage protection. In order to ensure protection from transient surges, installation of lightning protective devices is a must.
Surge Protection Pumping stations are particularly vulnerable to lightning-induced voltage surges on incoming power lines, since it is characteristic of their operation to be in use during thunderstorms. So, special care should be taken to reduce the magnitude of these voltage surges to avoid major damage to the electrical equipment contained within. A small investment can greatly reduce voltage stresses imposed on rotating machines and switchgear by lightning-induced surges. There are two transient elements of a voltage surge that require different protective equipment. The protection of the major insulation to ground is accomplished by station surge arrestor which limit the amplitude or reflections of the applied impulse wave within the power windings
Medium voltage motors To obtain the most reliable protection of the motor’s major and turn insulation systems, a set of arrestor and capacitors should be installed as close as possible to the motor terminals. The arresters should be valve-type, station-class designed for protection. The leads from the phase of motor to the capacitor and from the capacitor to ground should be as short as possible.
Low voltage motors These are of 600V and below have relatively higher dielectric strength than medium voltage motor. Normally, when higher speed motors of this voltage class are connected through a transformer protected by Station-class arrester on the primary side, no additional protection is required. However, due to more expensive slower speed motors employed in pump stations, plus the critical nature of these motors, the minimal additional cost of lightning protection is required. A 3-phase valve-type low voltage arrester should be provided at the service entrance to the station and a three-phase capacitor should be provided at each motor terminal.
Surge capacitors [7] have been commonly used as protection device to mitigate transients. The combination of surge capacitors and surge arresters has been used to protect medium voltage motors from steep-fronted voltage surges. The purpose of using the surge capacitor is to reduce the rise time of the surge. The following points must be observed to guarantee fault-free operation of an electrical drive:
Correct design, a suitable motor has to be selected for each application.
Professional operation, professional installations and regular maintenance are preconditions for such operation.
Good motor protection, this has to cover all possible problem areas:
It must not be tripped before the motor is put at risk.
If the motor is put at risk, the protection devices as to operate before any damage occurs.
If damage cannot be prevented, the protection, device has to operate quickly in order to restrict the extent of the damage as much as possible.
Impact of Floating Neutral in Power Distribution [8]
If the star point of Unbalanced load is not joined to the star point of its power source (Distribution Transformer or Generator) then phase voltage do not remain same across each phase but it vary according to the unbalanced of the load.
As the potential of such as isolated Star point or Neutral point is always changing and not fixed s it is called as Floating Neutral. Power flows in and out of customers premises from the distribution network, entering via the phase and leaving via the neutral. If there is a break in the neutral, return path electricity may then travel by a different path. Power flow entering in one phase returns through remaining two phases. Neutral point is not at ground level but it floats up to Line voltage. This situation can be very dangerous and customers may suffer serious electric shocks if they touch something where electricity is present.
Normal Power Condition and Floating Power Condition
Normal power condition On 3-Φ systems, there is a tendency for the star point and phases to want to ‘balance out’ based on the ratio of the leakage on each phase to earth. The star-point will remain close to 0V depending on the distribution of the load and subsequent leakage. 3-Φ systems may or may not have a neutral wire. A neutral wire allows the three phase system to use a higher voltage while still supporting lower voltage single phase appliances. In high voltage distribution situations it is common not to have a neutral wire as the loads can simply be connected between phases.
The neutral should never be connected to a ground except at the points at the service where the neutral is initially grounded (at Distribution Transformer). This can set up the ground as a path for a current to travel back to the service. Any break in the ground path would then expose a voltage potential. Grounding the neutral in a 3-Φ system helps stabilize phase voltages. A non-grounded neutral is sometimes called as floating neutral and has a limited applications.
Floating power conditions Power flows in and out of customers premises from the distribution network, entering via the phase and leaving the neutral. If there is a break in the neutral paths electricity may travel by the different path. Power flow entering in one phase leaves through the other two phases. Neutral point is not to ground level but it Floats up to Line Voltage. This situation can be very dangerous and customers may suffer serious electric shocks if they touch something where electricity is present. Broken neutrals can be difficult to detect and in some instances may not be easily identified. Sometimes broken neutrals can be indicated by flickering lights or tingling taps. If you have flickering in lamps, this may cause a serious injury or even death.
Various factors which cause Neutral Floating There are several factors which are identified as the cause of neutral floating. The impact of Floating Neutral is depend on the position where neutral is broken.
At the 3-Φ Distribution Transformer
Neutral failure at transformer is mostly failure of neutral bushing.
The use of Line Tap on transformer bushing is identified as the main cause of neutral conductor failure at transformer bushing. The conductor start melting and resulting broke off neutral.
Poor workmanship of installations and technical staff also one of the reasons of neutral failure.
A broken neutral on 3-Φ transformer will cause the voltage float up to line voltage depending upon the load balancing of the system. This may damage the customer equipment connected to the supply.
Some customer will experience overvoltage while some will experience low voltage.
Broken overhead Neutral conductor in LV line
The impact of broken overhead neutral conductor at LV overhead distribution will be similar to the broken at transformer.
Supply voltage floating up to Line voltage instead of phase voltage. This type of fault condition may damage customer equipment connected to the supply.
Broken Service Neutral conductor
A broken neutral of service conductor will only result of loss of supply at the customer point. Not any damages to customer equipment.
High Earthing Resistance of Neutral at Distribution Transformer
Good earthing resistance of earth pit of neutral provide low resistance path for neutral current to drain in earth. High earthing resistance may provide high resistance path for grounding of neutral at distribution transformer.
Limit earth resistance low to permit adequate fault current for operation of protective devices in time and to reduce neutral shifting.
Over Loading and Load unbalancing
Distribution network overloading combined with poor load distribution is one of the most reason of neutral failure.
Neutral should be properly designed so that minimum current will be flow in to neutral conductor.
In overloaded unbalancing network lot of current will flow in neutral which break neutral at its weakest point.
Poor Workmanship and maintenance
Normally LV network are mostly not given attention by the maintenance staff. Loose or inadequate tightening of neutral conductor will effect on continuity of neutral which may cause floating of neutral.
How to detect Floating Neutral Condition in Panel Transformer secondary in star connected, then Phase to Neutral = 240V and Phase to phase= 440V.
Condition 1: Neutral is not floating In this condition, the voltage will be same as per the above voltages under balanced condition.
Condition 2: Neutral is floating
All appliances are connected In this condition, it is being fed with a very small current flowing from the phase supply via the plugged-in-appliances to the neutral wire.
All appliances are disconnected In this condition, the neutral will no longer seem to be Live because there is no longer any path from it to the phase supply.
Phase to phase voltage: 440C AC
Phase to Neutral voltage: 110V to 330V AC
Neutral to Ground voltage: 110V
Phase to Ground voltage: 120V
Methods of elimination of Neutral Floating There are some point needs to be consider to prevent such situation of neutral floating.
Use 4 Pole Circuit breaker/ELCB/RCBO in distribution panel provides tripping to the circuit without damage to the system.
Use voltage stabilizers with wide input voltage range with high & low cutoff.
Good workmanship and maintenance.
HEALTH EFFECTS OF ELECTRICAL POLLUTION [10]
While the term electrical pollution is not a scientific term, there has been a lot of research and case studies done to understand the connection between electrical pollution and human health. Some are as under:
The wire and transformers are not only delivering the juice to run the electrical devices, but are also the carrier of dangerous high frequency currents. The high frequency currents most commonly created by computers and other electronic devices are circulated by various wires and system emitting high frequency currents in homes or office environments. Some of those health problems being attributed to electrical pollution include fibromyalgia, attention deficit disorder, asthma, chronic fatigue syndrome, diabetes, multiple sclerosis and migraine headaches.
Reduced blood glucose levels.
Improved diabetes.
Improved asthma.
Improved multiple sclerosis.
Higher PH (reduced acidity).
Increased headaches frequencies.
Improved teacher & student well-being.
Reduced insomnia.
Higher dirty electricity has been correlated with Increased cancer incidence.
Experiencing Fatigue.
Chills
Fever and dry throat on consistent basis.
Reduced sleeping.
Due to some internal factors such as electronic equipment that distorts 50hz power when the dc power has created ac power. A distorted 50Hz wave is a normal 50Hz current polluted by high frequency voltages and currents.
A filter and a meter have been created to measure and control the electrical pollution, the filters are inexpensive and have proven to be effective in controlling the harmful high frequency currents from entering homes or offices. The Graham-Stetzer [11] (GS) meter and GS filters are the most common tools to measure and reduce electrical pollution. The technology used to create the GS meters and filters is based on electromagnetic theories and power engineering principles. The filters provide a low impedance path for high frequency currents from the hot wire(s) to the neutral wire path bypassing the customer loads. Filter frequency ranges from 4 kHz to 100 kHz provide optimal results for cleaning the electricity. Any frequencies above 100 kHz or below 4 kHz are hard to detect by the filters.
Averaging or RMS meters do measure the amount of electricity present, but the GS meters have demonstrated their ability to measure the amount of harmful electricity present. Electrical current enters the body more readily at higher frequencies, and body current at those higher frequencies can be harmful. The GS meter measures currents at those higher frequencies by measuring the sum of the frequencies above 60 Hz.
CONCLUSION
Electrical pollution, otherwise known as dirty electricity is a term used to describe a type of electrical phenomenon occurring worldwide. However, the phenomenon is not widely known, and can be complex to understand. But research and case studies have shown that consumers should learn about electrical pollution, how it is controlled and measured, the health effects, and public protection against electrical pollution. With this in mind, it is important to understand what causes electrical pollution and what to look for in your everyday environment and home. Many people complain about a variety of side effects to dirty power, these can include headacks, ringing in the ears, trouble focusing, and a variety of other symptoms. If you suffer from some of these symptoms then you may want to discuss this with your doctor. Electrical pollution can be controlled with special filters designed by Graham Stetzer. Graham Stetzer filters (GS filters) can help reduce the harmful electricity that enters home or office environments. The GS filters work best when the utility has an adequate neutral conductor. This means that the conductor can handle more than the standard utility practice to meet thermal or voltage regulation. The above prospective are the major issues responsible for electrical pollution in our environment and can be the solution techniques for implementation.
References
Magda Havas, “Health concerns associated with Energy efficient lighting and their Electromagnetic emissions”, Scientific Committee on Emerging and Newly Identified Health Risks (SCENIHR), June, 2008.
S Durairaj & Revathy Subhiah Rajaram, “E-Waste Recycling-A potential business opportunity in India”, Journal Electrical India, Edition January, 2014.
Mrugen Sheth & Amrita Tondon, “Understanding of Arc Flash Hazard in Power System”, Journal Electrical India, Edition September, 2014.
V V Khatavkar & S N Chapbekar, “Study of Harmonics in Industries- A power quality aspect”, Journal Electrical India, Edition November, 2006.
Sachin K jain & S N Singh, “Estimation of Grid Harmonics in the Modern Electric Power Systems”, Journal Electrical India, Edition July, 2012.
Nagarjun Y, “Lightning and Surge Protection for Motors”, Journal Electrical India, Edition July, 2013.
R. Ramanujam, “An introduction to Power System Stability, Control & Operation”, ISTE-WPLP Learning Material Series, Edition 2014, page no. 75
Jignesh Parmar, “Impact of Floating Neutral in Power Distribution”, Journal Electrical India, Edition February, 2014.
Rabinarayana Parida, Pranati Panigrahi & Bibhu Prasad Nanda, “Flicker meter and its application for Lightning apparatus”, Journal Electrical India, Edition June, 2013.
Report of “The National Foundation for Alternative Medicine”, “The health effects of electrical pollution”, 1629 K Street NW Suite 402, Washington DC, 2006.
Report of “Stetzer Electric”, “Manufacturers of dirty electricity filters and meters”, pp. no. 6-8, www.dirtyelectricity.org, 2005
Published by Franyois Martzloff, National Institute of Standards and Technology*, Gaithersburg MD 20899 USA
*Electricity Division, Electronics and Electrical Engineering Laboratory, Technology Administration, US. Department of Commerce.
Abstract
The paper presents an update, including a brief historical background, on the work to be undertaken at the International Electrotechnical Commission (IEC) to address power quality issues. To be useful, this work must take into consideration the three principal stakeholders, namely the producers of electric power, the manufacturers of equipment that use electric power, and the users of that equipment. Other stakeholders include manufacturers of power quality monitors, manufacturers of line conditioners, and power quality consultants. At this time there are some differences of perceptions on how the work can be accomplished to best serve the interests of all stakeholders. Nevertheless, there is no disagreement on the first goal to be reached, which is to catalyze development of compatible, comparable, and consistent results in the measurement of power quality parameters.
Introduction
In a landmark 1996 decision, the Committee of Action of the IEC approved a recommendation to undertake work on power quality issues as part of the scope of Technical Committee TC77 on Electromagnetic Compatibility (EMC). This decision, recommended by an Ad Hoc Group composed of power quality experts from ten countries, marks an expansion of the scope that will then reach beyond the purely technical issues generally addressed by the EMC community. Power quality and EMC share many concerns, to the point that each has at some time been described as being a subset of the other. In addition to this fundamental aspect, other issues permeate any discussion of power quality. It would be more accurate to draw a multi-dimension diagram with many overlaps (see Figure 1). The Ad Hoc Group considered three areas of contributions which an IEC Power Quality Group could make, complementing the work currently done by existing working groups or project teams of TC77:
Bringing order to the present chaos of uncoordinated methods of monitoring power quality
Proposing a classification of power quality levels describing what end-users can expect
Building bridges among producers and users of electric power, and equipment manufacturers
Concerns have surfaced that undertaking such work might ultimately result in the development and imposition of standards on the quality of “electricity as a product” and create an adversarial relationship, where for the moment the emphasis is on cooperation. There is a need to reduce these concerns by defining more clearly the objectives and work program of this new IEC activity.
Power quality issues involve overlapping stakeholders’ interests or technical aspects in many domains. In this figure, four domains are represented as planes in an exploded view, showing how for each domain, developing a Power Quality (PQ) document will involve overlapping topics and draw upon the interests and expertise of the stakeholders. A successful development will integrate all topics in each domain, and consolidate all domains into one entity. (Note how the artist has provided registration pegs on the planes so that the re-assembly will be a good fit !)
Figure 1 – The many dimensions of power quality issues
Power Quality in Other Organizations
The term “Power Quality” first appeared in the U.S. literature in the late seventies 1,2,3 ,used at first by the computer-user community in a somewhat negative context, as it seemed to be associated with anecdotes or complaints of malfunctions attributed – correctly or incorrectly – to “poor power quality.” At the beginning, there was a tendency to look for a culprit, the users blaming the electric power being supplied to them, and the electric power supplier blaming insufficient immunity of the equipment to unavoidable disturbances.
Even when a solution was indeed in sight, there remained among some stakeholders some reluctance to assume the cost of correction, and attempt to pass it on to the other stakeholder(s). The “boundary” of the stakeholders was often defined as the revenue meter, as if electrons would change their behavior when going through the current coil of the meter.
Technically sound and economically viable solutions will depend on the cooperation of three principal stakeholders:
Producers of electric power;
Manufacturers of equipment that uses electric power;
Users of equipment that uses electric power.
Perhaps not immediately obvious, but three other important stakeholders in correcting power quality problems are:
Manufacturers of power quality monitoring instruments;
Manufacturers of line conditioning equipment;
Consultants called upon to solve power quality problems.
Considerable progress has been made since the early days in bringing the parties together to seek mutually satisfactory solutions rather than hunt for culprits. The PQA conferences held in the last several years are a good indication of this change of mood and mode. We now hear the word “interface” more often than the word “boundary” suggesting that disputes are being replaced by constructive dialog. The term and concept of “System Compatibility” have also become more visible 4,5,6,7 , with the goals of the utilities defined as making their customers satisfied and helping customers to be more competitive, rather than merely supplying them with electric power.
Many electric utilities have instituted power quality programs in their customer services, some as a defensive or reactive step, others as a proactive and marketing strategy. Engineering societies have also focused on practical, application-oriented power quality issues, while initially the standards activities were slow in reacting to the growing interest in those issues. Since then, several organizations have established power quality programs for developing standards or contributing to the development of standards, including the Canadian Electricity Association (CEA)8, the European Committee for Electrotechnical Standardization (CENELEC)9, the Electric Power Research Institute (EPRI)10, the Institute of Electrical and Electronics Engineers (IEEE)11, and the International Union of Producers and Distributors of Electrical Energy (UNIPEDE)12. All of these organizations have allocated substantial resources to address power quality issues.
One of these issues in particular is the incompatibility found when attempting to analyze and compare the results of power quality surveys based on different definitions or measurement methods 13, 14, 15. This incompatibility is rooted on different definitions of disturbances, and hence different algorithms in the software of power quality monitoring instruments. Eliminating these incompatibilities is one of the prime motivations for the proposed IEC work that will first focus on measurement methods.
Power Quality vs. Voltage Quality
At the risk of oversimplification, one can identify two different approaches to addressing power quality issues on the two sides of the Atlantic Ocean. In Europe, attention seems to have focused on the “voltage quality” while in North America, the concerns fell under a broader umbrella of “power quality.” While the difference may seem to be a mere linguistic subtlety between the U.K. English which is the official English of the IEC and the U.S. English which is the unofficial English of the IEEE, the words also reflect a difference in perspective. In French, the second official language of the IEC, one finds the label of “qualité de la tension” (tension = voltage), reflecting the emphasis on voltage. Perhaps as a result of this difference of perceptions, the few existing bilingual IEC documents on the subject have not yet provided a satisfactory equivalent in the two languages
An anecdote can best illustrate this subtle perspective difference: in what the U.S. community would recognize as a power quality pamphlet influenced by the European Community, the untranslatable caption of a cartoon from Electricite de France, “Bien vivre avec sa fension” (Figure 2) proposes the double-entendre of learning to live with “tension” – understood as the blood pressure of the end-user, or “tension” – understood as the system voltage. Hopefully, there will not be a triple-entendre where the word “tension” would refer to a sag, or to strained relations among the three principal stakeholders, resulting from concerns over the forthcoming IEC work on power quality issues. The caption of Figure 2 is an attempt at providing in the power quality context a culturally-equivalent rendition of the French for an English-speaking audience.
Figure 2 – Live long and prosper with your power quality
Somewhat in contrast with the emphasis on voltage -but certainly not in conflict – the U.S. perspective has included more than just supply voltage in the power quality issues. An often-cited statement in power quality articles is ” … 83% of the alleged power quality problems are actually end-user wiring problems” and one article even shows a screwdriver as “the primary tool for solving power quality problems.” This broad perspective is also illustrated by an IEEE standard, part of the ZEEE Color Books series, on powering and grounding for sensitive loads ” which is clearly related to power quality issues.
Satisfactory Operation vs. Voltage Quality
During the proceedings of the IEC Ad-Hoc Group meeting held in April 1996, interesting discussions took place among the participants on their respective proposals for a definition of power quality – a necessary prerequisite to undertaking work on the subject. A compromise consensus emerged so that the group would be able to present a recommendation for action where the terms would be defined. One of the proposals had emphasized the voltage parameters, while another proposal had related power quality to satisfactory operation of the user’s equipment. The resulting definition, cited below, still reflects these two points of view:
Power Quality – Set of parameters defining the properties of the power supply as delivered to the user in normal operating conditions in terms of continuity of supply and characteristics of voltage (symmetry, frequency, magnitude, waveform).
Note I: Power Quality expresses the users’ satisfaction with the supply of electricity. Power Quality is good if electricity supply is within statutory and any contractual limits, and there are no complaints from users, and vice-versa it is bad if the power supply is outside of limits and there are complaints from users.
Note 2: Power Quality depends not only on the supply but can be strongly affected by the users’ selection of equipment and installation practices.
It will be one of the tasks (challenges?) of the group working on the forthcoming documents to allocate appropriate attention to the two points of view rather than to consider them as mutually exclusive.
Forthcoming IEC Work on Power Quality
The approach now being considered by the IEC is to initially limit power quality work to measurement methods, and perhaps even to a narrower limit of characterization of voltage parameters. Starting with measurement methods certainly is a necessity to get the work under way and ensure that all parties speak the same language when discussing power quality parameters. However, stopping there, useful as it may be to catalyze compatible dialog between producer and consumer of electric energy (power) will not be sufficient to fulfill the expectations of equipment users. From all the fuss about power quality being addressed at the IEC, they expect that more satisfactory operation of their equipment will be facilitated by the commitment of resources now envisaged by contributors to the IEC process, and that objective and reliable guidance will be found in the new documents.
As mentioned in the Introduction, an Ad-Hoc Group of representatives from several national or international organizations and committees developed a recommendation to begin work on power quality, starting first on measurement methods. This priority is a recognition of the present uncoordinated efforts among dedicated, but isolated, organizations which have produced incompatible or contradictory results among power quality surveys conducted by different organizations. The decision by the IEC Committee of Action to accept the recommendation developed by the Ad-Hoc Group has now cleared the way for New Work Item Proposals (NWIP), the method used by the IEC to launch the development of new documents, to be submitted to the IEC National Committees for approval.
As of the writing of this paper two NWP proposals have been circulated. One, originating from the French National Committee, has the title “Measurement Guide for Voltage Characteristics” while the other, submitted by the U.S. National Committee, has the title “Power Quality Measurements” again reflecting the difference in perspective. The French proposal somewhat mirrors the UNIPEDE12 approach while the U.S. proposal includes all the topics listed by the Ad-Hoc Group as well as a reference to the IEEE Standard 115916. The French proposal concentrates on low-frequency disturbance characterization, including power frequency, voltage magnitude, voltage fluctuations, voltage dips, harmonic voltages, and signaling voltages, but downplays transient overvoltages (surges). It also makes several references to “Compliance with EN 5016011 which might be seen as leading to mandatory clauses. The US. proposal includes a comprehensive list of disturbances, suggests tutorial clauses on definitions and origins of disturbances, and even the possibility of providing some tutorial material on remedial or preventive actions. Both proposals follow the Committee of Action decision that Technical Committee TC77 should be the principal responsible committee for this work, in coordination with Technical Committee TC8 (Standard voltages, current ratings and frequencies).
The officers of TC77 are on record as recommending that the two proposed projects be merged into a single project since it is clear that both proposals share the same goal of developing compatible, comparable, and consistent results in the measurement of power quality parameters. The responses from the National Committees will not be compiled before late June 1997, but some responses will be known by the time of presentation of this paper. Hopefully, the responses will be positive and the paper presentation will include an update on the project planning.
Conclusions
The first step has been taken at the IEC to start working on the development of documents addressing power quality issues.
The challenge will now be to proceed diligently to satisfy the needs of end-users and not have the work stalled by the difficulties of reaching consensus among many stakeholders.
The decision to start with measurement methods will enable development of a common language and build a working relationship among the participants which should promote continuing progress toward technically sound and cost effective solutions for the problems perceived – correctly or incorrectly – as power quality problems encountered by end-users in the equipment operation
Acknowledgments
Support for developing this paper, as well as support for participating in the related IEC work, was provided by the author’s agency, by EPRI, by Delmarva Power, and by Pacific Gas & Electric. Gerald FitzPatrick and Thomas Key provided helpful comments on the draft.
References
Key, T.S., “Diagnosing Power-Quality Related Computer Problems,” IEEE Transactions LA-15 No.4, July 1979.
Goldstein, M. and Speranza, P.D., “The Quality of U.S. Commercial AC Power,” Intelec Conference Proceedings, 1982, pp 28-33.
Clemmensen, J.M. and Ferraro, R.J., “The Emerging Problem of Electric Power Quality,” Public Utilities Fortnightly, November 28, 1985, Arlington VA.
Gruzs, T., Key, T.S., Sitzlar, H.E., and Lai, J.S., “Compatibility at the Utility Interface: The UC Concept Applied to Surge-Protection Systems,” Proceeding, PQA ’91.
Martzloff, F.D., “Performance Criteria for System Compatibility,” Proceeding, IEEE APEC Conference, 1992, pp 287-292.
Key, T.S., Sitzlar, H.E., and Moncrief, W., “Electrical System Compatibility Applied to End-use Equipment Characterization Projects,” Proceedings, PQA ’92.
Key, T.S., Dorr, D.S., Hughes, M.B., and Stanislawski, J., “Matching Electronic Appliances to their Electrical Environments,” Proceedings, PQA ’95.
CEA 220 D 71 1 – Power Quality Measurement Protocol – Guide to Performing Power Quality Surveys, Canadian Electricity Association, May 1996.
EN 50 160 ” Voltage Characteristics of Electricity Supplied by Public Distribution Systems,“ November 1994.
EPRI, Signature – A quarterly newsletter on power quality issues.
IEEE Std 1 100- 1992 “Recommended Practice for Powering and Grounding Electronic Equipment“.
UNIPEDE “Measurement Guide for Voltage Characteristics,” May 1996.
Martzloff, F.D. and Gruzs, T.M., “Power Quality Site Surveys: Facts, Fiction, and Fallacies,” IEEE Transactions IAS Vol24 No.6, November/December 1988, pp 1005- 1018.
Dorr, D.S., “Point of Utilization Power Quality Study Results,” IEEE Transactions IA-3 1 , No.4, July/August 1995.
Martzloff, F.D., “Surge Recordings that Make Sense: Shifting focus from voltage to current measurements,” Proceedings, ROMA ’96 EMC Symposium, September 1996.
IEEE Std 1159- 1995 “Recommended Practice for Monitoring Electric Power Quality“
Published by Bruce Lonie, President, POWERetc Corporation, 3350 Scott Blvd., Bldg 55 Unit 1 Santa Clara, CA 95054 USA, (408) 540-3199 | m (408) 666-6500, Email: BruceL@POWERetc.com | Website: www.POWERetc.com
1.Do the simple things first.
2.There is always more than one problem. There are always more than one or two problems, keep looking and you will find them.
3.The problem investigation is like peeling the layers of an onion. When you peel away the last layer the onion is gone… and so is the problem.
4.Fix the problems as you find them… if you can.
5.The customer (aka client) NEVER tells you the whole story. Every time you talk with them you learn another nugget of knowledge.
6.Never believe someone else’s measurements or test results. Worst case, you verify the readings and that the test results are correct.
7.Be nice to everyone, you never know who will provide you with an important clue.
8. If it is happening in the electrical environment you can figure out a way to measure it.
9.Substitute technology (multiple monitors) for time… it speeds up the investigative process and provides more and better-quality data for analysis. Labor (time) is the most expensive cost component of an investigation, equipment (technology) is relatively inexpensive. Use equipment with remote communications capabilities to save labor.
10.You are NOT allowed to repeal any of the basic laws of physics.
11.Ohm’s Lawand Kirchhoff’s Law solve most problems…use them wisely.
Published by Vladimir Kraz, 3M Company, 3601-A Caldwell Dr., Soquel, CA 95073, Tel. 408-202-9454 FAX 206-350-7458 Email: vladimir.kraz@gmail.com
Abstract
EOS (Electric Overstress) is a serious threat to defect-free manufacturing, long-term product reliability and interruption-free manufacturing process. This paper summarizes the sources of EOS, its impact on production and suggests classification of EOS occurrences into models in a similar fashion to ESD Events.
Introduction
EOS, or Electric Overstress, in general is an occurrence of overvoltage or overcurrent to a device. EOS in its broadest definition includes electrostatic discharges, or ESD Events. However, more narrow and more widely used definition of EOS limits overvoltage and overcurrent occurrences to differentiate it from ESD Events. There are several important properties that separate EOS and ESD occurrences:
Table 1. Comparison between ESD and EOS Events
ESD Event
EOS Event
ESD Event is caused by a rapid discharge of accumulated electrical charge. Once this accumulated charge is consumed, ESD Event can no longer manifest itself.
EOS Event is caused by voltage and/or currents associated with operation of equipment or with power generating equipment
ESD Event lasts typically nanoseconds – the time necessary to dissipate accumulated charges
EOS Event can last as long as the originating signal exists. There is no inherent limitation on its duration
SD Event is characterized by a specific waveform. While the waveforms of different models of ESD Events (CDM, HBM, MM and others) certainly differ in appearance, in general their properties include rapid rising edge (within few nanoseconds) and an asymptotic rear edge lasting typically less than 100nS
EOS Event can technically have any physically possible waveform – the sources of EOS are often unpredictable. There are some major categories, however, which would be described further in the text
ESD Events are nonperiodic and non-repeatable – accumulation of charges cannot be guaranteed or accurately predicted
EOS Events are often (not always) periodic and repeatable
Effect of EOS on Devices
The effects on the device from an ESD Event and an EOS Event can be quite different. At a risk of oversimplification, an ESD Event could be compared with emptying a cup of water on a floor. There is a resulting small puddle, but once the content of a cup (i.e. charge) is gone, there is no more water coming and the water damage is thus limited. An EOS event could be compared with an open faucet. However little water it may drip in comparison with the sudden flow of water from the cup, with time this trickle may flood the entire floor and cause significant damage. Duration of a typical ESD Event is several magnitudes less than duration of most EOS Events, therefore this comparison “holds water.”
A most typical semiconductor device can be damaged by an ESD Event of magnitude of anywhere from 100V to 250V CDM (of course, the overall damage level is much wider). EOS-induced damage, however, occurs at much lower levels. IPC-A-610 and IPC-7711, the standards used by PCB Assembly plants to control quality of electronic assemblies, recommend that the EOS levels should be kept below 0.5V and in the case of sensitive assemblies – below 0.3V (IPC-A-610 Acceptability of Electronic Assemblies)1. Why there is such discrepancy in damage voltage levels? This has to do with the waveforms of the exposure, not just with the absolute EOS voltage levels. Similar discrepancy exists between different ESD discharge models – the same device may be damaged by 2000V HBM model, while being sensitive only to 100V CDM model discharge.
According to 2, one of the mechanisms of damage due to EOS is thermal runaway from Joule heating (excessive current). This is also systemic to ESD Events as well. While overheating due to ESD requires significant current injection over very short period of time, to achieve similar effect a smaller current that would last significantly longer would suffice. An ESD Event that lasts a few nanoseconds may generate similar amount of heat as a much smaller EOS Event that would last thousands or even millions times longer – microseconds or milliseconds.
To the author’s knowledge, at the present there is no established correlation yet available between the levels of damage due to ESD and the ones due to EOS. This paper recommends that such relationship is examined by the experts in the industry and, if possible, a correlation is established for the benefits of the industry.
Other Effects of EOS
Besides direct damage to the devices, undesirable voltage in tools may affect tools’ normal operation, extending from erratic operation and tool’s lock-up to altering test results during IC test and board test. Especially, high-frequency noise can be a significant contributor to parametric errors for low-voltage devices and circuits. This paper (EMI Issues in the Manufacturing Environment)3 outlines possible consequences of excessive noise in the environment.
Types of EOS in Manufacturing Environment
There is a large variety of types of EOS occurrences in a typical production environment. This paper outlines the most common types and provides brief description of their properties and their most likely origins.
Mains-Caused EOS (AC 50/60Hz) Voltage Induction
Since most of equipment operates on power from mains, it is not surprising that mains’ artifacts can be present in some tools. Poor wiring schemes, lack of adequate grounding and ground loops are all contributors to that. Yan and Gaertner4 show AC voltages up to 2.3V in wire bonding tools. The data from this paper clearly shows the strong relationship between ground impedance and the AC voltage – the higher the ground impedance, the higher the resulting AC voltage. Several questions arise: how did this voltage end up there and whether this voltage offers any danger to the components given that the impedance is high enough to be perceived to limit resulting current to just few microamperes.
Figure 1 shows one way how AC voltage can be induced into the tool. A source of AC voltage VAC which can be any object that is connected to the mains, or simply the wire carrying mains voltage, is coupled via capacitive coupling or some resistive leakage to the point of our interest VB. For capacitive coupling the source and the target simply have to be reasonably close to each other and have sufficient mutual surface areas to form a capacitor. Resistive coupling is simply parasitic leakage via imperfect insulation. RL is connection of the part of the tool of interest to us to ground.
Not trying to complicate this paper with formulae, it should be obvious to the reader that the smaller the ground impedance RL, the smaller voltage VB would be observed. This confirms the paramount need to keep ground impedance the lowest possible. It should be noted that it is nearly impossible to determine with finality all the leakage paths in real-life situations, so any calculations would result only in estimates.
Figure 1. Induction of AC Voltage
Neutral/Ground Reversal
It is an unfortunate occurrence when neutral and ground wires in the tool or in the outlet itself are reversed. In author’s experience this happens even in the best-run facilities anywhere in the world. To complicate the matters, conventional testers such as ubiquitous three-light checker obtainable from hardware stores cannot test for this situation.
Figure 2. Live and Neutral
As seen in Figure 2, every wire has finite impedance, therefore the voltage on the end of the load connected to neutral wire is not zero. The higher the current consumption and the smaller the gage of the wire, the higher the voltage on the neutral end of the load. If the neutral end of the load is connected to ground wire by mistake, then the ground at that point would be under voltage. In such scheme, the ground end of the power cable is then connected to the neutral at the power outlet further adding to the problem and complicating the situation. Since the current consumption in most tools is seldom continuous – it peaks whenever a motor or other actuator starts – the parasitic EOS voltage on ground may be present only during these times, further complicating diagnosis.
Figure 3. DC Current Return Via Chassis
Current Induction
Strong currents, would they be in wires connected to the motors and other current consumers in the tool or within the motors, heaters and other devices, generate magnetic fields which, in turn can produce currents and voltages in largely accidental loops within the same tools. These currents and voltages are more difficult to analyze since engineers and technicians who service the tools seldom use magnetic field sensors for the mains frequencies, however such tools are widely available and are recommended to use in conjunction with time-domain instruments, such as an oscilloscope. Conventional magnetic field meters may not be fast enough to register transient currents on start-up.
DC-Caused EOS
Many tools utilize a number of DC-powered motors (including stepper motors), solenoids, electronic circuits and other current consumers. In many cases one of the power terminals (mostly the negative one) is grounded and the ground ends up being the return path for the current. No matter how large the cross-section of the tool chassis is, its resistance is not zero. Low-voltage DC motors and alike can consume significant current, especially during start-ups. Figure 3 depicts a typical situation. A negative terminal of DC power supply is normally grounded to a chassis and the return current from motor as shown is done via the chassis as well. Chassis resistance is finite, therefore there will be a difference in potentials between the point of connection of the motor and “real” ground. If a device resting on such chassis comes in contact with the properly-grounded object, it will be subjected to this potential differential resulting in EOS.
High-Frequency Noise (EMI)
This subject was covered in details in 5. To summarize, high-frequency signals are usually parasitic in nature (exception to that is outlined below) and are result of transient signals generated by operation of such equipment as stepper and variable-frequency motors, solenoids, relays and alike. The higher the power consumption of such device, the stronger the EMI signal. Figure 4 shows typical signal on ground generated by EMI. As seen, it is anything but continuous waveform. When assessing EMI signals for possibility of EOS, it is imperative that the instruments with ability to capture the peak signal are used. In author’s experience, it is not uncommon to encounter spikes of up to 20V on ground and in power lines.
There are cases, however, when the predominant signal in cables and wires is continuous waveform. This occurs in places where RFID is used to keep track of products in process. Passive RFID tags require strong magnetic field to power them up which results in strong induced signals into anything resembling a conductive loop, which is not difficult to find in production tools. Resulting voltage at frequencies typically 13.56MHz then propagates through wires throughout the facility.
Figure 4. Typical EMI Waveform on Ground
Ground Bounce
Figure 5. Ground Bounce
This phenomenon deserves special considerations for high frequency signals. Though mostly attributed to ICs and PCB layout issues, ground bounce is a significant factor for the factory-scale signals. This paper by Phil King, Agilent Technologies6 provides adequate background of the phenomenon of ground bounce. In short, when ground wire has substantial impedance at high frequencies, current passing through this wire from noise generating equipment to ground produces voltage across this wire thus floating what was supposed to be ground of the tool – see Figure 5. According to calculations in this paper 7 (V. Kraz, P. Gagnon, How Good is Your Ground) this voltage may reach several volts. The example below shows the case of long grounding wire. Inductance of a straight wire at high frequencies can be calculated as
where
L – inductance in mH r – radius wire, cm d – length of wire, cm
A common 10m (30 feet) ground run of 12 gage solid wire has self-inductance at high frequencies of
A 1-mA current at 100 MHz would create a voltage on this length of wire of
V = 2π x 100 x 106 x 17.36 x 10-6 x 0.001 = 10.9 V
This should trigger considerations for proper grounding scheme.
Sources of EOS in Production
Now that we discussed what phenomenon can cause EOS exposure, let’s examine some of the practical sources of EOS in real-life production environment and match them to the physical phenomenon which is manifested in each case. Only very few of such sources are outlined in this paper due to limitation of the scope.
Soldering Irons
The tip of soldering iron touches the most sensitive electric components, therefore it is under the most scrutiny for EOS exposure. Some standards (MIL-STD-2000) require the tip of soldering iron to produce no more than 2mV of signal, which is quite unrealistic in most environments. Papers such as this one8 were written on the subject. Lets take a look why would a tip of soldering iron have voltage to begin with.
Bad Grounding Loss of Ground
If a soldering iron loses ground, the tip of the iron can have any voltage up to ½ of the supply voltage to the iron. The voltage due to ground loss is usually AC 50/60 Hz. DC voltage on the tip would be contributed to other phenomena, usually caused by defective power supply in the iron itself. In the very best case the voltage at the tip of the iron due to loss of ground would be equal to voltage on neutral which, as discussed before, is not zero and is typically several volts of AC. Loss of ground can occur within soldering irons themselves or in power outlets. Raytheon9 reported in 2005 massive failure of ground in power outlets which led to EOS and resulting damage in sensitive circuit. Reversal of ground and neutral also leads to excessive voltage at the tip.
Noise on Ground
Whatever signal is present on ground, it will be present on tip of the iron. Noise on ground can be quite high as it was discussed before. When the voltage on the tip is measured with a multimeter or an off-the-shelf iron checker, it will easily miss high-frequency signals and especially spikes that are so typical in the production environment. It is imperative to be able to measure voltage with instruments that are capable of measuring high-frequency spikes. A high-speed digital oscilloscope or a dedicated meter with high-frequency capabilities should be used.
Noise on Power Line
Noise is propagated not only via ground but via power lines as well. Transformers and power supplies converting mains voltage to 24V or alike are usually transparent to high-frequency spikes which end up on the soldering iron tip. The effect is similar to being caused by noise on ground and the signal should be measured in similar fashion as above. Power line filters can help to reduce this noise.
Switching Spikes
It is rumored, but not yet confirmed, that switching of the heater during temperature control may generate spikes similar to the ones from other sources. No evidence to this or contrary to this was yet collected and the readers are encouraged to experiment in order to either confirm or discard this speculation. Keeping in mind that such signals would be transient in nature, instruments capable of capturing such signals should be used.
Tip Oxidation
Signal on the tip can be induced by capacitive coupling from AC voltage sources from the heater element. Normally, if the tip is well-grounded, the induced voltage on it would be too negligible to measure. However, if the tip of the iron is oxidized and the contact with ground is lost, the tip may have some voltage on it depending on the construction of the iron and heating element.
Power Tools
Such power tools as electric screwdrivers commonly used in electronic assembly may not always have good grounding of the tips during rotation. Grounding via ball-bearings during rotation is a non-working concept since the lubricant in the bearing is insulative. In addition, some mains-powered screwdrivers may not have dedicated grounding since they may be using double insulation to satisfy safety requirements. Resulting voltage on the tip of the screwdriver may be quite high. Author observed 107V AC on the tip of the screwdriver used in assembly of mobile phones in 220V region.
Even the screwdrivers used in equipment for such sensitive process as assembly of disk drives can generate significant voltage. As described in 4 voltage induced into screwdriver’ ground wire by simply its being routed in the same bundle as the wires to stepper motor generating significant spikes.
Power Supply Commutation
This is most important during the IC test and magnetic head test. When an IC is placed in the IC socket, the socket is usually not powered. This paper10 describes the spikes and the transients during powering up the IC during the test. IC failures during IC test are often contributed to such transients. Such transients are hard to capture since they occur only at the moment of commutation and also because access to the test points in the IC handlers is often obscured.
One of the effects of power supply spikes is latch-up. In simple words, latch-up is a phenomenon when a signal outside of power rails of the device transforms the device into a p-n-p-n thyristor structure and the device experiences a runaway current which is liable to overheat the device and to damage it. When a device, such as an IC, fails the test, it is not necessarily the ESD-related damage somewhere in the process. The damage may have had occurred right here in the beginning of the test.
Classification of EOS Events
As seen, there is a plethora of different types of EOS Events in production environment. Due to increasing awareness of EOS exposure and increasing importance of managing EOS, This author recommends that EOS Events are characterized in several general models similar to ESD Event models, such as CDM, MM, HBM, CBM and alike. Such characterization will lead to standardization of tests and to setting requirements to the process and the tools that can be established and verified. Device sensitivity to EOS can also be classified into the “brackets” that can be tested and compared between different companies and laboratories.
Author suggests the following basic types of EOS exposure and associated sources of EOS:
Table 2. Suggested EOS Event Models
EOS Event Model
EOS Exposure Example
Continuous AC
Soldering iron with lost/poor ground
Continuous DC
DC soldering irons, tools
Long Transient Pulse (milliseconds)
Transient signals due to AC commutation
Short Transient Pulse (microseconds)
Transient signals due to EMI on ground
Transient Pulse due to DC commutation
Power supply commutation in IC handlers and alike
At this point the author is reluctant to provide more descriptive classification in hope to collect input from the experts in the industry in order to tap into collective expertise and to gather better classification categories.
References
IPC-A-610 Acceptability of Electronic Assemblies. (n.d.). IPC.
Craig Hillman, PhD, Temperature Dependence of Electrical Overstress
EMI Issues in the Manufacturing Environment, V. Kraz, Conformity, January 2007
Alternative Method to Verify The Quality of Equipment Grounding, Yan, Gaertner, proceeds of 2005 EOS/ESD Symposium
EOS Exposure of Magnetic Heads and Assemblies in Automated Manufacturing, Vladimir Kraz, Patsawat Tachamaneekorn, Dutharuthai Napombejara
Ground Bounce Basics and Best Practices, Phil King, Agilent Technologies
How Good Is Your Ground?, V. Kraz, P. Gagnon, Evaluation Engineering, May 2006
EOS Analysis of Soldering Iron Tip Voltage, Baumgartner, G.; Smith, J.S., EOS/ESD Symposium, 1998
EOS from Soldering Irons Connected to Faulty 120VAC Receptacles, W. Farwell et.al., Raytheon Corporation. Presented at 2005 EOS/ESD Symposium
Carlos H. Diaz, Hewlett Packard, Automation of electrical overstress characterization for semiconductor devices