Published by Qing Zhong1, Wei Huang2, Shun Tao3, and Xiangning Xiao4
Abstract
Power quality (PQ) issues cause a lot economic loss. It is very helpful for the governmental decisions of the PQ policies and supervisions to know the PQ loss from macroscopical aspects. This paper presents the procedure and some interesting findings of the survey of PQ cost of the customers in Shanghai during 2010-2011. The survey was carried out in two steps with 147 valid questionnaire samples among 18 sectors and 40 face to face interviews among 7 sectors. Based on the statistics of the answer of the respondents, there is a lot of information about PQ issues in Shanghai, such as the most frequent PQ events, the most PQ sensitive devices, the causes of PQ events, the effectiveness of the mitigation devices and so on. Finally, the total PQ loss of respondents were counted. By the linear fitting analysis, the PQ cost and annual PQ loss in Shanghai can be estimated. The PQ cost estimation is with high reference value for the government who is in charge of the policies of PQ issues and the customers who select the technical and economic strategies for PQ problems.
Index Terms— Power Quality; Cost Analysis; Relevance Analysis; Macro Prediction
INTRODUCTION
With the development of the digital economics, the digital devices will play more and more important roles in the society. There is hardly a commercial or industrial facility that can suffer a loss of productivity if a serious PQ event were to impact its digital environment [1]. Therefore the economic impact of PQ issues on the whole society is to take serious consideration for the governments, utilities, device manufactures and power customers. PQ cost assessment is to know the PQ loss of the country or areas from macro-approach, which is helpful to execute the PQ management and select the right solution with optimal economic benefit.
IEEE published IEEE Standard 1346-1998 to give a guideline to investigate the economic aspect of PQ [2]. People focused on the cost of harmonics at first, including the additional energy loss, premature ageing and misoperation of the equipment [3][4]. Then with the high demand of the reliability, the methods to evaluate cost of outage had been developed [5][6]. In the recent digital society, the methods to estimate the loss of the voltage sag and short interruption was the hot point of the researches nowadays [7-9]. All the methods can be sorted as two approaches: deterministic and probabilistic. Probabilistic assessment has considered the probability of the PQ events, which is more flexible. The deterministic methods need a lot of economical data, which is very hard work.
There were many countries and areas had surveyed such questions including the loss of power interruption and other PQ issues. In 2001, EPRI published a report based on Primen survey in the United States, which showed that the collectively loss is $45.7 billion a year due to outages and another $6.7 billion a year due to other PQ phenomena. It was estimated that the U.S. economy loss between $104 billion to $164 billion due to outages and another $15 billion to $24 billion due to other PQ phenomena [10]. The Leonardo Power Quality Initiative (LPQI) team published a report about the results of European PQ survey, which comprised of 62 face-to-face interviews across eight European countries in 2008 [11]. The report showed that the PQ loss was about €150 billion, with industrial and services customers wasting around 4% and 0.142% of their annual turnover. In 2001, Taiwan did a survey of interruption cost for 284 high-tech factories. The cost of interruptions was represented as a customer damage function, which gave interruption cost as function of interruption duration. The cost in high-tech was about $37.03/kW for 2 seconds interruption, which was higher than traditional industries [12]. In South Korea, the Korea Electrotechnology Institute in cooperation with Gallup Korea conducted an interview-based survey on 660 industrial customers of various sizes and sectors. The survey presented a method to evaluate productions, sales and extra labor costs respectively, which was incurred from interruption duration and a method to evaluate interruption costs per power use according to interruption durations by industrial customer types [13]. There were many approximate works had done around work and achieve different results, from macro level, the impact of PQ on the society was very obvious and enormous.
In 2010, a survey on PQ cost of power customers was organized by Economic Operation Bureau, Development and Reform Commission, China and executed by Asia Power Quality Initiative (APQI), China Chapter. The survey made experiments in Shanghai, China, one of the largest international cities. The survey team was composed of governments, universities, institutes, utilities and customers. The survey was carried out in two steps with a duration from April 2010 to April 2011. The survey distributed about 500 questionnaires in 18 sectors and did 40 face-face interviews in 7 sectors. By the statics of the answer of the respondents, the PQ cost and annual loss could be estimated. The macro results of survey can help the government improving the PQ management policy and the customer understanding the true effect of PQ issues too.
This paper presents the designation, procedure some key results of the survey. The paper is organized as follows. Section II gives the scope and procedure of survey; section III gives the key results of PQ concerns from the statistics of the first step; section IV gives the key results from economic aspect of PQ, including the PQ loss statistics of the respondents and the PQ cost analysis in the second step. Finally, the survey is summarized and the main conclusions are drawn in the final section.
SURVEY DESIGNATION AND PROCEDURE
Scope of survey
There were 8 PQ problems investigated in the survey:
- Long interruption (including planned and unplanned)
- Short interruption
- Voltage sag and swell
- Harmonic
- Unbalance
- Flicker and fluctuation
- Surge and transient
- Power rationing
The respondents were distributed in 18 key sectors in Shanghai such as banks, foods, semiconductors and so on.
The structure of the PQ cost was in reference to the survey executed by LPQI in Europe [11]. The cost of PQ was composed of two categories: process interruption and noninterruption. The cost of process interruption was composed of six components:
- Works in process (WIP)
- Process slowing down
- Process restarting
- Equipments
- Others
- Savings
The cost of process non-interruption was the same as the cost of process interruption but excluding the WIP.
Survey designation and procedure
The survey was designed with two steps. Step one was carried out with questionnaire to evaluate the PQ concerns of the power customers and select the respondents for step two. Step two was carried out with face to face interviews. The respondents were acquired to fix the loss statistical forms which show the loss data of the power customers including 6 components of the PQ cost.
In step one, there were more than 500 questionnaires distributed to the power customers with different product values, power consumptions and supply voltage levels in 18 key sectors of Shanghai. But only 147 answers were valid. In step two, there were 40 face to face interviews with the respondents among 7 sectors, who were selected from step one. But only 29 answers were valid.
PQ EVENTS STATISTICS
In step one, some aspects of PQ problem can be drawn from the questionnaires of respondents. The respondents chose the sort of PQ events which took effect on the production mostly. The results show in figure 1. 68.9% of respondents consider the short interruption is the first one. The second most PQ event was the flicker and fluctuation. But unfortunately, the customers often misunderstood the voltage sag as the voltage fluctuation. The devices affected by PQ events were shown in figure 2. The most sensitive device affected by PQ issues was computers, which was accepted by 76.9% of respondents. Considering the reasons which cause the PQ problem, the statistic results show in figure 3. Most customers (85.6%) think that the utilities should take responsibility of PQ problems. The customers also thought that the nature (50%) and self faults (51.5%) were the main causes.
(%) N=122
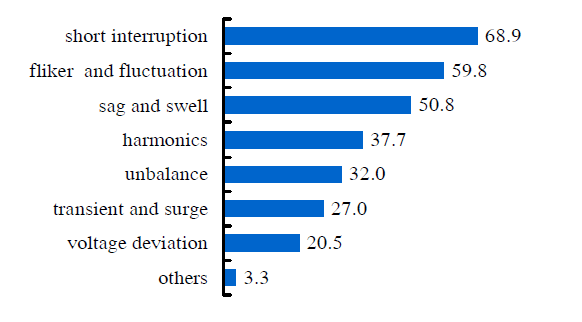
Fig.1 statistics of PQ events affecting on the customers
(%)N=122
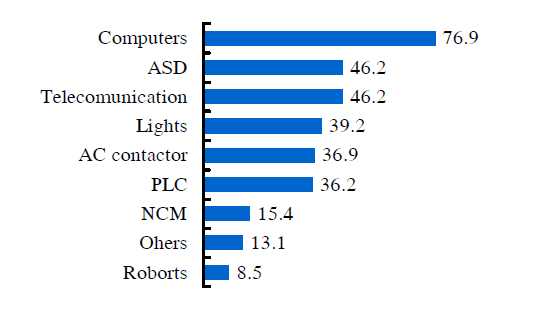
Fig.2 statistics of devices affected by PQ events
(%)N=132
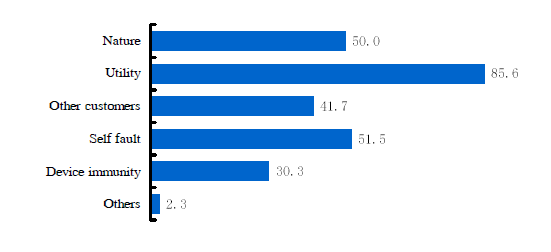
Fig.3 statistics of reasons causing PQ events
(%)N=128
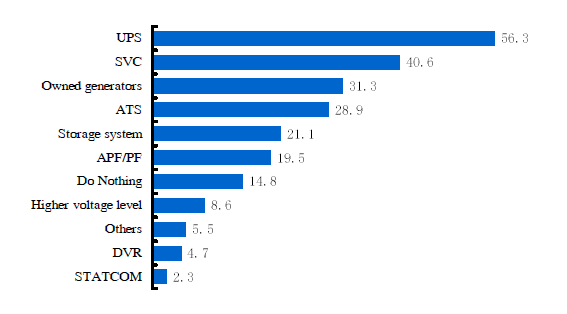
Fig.4 statistics of devices mitigating PQ problem
Many respondents chose some devices to mitigate the PQ problem, and the statistic results was given in figure 4. The most popular device is UPS (Uninterrupted Power Supply). 56.3 percent customer applied UPS to mitigate the effect of PQ issues. At the same time, 40.6% of respondents selected SVC (Static var Compensator). Still 14.8% of respondents did nothing for PQ problems. Therefore, to evaluate the PQ cost can help the customers select the correct strategies to solve the PQ problems.
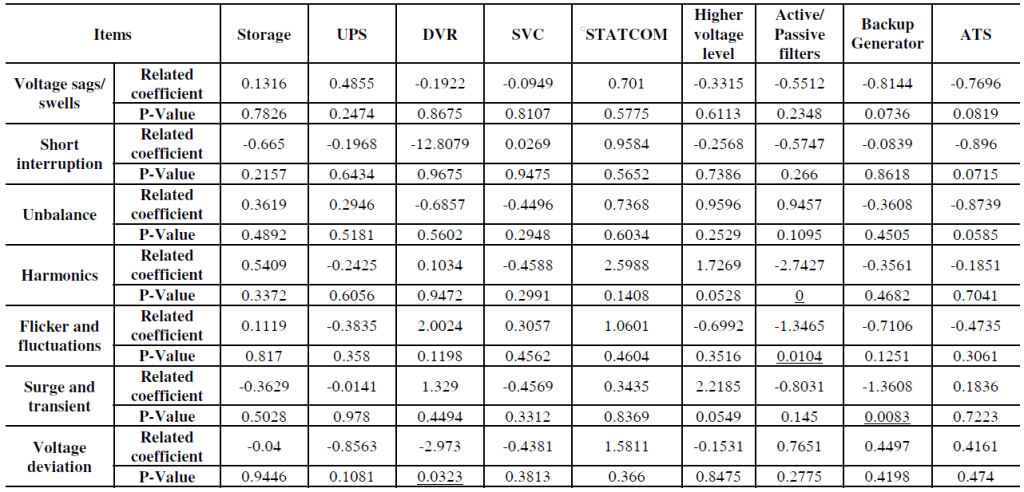
Most of the customers, who applied some approach to reduce the impact of PQ problems, were not satisfied with effectiveness of the mitigation devices. 9.1% of respondents considered that the devices are invalid at all, while only 5.5% of respondents consider the effectiveness is very good as shown in figure 5. Relevance analysis between the device and PQ problems was done according the answers of the respondents and the results were given in table 1. In table 1, when P-value is smaller than 0.05, the two components is consider as related. So, according to table 1, the relationship between harmonics and active/passive filters was correct as we know, but other relationship is not suitable for the mitigating strategies. The conclusion can be drawn that the customer cannot choose the correct solutions for PQ problems excepted for the harmonics, which also cause the effectiveness of solutions is not satisfied.
(%) N=132
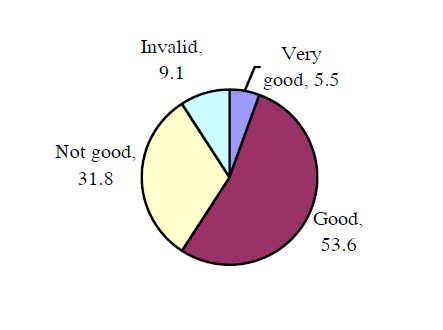
Fig.5 statistics of effectiveness of devices mitigating PQ problem
TABLE 1 RELEVANCE BETWEEN PQ PROBLEMS AND MITIGATING DEVICES
ECONOMIC ASPECT OF PQ
PQ loss statistics
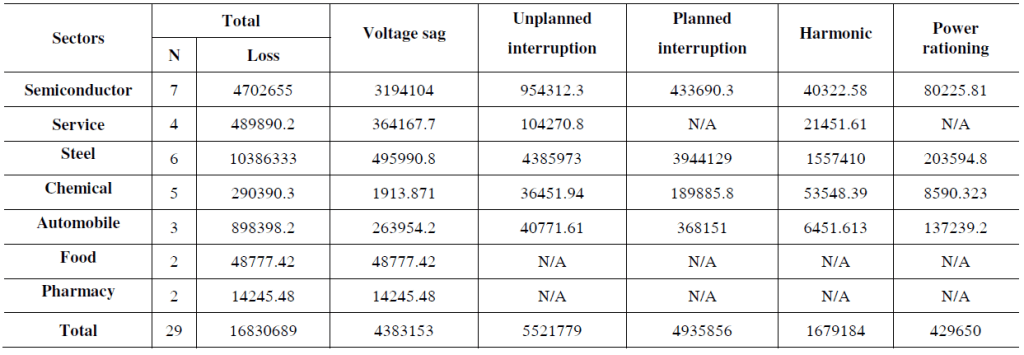
In step two, there were 40 respondents accepting the face to face interviews and 29 valid samples with the detail statistics of the economic loss of PQ in the factories. The respondents were distributed in 7 sectors: semiconductor, steel, chemical, automobile, food, pharmacy and service, as shown in table 2. The PQ loss was divided into two parts. One was the direct loss which is the loss per PQ events multiplying the times of the PQ events happening; the other was indirect loss of PQ problem which is the investment of the mitigating devices in every year. And the total PQ loss was shown in table 3. The total PQ loss according to the 29 respondents was about $17 million collectively in 2010. In the table, N was the number of the samples.
And the structure of the PQ loss was given in figure 6. In food and pharmacy, the PQ loss was all caused by voltage sags. In semiconductor, the loss caused by voltage sags was the most. While in steel and service, the PQ loss caused by unplanned interruption was the most.

Fig.6 Structure of PQ loss of the respondents
TABLE 2 STATISTICS OF THE RESPONDENTS IN STEP T
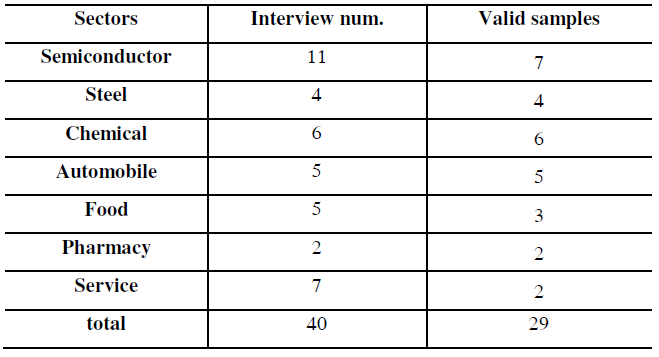
TABLE 3 TOTAL PQ LOSS OF THE RESPONDENTS ($)
PQ Cost analysis by confidence levels
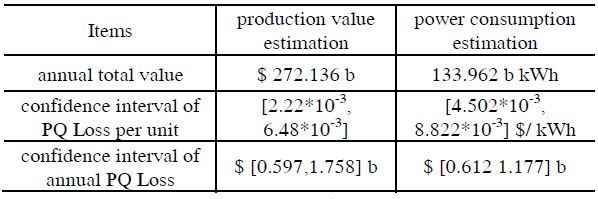
The PQ cost analysis was to achieve the total annual PQ loss in Shanghai city. The linear fitting analyses between the PQ loss and product values or power consumptions were done according to the statistics of the respondents. The analysis result between PQ loss and product values is shown in figure 7. The confidence interval of PQ cost per product values is [2.218*10-3, 6.478*10-3] when confidence level is 95%. The analysis result between PQ loss and power consumptions is shown in figure 8. The confidence interval of PQ cost per kWh is [4.502*10-3, 8.822*10-3] $/ kWh when confidence level is 95%. The PQ cost in Shanghai was less than in Europe (2008), which is about 8.353754*10-4 for product value and 8.055854*10-3€/ kWh. The reason may be that the proportion of high technology industries in the total economics in Shanghai is smaller than Europe.
With the statistics of total annual product value and power consumption of the city, the confidence interval of total annual PQ loss in Shanghai can be calculated as table 4. The annual PQ loss in Shanghai was about $0.597-1.758 billion according to the product value and about $0.612-1.177 billion according to the power consumption in 2010.
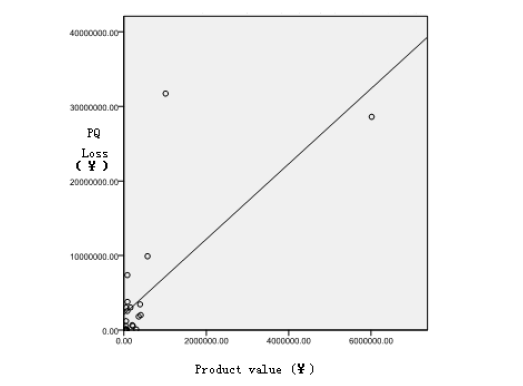
Fig.7 Linear relevance analysis between PQ loss and product value

Fig.8 Linear relevance analysis between PQ loss and power consumptions
TABLE 4 THE CONFIDENCE INTERVAL OF TOTAL ANNUAL PQ LOSS (2010)
PQ Cost analysis by each sector
The other way to estimate the PQ cost is to evaluate the PQ cost per product value in every sector with the statistics of the respondents. The PQ cost per product value of semiconductor was the largest which is 1.893*10-2. The PQ cost per product value of service was 1.275*10-2. Therefore the total annual PQ loss was $0.4735 billion for the 7 sectors in 2010. For “Industry” sector, the PQ loss was $0.271 billion. The results are given in table 5.
TABLE 5 THE TOTAL ANNUAL PQ LOSS WITH EACH SECTOR (2010)
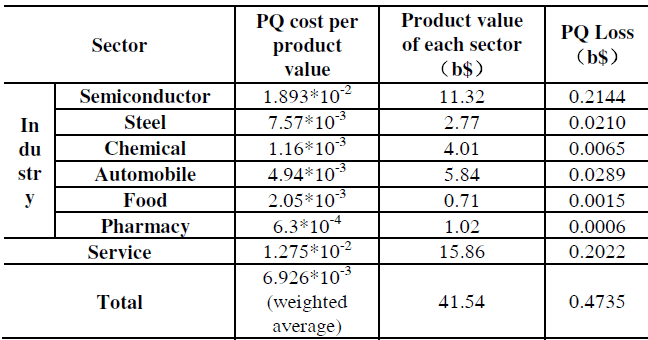
For the “Industry” sector the estimation of how much wastage was caused by poor PQ is 0.164% of annual product value, for “Service” sector, the proportion was 4.12%. While in Europe the proportion was 4% for “industry” and 0.1419% for “service”. This shows that the industry in China is rely on the PQ less than Europe, and the conclusion for “service” is contrary.
With the comparison with the total PQ loss annual achieved by the two approaches, the result of analysis from each sector close to the result from the total amount. So for the macro analysis focusing on the PQ loss, the total annual PQ loss in Shanghai can be set as $ 0.597-1.77 billion.
CONCLUSIONS
This paper gives the procedure and some key results of the survey on the assessment of PQ cost in Shanghai. The Survey is executed by APQI China Chapter from April 2010 to April 2011. The survey was carried out in two steps. In step one, there were 147 valid samples in 18 sectors. In step two, there are 40 face to face interviews in 7 sectors, including 29 valid respondents. The survey focused mainly on the 8 PQ problems and designed 6 parts of the PQ loss. With the analysis of the answers of the respondents, some main conclusions can be drawn:
- The respondents thought that the most frequent PQ event which affects the procedure of the customers in Shanghai is short interruption. But there was some confusion when the customers distinguished the difference about the flicker and voltage sags.
- The respondents thought that the most sensitive device for the PQ issues is computer and the most mitigation device is UPS. But the effectiveness of the mitigation device is not very satisfied for 40.9% of respondents. The relevance analysis between PQ problems and mitigation devices show that the customer cannot select the right solutions.
- 85.6% of respondents thought that the utilities should take the responsibility of the PQ events.
- There was linear relationship between PQ loss and the product values or power consumptions. The confidence interval of linear coefficient was [2.2210-3, 6.48*10-3]
between PQ loss and the product values and [4.502*10–3, 8.822*10-3] $/kWh between PQ loss and the power consumptions, when confidence level was 95%. The coefficient was less than that in Europe. - The total annual PQ loss of 29 valid samples was $16,830,689 in 2010 collectively. It was estimated that the total annual PQ loss in Shanghai is about $ 0.597-1.77 billion in 2010 with 95% confidence level.
ACKNOWLEDGEMENT
Thanks for the Economic Operation Bureau, Development and Reform Commission, China, who organized this survey. Thanks for the Shanghai Municipal Commission of Economy and
Information and Shanghai Municipal Electric Power Company who supported this survey a lot. Thanks for the other members in APQI China Chapter who contributed their hard works for this survey.
REFERENCES
[1] DOE/NETL. Provide power quality for the digital economy. Oct. 2009, http://www.netl.doe.gov/martgrid/referenceshelf/whitepapers/Provides%20Power%20Quality_APPROVED_2009_11_02.pdf.
[2] IEEE recommended practice for evaluating electric power system compatibility with electronic process equipment. IEEE Standard 1346-1998, 1998.
[3] E. Emanuel, M. Yang, and D. J. Pileggi. The engineering economics of power system harmonics in subdistribution feeders: A preliminary study”, IEEE Transactions on Power Systems, Vol. 6, No. 3, August 1991, pp. 1092 – 1098.
[4] P. Caramia, G. Carpinelli, E. Di Vito, A. Losi, and P. Verde. Probabilistic evaluation of the economical damage due to harmonic loss in industrial energy systems”, IEEE Transactions on Power Delivery, vol. 11, no. 2, April 1996, pp. 1021 – 1031.
[5] J. T. Crozier, W. N. Wisdom. A PQ and reliability index based on customer interruption costs. IEEE Power Engineering Review, vol. 19, pp. 59 – 61, 1999.
[6] K. K. Kariuki and R. N. Allan, “Evaluation of reliability worth and value of lost load,” IEE Proceedings: Generation, Transmission and Distribution, vol. 143, pp. 171 – 180, 1996.
[7] P. Heine, P. Pohjanheimo, M. Lehtonen, and E. Lakervi. A method for estimating the frequency and cost of voltage dips. IEEE Transactions on Power Systems, vol. 17, pp. 290 – 296, 2002.
[8] J. V. Milanovic, C. P. Gupta. Probabilistic assessment of financial loss due to interruptions and voltage dips – Part I: The methodology. IEEE Transactions on Power Delivery, vol.21, pp. 918 – 924, 2006.
[9] J. V. Milanovic, C. P. Gupta. Probabilistic assessment of financial loss due to interruptions and voltage dips – Part II: Practical implementation,” IEEE Transactions on Power Delivery, vol. 21, pp. 925 — 932, 2006.
[10] Primen. The cost of power disturbances to industrial & digital economy companies. EPRI CEIDS, June 2001.
[11] Targosz, Roman, Jonathan Manson. European Power Quality Survey Report. LPQI, 2008.
[12] Y. Shih-An, S. Chun-Lien, C. Rung-Fang. Assessment of PQ cost for high-tech industry. Power India Conference, 2006 IEEE, 2006.
[13] S. B. Choi, K. Y. Nam, D. K. Kim, S. H. Jeong, H. S. Ryoo, J. D. Lee. Evaluation of interruption costs for industrial customers in Korea. Power System Conference and Exposition, 2006. PSCE’06.
1Qing Zhong, received Ph. D and MSc in South China University of Technology in 2003 and 2000, and BSc in North China University of Technology in 1997, all in Electrical Engineering. He is now teaching in School of electric power, South China University of Technology. His main fields of interest include Power Quality, HVDC transmission control, and power electronics control.
2Wei Huang, works for International Copper Association. He is the project manager of Power Quality and is also the coordinator of APQI. APQI is aiming at improving power quality in Asian industries by creating awareness on the origins of the problems and building capability on the technical, financial and managerial aspects of power quality. He received a bachelor’s degree in Economics from Zhejiang University and MBA degree from Shanghai Jiaotong University. His main fields of interest include PQ, energy efficiency and distributed energy.
3Shun Tao was born in P.R.China, on Nov. 18, 1972. She received PhD degree and M.S. degree in North China Electric Power University (NCEPU) in 2008 and in 2005 respectively. She has been with the NCEPU since 2008, and she had a Postdoc procedure at the Electrical Engineering Laboratory de Grenoble (G2Elab), Institute National Polytechnique de Grenoble (INPG), France in 2010. Her research interests include Smart Distribution network technologies and power quality.
4Xiangning Xiao was born in P.R.China on March 5, 1953, is currently a professor in North China Electric Power University. He became a Member (M) of IEEE in 2003. His research interests include power quality and power electronics applications.
