Published by Andrzej ERD1, Józef STOKLOSA2,
University of Technology and Humanities In Radom(1),
University of Economics and Innovation in Lublin(2)
Abstract. The purpose of the publication is to indicate activities aimed at improving the reliability of electric vehicles. The starting point is the analysis of the most common failures of both assemblies and their components. On this basis, the most common reasons for their appearance have been identified for each group. The work indicates suggested steps aimed at reducing the intensity of damage to the systems that are part of electric vehicles.
Streszczenie. Celem publikacji jest wskazanie działań mających na celu poprawę niezawodności pojazdów elektrycznych. Punktem wyjścia jest analiza najczęściej występujących uszkodzeń zarówno zespołów jak i ich elementów. Na tej podstawie zostały wyodrębnione dla każdej z grup najczęstsze przyczyny ich pojawiania się. W pracy wskazano sugerowane kroki zmierzające od zmniejszenia intensywności uszkodzeń systemów wchodzących w skład pojazdów elektrycznych. (Czynniki wpływające na powstawanie uszkodzeń elementów i układów elektronicznych w pojazdach elektrycznych oraz działania mające na celu zmniejszenie ich znaczenia)
Keywords: failures of electronic circuits, electronic components, electric vehicle, improvement of quality electronic systems
Słowa kluczowe: uszkodzenia układów elektronicznych, elementy elektroniczne, pojazdy elektryczne, poprawa jakości systemów elektronic
Introduction
The intensive development of electric cars started in the 20th century caused a dynamic increase in the number of electronic components and systems installed in the vehicle.
While in the initial period the number of electronic components was relatively small and mainly electromechanical components dominated, at the moment the majority of control functions are supported by electronic systems. Unfortunately, most systems are unreliable and damage occurs, sometimes even resulting in tragic events. With time, the quality of the components has improved, as a result of which both the span of time until the first damage and the span of time between failures in reference to both individual elements and systems have increased.
The degree of complexity of the systems has increased enormously over time. New layout functions have been created, including support and optimization of mechanical components, initially such as ABS and electronic ignition. Slightly later, ASR or ESP traction control systems appeared.
Active and passive safety systems such as LDW (Lane Departure Warning), PD (Pedestrian Detection), or PCAM (Pedestrian Crash Avoidance / Mitigation), RSR (Road Sign Recognition) and FCW (Forward Collision Warning). The peak achievements at the present time include navigation systems or autonomous pilot systems being tested. The emergence of hybrid (HV) and fully electric (EV) cars forced the introduction of high-power and high-voltage electric motor control systems into vehicles. The occurrence of high voltage on the car carries the risk of electrical shock [1].
Damage to Electronic Systems
Damage to electronic systems can be divided into catastrophic and non-catastrophic. Catastrophic are those in which the device stops working completely. Non-catastrophic damage [2,3] occurs when the device is still electrically functioning but the parameters change and the functionality is reduced. Depending on the duration, permanent damage is distinguished, ie. the device degrades permanently. The second group is transient damage, ie. the change of the leading parameter characterizing the error of operation occurs in a random manner in time. As stated in [3] causes of transient failures can be divided into:
• Design errors
• Manufacturing errors in the production phase
• Temporary short circuits
• Disappearing connections
• Interference with other systems
• Wear or corrosion on connections
• Temporary short circuits
The above-mentioned causes of transient failures, in the paper [3] refer to the connections of electronic circuits.
System connectors are one of the most sensitive elements of vehicles. Other combinations of cover materials should also be explored. A compromise is therefore needed between good electrical and mechanical properties on the one hand, and reasonable prices on the other.
While examining complete systems, this list of causes should be complemented with:
• Defects and damage to components
• Changes in the parameters of internal components beyond the limits provided for in the construction.
• Occurrence of working conditions not provided for in the construction.
The first two factors mentioned above may be caused either by an internal defect not revealed during the final quality control of the elements, or by aging and change of the internal structure. The last of them is related to the construction assumptions, in some cases enforced by international standards, in others to the emergence of an unlikely external situation.
Damage detection is a separate and widely studied issue [4,5,6,7,8]. It is easier in the case of devices with many internal signals, and based on their measurements it is possible to observe changes in the technical condition up to the degradation of the device, inclusive The general practice with regard to car systems is to register the occurrence of operating errors reported by their controllers to the Powertrain Control Module(PCM) of the vehicle. The operation of the PCM module is complemented by Body Control Module (BCM) whose task is to control the windows, wipers, air conditioning, seat settings, central locking, internal and external lighting. The division due to the place of damage to electric vehicles shows that they most often appear in the systems indicated in Table below.
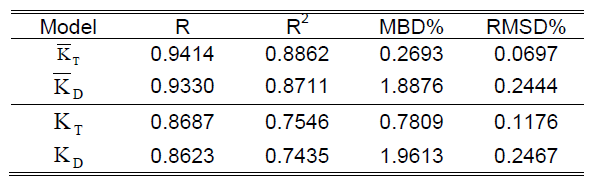
Table 1. Percentage structure of damages in vehicles electronics systems [6]

It is worth noting that critical damages in the engine group and steering for vehicle movement are relatively less frequent than eg. in the Audio group.
Knowledge of the system responsible for damage is important from the point of view of the service because it usually exchanges entire modules for repair without repairing them. However, the knowledge of how the single components of modules are damaged, allows to draw conclusions about the methods of improving the reliability of systems and vehicles.
Damages to Electronics Components
The range of elements used in car electronics is very wide. In the paper [8] an example is given that in a premium car there are more than 800 integrated circuits. Thus, a detailed analysis, broken down into individual groups of elements, will be omitted due to the size of the issue, only important conclusions will be cited. The factors influencing the change of the technical condition of the elements are particularly important.
Passive elements are generally durable, however, as the authors of the paper [9] indicate, an increase in the resistor temperature of 35°C causes a double increase in the intensity of damage (ID). Similarly for capacitors, the temperature increase of 15°C results in the ID also being doubled. In addition, an increase in temperature, especially in electrolytic capacitors. Particularly dangerous are the changes in capacitance of capacitors in drive controllers for EV drive motors, then the switching conditions of the IGBT transistor change.
Low-voltage inductive components are not very susceptible to damage due to the increase in temperature, in contrast to high-voltage induction components found, for example, in battery charging modules. For glass-epoxy laminates, an increase in temperature from 25 to 70 °C results in a drop in vertical resistance of over 14 times.
Damages to Semiconductors
Semiconductor components are also very susceptible to temperature changes. Depending on the temperature range conduction phenomena have different character. In the lower temperature range, the ionisation of the dopants is exponentially dependent on the temperature, hence the conductivity increases exponentially, in the middle range most of the dopants are ionized and the changes depend only on the mobility of the carriers. In the upper temperature range, an intense generation of an electron-hole pair occurs, depending on the temperature exponentially. This causes a rapid increase in the thermal leakage current.
In addition to changes in conductivity of the semiconductor, there are also changes in the voltage of the conductivity of the PN junction and the amount of backbreaking voltage. The critical temperature values depend on the material. In the paper [10], it was indicated that in semiconductor devices the deviations from the norm may appear suddenly or be predicted. Sudden changes in the technical condition are caused by overvoltages, mechanical damage or a puncture of the insulation inside the system. Progressive degradation is the result of drift of electrical parameters, electromagnetic interaction. Detection of systems with deteriorated properties takes place during testing. Finding the right boundary value that classifies systems as fit / unfit is a matter of a compromise between high parameters and high losses in the production process.
Damages to MEMS
A relatively new group of elements are MEMS (Micro Electro Mechanical System). They are used as sensors (accelerometers, gyroscopes, vibration sensors, pressure meters), and actuators. Due to their structure, they have some characteristic types of damage, caused by:
Exceeding the limit value of static friction force – Static friction (in English literature term Stiction, derived from Static Friction) is the mutual attraction force that occurs between two very close bodies when they do not move relative to each other. As long as the static friction force balances the external force affecting the body, the body remains motionless. The static friction force increases as the value of the external force increases until it reaches its maximum value.
As a result of changes in the internal structure of the system, the static friction force may increase and the device is not able to start correct operation. To prevent this, designers use elements that prevent excessive approach.
Mechanical shocks – they are an element accompanying the operation of vehicles and their occurrence is inevitable, however, the impact on the elements of electronic equipment must be minimized. With respect to MEMS elements, temporary acceleration of the delay exceeding the permissible value may be destructive for them and cause the structure to detach from the ground, jamming of moving elements. This is particularly important due to the fact that MEMS elements are often components found in both passive and active safety systems.
Electrostatic discharges – (ESD – Electrostatic Discharge) The presence of moving parts is associated with jumps of electric charge and this is part of the normal operation of the system, however, their repeated occurrence can lead to local melting of the contacts, or in the event of additional external voltages to breaking through the structures of semiconductor systems or internal insulation e.g. of capacitors.
Micro-Contamination – This is a phenomenon related to the occurrence of undesirable particles inside the housing. Although the production of MEMS elements takes place in a clean atmosphere, and after its completion, these elements are tested, however, in particular cases individual particles may not be detected.
It is also possible for gas particles to get inside the MEMS housing, This can lead to a change in the surface properties of internal structures.
Reduction of internal friction and contamination is only possible during the production phase. The impact of vibrations during operation should be kept to a minimum and the condition of their use in the vehicle is to place them in places that allow them to survive in the event of a collision.
The protection of MEMS systems against ESD damage is not significantly different from other electronic systems. It is necessary to take care of proper storage conditions before and during assembly, as well as to maintain at the design stage, appropriate track spacing and appropriate width of high-current tracks.
Directions of Improvement of Reliability Parameters
Elimination of most external exposures occurring in vehicles such as temperature, vibrations, strong electromagnetic fields is impossible. However, it is possible to limit their influence by design measures/constructional treatments.
Analysis of transient failures indicates that the occurrence of many of them is the result of malfunctioning joints. Among the design measures that can bring a definite improvement, we should mention: anti-vibration designs of electronic boards, making connectors, in particular those in contact with the environment in a hermetic manner. The use of cables with increased insulation; the use of double insulation cables in high voltage systems; shielding electrical machines and their power cords to limit electromagnetic interference; proper selection of components.
Batteries and Battery Management Systems (BMS)
The electric cells used in batteries even though they were invented more than 100 years ago are far from perfect. Disadvantages of the cells, such as a long charging time, a large mass necessary to accumulate enough energy to move, the content of heavy metals can hardly be considered damage. However, the cells age with time which causes, inter alia, a decrease in the capacity and increase in series resistance.
At present, in electric vehicles the main power source is composed of modules in which individual cells are connected in parallel, and these in turn are combined into packages. (Battery Pack). A dozen of these types of elements are usually connected in series into a complete power supply system. Single cells have a large number of limit parameters, the exceeding of which may affect [12]
• Design errors
• Manufacturing errors in the production phase
• Exceeding the permissible operating temperature.
• Reduction of cell life.
• Destruction of the cell
• Self-ignition and threat to the safety of entire vehicle.
The basic parameters that cannot be exceeded are presented in [12]. In view of such a limited area of correct work, it is necessary to carry out supervision over loading and unloading, which is the role of Battery Management Systems (BMS). Each Battery pack has its own BMS called slave here, and these in turn communicate with the master BMS related directly to the MCU (Master Control Unit). BMS systems, in addition to the current supervision over the control flowing through the cells, still have several prognostic tasks. In particular, they must provide the main control unit of the vehicle with information on the stored and possible to consume quantities of energy and the forecasted lifetime of the battery’s.
The algorithms for this purpose are based on the determination of SOC – State of Charge and SoH-State of Health indicators, which are currently determined by BMS.. SoH is of a diagnostic nature and is used to determine if the batteries are fit for further use, and what their degree of wear is. SoH strongly depends on the number of charging cycles and also on the SoC value at which recharging was initiated [14]. The method of determining the size of SoH is not standardized [13].
It should be added that SoC significantly depends on the temperature of the cell [18] and on the way of loading. The state of battery consumption is understood as the level of degradation of the battery, which allows you to recover at full charge up to 80% of the energy that was recovered in the initial state. It follows that the battery is not completely useless but still it has deteriorated parameters.
This kind of approach on the one hand allows for more reliable short-term operation, but on the other hand indicates the need to replace the battery, despite the fact that it still has a significant operational potential. As shown in [13], the consumption of individual cells in the module may be uneven and over time the discrepancy of parameters becomes deeper.
Batteries are usually made as non-removable not only by the user but also by car services. However, after dismantling, it turns out that the cells are connected in modules in a parallel manner without elements that align the currents between them. BMS controls the operation of the entire module supposedly of identical cells connected in such a way. So differences in the properties of cells that are immeasurable in the initial period can become visible over time and result in:
Reduced ability to load the module, by prior signalising of reaching the final charging voltage by the less capacious cells.
Crossing the discharge current for less used cells with lower internal resistance (with higher capacity) during loading.
Improvement of Functional Battery
Parameters In connection with this, the following postulates are suggested that may significantly affect the battery life extension.
• Constructing cells with the largest unit capacity to reduce their total number in the power supply system.
• BMS supervision of each individual cell, not just cell assemblies connected in parallel.
• Making batteries demountable with the possibility of exchanging individual cells or their groups in the service.
• Building algorithms for battery charging in a differentiated way for individual component cells.
• Strengthening and stiffening the structure of the floor panel covering the batteries.
The first postulate is related to the general progress in the construction and production of cells, but it allows to reduce the number of BMS in the vehicle supply system, and thus reduces the amount of information collected and processed, and further reduces the cost of the supply system, with the same total capacity.
The second postulate reduces the possibility of uncontrolled uneven operation of the cells and prevents, above all, overcurrent. When constructing a power supply system as being composed of several thousand elementary cells, it is difficult for practical and economic reasons to include each of them with the supervision of local BMS and separate balancing. A compromise is necessary and is currently achieved by selecting the number of cells connected in parallel and jointly supervised by one BMS. The number of cells connected in parallel should be as low as possible according to the postulate 1. If necessary, it is possible for the BMS to turn off a heavily used cell and work in a parallel module with a reduced number but in a wider range of capacity cells. Then the work will not be limited by a damaged cell.
Knowledge of the degradation status of each individual cell in the package would allow for the removal of the most worn out cells and inserting in their place cells with characteristics similar to the others, in this way the module would regain a significant potential for exploitation, but this is possible when fulfilling postulate 3.
BMS systems have the ability to supervise the temperature, therefore the central BMS system would have the possibility to load cells with lower temperature more (at high ambient temperatures) and the ability to load coldest cells less at low temperatures, and this approach would result in extended life of individual cells.
A series of vehicle fires following a fairly long period of time after severe damage prompted car manufacturers to recommend discharging lithium-ion batteries after serious failures. However, completely discharging the vehicle’s battery for safety reasons permanently damages the battery and makes it worthless. Self-discharge and parasitic electronic load on the battery management system can also irreversibly discharge the battery[19].
The production of elements and assemblies of electric vehicles is subject to many international arrangements, including those conducted under the direction of the Automotive Electronics Council. First of all, the endurance tests were standardized. Depending on the element groups, additional aging tests are being carried out. The list of tests includes [20].
In addition, there are many standards by the International Organization for Standardization. It would be advisable to introduce a normative requirement for the manufacturer to explicitly provide electronic components and systems indicators of damage reported as warranty and as replacement parts.
REFERENCES
[1] Fres chi F,Mi tolo M. , Tommasini R. Electrical Safety of electric vehicles 2017 IEEE/IAS 53rd Industrial and Commercial Power Systems Technical Conference (I&CPS) Niagara Falls ON, 2017, pp. 1-5.
[2] Ahmad W.,Perrinpanayagam S.,Jennions I.,Khan S. Study on Intermittent Faults and Electrical Continuity. 3rd International Conference on Through-life Engineering Services Nov 2014, pp 71- 75.
[3] Correcher E., Garcia E., Morant F., E. Quiles, L. Rodriguez , Diagnosis of Intermittent Faults and its dynamics. First Publication: 2008 IEEE International Conference on Emerging Technologies and Factory Automation.
[4] Gandoman F., Ahmadi A, Van den Bossche P, Van Mierlo J. Omar J., Nezhad A, Mavalizadeh H,
Mayet C. , Status and future perspectives of reliability assessment for electric vehicles. Reliability Engineering & System Safety Volume 183, 2019, pp. 1-16.
[5] Cui J . , Faults Classification of Power Electronic Circuits based on a Support Vector Data Description Method Metrol. Measurement. Systems., Vol. XXII (2015), No. 2, pp. 205–220.
[6] Leeman S., Joris K, Latent Reliability Defects in Automotive Chip Packages Automotive Electronics Council Reliability Workshop 2018.
[7] Lewitsching H, Electrical Drift of Electronic Devices. 20th Automotive Electronic Consuil Reliability Workshop. Detroit 2018.
[8] Drobnik J., Praveen J. Electric and Hybrid Vehicle Power Electronics Efficiency, Testing and Reliability.
International Battery, Hybrid and Fuel Cell Electric Vehicle Symposium EVS27 Barcelona 2013, pp. 1-12.
[9] Ćwirko J, Ćwi r ko R. , „Badania temperaturowe modułów elektronicznych”. Biuletyn WAT Vol. LVII, NR 2, 2008, pp. 134-142.
[10] Lewitsching H. Electrical Drift of Electronic Devices. 20th Automotive Electronic Concuil Reliability Workshop. Detroit 2018.
[11] Erd A. ,Stoklosa J . , “Main Design Guidelines for Battery Management Systems for Traction Purposes”. 2018 XI International Science-Technical Conference Automotive Safety, pp. 4.
[12] Andrea D. , “Battery Management Systems for Large Lithium-Ion Battery Packs” Artech House 2010 ISBN:9781608071043.
[13] Nuhic P,, Bergdolt J, Spier P.,Buchholz M., Dietmayer K. , “Battery Health Monitoring and Degradation
Prognosis in Fleet Management Systems” World Electric Vehicle Journal. Vol 2018 (9), pp. 39.
[14] Remmlinger J., Buchholz M., Mei ler M., Bernreuter P. , Dietmayer K. , “ State-of-health monitoring of lithium-ion batteries in electric vehicles by onboard internal resistance estimation” J. Power Source 2011, 196, pp. 5357–5363.
[15] Tippmann S., Walper D.1. , Balboa L. , Spier B. , Bes sler W. , “Low-temperature charging of lithium-ion
cells part I: Electrochemical modeling and experimental investigation of degradation behavior”. J. Power Source 2014, pp. 252, 305–316.
[16] S.J. Moura, N.A. Chaturvedi, M. Krstic , “Adaptive PDE Observer for Battery SOC/SOH Estimation via
an Electrochemical Model”. ASME J. Dyn. Syst. Meas. Control 2013, 136, pp. 101–110.
[17] Nuhic, T. Terzimehic, T. Soczka-Guth, M. Buchholz , K. Dietmayer , “ Health Diagnosis and Remaining Useful Life Prognostics of Lithium-Ion Batteries Using Data-Driven Methods” . J. Power Source 2013, 239, pp.680–688.
[18] Remmlinger J . , Tippmann S., Buchholz M. , Dietmayer K. , “Low-temperature charging of lithium-ion cells Part II: Model reduction and application” J. Power Source 2014, 254, pp. 268–276.
[19] Erd A., Stoklosa J.,”Failures of electronic systems and elements in electric vehicles and guidelines for reducing their intensity”. 2019 Applications of Electromagnetics in Modern Engineering and Medicine, PTZE 2019.
[20] http: //www.aecouncil.com/AEC/Documents.html
Authors: Dr inż. Andrzej Erd University of Technology and Humanities in Radom. Faculty of Transport and Electrical Engineering Radom Poland a.erd@uthrad.pl; Józef Stokłosa University of Economics and Innovation in Lublin Faculty of Transport and Computer Science. Lublin, Poland jozef.stoklosa@wsei.lublin.pl
Source & Publisher Item Identifier: PRZEGLĄD ELEKTROTECHNICZNY, ISSN 0033-2097, R. 95 NR 12/2019. doi:10.15199/48.2019.12.23