A Review of Techniques for Optimal Placement and Sizing of Electric Vehicle Charging Stations

Published by Md. Mainul ISLAM1, Hussain SHAREEF2, Azah MOHAMED1
Universiti Kebangsaan Malaysia (1), TNB Research Sdn. Bhd (2)


Abstract. Fossil fuel depletion and greenhouse gas emission from the burning of fossil fuels motivates policymakers to find an alternative road transport system. Electric vehicles (EVs) are considered as one of the best solutions in road transportation system as EVs can reduce the dependence on fossil fuel and diminish transportation-related emissions from carbon dioxide emission and other pollutants. The key issue in this system is recharging the EV batteries before they are exhausted. Thus, charging stations (CS) should be carefully located to ensure that EV users can access the stations within their driving range. This study represents a survey of the literature focused on the numerous optimization techniques employed from the last decade to determine the optimal EVCS placement and sizing problems.

Streszczenie. Zasadniczym problemem w rozwoju pojazdów elektrycznych jest zapewnienie nich naładowania przed pełnym rozładowaniem. Dlatego równie ważnym zagadnieniem jest właściwe rozplanowanie lokalizacji stacji ładowania. W artykule analizowane są różne techniki optymalizacji lokalizacji jak i wielkości stacji. Przegląd technik optymalnej lokalizacji stacji ładowania pojazdów elektrycznych

Keywords: electric vehicle, placement, sizing, optimization techniques
Słowa kluczowe: pojazdy elektryczne, stacje ładowania

Introduction

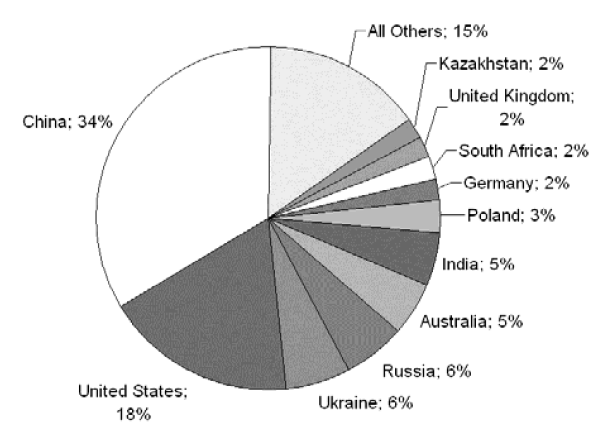
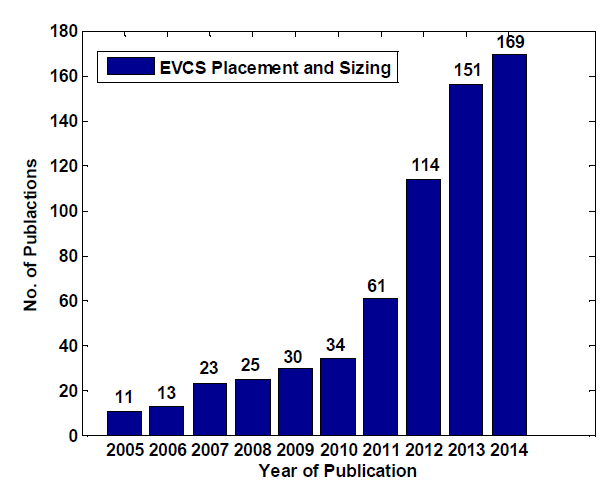
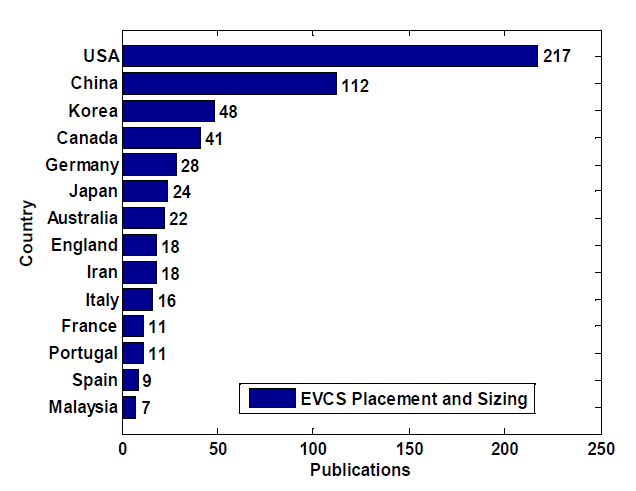
Recently, the global community realized that the planet is harmed by the effects of global warming and various problems that the lack of care causes. Internal combustion engine (ICE) is considered as one of the most important components in the transportation sector for creating such problems through carbon dioxide (CO2) emissions, which is the main perpetrator of global warming. Fossil fuel depletion is another concern in the transportation system [1]. Interestingly, an electric vehicle (EV) does not contaminate the earth or contribute to the problems of high oil price. EVs are a forthcoming technology that has numerous benefits in the transportation sector. Nonetheless, the inappropriate placement of EV charging stations (EVCS) could have adverse effects on the public acceptance of EVs, the layout of the traffic network, and the convenience of EV drivers [2]. Many studies are being conducted all over the world in light of the development of EVs. The aim of the current study is to represent a comprehensive review of optimal EVCS placement and sizing problems. For this purpose, a literature survey was conducted using the JCR database. The survey spans the years 2005 to 2014. Fig. 1 demonstrates the number of published papers on optimal EVCS placement and sizing problems. The figure shows that the research on EVs are growing rapidly. Fig. 2 illustrates the research intensity according to each country in the abovementioned research area from 2005 to 2014.

Fig.1. Number of papers published in the area of optimal EVCS placement and sizing from 2005 to 2014.
Fig.2. Number of papers produced from various countries in the area of optimal EVCS placement and sizing from 2005 to 2014.

EVCS is an element in an infrastructure that supplies electrical energy to recharge EV batteries. Appropriate site selection and sizing of EVCS is important to reduce the adverse effects on EVs. Various studies have been conducted on the optimal placement and sizing of EVCS. These studies can be divided into two focus areas: economics and power-grid-related concepts. However, deciding on the placement and sizing of EVCS by considering only the economic benefits are not reasonable and practical. Therefore, the ultimate goal is to determine an optimal location and sizing of EVCS through utilizing an optimization technique that can minimize total cost while maintaining power system security. Various heuristic optimization algorithms were recently utilized to solve the location and sizing problems of EVCS. The benefit of the heuristic algorithm is the ability to find a global or near global optimum solution even though the problem is complex [3]. Other techniques have also been explored for the same purpose. The following sections provide a detailed review of various EVCS placement methods.

Optimal EVCS Placement Considering Only Economic Benefits

EVCS methods that only consider economic benefits incorporate various cost functions, such as land, fixed, construction, operating, and transportation costs for siting and sizing EVCS. Genetic Algorithm (GA), Particle Swarm Optimization (PSO), Integer Programming (IP), and Cplex commercial software are widely applied for EVCS optimization, as detailed below.

Genetic Algorithm (GA)

GA is an evolutionary algorithm that obtains a solution to optimization problems that utilize techniques motivated through natural evolution, such as inheritance, selection, mutation, and crossover. The benefit of GA is the ability to search and determine a global optimal solution within the optimization process [4]. To solve optimal EVCS siting and sizing problems using GA, Ge et al. [5] proposed an EVCS placement method for existing city traffic networks. This method is based on a grid partition that minimizes transportation cost using GA to access a charging station (CS). The method considers traffic density and station capacity as constraints. However the cost function, which includes land, fixed, and operating costs, does not consider optimizing the system; thus, the outcome is not a global optimal solution. Mehar et al. [6] introduced a model that considers investment and transportation cost to find optimal locations. The model was solved using an improved GA. Moreover, Li et al. [7] developed a cost model that predicts the total number and distribution of EVs. Conversation theory was demonstrated based on regional traffic flows that consider the EVs within each district as a fixed load point of CSs. Finally, GA was applied to optimize the model. For the same purpose, Kameda and Mukai [8] developed an optimization routine to locate CS depending on taxi data and focusing on the on-demand local bus transportation system. GA was again proposed for an on-demand bus transportation system to optimize the route. The result was mainly based on computer simulation without the justification of a practical network. By contrast, Bendiabdellah et al. [9] and You and Hsieh [10] employed hybrid GA (HGA) to determine the optimal number and size of public CSs. This algorithm finds the best location by minimizing the investment and traveling cost. Other costs, such as operating and charging costs, were not considered for optimizing the system. Similar to a previous study, the investment and traveling costs are minimized in [11]. In this research, the authors proposed a multi-objective optimization model with hard time window constraints to find the optimal layout and scale of CSs. The model was solved using a two-stage heuristic algorithm. The authors demonstrated that the layout of EVCS is obtained based on the charging demand of various locations and the charging time constraints. In comparison, the scale of CSs is interrelated to the number of EVs, layout of CSs, and charging duration at peak hours. However, in finding the optimal location and sizing of EVCS, GA was observed to require long computational time. Another disadvantage is premature convergence.

Particle Swarm Optimization (PSO)

PSO relies on the simulation of social behavior among the particles flying through a problem space, in which an individual particle represents a solution to the given problem. The benefit of PSO is its ability to obtain the global optimal solution with higher possibility and efficiency compared with other optimization methods. Unlike GA, PSO is easy to implement and achieves faster convergence because evolution operators, such as crossover and mutation, are absent [12]. For instance, Zi-fa et al. [13] utilized PSO to declare an optimal location of CS based on construction cost (e.g., land price) and running cost by considering geographic information and traffic flow as constraint conditions. A PSO algorithm that was improved through changing the inertia factor was then applied on existing CS, and the results were compared. Similarly, Tang et al. [14] represented an optimal planning model of EVCS that incorporates the global searching ability of PSO and a weighted Voronoi diagram. First, the defined area was partitioned using the weighted Voronoi diagram, and then PSO was employed to determine the best locations. For the above cases, the authors did not discuss CS sizing. However, the main shortcomings of PSO are low precision and easy divergence. Thus, the provided solutions of EVCS may be non-optimal.

Integer Programming (IP)

IP is a mathematical optimization program where some or all of the variables are defined as integers. A linear IP is a term, in which the objective functions and the constraints are of a linear nature. On the contrary, the term “mixed integer programming” is used when some variables are restricted to an integer. To find the optimal set of routes and CS locations, Worley et al. [15] designed an IP model. The objective of this model was to minimize the total transportation, charging, and CS placement costs. Andrews et al. [16] developed the mixed IP model to find the CS infrastructure indispensable for diminishing range anxiety and enhancing EV integration through reducing the traveling distance to CS. The model was implemented for the Chicago and Seattle regions. The results show that user convenience increases promptly as the number of CSs increases. In the present work, only traveling distance from EV to selected CS was minimized. Furthermore, Kockelman et al. [17] utilized mixed IP to optimize the EVCS placement problem as a function of parking demand and user traveling costs to access the CS. Parking demand was predicted based on site accessibility, local jobs and population densities, trip attributes, and other approaches. This method only identifies optimal zones for CS placement, but specific CSs within recognized zones are not determined. For the same intention, Ip et al. [18] introduced a two-step model, in which the first step congregates the road information into “demand clusters” through hierarchical clustering analysis. Linear programming was then employed to conduct the site planning, which considers certain constraints and cost factors. Linear programming did not consider traveling cost on the way to the CS. In Meng and Kai [19], the EVCS placement problem was modeled following game theory and was later transformed into a linear programming model. Finally, the model was solved using a primal-dual path following algorithm to make the process simple and clear with strong viability. Overall, important factors, such as traffic flow, road network, structure, and capacity constraints of the distribution network, were not considered during problem modeling. The shortcoming of IP is that it cannot solve the stochastic problems related to EVCS.

Cplex Commercial Software

Cplex is a commercial optimization software package used to solve integer (linear) programming problems that utilize either primal or dual variants of the simplex method or the barrier interior point method. Cplex can also solve convex and non-convex quadratic constrained programming problems. Chung and Kwong [20] used Cplex software to propose a multi-period flow-refueling location model according to city construction plan stages to provide an overall optimal location for the stations. In this work, the authors only highlighted location problems. In a related work, Jia et al. [21] modeled the transportation network with graph theory to find the shortest distance from vehicle location to allocated CS. This model also optimizes the station size at each location based on charging demand.

The established model was solved using Cplex, which minimizes the overall cost. However, only one main road was conceived from one district to another district that may be speculative to EV users searching for the CS location. Again, Jia et al. [22] proposed a model that combines slow and fast-charging modes for the siting and sizing of EVCS. Charging piles are planned for slow-charging areas, whereas fast CSs that are built along the roadsides rely on fast-charging demand distribution and road network structure. P-center location and allocation model was also demonstrated to lessen the investment and charging costs. Finally, Cplex was utilized to solve the problem. Nonetheless, the disadvantage of commercial software is that the users cannot modify the parameters of the software.

Other Techniques

Other techniques are also used to find the optimal location and sizing of EVCS. Rastegarfar et al. [23] established a cost model with reference to total investment and operation cost. The model considers geographic conditions, traffic, and local access to find the optimal locations. A computer program was developed in MATLAB to calculate the costs and optimum combination of CS. In addition, Lam et al. [24] minimized the total construction cost based on user convenience and station coverage for CS placement. An efficient greedy algorithm that relies on the properties of the problem, especially its nondeterministic polynomial-time hardness, was developed. The weakness of this method is that the obtained solutions are usually sub-optimal. In Zambrano et al. [25], flow capturing methodologies were employed to find the optimal locations of CSs. First, the methodology follows the classical flow-capturing location-allocation model (FCLM) to maximize the traffic flow that would be captured using CS. Advanced FCLM is then used to minimize the setup costs of CSs. For the same reason, traffic flow was maximized in [26]. In this work, the authors proposed an extended flow refueling location model to obtain the optimal location of CS and charging pad, which uses inductive charging technology. However, the proposed model was restricted to handling a small-scale network.

Meanwhile, Wirges et al. [27] introduced time-spatial models for the development of EV charging infrastructure in the metropolitan region of Stuttgart, Germany; the models relied on socio-demographics, land use, and mobility. The simulation results determined the number of public CSs required to provide good service for that region, which is relatively small. However, a public charging infrastructure was basically cost-effective in dense municipal areas. Similarly, Wu et al. proposed the development model of EVCS in [28]. This model was based on three stages, including demonstration, public promotion, and commercial utilization. An optimization model for the planning of EVCS was suggested taken into consideration the interval distance ratio, charge capacity, and charging power redundancy. However, this model did not research further on the sizing of EVCS.

Wang et al. [29] represented a multi-objective expandable planning model for EVCS that considers the feasible improvement of EVs, features of CS, EV manners of the user, distribution of charging demand, and community planning. In addition, an algorithm process was designed, which depended on the demand preference and re-use of gas stations. Shaoyun et al. [30] also adduced an EVCS planning model for an urban area; the model considered the road network, traffic information, structure and capacity, and constraints of distribution networks. First, the service area was divided by the weighted Voronoi diagram, such as in [14], and then the principle of queuing theory was applied to optimize the capacity of CS. The proposed model minimizes the traveling and investment cost of CS. In a similar work, Frade et al. [1] presented a facility location model based on the maximization of demand coverage to optimize the demand, which distinguishes between night and day time EV demands. This study also emphasized population (households) and employment (jobs) for optimal locations. These CSs locations are only suitable for the slow-charging mode. Eisel et al. [31] also established a location-planning model to assign the EVCS under the unique consideration of user preference to diminish range anxiety.

However, Sweda and Klabjan [32] utilized an agentbased decision technique to recognize the EV ownership patterns and driving activities in the residential area of Chicagoland to find the optimal location of EVCSs. This method considers a fixed plan for CS placement without any dynamic or iterative modification or optimization. He et al. [33] also represented a model to study the interactions among the availability of public charging opportunities, price of electricity, destination, and route choices of PHEV at local transportation and power networks. Later, active-set algorithm was applied to determine the best allocation of a given number of CSs among cosmopolitan areas to maximize the social welfare. Different factors, such as charging demands, the performance and charging period of a battery, the way of energy supply and locations, and CS environment, have significant effects on the layout of EVCSs, as demonstrated in [34]. However, a mathematical model for the layout of the CS has yet to be presented.

EVCS Placement Considering Power Grid Impact

EVCS placement methods with grid impact include different power system issues and various cost functions to find the optimal location and sizing of EVCS. Similar to the methods that consider only economic benefits, the overview of optimal EVCS placement and sizing problems that consider power grid issues based on different optimization techniques are represented as below.

Genetic Algorithm (GA)

Numerous authors consider GA as an optimizer for the EVCS sizing and siting problem. To solve the optimal sizing problem, GA was proposed in [35], where the authors suggested an optimal sizing model of C-s in relation to power loss and voltage drops. Traffic and distribution networks were also considered to find the best location for CSs. However, the model is not so realistic because the cost parameters are not considered while designing the model. At the same time, Yan et al. [36] proposed a multi-objective, multivariate optimal planning model in terms of investment costs and feeder energy losses with other constraint conditions. The proposed approach was tested on the IEEE 33 node distribution system using HGA and was compared with traditional GA. The study determined that HGA successfully solves the difficulties of blind search and low efficiency in the basic GA.

Particle Swarm Optimization (PSO)

To find the locations and capacities of EVCS for regional EVs, Kou et al. [37] proposed a cost model based on the operating costs of CS, network losses, and investment costs of the distribution transformer. This model comprises various constraints, such as distance between substation and EV location, installed costs of EVCS, and number of EVs. PSO was utilized to optimize the system. However, the forecasting of charging demand was not considered in optimizing the model. Nonetheless, Prasomthong et al. [38] used PSO with a time-varying coefficient for V2G CS placement and sizing in the distribution grid at peak period. The simulation results indicated that V2G CS maximizes the total benefits comprising power loss diminution, peak power saving, and reliability enhancement when maintaining the system operating constraints.

Ant Colony Optimization (ACO)

Another heuristic optimization method used to evaluate optimal EVCS placement is ant colony optimization (ACO). For instance, Phonrattanasak and Nopbhorn [39, 40] found an optimal location of EVCS on the distribution grid by minimizing total costs and real power loss while maintaining power system security and traffic flow as constraints. ACO was used to find the best location of CS on the existing distribution grid. In a related work, Dharmakeerthi et al. [41] developed an EV model that combines constant power and voltage-dependent load to find the best locations in a power grid based on voltage-stability margins, grid power loss, and cable flow ratings. The weakness of this technique is that it is slow compared with other optimization techniques.

Other Techniques

Besides heuristic techniques, other methods are also used to solve EVCS placement and sizing problems. For instance, Liu et al. [2] obtained the optimal CS sites based on environment factors and maximum coverage of service, as well as developed a cost function that is associated with power system loss cost to obtain optimal sizing of the CSs.

Modified primal-dual interior point algorithm was adopted to solve the problem. Meanwhile, Wang et al. [42] introduced a traffic constrained polyobjective pattern, which considers the traffic system in addition to power loss for optimal CS placement. This pattern utilized data-employment analysis to ascertain the best candidate solution and cross-entropy algorithm to determine the optimization problem. These techniques effectively reduced power loss, voltage deviation, and travel distance to the CS. Masoum et al. [43] designed a new smart load management control scheme based on peak demand shaving, voltage profile improvement, and power loss minimization to coordinate multiple EV chargers while considering daily residential load patterns. Again, Shaoyun et al. [44] proposed a model of EVCS for new city traffic network in relation to construction, operation, maintenance, and power loss costs. The allocations of CSs were optimized using queuing theory to minimize the transportation wastage cost. The planning model is not realistic for existing city road structures.

Although all of the abovementioned techniques can find the optimal location and sizing of EVCS, a comprehensive study is still required to enhance the performance. Table 1 summarizes the benefits and disadvantages of the various optimization techniques used to solve the EVCS placement and sizing problems.

Table 1. Comparison of different optimization techniques in EVCS siting and sizing schemes.

.
Conclusion

This paper presents a comprehensive review of literature on optimal EVCS placement and sizing problems. Various optimization techniques that tackled the EVCS placement and sizing problems are outlined and critically discussed with their benefits and disadvantages. Some noteworthy works have already been conducted in the above areas, but many issues are still left for further research. Therefore, this work will help provide the most relevant and significant information about the existing studies. Optimal EVCS placement and sizing problems over the last decades can also be reviewed through the annotated bibliographies for the convenience of the reader and for a broad spectrum.

REFERENCES

[1] Frade I., Ribeiro A., Gonçalves G., Antunes A.P., Optimal location of charging stations for electric vehicles in a neighbourhood in Lisbon, Portugal, Transportation research board of the national academies, Washington, D.C, (2011), 91-98.
[2] Liu Z., Wen F., Ledwich G., Optimal planning of electric-vehicle charging stations in distribution systems, IEEE Trans. Power Deliv., 28(2013), No.1, 102-110.
[3] Mosaad M.I., Metwally M.M.EI., Emary A.A.EI., Bendary F.M.EI.,On-Line optimal power flow using evolutionary programming techniques, Int. J. Sci. Tec., 15(2010), No.1,20-28.
[4] Mardle S., Pascoe S., An overview of genetic algorithms for the solution of optimization process, Computers in Higher Education Economics Rev., 13(1999), No.1, 16-20.
[5] Ge S., Feng L., Liu H., The planning of electric vehicle charging station based on grid partition method, IEEE electrical and control engineering conference, China, (2011), 2726-2730.
[6] Mehar S., Senouci S.M., An Optimization location scheme for electric charging stations, International Conference on Smart Communications in Network Technologies (SaCoNeT), Paris, (2013),1-5.
[7] Li Y., Li L., Yong J., Yao Y., Li Z., Layout planning of electrical vehicle charging Stations based on genetic algorithm, Lecture Notes in Electrical Engineering, 99 (1), Electrical Power Systems and Computers, (2011), 661-668.
[8] Kameda H., Mukai N., Optimization of charging station placement by using taxi probe data for on-demand electrical bus system, Lectures Notes Comput. Sci., (2011), 606-615.
[9] Bendiabdellah Z., Senouci S.M., Feham M., A hybrid algorithm for planning public charging stations, Global Information Infrastructure and Networking Symposium (GIIS), Montreal, QC, (2014),1-3.
[10] You P.S., Hsieh Y.C., A hybrid heuristic approach to the problem of the location of vehicle charging stations, Comput. Ind. Eng., 70(2014),195–204.
[11] Yan L., Optimal layout and scale of charging stations for electric vehicles, CIRED Workshop – Rome, (2014),1-5.
[12] Rini D.P., Shamsuddin S.M., Yuhaniz S.S., Particle swarm optimization: Technique, system and challenges, Int. J. Comput. Appl. 14(2011), No. 1, 19-27.
[13] Zi-fa L., Wei Z., Xing J., Ke L., Optimal planning of charging station for electric vehicle based on particle swarm optimization, IEEE Innovative Smart Grid Technologies-Asia, Tianjin, China, (2012), 1-5.
[14] Tang X., Liu J., Wang X., Xiong J., Electric vehicle charging station planning based on weighted voronoi diagram, International Conference on Transportation, Mechanical, and Electrical Engineering (TMEE), Changchun, China, (2011),1297-1300.
[15] Worley O., Klabjan D., Sweda T., Simultaneous vehicle routing and charging station siting for commercial electric vehicles, IEEE International Electric Vehicle Conference, Greenville, (2012),1-3.
[16] Andrews M., Dogru M.K., Hobby J.D., Jin Y., Tucci H., Modeling and Optimization for electric vehicle charging infrastructure, IEEE Innovative Smart Grid Technologies Conference, 2013.
[17] Kockelman K.M., Chen T.D., Khan M., The electric vehicle charging station location problem: a parking-based assignment method for Seattle, Proceedings of the 92nd
Annual Meeting of the Transportation Research Board in Washington DC, 2013.
[18] Ip A., Fong S., Liu E., Optimization for allocating BEV recharging stations in urban areas by using hierarchical clustering, The 2nd International Conference on Data Mining and Intelligent Information Technology Applications (ICMIA), Seoul, Korea, (2010), 460-465.
[19] Meng W., Kai L., Optimization of electric vehicle charging station location based on game theory, International Conference on Transportation, Mechanical, and Electrical Engineering (TMEE), (2011), 809-812.
[20] Chung S.H., Kwon C., Multi-period planning for electric-car charging stations locations: A case of Korean expressways, (2012),1-31.
[21] Jia L., Hu Z., Song Y., Luo Z., Optimal sitting and sizing of electric vehicle charging stations, IEEE International Electric Vehicle Conference (IEVC), Beijing, China, (2012), 1-6.
[22] Jia L., Hu Z., Liang W., Tang W., Song Y., A novel approach for urban electric vehicle charging facility planning considering combination of slow and fast charging, International Conference on Power System Technology (POWERCON), Chengdu, (2014), 3354-3360.
[23] Rastegarfar N., Kashanizadeh B., Vakilian M., Barband S., Optimal placement of fast charging station in a typical microgrid in Iran, 10th International Conference on the European Energy Market (EEM), Stockholm, (2013),1-7.
[24] Lam A.Y.S., Leung Y., Chu X., Electric vehicle charging station placement, IEEE International Smart Grid Communications, Vancouver, BC, (2013), 510-515.
[25] Zambrano M.C., Corchero C., Igualada-Gonzalez L., Bernardo V., Optimal location of fast charging stations in barcelona: A flow-capturing approach, 10th International Conference on the European Energy Market (EEM), Stockholm, (2013),1-6.
[26] Siting C., Hongyang Li., Klara N., Charging Facility Planning for Electric Vehicles, IEEE International Electrical Vehicle Conference, Florence, (2014),1-7.
[27] Wirges J., Linder S., Kessler A., Modelling the development of a regional charging infrastructure for electric vehicles in time and space, Eur. J. Transp. Infrastruct. Res., 12(2012),391–416.
[28] Chunyang W., Canbing LI., Li Du., Yijia C., A method for electric vehicle charging infrastructure planning, Automation Electr. Power. Syst., 34(2010), No. 24, 36–39.
[29] Wang H., Huang Q., Zhang C., Xia A., A novel approach for the layout of electric vehicle charging station, International Conference on Apperceiving Computing and Intelligence Analysis (ICACIA), Chengdu, (2010), 64-70.
[30] Shaoyun G., Liang F., Hong L., Planning of charging stations considering traffic flow and capacity constraints of distribution network, Power. Syst. Technol., 37(2013), No. 3, 582-589.
[31] Eisel M., Schmidt J., Kolbe L.M., Finding suitable locations for charging stations: implementation of customers’ preferences in an allocation problem, IEEE International Electric Vehicle Conference (IEVC), Florence, Italy, (2014),1-8.
[32] Sweda T., Klabjan D., An agent-based decision support system for electric vehicle charging infrastructure deployment, 7th IEEE Vehicle Power and Propulsion Conference, Chicago, Illinois, (2011),1-5.
[33] He F., Wu D., Yin Y., Guan Y., Optimal deployment of public charging stations for plug-in hybrid electric vehicles, Transp. Res. Part B: Methodological, 47(2013),87-101.
[34] Fan X., Guo-Qin Y., Lin-Feng G., Zhang H., Tentative analysis of layout of electrical vehicle charging stations, East China Electr. Power., 37( 2009),No. 10,1677–1682.
[35] Pazouki S., Mohsenzadeh A., Haghifam M.A., Optimal planning of PEVs charging stations and demand response programs considering distribution and traffic networks, Smart Grid Conference (SGC), Tehran, Iran, (2013), 90-95.
[36] Yan X., Duan C., Chen X., Duan Z., Planning of electric vehicle charging station based on hierarchic genetic algorithm, Transportation Electrification Asia-Pacific (ITEC Asia-Pacific), IEEE Conference and Expo, Beijing, (2014),1-5.
[37] Kou L.F., Liu Z.F., Zhou H., Modeling algorithm of charging station planning for regional electric vehicle, Modern Electr. Power, 27(2010), No. 4, 44–48.
[38] Prasomthong J., Ongsakul W., Meyer J., Optimal placement of vehicle- to-grid charging station in distribution system using particle swarm optimization with time varying acceleration coefficient, International Conference and Utility Exhibition on Green Energy for Sustainable Development (ICUE), Pattaya, (2014),1-8.
[39] Phonrattanasak P., Nopbhorn L., Optimal location of fast charging station on residential distribution grid, Int. J. Innov. Manag. Technol., 3(2012),675–681.
[40] Phonrattanasak P., Nopbhorn L., Optimal placement of EV fast charging stations considering the impact of electrical distribution and traffic condition, International Conference on and Utility Exhibition on Green Energy for Sustainable Development (ICVE), Pattaya, (2014), 1-6.
[41] Dharmakeerthi C.H., Mithulananthan N., Saha T.K., Modelling and planning of EV fast charging station in power grid, Power and Energy Society General Meeting, IEEE, San Diego, CA, (2012),1-8.
[42] Wang G., Xu Z., Wen F., Wong K.P., Traffic-constrained multiobjective planning of electric vehicle charging stations, IEEE Trans. Power. Deliv., 28(2013), 2363–2372.
[43] Masoum A.S., Deilami S., Moses P.S., Abu-Siada A., Smart load management of plug-in electric vehicles in distribution and residential networks with charging stations for peak shaving and loss minimization considering voltage regulation, IET Gener. Transm. Distrib., 5(2011), N0. 8, 877-888.
[44] Shaoyun G., Liang F., Hong L., Long W., The planning of electric vehicle charging station in urban area, Electric & Mechanical Engineering and Information Technology (EMEIT) Conference, (2012),1598-1604.
[45] Nyns K.C., Haesen E., Driesen J., The impact of charging plug-in hybrid electric vehicles on a residential distribution grid, IEEE Trans. Power Syst., 25(2010), No.1, 371-380.


Authors: Md. Mainul Islam, Department of Electrical, Electronic and Systems Engineering, Universiti Kebangsaan Malaysia, 43600, Selangor, Malaysia. Email: mhsm.eee@gmail.com
Dr. Hussain Shareef, TNB Research Sdn. Bhd, No.1, Lorong Ayer Hitam, Kawasan Institusi Penyelidikan,43000 Kajang, Selangor, Malaysia. Email: hussain.shareef@tnbr.com.my.
Prof. Dr. Azah Mohamed, Department of Electrical, Electronics and Systems Engineering, Universiti Kebangsaan Malaysia, 43600, Selangor, Malaysia, Email: azah@eng.ukm.my


Source & Publisher Item Identifier: PRZEGLĄD ELEKTROTECHNICZNY, ISSN 0033-2097, R. 91 NR 8/2015. doi:10.15199/48.2015.08.29

The Quality of Electric Power Supplied into the Grid by Co-Generation Units

Published by Jiri JANSA, Petr MOLDRIK, Daniel MINARIK, VSB – Technical University of Ostrava


Abstract. This paper deals with the utilisation of firedamp for combined heat and electric power generation. The firedamp is gained from hard-coal mines and can be combusted in a co-generation units with gas-engine. This process involves more efficient utilisation of firedamp. The measurement results obtained on selected co-generation units are described in this paper. As far as the electric power supplied into the grid from cogeneration unit´s are concerned, these shall be considered with respect to the qualitative parameters, which should comply with stipulations of the CSN EN 50160 standard. The main advantages and disadvantages of co-generation units producing heat for hard-coal mine and electric power for export to the grid are described in the end of this paper.

Streszczenie. Opisano możliwość wykorzystania gazu kopalnianego do ogrzewania i wytwarzania energii. Gaz może być wykorzystany w kogeneratorze z silnikiem gazowym. Opisano wybrane systemy wytwarzania energii. (Jakość energii elektrycznej dołączanej do sieci przy wykorzystaniu dodatkowej generatora wykorzystującego gaz kopalniany)

Keywords: Firedamp; Quality of electric power; Combined heat and power generation; Hard-coal minet.
Słowa kluczowe: jakopść energy, gaz kopalniany.

Introduction

Issues concerning utilisation of renewable energy sources (RES) and combined production of electric power and heat belong to commonly discussed topics. Apart from RES represented by solar energy, biomass, wind or geothermal power, the interest is also shifting towards secondary energy resources including firedamp as well. Less awareness of this medium is related to its occurrence at local deposits mostly of bituminous coal. Coal deposits are accompanied by deposits of the firedamp. This firedamp develop from the original biological matter subject to geological processes during its carbonisation. Opening of coal deposits when mining then releases the firedamp, which penetrate the extracted mine space and surfaces. Composition of firedamp depends on many geological aspects as well as conditions associated with coal mining or situation of mining works, where the physical extraction has finished. Firedamp comprises methane, carbon dioxide, nitrogen and heavy hydrocarbons. In this case (at selected hard-coal mine), the methane content equals to approximately 65 % and the gas calorific value is approx. 23 MJ/m3. [1]

In technological processes performed in underground workings, methane is released which, unless taken in by the de-methaning systems, is discharged to the atmosphere by the ventilation systems of the mines. The ventilation systems are the primary and main methane emission source from coal mines. Methane, in this case called „residual gas“, is also contained in the coal extracted to the surface and released during the extraction processes. Some methane is also contained in the bedrock extracted to the surface with coal and gets released during bedrock disposal. This is the third source of methane emission. In many cases, firedamp is actively removed from the coalfield by various methods, normally described collectively as methane drainage. This is primarily for reasons of safety. As an example, in the Czech Republic in 2012, 18 % of the firedamp released by deep mining was vented from methane drainage systems, 16 % was captured and used as fuel, 57 % was emitted with ventilation air and about 9 % was removed in the mined coal. [2]

Coal mine methane (CMM) emissions are globally distributed among the world’s key coal-producing countries. Methane is a well-mixed gas in the atmosphere and emissions reductions anywhere in the world are important to reducing the total global burden of CMM emissions. The largest emitters are countries with the highest production of highrank underground coal. Currently, the top two producers of coal and emitters of CMM are China followed by the United States. Other large coal producers include Russia, Australia, Ukraine and India. The percent contribution for each country´s estimated CMM emissions are illustrated in Fig. 1.

The current drop in global emissions is associated with a decline in coal production in many countries, in addition to a restructuring of the coal industries in countries such as China, Russia and other Easter European coal-producing countries. With international studies showing that about 30 % to 40 % of all coal mines produce firedamp that could be used to fuel gas-engines for power generation, clearly the energy benefits could be enormous. However, not all firedamps are the same and these differences have implications for its utilisation.

Coal mine methane (CMM) may also be used as a fuel for power generation. Mines can use electricity generated from recovered methane to meet their own onsite electricity requirements, and they can sell electricity generated in excess of their onsite needs to utilities. Outside of the U.S., power generation is often the preferred option for using CMM. Power generation projects using CMM are operating at coal mines in several countries, including China, Australia, United Kingdom, Germany and Czech Republic. The production of electric power using the secondary energy sources gained vital legislative support in the Czech Republic (Act No. 180/2005 Coll.).

Fig.1. Estimated global coal mine methane emissions [3]
I. Utilisation of Firedamp at Selected Hard-coal Mine

The selected hard-coal mine in the vicinity of Ostrava city in the Czech Republic makes use of air pumps to drain the firedamp by means of forced extraction through boreholes in the rock material. Degasifying station on the surface then guides the firedamp into two co-generation units to be combusted for generation of electric power and heat. Electric power is supplied into the grid and heat is used for heating of bath water in showers, preparation of domestic hot water and heating in operation facilities.

Co-generation

The term “co-generation” defines simultaneous production of electric power and heat. The process of conversion of energy gained from fuels begins with the utilisation of high-potential heat energy to perform the work (production of electric power) with the subsequent use of the working substance of lower temperature used to cover the needs for heat. The fuel used within the co-generation unit can comprise of firedamp extracted from hard-coal mine. The essential technological feature of every co-generation unit is the combustion turbine or the combustion engine driving the power generator. [4]

Co-generation Unit Measured

The measurement and assessment of quality of the electric power supplied was performed at the two cogeneration units (CU) labelled as TEDOM Quanto C2000 SP, installed in the year 2012. Both CUs are based on the gas combustion engine model Deutz TCG 2020 V16 (see Fig. 2) with the max. power output of 1558 kW to drive the lowvoltage (400 V) synchronous electric power generator Marelli M8B 500 SD4. The said mechanism is suspended from the basis frame. The heat generated by the combustion engine and drawn from exhaust gases is run through the system of exchangers to the access flanges. The lost heat developed within the acoustic container of the CU (emitted from hot parts) is discharged with the ventilation air. The ventilation is provided by means of ceiling extractor fan. The acoustic air channels and exhaust silencers ensure the low level of noise from the CU.

Fig.2. The gas combustion engine model Deutz TCG 2020 V16

The interior contains an integrated distribution box ensuring the delivery of output as well as all the operation and control functions. The brain of the CU comprises of the control system, which enables for full control of its operation. The nominal power output of this CU is 1558 kW, the max. heating capacity is 1583 kW, the max. rate of consumption of the firedamp is equal to 755.2 m3/h and the total efficiency of the co-generation unit equals to 85.7 % (fuel utilisation efficiency). [5]

II. Quality of Electric Power Supplied by Co-generation Units

The following includes the assessment of selected parameters of electric power, which is supplied into the local 22 kV grid from two co-generation units (CU-1 and CU-2) via the kiosk substation (see Fig. 2). The basics for benchmarking of electric power parameters are stipulated by the CSN EN 50160 standard, which deals with the quality of electric power. [6]

Description of the Measuring Method

The measurements were conducted using the BK500 analyser made by ELCOM Inc., connected to the kiosk substation 22 kV (see Fig. 3). Both co-generation units are connected to this substation via two transformers 0.4/22 kV (2 MVA). Current sensors used are the split-core current transformer type Chauvin Arnoux (10-100 A). The hardware of BK500 analyser comprises the heavy duty PC type DEWETRON 2000 made from premium standard PC components integrated in a durable portable case. Monitoring of voltage signal and current from the grid are conducted by means of measuring cards made by the National Instruments company.

The analyser performed measurements and evaluation of the following values: voltage, current, active and reactive power, phase factor, frequency, flicker (a visual perception induced by a light stimulus the brightness of which fluctuates over time), harmonic voltage of higher levels (higher harmonic voltage) and the harmonic distortion factor.

The measurement was performed within the period from 14th February till 18th February 2013. The said values were determined in every phase (L1, L2, L3). Following Fig. 4, Fig. 5, Fig. 6, Fig. 7, Fig. 8 and Fig. 9 show the selected values development in time. Fig. 10 show the spectrum of voltage harmonics.

Fig.3. Connection of two co-generation units (CU-1 and CU-2) to the grid
Fig.4. The total output active power of two co-generation units
Fig.5. The total output reactive power of two co-generation units
Fig.6. Development of the voltage curve
Fig.7. The total harmonic distortion of voltage
Fig.8. Development of the short-term flicker perception rate
Fig.9. Development of the long-term flicker perception rate
Fig.10. Spectrum of voltage harmonics

Results of measurement

• Active and reactive power supplied by co-generation units (see Fig. 4 and Fig. 5): That is a sum of power output from both units. One of the units supplied the grid will active power of approx. 1.5 MW, both units then supplied approx. 3 MW. The reactive power ranges within the interval from approx. 0.5 Mvar (inductive nature) to 0.8 Mvar (capacity nature). That corresponds with power factor of 0.9 to 1.0, which dropped to the value of 0.75 at the time both cogeneration units were deactivated.

• Voltage in the kiosk substation (see Fig. 6): From the very beginning of the measuring process up until approx. 6.00 p.m. on 15th February, the voltage fluctuated within the range of 1 kV, which corresponds with 5 % of the nominal voltage. Further drops in voltage were substantially weaker afterwards (approx. 0.2 kV). The characteristic of voltage fluctuation, i.e. magnitude and frequency of voltage changes, is not dependant on operation of co-generation units. Such fluctuation of voltage is caused by other devices connected to the joint 22kV grid.

• Total harmonic distortion of voltage (see Fig. 7): Up until 6 p.m. on 15th February, the voltage distortion had been very high (4.5 to 6.5 % at maximum). However, that had not been due to operation of co-generation units, which have not visible impact on voltage distortion. As of 6 p.m. on 15th February, the voltage distortion fell to 1.5 %.

• The short-term flicker perception rate (see Fig. 8): This value is evidently not dependent on operation of cogeneration units, yet it is rather affected by mining equipment and other loads within the 22 kV grid. The percentile for 95 % is approx. 0.32. Therefore this value is low and conditions stipulated by the standard have been met. The permitted value of (1.0) was exceeded in a shortterm due to switching operations within the grid only.

• The long-term flicker perception rate (see Fig. 9): Conditions set forth in the standard have been met.

• Spectrum of voltage harmonics (see Fig. 10): High values of 11th, 13th, 23rd, 25th, 35th, 37th, 47th and 49th voltage harmonic (during the measurement period till approx. 6 p.m. on 15th February) are typical for operation of rectifiers with a twelve-pulse connection. That is due to operation of mining equipment operating within the hard-coal mine. Conditions stipulated by the CSN EN 501060 standard were not met for 23rd and 25th voltage harmonics only, where the permitted threshold values were exceeded (1.72 % > 1.5 % and 1.63 % > 1.5 % respectively).

• Other parameters as frequency, voltage magnitude and voltage asymmetry complied with conditions defined by the CSN EN 501060 standard.

Conclusion

The main part of this paper dealt with the evaluation of the quality of electric power supplied into the 22 kV grid by two co-generation units with firedamp combustion. The assessments conducted did not concern the production of heat or its parameters. The five-day measurement focused on the magnitude of voltage, the higher harmonics, the total harmonic distortion, the flicker perception rate, the voltage frequency and the asymmetry of three-phase voltage. Cogeneration units subject to measurement do not have any negative impact on qualitative parameters within the 22 kV grid. However, excitation of synchronous generators on both co-generation units could use certain adjustments to make them work with power factor of 1.0 to prevent their excessive or insufficient compensation.

Conditions stipulated by the CSN EN 501060 standard were not met during measurement. The permitted threshold values were exceeded at 23rd and 25th voltage harmonics due to operation of mining equipment in the said hard-coal mine. This mining equipment is controlled by siliconcontrolled rectifiers, which is causes higher values of voltage harmonics of higher level in the mine power main, which is connected to the 22 kV grid. Operation of mining equipment also causes voltage changes in the grid (5 % out of 22 kV). Yet the frequency of such changes is not that high to cause flicker problems. Both the short- and long-term flicker perception rates comply with conditions stipulated in the standard.

With regards to the minimum costs associated with extraction of firedamp, this is a very interesting energy resource. There are currently further co-generation unit projects being prepared for the region of Ostrava city (Czech Republic), including exploration of suitable deposits of firedamp. Yet the future perspectives shall also consider gradual decrease of output from existing boreholes and the need to search for new deposits in spite of the higher costs associated with it.

The main advantages of co-generation unit with gas engine generators producing heat and electric power for hard-coal mine use or export to the grid are: Proven technology; Waste heat recovery for heating mine buildings, miner baths, and shaft heating and cooling. The main disadvantages are: Interruptible and variable output; Regular maintenance requires commitment of mine operator; High capital costs.

ACKNOWLEDGEMENT

This paper was supported by the project ENET – Research and Development for Innovations Operational Programme No. CZ.1.05/2.1.00/03.0069, by the project New creative teams in priorities of scientific research, reg. No. CZ.1.07/2.3.00/30.0055, Operational Programme Education for Competitiveness, co-financed by the European Social Fund and the state budget of the Czech Republicby, by the Czech Science Foundation: project No. GAČR102/09/1842 and by grant of SGS No. SP2013/137 (VŠB – TU Ostrava).

REFERENCES

[1] Prokop, P., Důlni degazace. VŠB – Technical University of Ostrava, Issue: 1, Page(s): 1-112, Ostrava, 2008.
[2] Ivancova, P., Využití důlních plynů na území Ostravskokarvinského revíru. VŠB – Technical University of
Ostrava, Thesis, Issue: 1, Page(s): 1-46, Ostrava, 2012.
[3] Karacan, C.O., Ruiz, F.A., Cote, M., Phipps, S., Coal mine methane: A review of capture and utilization practices with benefits to mining safety and to greenhouse gas reduction. International Journal of Coal Geology, Vol. 86, Page(s): 121-156, 2011.
[4] Dvorsky, E., Hejtmankova, P., Kombinovaná výroba elektrické a tepelné energie. BEN – technical literature, Issue: 1, Page(s): 1- 287, Praha, 2006.
[5] TEDOM co-generation units: Production schedule. [online]: http: //kogenerace.tedom.cz.
[6] ČSN EN 50160 standard: Voltage characteristics of electric power supplied by public distribution network. Czech Standards Institute, Praha, 2000.


Authors: Ing. Jiri Jansa, Ing. Petr Moldrik, Ph.D., Ing. Daniel Minarik, Ph.D., Technical University of Ostrava, Centre of Energy Units for Utilization of non Traditional Energy Sources – ENET, ul. 17. listopadu 15, 708 33 Ostrava – Poruba, Czech Republic, E-mail: jiri.jansa.st@vsb.cz, petr.moldrik@vsb.cz, daniel.minarik@vsb.cz;


Source & Publisher Item Identifier: PRZEGLĄD ELEKTROTECHNICZNY, ISSN 0033-2097, R. 89 NR 11/2013

Case Studies on Ground-Fault Protection of Microgrid Power Systems with Diverse Power Sources

Published by Dirk Danninger IEEE Member Schweitzer Engineering Laboratories, Inc. 2350 NE Hopkins Court Pullman, WA 99163, USA
Scott Manson Senior Member, IEEE Schweitzer Engineering Laboratories, Inc. 2350 NE Hopkins Court Pullman, WA 99163, USA
Fernando Calero IEEE Member Schweitzer Engineering Laboratories, Inc. 2350 NE Hopkins Court Pullman, WA 99163, USA
Ceeman Vellaithurai Senior Member, IEEE Schweitzer Engineering Laboratories, Inc. 2350 NE Hopkins Court Pullman, WA 99163, USA


Abstract—In this paper, we share the experiences of designing, installing, and commissioning grounding and ground fault protection systems for three different low-voltage and medium-voltage power systems. The first project is a low-voltage service entrance with a standby generator. The second is a large peak shaving battery and a photovoltaic (PV) power plant that must seamlessly island and reconnect to the transmission grid without loss of power to customers. The third is a transportable microgrid with a grid forming with droop battery inverter and synchronous condenser with a flywheel. Complicating these designs are the great diversity in 480 V power system designs, the limitations of inverters, and the need to comply with National Electric Code (NEC). NEC compliance and good engineering practices are explained. The logic behind each design is shared, and a checklist is provided to guide others in proper design practices. The solutions shared are shown to be simple, easily maintained, reliable, NEC compliant, fully monitored, and ready for the rapidly changing power system of the future.

Index Terms—Ground fault protection, microgrid, service entrance, transportable microgrid, and renewable power plant.

I. INTRODUCTION

With the proliferation of distributed energy resources (DERs) found in microgrids and the large variety of vendors with varying protection philosophies, the interconnection of these resources to utility grids while maintaining ground fault detection and isolation is becoming increasingly complex. The complexity arises in part because, in industrial and commercial low-voltage distribution, the ground conductor cannot carry any current during normal operation to ensure the local and equipment grounds are at the same potential for personnel safety. In a three-wire system, this is easily achievable, since no neutral conductor exists. However, in a four-wire system, loads are connected as line-to-line and line-to-neutral. Thus, the neutral and ground must be isolated throughout the distribution and bonded to ground at only one point, typically at the service entrance. When more than one source has the neutral grounded, additional measures must be taken to detect and trip upon current flow on the multipoint grounded systems. Moreover, many microgrid projects are sponsored and funded by utility entities that are generally exempt from the National Electric Code (NEC) requirements, which may apply at DER sites.

In this paper, we discuss several ground fault detection schemes and provide an example for each, as listed in TABLE I.

TABLE I. POWER SOURCE TYPES AND APPLICABLE CODES

.
II. LOW-VOLTAGE BUILDING SERVICE ENTRANCE

A. Background

Fig. 1 illustrates a typical indoor service entrance with both utility and generator sources and branch distribution breakers.

Fig. 1 Typical Service Entrance With Multiple Sources

This type of service entrance is used to provide emergency backup power to a critical facility. Each source may or may not be grounded at either the source itself or at the service entrance. The multiple-point grounding possibilities with this type of equipment presents challenges for proper ground fault detection when either one of the sources are supplying the load or if both are supplying the load (paralleled operation).

The NEC Article 250 covers the general requirements for grounding and bonding systems [1]. The NEC contains many additional articles that are equipment-specific requirements (e.g., cables, cords, motors, and switchgear) and various types of grounding (e.g., solid, low-resistance, and high-resistance).

A grounded system has at least one conductor or point (usually the neutral point of a transformer or generator winding), which is intentionally grounded, either solidly or through an impedance, as discussed in Section 3.1 of [2].

System grounding is meant to control the voltage with respect to the earth (ground) within predictable limits and provide a flow of current that allows the detection of an unwanted connection between system conductors and ground so that the unwanted connection can be purposefully removed, as discussed in Section 1.3 of [2].

Grounding and bonding ensure that voltage potentials between conductive parts of a system are minimized during normal operation and during faults to protect personnel from electric shock.

For low-voltage building service entrances (277/480 V), the NEC Article 230.95 requires ground fault protection with 1,000 A or larger services, and must detect and trip for faults below 1,200 A. It is required that a fault at or above 3,000 A is cleared within one second. These NEC requirements are for equipment protection, not personnel protection. This paper, therefore, focuses on equipment protection.

Similarly, it is important to draw a distinction between system grounding and equipment grounding. A system may be grounded or ungrounded. In an ungrounded system, none of the transformer secondary conductors are intentionally connected to the ground. In a grounded system, the neutral is the most common conductor bonded to the grounding electrode. There are some systems where other grounding schemes are deployed, such as a corner delta or center tap grounding, which is not within scope of this paper. System grounding is the grounding of the power system. Equipment grounding refers to the installation of the equipment grounding conductor (EGC) to provide a low-impedance path for ground fault current to flow back to the source. Absence of a low-impedance path can leave parts of the equipment energized that could lead to shocks or flashovers.

Systems employing a single service at the service entrance provide the required ground fault protection by use of circuit breakers (CBs) that, in addition to overcurrent protection, also have ground fault protection typically denoted by a G in a breaker function marking. For example, long, short, instantaneous, and ground (LSIG) breaker trip functions are typically denoted as an LSIG breaker. Service entrances can also be used as a microgrid point of common coupling (PCC) and are commonly protected and controlled by programmable protective relays (PPR), which have advanced features that go far beyond LSIG.

A microgrid, by definition, may have many DERs, and a service to a building may be from more than a single source. For example, an automatic transfer switch (ATS) can supply a building by two different sources. To limit the building’s power outages during microgrid operations, it may be beneficial to transfer the building load to or from either source without interrupting the load. This is a closed-transition transfer. Moreover, it may also be beneficial to maintain both sources connected in parallel to help support the microgrid (e.g., using a building emergency generator to serve both the building and simultaneously participate in microgrid functions, like peak load shaving).

Operating multiple sources in parallel with the PCC is a challenge if each source is grounded and if a ground fault occurs within the building’s electrical distribution, as the fault current has multiple paths to return to its source and may not trip the service breakers; the ground fault detection becomes desensitized in this configuration. Additionally, in four-wire systems, the common neutral between the two sources has a unique set of challenges for ground fault sensing since this common neutral presents another path for ground current to flow [3].

B. Detecting and Protecting

Detecting a ground fault on multiple three-wire sources, in principle, is simple—add all the current transformer (CT) secondary currents together, and if they are greater than zero, there is a ground fault, as illustrated in Fig. 2.

Fig. 2 Simple Ground Fault Detection

A single source to a load (right side of Fig. 2) and a detection system is presented. The goal of the detection and protection system is to protect the load; the protected zone is the load shown in Fig. 2. For a three-wire system, a phase-to-ground fault can be readily detected by the PPR as the sum of the three-phase currents, Ig is the ground fault current divided by the CT ratio. Summing the three-phase currents works well for three-wire systems where the load is only connected between the phases. However, many low-voltage commercial and industrial systems use both line-to-line and line-to-neutral connected loads and are four-wire systems (e.g., 120/208 V and 277/480 V), as illustrated in Fig. 3.

Fig. 3 Simple Four-Wire System

Fig. 3 illustrates a four-wire system with a connected load between a phase and the neutral. The relay now measures a current IL in proportion to the load in the neutral—that is, the relay technique of summing the three-phase currents includes the load and fault currents. Any elements based on Ig in Fig. 3 must be set above the largest load imbalance. This requirement can create coordination challenges on large single-phase cold load pickups and inrush conditions. To remedy this problem, adding another CT on the neutral to the summation network cancels out the phase current.

Fig. 4 illustrates a differential current scheme; the ground current, Ig, is represented as the difference of current on all current carrying conductors, including the neutral. The relay can supervise Ig and trip when necessary without any dependency of phase and neutral loads.

Fig. 4 Ground Fault Detection on a Four-Wire System

The NEC classifies grounding systems as either nonseparately derived systems (NSDSs) (see Fig. 5) or separately derived systems (SDSs) (see Fig. 7).

Fig. 5 Nonseparately Derived System

In a system with a utility service and backup generator, the ATS or CB may be three- or four-pole in design. In a three-pole ATS or CB, the neutral conductor is not switched. The system retains a direct electrical connection between the neutral of the service and the generator neutral through the neutral bus in the ATS. This type of system is considered an NSDS. An EGC must run from the generator to the ATS to provide a low-impedance path for ground fault current. The NEC requires that the system is grounded at only one location for an NSDS, usually through a bonding jumper at the service utility transformer in such a system. This requirement is to prevent the existence of parallel paths during ground faults. The issue when multiple grounds exist in such a system is represented in Fig. 6. The fault current splits across the neutral and EGC. Because part of the fault current returns through the neutral conductor, the ground fault detection using a scheme similar to Fig. 4 would be desensitized and potentially defeated (relaying dependability), depending on the location of the fault.

Fig. 6 Fault Current Paths in a Multigrounded System With a Three-Pole ATS

In a four-pole ATS, the neutral conductor is switched. In this case, direct electrical connection between the service and generator is severed during ATS operation. Such a system is considered an SDS, and a separate grounding electrode conductor and grounding electrode must be installed for the SDS generator to maintain proper grounding when load is supplied by the generator. Fig. 7 shows a representation of an SDS.

Fig. 7 Separately Derived System

Ground fault protection on an NSDS can be tricky when multiple standby generators or other sources are involved. Using the scheme in Fig. 4 would not work because the fault current supplied by the generator would return on the neutral, causing the value to remain at zero. The fault current must return to the source through the neutral; therefore, a residual calculation of just the phase currents or a direct measurement of the neutral current is suitable in this instance. However, a study should be completed to carefully examine the circulating currents between parallel generators and load imbalance that could contribute to currents in the neutral conductor. Even generators of the same type and manufacturer commonly have circulating currents due to winding and impedance asymmetries similar to paralleled transformers. In this case, the pickup should be set above the maximum normally expected current in the neutral conductor and coordinated with other feeder protection. Additionally, the service entrance ground fault protection operation needs to be supervised based on breaker or ATS status so that a false indication on the nonload supplying breaker does not occur when the system is operating from the alternate source.

The use of a three- and four-pole ATS complicates ground fault detection through the presence of parallel paths when multiple grounds are provided and the sources are paralleled. When more than one source is supplying a load, such as a paralleled ATS to a utility and generator or a main-tie-main supplying a service entrance, a scheme similar to Fig. 4 can be employed but with some modifications to provide ground fault protection. One common scheme is called a Modified Differential Ground Fault (MDGF) scheme, as shown in Fig. 8 [3] [4] [5].

Fig. 8 Modified Differential Ground Fault

Fig. 8 illustrates the MDGF scheme for multiple sources. Load currents on either the phases or neutral are properly canceled, and only the current associated with a ground fault is sensed by the PPR. The ground fault current is the sum of the individual source contributions, which may not be equal due to different impedances. In this configuration, it is fortunate that different fault current contributions are not relevant.

The diagrams presented thus far have illustrated the use of CTs in a summation configuration. A core-balanced CT is typically neither practical nor economical because of the physical bus size and routing configurations found in these applications. Using dedicated CTs solely for ground fault differential measurements and requiring another set of CTs for traditional phase current monitoring and protection is not economical. A CT arrangement to serve both purposes is needed.

Fig. 9 illustrates the complete solution for a protection system, which includes ground fault protection. In this arrangement, the eight CTs provide signals for individual phase currents for traditional protection, and the summation of the current signals routed through the relay IN provide for the differential ground fault protection.

Fig. 9 Complete Solution

The arrangement requires no additional CTs or relays than necessary for individual service feeder protection, which makes this solution economical and simple. A PPR with seven current inputs economically satisfies the relaying requirements in this arrangement [6].

It should be noted that this differential scheme is generally applicable only to solidly grounded systems because the differential currents (IN) measured by the relay for ground faults depend on the ratios of the phase and neutral CTs. For proper current summation, as presented in Fig. 9, the ratios, class, and manufacturer of all CTs in Fig. 9 must be matched. On resistance-grounded systems, the neutral is connected to the earth ground by means of an impedance, thereby, limiting the let-through primary current to typically 5–20 A. A CT ratio (CTR) on the neutral of a resistance-grounded system is, therefore, much lower than the phase CTR, due to the low let-through currents rendering the method in Fig. 9 ineffective. Since the differential scheme presented here would not be sufficiently sensitive to detect ground faults on impedance grounded systems, an alternative scheme must be employed that digitally sums all the phase and neutral primary currents, which is not in the scope of this paper.

III. SERVICE ENTRANCE EXAMPLE

The solution of Fig. 9 has been employed at several facilities. In the following example, a dual-fed indoor service entrance of Fig. 1 is presented. The service entrance is a 2,500 A, 277/480 V service with a 600-kW backup diesel generator. In Fig. 10, there are two protection relays, one for each service (utility and generator).

Fig. 10 Single-Line Differential Ground Fault Detection

Fig. 10 illustrates the single line of the dual-fed service entrance shown in Fig. 1. In this formation, the MDGF units sum the currents in a similar manner, as presented in Fig. 8. The summed current is routed through the LSIG breaker’s external Ig sensor terminals, thereby, allowing the breaker’s trip unit to monitor the ground fault current magnitude and trip when the settings are exceeded, which is similar to the PPR in Fig. 8.

The advantage of using a PPR (as illustrated in Fig. 9) and eliminating the MDGF hardware and associated CTs is a simplified protection system that can accomplish phase, neutral, and ground current protection, in addition to many other protection elements available in many modern digital relays. With the logic programming capability of a PPR, the relay can also detect power supply interruptions on either source, properly sequence breakers to maintain the load from either source, as well as ensure bus synchronism in a makebefore-break automatic transfer scheme. In addition, the PPR has oscillography, Sequence of Events (SOE) recording, and several communications protocols.

This simple yet effective solution provides a robust relay-based automatic transfer scheme and is a significant building block for microgrids providing the end user with seamless transfer between utility and generator power or interconnection of multiple microgrids.

IV. RENEWABLE POWER PLANT EXAMPLE

A. Background

Distribution substations with DER generation have been proposed [7]. Photovoltaic (PV) generation and a controllable battery energy storage system (BESS) linked to a distribution substation can provide several benefits, including resilience and peak load shaving strategies.

Fig. 11 illustrates this concept. The distribution substation is traditionally connected to the BEPS (Bulk Electric Power System) through the PCC breaker. This is the normal state of the system; however, PV and BESS generation can be dispatched according to the need of the distribution system.

Fig. 11 Inverter-Based Power Plant Connected to a Radial Distribution System [7]

The substation transformer is the centerpiece of the substation, as it defines the HV side (possibly at transmission or subtransmission voltage levels) and the MV side (transforming the voltage level to standard distribution voltages) (2.4–35 kV).

In North America, the MV side of the substation transformer is solidly grounded, and the system is four wire. The four-wire feeders to the loads include the three-phase conductors and the neutral conductor. Further complicating matters, the neutral conductor is grounded periodically along the length of the feeder (i.e., multigrounded distribution network) [8]. It is a practice of distribution utilities to provide three-pole reclosers in key locations of the distribution feeder. The grounded nature of the system allows for the flow of significant ground fault current, making it possible to coordinate with inverse-time overcurrent relays (51P/51G) within the microgrid when the utility is connected.

The HV side of the substation is heavily dependent on the BEPS, which, in North America, is typically a solidly grounded source. The BESS and PV are connected to the HV side of the substation through ungrounded transformers.

If the PCC breaker opens with the BESS and PV sources online, the HV side of the substation becomes an unexpected ungrounded system. As explained in [9], if a ground fault occurred in the ungrounded part of the substation (HV), high voltages could be imposed on the healthy phases. To prevent this, a grounding transformer is provided, as shown in Fig. 11.

The grounding transformer in the HV bus is a permanent connection and a single source of grounding in the substation. The BESS and PV transformer grounds are not connected. The grounding transformer ground impedance is selected larger than the BEPS impedance. The ground impedance of the transformer is generally selected for several conditions:

1) to minimize the overvoltages,
2) to allow measurable levels of ground fault current for a relay connected in its neutral, and
3) to be large enough to shunt ground currents to the BEPS should the system be grid connected. The specifics for a grounding transformer size and type are not in the scope of this document.

B. Detecting Ground Faults

When connected to the BEPS, the PCC breaker is closed, and the ground fault contribution from the BEPS is significant, allowing a traditional inverse-time overcurrent (51) scheme to operate as expected.

When islanded, the BESS three-wire design is configured in grid forming with droop (GFMD) and provides the positive- and negative-sequence quantities for ground faults. The PV is a three-wire inverter, is configured as grid-following, and only provides positive-sequence current. The grounding transformer provides the zero-sequence path, allowing ground faults on the HV side to be detected at the grounding transformer neutral [7].

Ground fault detection on the MV side is aided by the solidly grounded neutral of the station transformer. When the PCC breaker is closed, the magnitude of the ground fault current in the feeders is relatively high and limited by the BEPS source impedance and the substation transformer, allowing for traditional inverse-overcurrent (51P/51G) coordination.

When islanded, only the inverter-based resource (IBR) generation is available, and the fault magnitudes are limited to a level of 1.2– 1.3 pu of the BESS inverter rating. The PV provides no current during a fault and likely trips offline. When islanded, a more sensitive scheme than the 51P/51G coordination is required, due to these low fault currents. In [7], an undervoltage controlled definite time overcurrent (50C) scheme is described. It qualifies the overcurrent element with the presence of low voltage. This works well, since the BESS pulls back voltage to limit current during overload conditions, such as faults. In the respective time frame of a fault, the BESS IBR is considered a current source when the PCC is closed and a voltage source when the PCC is open. Faults at every recloser are similar during the islanded operation of the BESS. Thus, during an islanded condition, there is no time-overcurrent (51) relationship, only a 50 current element with a 27 voltage supervision. Coordination is achieved using only different time delay settings in each recloser. A coordination time interval of 0.2 seconds is selected between subsequent series reclosers. Fig. 12 illustrates the distribution feeder.

Fig. 12 IBG-Only Distribution Feeder Time Coordination With 50C [7]
V. TRANSPORTABLE MICROGRID EXAMPLE

A. Background

Transportable/mobile/portable microgrids are a collection of sources of power with the intention of plug-and-play. This system could be used to provide power where needed by quickly moving and interconnecting to a point to deliver power. Military forward operating bases, remote oil and gas drilling locations, mining, and disaster relief are common uses for these transportable microgrids.

Transportable microgrids can be viewed as emergency sources of power, which requires ground fault indication. Some designs are not effectively grounded, such as high-impedance grounding, and detect and alarm but not trip as one phase conductor becomes grounded.

Regardless of philosophy, all possible formations of DER should have a ground reference for detecting and preventing transient overvoltage from damaging equipment, as discussed in Section 1.3 of [10]. With portable equipment, one or more DERs (battery-backed IBR, utility, or generators) may be connected at any time.

B. Detection and Protection

The equipment protection for transportable microgrids draws from the principles discussed in the paper. Detection and protection for equipment in the microgrid depends on whether it is connected into an existing system as an SDS or NSDS.

There are two options for the installation of transportable microgrids. One is to treat it similarly to an NSDS and require that the system into which it is being interconnected use a three-pole ATS with a single point of neutral grounding at the utility transformer. The protection system for this configuration can be provided using neutral CTs to detect fault current returning to each source. In the case of a switched neutral system, such as a four-pole ATS, it may be useful to treat the transportable microgrid as a single SDS and provide neutral grounding at a single grounding electrode in addition to the grounding at the utility transformer. In configurations involving parallel operation with the utility, two or more neutral grounding bonding points may be required, and therefore, an MDGF scheme is needed for proper detection.

The transportable microgrid can be on a trailer, in a container, or placed on the ground adjacent to a building. Equipment grounding at these locations through a grounding electrode is provided. However, as noted previously, users must be careful not to create paths for fault current from other locations to travel through building equipment. Given that it may not be feasible to know the configuration of use for the transportable microgrid, it should be designed to fit into any system and provide adequate protection.

C. Example

In this project, the end user desires a containerized transportable microgrid to provide portable power to critical fixed plant loads. The transportable microgrid consists of a synchronous condenser (SC), two BESS IBRs, an electric vehicle charging station, and an auxiliary 120/208 V lighting panel. The transportable microgrid and the interconnection to the end user’s fixed plant electrical distribution is illustrated as a simplified single-line diagram in Fig. 13.

The SC is a 3,600-RPM design and has shaft-mounted weights providing kinetic energy storage for the grid. This increases fault currents, improves protection coordination, and keeps the adjacent inverters online as the frequency is stabilized due to kinetic ride through (inertia).

The transportable microgrid interfaces with an existing fixed plant electrical system consisting of a PCC fed by the utility power transformer, a diesel backup generator, and a photovoltaic DER system. A three-pole circuit breaker ATS is used to switch the diesel generator and the PCC. For economic and space constraints, the breakers are three-pole, and all systems are four-wire cables to be laid directly on the ground. In this project, the transportable microgrid is installed as an NSDS into the existing system, keeping the system ground at a single point at the utility transformer. Proper EGC grounding is performed through a ground bus in both the main and containerized transportable microgrid switchgear for equipment grounding. Care is taken in this installation to ensure that no break in the neutral or ground connections occurs. Any break of the neutral conductor results in an ungrounded system. Ground fault protection is provided by residually connected phase CTs and measured by the PPR (IN) current input.

Fig. 13 Transportable Microgrid Example
VI. CHECKLIST

When designing any ground fault detection system, the following items should be verified in the design.

1. All possible island formations are determined, either by a PCC, ATS, or other means.

2. One or more grounds exists on each island.

3. The differential ground fault system is in place with multiple-point grounded systems, if paralleling distributed energy sources and/or BEPS.

4. All ground faults at all locations can be detected and discriminated from single-phase loads.

5. Adequate compliance and testing to NEC and other regulatory codes are applicable.

6. The inverter acts as a 1.0 pu current source for coordinating IBRs.

7. An SC is considered in the design to aid fault current production, as well as inrush and motor starting support.

8. A multifunction relay with SOE and oscillography recording capabilities is used to augment the circuit breaker between grid-connected and islanded operation to maintain coordination at these locations.

9. A protection expert is consulted if uncertain

VII. CONCLUSION

DER proliferation and interest in transportable microgrids continue to rise in the future. Understanding the differences between system and equipment grounding and the purpose of the two are crucial to the design of protection systems.

A relay-based ground fault detection and protection system was presented for several different examples where multiple sources with multiple grounds exist. The relay-based solution provides design simplicity and additional features offered by programmable logic features in the PPRs, such as bus synchronism checks for make-before-break switching, utility interruption detection, and many other benefits (e.g., oscillography, SOE, and several different communications protocols).

In this paper, we have given case studies and detailed the design process and methodology behind the reason for the selection of protection and detection of ground faults.

VIII. REFERENCES

[1] NFPA 70, National Electric Code (NEC).
[2] IEEE 3003.1.2019, IEEE Recommended Practice for Grounding of Industrial and Commercial Power Systems.
[3] P. Mike, “Avoiding Ground Fault Problems When Designing For Multiple Low Voltage Sources,” GE ESL
Magazine,
2005.
[4] Schneider Electric, “Ground-Fault Systems for Circuit Breakers Equipped with Micrologic Electronic Trip Units,” March 2016. Available: download.schneider-electric.com.
[5] D. Swindler and C. Fredericks, “Modified Differential Ground Fault Protection For Systems Having Multiple Sources And Grounds,” Schneider Electric, 1994.
[6] SEL-700GT Generator and Intertie Protection Relay Instruction Manual, Schweitzer Engineering Laboratories, 2021.
[7] R. Ruppert, R Schlake, S. Manson, F. Calero, and A. Kokkinis, “Inverter-Based Radial Distribution System
and Associated Protective Relaying,” proceedings of the 48th Annual Western Protective Relaying Conference, Spokane, WA, October 2021.
[8] J. Roberts, H. Altuve, and D. Hou, “Review of Ground Fault Protection Methods for Grounded, Ungrounded, and Compensated Distribution Systems,” proceedings of the 28th Annual Western Protective Relaying Conference, Pullman, WA, October 2001.
[9] K. Behrendt, “Protection for Unexpected Delta Sources,” proceedings of the 57th Annual Georgia Tech Protective Relaying Conference, Atlanta, GA, May 2003.
[10] IEEE 2030.9-2019, IEEE Recommended Practice for the Planning and Design of the Microgrid


IX. VITAE

Dirk Danninger received his MS and BS in engineering and systems control from Montana Technological University. He worked for over 24 years in the mining industry, where he held the positions of process engineer, electrical engineer, automation group manager, and electrical instrumentation and control engineering (EI&C) subject matter expert. Dirk can be reached at dirk_danninger@selinc.com.

Scott Manson received his MSEE from the University of Wisconsin–Madison and his BSEE from Washington State University. Scott is the engineering services technology director at Schweitzer Engineering Laboratories, Inc. (SEL). He is a registered professional engineer in 6 states and holds 20 patents. Scott can be reached at scott_manson@ selinc.com.

Fernando Calero is a principal engineer at Schweitzer Engineering Laboratories, Inc. (SEL) in the research and development (R&D) division with over 30 years in the industry. For 20 years, he was an application engineer in the SEL international organization. In 2020, he transferred to R&D and is currently working on projects related to renewable sources, protection, and control. He is a registered professional engineer in the state of Florida.

Ceeman B. Vellaithurai (S’09–M’12–SM’20) received the BE degree in electrical and electronics engineering from Anna University Tiruchirappalli, Tiruchirappalli, India, in 2011 and the MS degree in electrical engineering with specialization in power systems from Washington State University, Pullman, WA, USA, in 2013. He is currently working with Schweitzer Engineering Laboratories, Inc. (SEL), Pullman, as a protection engineer and pursuing his PhD from WSU. His research interests include real-time modeling and simulation of cyber-power systems. Ceeman has authored several technical papers with over 600 citations, patents, and is a registered professional engineer. Ceeman can be reached at ceeman_vellaithurai @selinc.com.


This paper was presented at the 69th Annual Petroleum and Chemical Industry Technical Conference, Denver, CO, September 26–29, 2022. Source URL: https://selinc.com/api/download/137170/

What is Electric Motor Testing and Why is it Done

Published by Carelabs (Carelabz), Website: carelabz.com


Image: Carelabs – Motor testing

Electrical maintenance programs are designed to increase equipment promptness and uptime while decreasing capital operating cost. Electric Motor Testing is usually the first thing to be sacrificed when cutting back on operational expenses. But smart companies, understands that without proper maintenance programs, there is billions of dollars of lost revenue through increased motor repair costs, downtime, and waste in industrial and commercial companies.

Why is Electric Motor Testing Done?

After bearing failure, electrical faults are the most common mode of motor failure, so in addition, a properly planned electrical testing scheme is important for making sure of the plant reliability. The Electric Power Research Institute (EPRI) conducted a survey which brought into the light that, 48% of motor failures are because of electrical failures. The 48% can be again divided into rotor problems (12%) and winding problems (36%). The other 52% of failures are mechanical faults.

Many diagnostic tools, such as clamp-on ammeters, temperature sensors, a Megger or oscilloscope, can help illuminate these issues.

Winding defects occurs due to contamination, ageing of insulation, thermal overload, power surges, damaged wire/materials, and other causes. They start as energy crossing an insulation fault like moisture, which sets apart at least one turn. This creates extra stress and increase in temperature across the fault, which increases until the winding fails.

Some of the winding faults are:

Between turns in a coil
Between coils in a phase
Between coils in different phases
Between a coil or phase and ground

Fault finding of at least one of the above can save your facility countless hours of shut down and numerous dollars in savings.

What is Done During Electric Motor Testing?

There are various kinds of testing done on motor. They are:

Electric Motor Impulse Testing

Electric Motor impulse testing is an integral part of predictive maintenance of electrical motors. Below are few questions that helps in explaining the influence of extensive impulse testing on a motor.

Can impulse testing damage healthy or deteriorated insulation?
Can DC Resistance, Inductance, Megger or HiPot tests diagnose weak turn-to-turn insulation?
After failing an impulse test, are motor with weak insulation able to operate?
Are motors with a turn-turn short able to perform continued function?

This was accomplished by putting a low voltage motor through extensive testing rigors, until inducing a failure. Following the failure, additional testing investigated the possible deteriorating effects on turn-turn insulation due to impulse testing beyond the motor’s dielectric breakdown. NOTE: This paper was edited from the original version of the IEEE paper published in 2003.

Electric Motor Rotation Testing

Check for fan or pump motor rotation when testing offline with the MCE. Fans may continue to slowly rotate due to drafting in the Plenum. Pumps that are attached to a shared header might remain rotating if other pumps attached to the header are functioning. This will adversely affect the Standard Test results, possibly creating higher than normal resistive and inductive imbalances.

Wound Rotor Electric Motor Testing

Wound rotor motors have a three-phase winding wound on the rotor which is connected to three phases of start-up resistors to provide current and speed control on start-up. Failed components in the resistor bank are common and often overlooked when troubleshooting. These damages can have major influence on the complete functioning of the motor and must be provided significant attention when troubleshooting these motors.

Electric Motor Insulation Resistance Testing

Electric motor insulation exhibits a negative temperature coefficient, meaning as temperature increases, resistance decreases. This will make you certain that insulation resistance of a de-energized motor will reduce after commencing the motor. However, most often the resistance will initially increase after running due to moisture being evaporated by the increasing temperature of the windings. The standard IEEE43 on insulation resistance testing needs a temperature rectification to forty degrees Celsius, which could instantly turn suitable measured resistance readings into disappointingly low rectified resistance readings. Before sending a motor to be renovated, consider space heaters.

Meg-ohm Test

The meg-ohm test has long been the tool of choice for most engineers, and this simple test is often the only electrical test performed on a motor. However, while the meg-ohm test has a valid role to play, it is simply not capable of detecting all the likely faults within a motor’s winding.

PC tests

Modern test equipment utilises PC control to provide automatic testing and fault diagnosis, thus removing the responsibility on the operator to interpret the results. The equipment can detect micro arcs, and to stop the test automatically. Database software permits resources to be saved with all test outputs, so that a practise can be built up with time, preferably from the inauguration of first-hand motor. Automated testing also helps remove operator error, inconsistency created by different operators applying different parameters and the possibility of the operator applying over-voltage to the motor. The latest testers combine all static electrical tests within one portable device, which also can create professional test reports.

Static or Insulation Testing

It is performed with the motor disconnected from the power supply. It is particularly done from the motor control cabinet and must be performed in a predetermined test sequence.

Winding Resistance Test

It will highlight dead shorts, loose connections and open circuits. Such tests must be performed with accurate equipment, which can measure down to 0.001 ohm. It is extremely important to correct the resistance values to a constant temperature, typically 20 degrees Celsius. The motor temperature should be quantified as precisely as achievable, and the copper temperature should be utilised wherever possible. A motor that has been recently operating is very unlikely to be at ambient temperature, so the use of ambient temperatures should be avoided. Upon conclusion of the test, the one imbalance between the phase-to-phase readings are quantified.

DC Step Voltage Test

It is typically performed at twice line voltage plus 1000 volts. The voltage is increased in a series of steps, and the leakage current is plotted. Effective insulation to earth will denote a linear plot, whereas a non-linear plot will indicate an insulation deterioration at that voltage where the leakage current instantly amplified. The step voltage test provides a great deal more information than the basic DC hipot test.

DC Hipot Test

Simply applies a voltage, measures leakage current and calculates meg-ohms. If the meg-ohms are greater than the acknowledged smallest estimate, the motor passes. Even if there is an area of damaged insulation which causes a lower reading of meg-ohms, if that value is higher than the minimum accepted value, it will still pass.

Surge Test

This test is used to verify the turn-to-turn, coil-to-coil and phase-to- phase insulation condition and is typically performed at twice line voltage plus 1000 volts. It can identify dead shorts, frail insulation, unbalances and loose connections caused by incorrect winding. It works by injecting high voltage pulses into each phase, creating a potential difference between one turn and the next. The resulting sine waves from every phase must equal 1 another.

The above-mentioned tests are offline tests.

Dynamic Motor Testing or online Testing

A more recent addition to electrical testing technologies, this involves measuring the voltage and current of the motor’s three phases, while the motor is functioning in its usual setting, and quantifying a host of data related to, the motor, the power supply and the load. Both electrical and mechanical issues can be identified.

Power quality values, including voltage level, unbalance and distortion are determined and compared to industry standards. Bad power quality can point to rise in temperature within motors, and as heat is the greatest enemy of insulation power quality problems must be determined and rectified where possible.

The Recommended Off-line in-Service Electric Motor Tests are

Stator winding resistive imbalance
Stator winding insulation resistance (Meg-Ohm checks)
Polarization Index (PI)
Step Voltage test
Surge test

The Recommended Spare Electric Motor Tests are

Stator winding resistive imbalance
Stator winding insulation resistance (Meg-Ohm checks)
Polarization Index (PI)
Step Voltage test
Surge test

The Recommended New/Refurbished Electric Motor Tests are

Stator winding resistive imbalance
Stator winding insulation resistance (Meg-Ohm checks)
Polarization Index (PI)
Step Voltage test
Surge test

How is Motor Testing Done?

Three Phase

Make sure the link for power supply is in decent state. Verify the connection bar for terminal (U, V, W). Connection type – STAR OR DELTA.

Confirm the power supply VOLTAGE for electric motor. 230/400.
With the help of multimeter, verify the continuity of winding from phase-to-phase (U to V, V to W, W to U). Every phase-to-phase should have a steadiness if winding is OK.

Verify the motor winding reading in ohms utilising ohmmeter or multimeter for phase-to-phase terminal (U to V, V to W, W to U). The ohms reading for each winding must be the same (or nearly the same).

Insulation resistance of motor winding using Insulation tester meter set to the 500 Volt scale (1000v DC)

1. Verify from phase-to-phase (U to V, V to W, W to U) and
2. Check from phase to earthing (U to E, V to E, W to E). Minimum test value of the electric motor is 1 Meg Ohm (1 MΩ).

With the motor running, check the running amps of the motor using Clamp on meter.
Match up to the full load current on the name plate of motor.
After the completion of every step choose the condition of electrical motor either NEED TO REPAIRE or OK

Single Phase

Utilising ohmmeter or multimeter, verify the motor winding readings in ohms. (C to S, C to R, S to R). The reading for start to run should be equal to C to S + C to R.

Correct electrical terminal identification: There are three terminal connections on a hermetically sealed motor compressor and are as follows:

1. Common (C)
2. Start (S)
3. Run (R)

To determine the proper terminal, link these processes applies:
The highest resistance reading is between the start and run terminals
The middle resistance reading is between the start and common terminals.
The lowest resistance reading is between the run and common terminals.
Utilising Insulation tester meter set to the 500 Volt scale insulation resistance of motor winding can be found. Check from windings to earth (C to E, S to E, R to E). Minimum test value of the electric motor is 1 Meg Ohm (1 MΩ).
Keeping the motor running, verify the running amps of the motor utilising a Clamp on meter.
Compare to the FLA on the name plate of motor.
If every step is completed – decide the condition of the electrical motor: OK or NEED TO REPAIR.

All Types

Check the appearance of the motor. Verify for body deterioration or damage to the cooling fan blade or shaft.
Manually rotate the shaft to check the bearing condition. Check for free & smooth rotation.
Note the motor data from the motor NAME PLATE.
Earth Continuity: Use your ohmmeter to verify the resistance between earth and motor frame is less than 0.5 Ω.
Power supply, 415 v between Ll to L2, L3 to L1 and L2 to L3.

Benefits of Motor Testing

Increase up-time
Save money
Conserve energy
Improve safety


Source URL: https://carelabz.com/what-is-electric-motor-testing-and-why-is-it-done/

Usage of Existing Power Plants as Synchronous Condenser

Published by Alexander DEECKE, Rafael KAWECKI
Siemens AG, Power and Gas, Instrumentation and Electrical


Abstract. Due to the continuously increasing amount of renewable energy being generated and the simultaneous reduction in rotating masses, the demand for grid-stabilizing measures is growing. To solve the problem different possibilities are known, one of them is the reuse of fossile power generation units as synchronous condenser. The article presents experiences and challenges from last projects and shows available solutions for existing power plants.

Streszczenie Przy rozproszonym wytwarzaniu energii istnieje potrzeba wyrównywania różnych możliwości źródeł energii. Jedną z możliwości jest wykorzystanie generatorów tradycyjnych jako synchronicznych kondenserów. Artykuł przedstawia przykłady eksperymentów. Wykorzystanie istniejących elektrowni jako synchronicznych kondenserów

Keywords: Synchronous condenser, synchronous generator, reactive power, modernization.
Słowa kluczowe: synchroniczny condenser, generator synchroniczny, moc bierna.

Introduction

Due to the continuously increasing amount of renewable energy being generated, increased transit of energy between countries and the simultaneous reduction in rotating masses, the stability of the transmission grid can be affected. Thus the demand for grid-stabilizing measures is growing.

Rotating synchronous machines can generate leading and lagging reactive power and contribute to the stabilization of the transmission grid voltage. Thus retiring a conventional power generation unit can create a deficit in reactive power that directly affects the transmission grid voltage stability and reliability.

Every power plant approaches one day the end of their operational life and power plant owners face a challenging decision of retiring the plant or, as alternative, upgrading the power plant to synchronous condenser.

Stability and reliability of the grid

In order to avoid any voltage disturbances and enough transmissions capacity a stable and reliable grid with continuous local regulation of reactive power is requested. This critical task is supported by conventional power plants with synchronous generators.

For the rated transmission of active power in the line no additional reactive power is required. In case more active power shall be transported, like in German transmission line after installation of wind turbines in norther part of the country, transmission line will require increased reactive power. It is specially critical for the redundant power lines (n-1), when one of them shall take over the capacity of the other one.

On the other side regulation of the reactive power supports the voltage stability in the grid.

Available solutions

To solve the problem of stability and reliability in the grid a regulation of the reactive power needs to be planned and implemented accordingly. Rotating synchronous condensers generate leading and lagging reactive power (Fig. 1), short circuit capacity, and thus play a key role in stabilizing the voltage and increasing the active power and short circuit capacity in the transmission grid. To realize this either a new synchronous condenser can be built or instead of shutting down decommissioned power plants, it is possible to continue economical operation by utilizing the generator as a synchronous condenser. In such case the generator is reconfigured for stand-alone functionality with inductive as well as capacitive reactive power.

Specially reuse of existing units is becoming more and more interesting for power plant owners at the end of the lifecycle of generating units. Instead of closing the unit it can be converted to a synchronous condenser and thus contribute to the transmission grid stability and as side effect it allows usage of existing assets, like generator and building, with just optimized investment costs.

Fig 1. Generator operating diagram

As an example a upgrade of the nuclear power plant Biblis A [1] to a synchronous condenser shall be mentioned.

Fig 2. Connection of synchronous condenser to the existing grid
Conversion steps

Conversion of conventional generating unit into synchronous condenser is done in three main steps:

• feasibility study
• mechanical works on the turbine and generator
• eletrical works on generator and auxiliary systems

Further above mentioned works will be described more detailed.

Feasibility study

In the study existing components are investigated specially in regards to the mechanical reconstruction as well as new components are chosen.

The start-up procedure needs to be investigated from the mechanical and electrical point of view. All necessary parameters, like initial acceleration power and run-up time, needs to be calculated or rechecked. Existing generator cannot work in any critical conditions, e.g. in regards to heating of the stator ruding startup.

The extension of the lifespan of existing devices needs to be checked and coordinated with optional modernization of affected components accordingly. E.g. modernization of excitation system can be realized in the same time as conversion to synchronous condenser

Mechanical works

As the turbine is not needed anymore, during this step turbine is decoupled from the generator. The connection needs to be replaced by shaft extension and bearing (see Fig. 4) for the stability reasons. The connection can however remain if the synchronous condensers operating mode is used just temporarily, e.g. only during the weekend. A connection via a clutch is also optionally possible.

During this stage also other components, like oil supply systems and foundation, needs to be checked and if necessary adapted to the new operating mode.

As the turbine is not connected anymore to the generator a new startup system needs to be designed and implemented. In most of the cases a simple pony motor with start-up Variable Frequency Drive (VFD) can take over the function. Figure 2 shows example of such connection as realized in one of the projects in Germany.

Fig 3. New mechanical components
Fig 4. Bearing support with bearing (left) and typical shaft extension (right)
Electrical works

As second step some electrical changes on the unit need to be completed. Depending on the age and function of installed components either just reconfiguration or complete new installation of the systems need to done.

Following components needs to be included in the works (Fig. 5):

• installation of start-up frequency converter (SFC)
• installation of transformers for SFC
• installation of medium voltage (MV) switchgear
• modification of generator protection and synchronizer
• modification of excitation equipment
• modification / connection to generator bus duct
• installation of Is-limiter or short current limiter reactor (option)
• electrical installation (cabling) and modification works

Fig 5. Scope of electrical works

During this part of works most of the components can be reused and thus initial investment is limited just to necessary modifications. In case the component can be reused, e.g. generator protection system, the parameterization needs to be checked and reconfigured according to new operating range of the generator.

Startup

SFC is used to start-up the generator similar as it is realized in units with gas turbines. The difference, in most of the cases, is the fact that SFC brings the generator to over rated speed without the turbine. The SFC is protected by an Is limiter (current limiter). The power supply for SFC is fed from the grid. After the overspeed is achieved the SFC is switched off and generator can be synchronized with the grid during the coast down to synchronous speed.

In order however to start the process generator needs to speed up first to about 10% of rated speed. This enables the identification of the rotor position and later correct startup process.

Optionally after the synchronous speed is achieved the SFC can be switched off and the generator can be synchronized with the grid if a fast switch-over device is installed.

During the start-up process some of the functions of the generator protection and excitation system are switched off and work with different parameters. E.g. the under frequency protection is switch off.

Normal operation

After generator was connected to the grid, normal operation of the synchronous condenser can be started. The regulation of the reactive power is realized over the setting of the unit transformer and by regulation of the excitation system.

Synchronous condenser reacts automatically on changes in the grid voltage. E.g. in case the grid voltage increases the unit decreases export of the reactive power to the grid.

Many different studies and reports [2, 3, 4] show that such regulation of reactive power gives the maximum of necessary flexibility in regulation and thus in stability and reliability of transmission grid.

Conclusion and outlook

Transmission grid stability and reliability was already in the past a key aspect for power systems. With the development of renewable sources of energy and further changes in the grid configuration this topic will become also in the future more important for safe supply of electrical energy to the loads.

By decommissioning of existing conventional power plants which regulate the reactive power in the grid, the stability of the system can be affected in a negative way. Therefore conversion from power generation unit to a synchronous condenser is a interesting from technical and financial point of view alternative to the shut down of the unit.

As synchronous condenser is a rotating device it provides also short circuit support additionally to the reactive power supply.

Already realized projects in Germany, Denmark, USA and other countries show that such reconstruction can be done in a short time.

In the future also other countries in and outside Europe will face the same challenges and thus presented solution shall be considered by both transmission grid authority and power plant owners.

REFERENCES

[1] Biblis A generator stabilizes the grid as a synchronous condenser, Reference flyer SPPA-E3000
[2] Davidson Ch., Wirta W., AES Uses Synchronous Condensers for Grid Balancing, PowerMagazine online, 2014.01.03
[3] Frerichs D., Mechanical and electrical rebuilding of a turbine generator for phase-shift operation, Power-Gen Europe 2013
[4] Lösing M., Schneider G., Synchronmaschine als Phasenschieber in Biblis A, ew, Jg. 111 (2012)


Authors: Dipl. Ing. Alexander Deecke, Siemens AG Erlangen, Power and Gas, Instrumentation and Electircal, Freyeslebenstr. 1, 91058 Erlangen, Germany, E-mail: alexander.deecke@siemens.com; Dr. Ing. Rafael Kawecki, Siemens AG Erlangen, Power and Gas, Instrumentation and Electircal, Freyeslebenstr. 1, 91058 Erlangen, Germany, E-mail: rafael.kawecki@siemens.com.


Source & Publisher Item Identifier: PRZEGLĄD ELEKTROTECHNICZNY, ISSN 0033-2097, R. 91 NR 10/2015. doi:10.15199/48.2015.10.12

Five Ways to Reduce Harmonics in Circuits and Power Distribution Systems

Published by Alex Roderick, EE Power – Technical Articles: Five Ways to Reduce Harmonics in Circuits and Power Distribution Systems, May 24, 2021.


There are several ways to reduce the problems of harmonics in a circuit or power distribution system. A K-rated transformer is designed to withstand the overheating problems created by harmonics. A harmonic mitigating transformer is designed to reduce problems by reducing or canceling harmonics. In addition, harmonic filters are occasionally used to reduce harmonics.

K-Rated Transformers

ANSI Standard C57.110-1986 defined a K-factor to evaluate how much harmonic current a circuit draws and to determine the heating effect of that harmonic current. Based on the circuit K-factor, transformers are manufactured with a K-rating. It is important to note that K-rated transformers do not reduce harmonics. The K-rating indicates the relative ability of a transformer to withstand the harmful effects of harmonics. K-rated transformers increase the size of the core, increase the size of the neutral conductor, and use special winding techniques to reduce eddy current and skin effect losses. For example, we know that doubling the cross-sectional area of a conductor reduces its resistance by half. A K-rated transformer uses heavier gauge wires for the primary and secondary coils to reduce the resistance heating.

Note: The occurrence of sags and swells may indicate a weak power distribution system. In such a system, the voltage will change dramatically when a large motor or welding machine is switched on or off.

Measuring K-Factor

In any system containing harmonics, the K-factor can be measured with a power quality analyzer (see Figure 1). A K-factor of 1 indicates a linear load. A higher K-factor indicates increased heating from harmonics. For example, a circuit with a K-factor of 2 has twice the heating effect of a circuit with a K-factor of 1. 

Figure 1. The K-factor can be measured with a power analyzer. Image Courtesy of Mouser

Standard K-ratings are 1, 4, 9, 13, and 20. In addition, K-ratings of 30, 40, and 50 exist, but loads with K-factors greater than 20 are relatively rare. Computer rooms typically have K-factors of 4 to 9. Areas with many single-phase computers have K-factors of 13 to 17. The K-rating of the transformer should exceed the K-factor of the circuit, or the transformer should be derated.

Circuit Load

Guidelines have been developed that recommend a K-factor based on the predominant type of load in a circuit (see Table 1). When specifying a transformer based on the K-factor, more is not better. A transformer with a K-factor greater than needed has its own set of problems. Typical problems include increased inrush current, higher eddy current core losses, and a larger footprint. 

Table 1. The K-factor of common loads can be estimated.

.

The K-factor of a circuit generally decreases with more loads connected to the circuit, just as the THD decreases with more identical loads on a circuit. Typically, with 10 or 20 devices simultaneously online, the combined K-factor at the bus of the distribution panel is reduced by a factor of 3 or more.

Harmonic Mitigating Transformers

A harmonic mitigating transformer (HMT) is a transformer designed to reduce the harmonics in a power distribution system. Some styles of HMTs are referred to as phase-shifting transformers. HMTs generally work on the principle of combining the waveforms in ways where the positive part of a harmonic component from one load adds to the negative part of a harmonic from another load. This addition results in complete cancellation when the loads are perfectly balanced. With unbalanced loads, we’ll still be able to have a much smaller overall harmonic. The end result is that harmonics are prevented from propagating through the power distribution system, but they remain in the secondary windings and the load side of the system.

An HMT works best when located close to the load. This generally means that HMTs are located at scattered locations throughout a facility. Therefore, HMTs are usually available with kVA ratings of about 100 kVA or less.

Delta-Wye Wiring

A common transformer wiring arrangement has the primary wound in a delta configuration with the secondary wound in a wye configuration. Delta-wye transformers have a higher impedance to the flow of harmonic currents than to the fundamental current. This reduces the current harmonics, but higher impedance in the transformer causes a relatively higher voltage drop from the harmonic currents. The high voltage drop contributes to voltage THD and flat-topping. This voltage THD can be distributed up-stream throughout the power distribution system. At full load, a delta-wye transformer can produce voltage THD above that recommended by the IEEE Standard 519-1992, IEEE Recommended Practices and Requirements for Harmonic Control in Electrical Power Systems.

While the triplen harmonics are attenuated, the other higher-order harmonics are not affected. However, if an HMT is being used to provide additional source impedance and/or phase shift from other nonlinear loads elsewhere in the facility, some benefits may be achieved.

Zigzag Windings

Another common HMT design is to wind the secondary of each phase in a zigzag configuration to eliminate the triplen harmonics. The zigzag is achieved by winding half of the secondary turns of one phase of the transformer on one leg of the three-phase transformer, with the other half of the secondary turns on an adjacent phase (see Figure 3). 

Figure 3. A zigzag winding is used to cancel triplen harmonics.

When all of the triplen harmonics are in phase with each other, the triplen harmonic currents generate ampere-turn fluxes that offset each other, causing no currents to be induced in the primary winding.


Author: Alex earned a master’s degree in electrical engineering with major emphasis in Power Systems from California State University, Sacramento, USA, with distinction. He is a seasoned Power Systems expert specializing in system protection, wide-area monitoring, and system stability. Currently, he is working as a Senior Electrical Engineer at a leading power transmission company.


Source URL: https://eepower.com/technical-articles/ways-to-reduce-harmonics/

Chargers for Electric Cars with V2G (Vehicle to Grid) Technology – Connection Principles for the Distribution Network

Published by Joanna BARANIAK, Jacek STARZYŃSKI
Warsaw University of Technology, Institute of Theory of Electrical Engineering, Measurement and Information Systems


Abstract. Electric vehicles will be an integral part of the smart grid in the future. The chargers that come with the V2G (vehicle to grid) service provide bidirectional electrical energy flow between the cars and the grid. Although this functionality has many advantages, the current paper presents doubts about the safety of the people involved in the operation and maintenance of electrical power equipment. It also signals the necessity to develop security requirements and connection conditions for the electrical distribution grid.

Streszczenie. Pojazdy elektryczne są jednym z elementów, które w przyszłości będą stanowiły integralną część smart grid. Dzięki ładowarkom z usługą V2G możliwe jest pobieranie i oddawanie energii elektrycznej do sieci zasilającej. Oprócz zalet, jakie niesie ze sobą ta funkcjonalność, w artykule przedstawiono wątpliwości dotyczące bezpieczeństwa osób zajmujących się eksploatacją i utrzymaniem urządzeń elektroenergetycznych oraz zwrócono uwagę na konieczność opracowania wymagań dla zabezpieczeń i warunków przyłączenia do sieci dystrybucyjnej ww. ładowarek. Układ ładowania do samochodów elektrycznych w technologii V2G

Słowa kluczowe: e-mobility, V2G, rozproszone źródła energii elektrycznej, ochrona przed podaniem napięcia do sieci zasilającej.
Keywords: e-mobility, V2G, distributed electrical energy sources, protection against voltage back to the supply network.

Introduction

In recent years, there has been an escalation in the development of the electromobility (e-mobility) market. This escalation directly results in the increased requirement of charging stations supplied from the public distribution network. According to various forecasts, it is estimated that by 2040, about 500 million electric vehicles will travel on the roads around the world [1, 2]. This will undoubtedly be one of the biggest challenges that distribution system operators, regional and country governments and all the road users have to face in the coming years. It should be expected that e-mobility will be an important factor for global economies and ecological trends. In fact, electric vehicles will act as a catalyst for the development and expansion of the smart grid infrastructure, being one of its elements at the same time (see Figure 1).

The Polish Parliament Act on Electromobility and Alternative Fuels that came into effect on January 11, 2018 can be considered as the first step to popularize e-mobility in Poland. Apart from the incentives that will be granted to electric vehicle drivers, the Act defines the rules for the development and operation of charging point infrastructure. The Act gives a green light to the car sharing service as well as research on autonomous vehicles on public roads [3].

Fig. 1. Electric vehicle as an element of a smart grid [4].

Literature presents quite a few more or less futuristic visions that show the possibilities of using electric vehicles as dispersed energy sources [5, 6, 7, 8]. The vehicles would be used for among others things, shaping the 24-hour load curve, reactive power compensation, storing electric energy produced by RES (renewable energy sources) [6, 9]. All these assumptions, even if their implementation is still far in the future, are built on a common basis, namely the V2G (vehicle to grid) concept.

Chargers for electric vehicles

The simplest method to classify electric cars is by their charging methods (Figure 2) or in terms of the energy source used for their drive, for example, BEVs (battery electric vehicles), FCEV (fuel cell vehicles). Producers of electric vehicles and charging stations are racing to develop the most convenient solution for users which will ensure that the time taken to charge batteries is similar to the time taken to refuel a traditional car. However, due to the lack of a uniform international standard, manufacturers launch solutions for chargers dedicated to specific car brands (CHAdeMO, CCS, Supercharger). This means that all users cannot use all charging points, or they must purchase special adapters to use chargers not specific to their vehicles.

Fig. 2. Charging methods of electric vehicles.

Perhaps even greater encapsulation of the market would be achieved by the Tesla rapid battery swap system launched in 2013. However, reports show that this approach did not meet with a positive response from customers who were more interested in the fast Supercharger. Numerous works and research projects [5, 7, 8, 10] predict that in the near future, the most popular solution will be stationary wireless charging of electric vehicles called inductive power transfer.

Inductive power transfer, in simple words, is a charging system that consists of a primary winding coil placed in a parking spot and a secondary winding coil that is part of the vehicle. The primary winding coil is supplied by a high frequency converter from the mains and the coils are magnetically coupled to form a transformer with an air gap.

Much research has gone into improving these charging systems that are based on the principle of electromagnetic resonance (Nicola Tesla’s invention). The main goal is to find a cheaper and safer way of charging vehicles than inductive power transfer [11].

Inductive power transfer systems are used, among others, in Turin, Genoa, Gumi and Mannheim [12]. Extensive research has been carried out to develop systems that will allow vehicles to be charged while driving (dynamic wireless charging).

Currently, the most popular (apart from micro, mild and fully hybrid cars) are cars that can be charged using a special cable – plug-in electric vehicles (PEVs) (Figure 3).

At present, there are four charging modes of PEV [12]. The first and second charging mode applies to cars in which the charger is located inside the vehicle, and charging takes place directly from the electrical outlet. In the first mode, the three-phase charger can take a maximum current of 16 A; in the second mode, the three-phase charger can take a maximum current of 32 A.

Fig. 3. A car with an electric drive (PEV) [13].

In the third mode, the charger is not part of the vehicle. The charger is equipped with an EVSE (electric vehicle supply equipment) control module permanently connected to the grid. The control module is responsible for relaying communication between the charging station and the car; it also provides protection against electric shock.

DC chargers (the fourth mode) provide currents up to 400 A. They are called quick chargers. The purpose of these chargers is to rectify and decrease the voltage to a level that ensures safe charging of the batteries inside the vehicle. Each charger of this type consists of two basic parts – a rectifier and a DC/DC converter.

There are chargers with unidirectional electric energy flow, i.e., G2V (grid to vehicle) and V2G systems with bidirectional electric energy flow, in which two-wire rectification is realized by a transistor-diode assembly. The assembly is shown in Figure 4.

Chargers with bidirectional electricity flow – The V2G system

V2G technology allows the use of electric vehicles for transport purposes and as well as distributed sources of electricity (Figure 5). Such a dual functionality will be important in creating future solutions of smart grids. It can be concluded that the V2G system will be one of the main elements of an intelligent power grid, for example, the National Power System, where electric vehicles will act as energy storages, energy which at a given moment can be returned to the grid. With appropriate legal regulations, technical solutions and high awareness of the owners of electric cars, this will have a direct impact on the curve of the daily demand for electric power.

An innovative project is being carried out by the manufacturer of Nissan cars and by the energy company Enel in the UK. The main goal of the project is to enable users of electric vehicles to sell energy accumulated in their batteries to the distribution grid. Enel and Nissan have realized the potential of V2G services to ensure network stability with increasing electricity demand. They predict that V2G services will also contribute to the integration of energy produced by renewable energy sources from the National Power System [15].

Fig. 4. The scheme of a bidirectional e-charger.
Fig. 5. The idea of V2G system [14].

Similar studies were realised by the California Independent System Operator (CAISO) and the Southern California Edison. A system was developed by which CAISO and the users of electric cars could communicate with each other. If CAISO reported a power deficit, the cars would respond by providing energy to the grid; whereas, for example, at night-time, the batteries were recharged from the grid. It has been pointed out that it would be necessary to develop a universal interface that will ensure the exchange of information on electricity demand between the distribution system operator and the vehicle.

In addition to the aforementioned applications, V2G technology can be used to adjust the power factor by transferring capacitive or inductive reactive energy to the grid depending on the actual demand [11, 16].

This functionality is ensured by the use of two fully controlled transistor-diode assemblies. With this function, it is possible to take energy (switching input transistors) as well as transfer energy stored in the battery to the mains (switching transistors on the battery side).

To adjust the power factor, the transistor keys in the charger system are switched on in such a way that the angle of the phase shift between the supply voltage and the current delivered to the grid is of a predicted value. Thus, it is possible to change the nature of the load from capacitive to inductive loads, which is the charger.

V2G chargers – Cooperation with the distribution grid

As mentioned earlier, electric vehicles can be used as electricity storages. One should consider how to treat such units when we connect them to a charging station supplied by the distribution network and that enable two-way flow of electricity. Should these chargers be treated only as a burden or should distribution system operators also treat them as generating units?

According to the definition given by the Polish Parliament Act 2015 [17] and Kałek [18], the electric energy storage must be physical and permanently connected to the electrical installation; it can only store the energy generated in it. According to the Polish Parliament Act 2015 [17], the energy storage facility can be used only for one purpose – the temporary storage of energy. Of course, electric vehicle batteries also accumulate energy for a limited time, but it is mainly used as a drive.

In view of the aforementioned interpretation, EVs together with V2G chargers should not be treated as electric energy storages [18, 19]. However, generally, if a charger operating in the V2G system is connected to the distribution network, electric vehicles should be treated as dispersed sources of electric energy [19, 20]. Of course, there are a number of questions about legal regulations, economic aspects and advantages of using such solutions [21, 22, 23], but it should be remembered that even the market development of photovoltaic panels had a similar start.

Currently, charging stations connected to distribution networks do enable the use of V2G technology. Therefore, the question should be asked whether the connection conditions for such facilities should be the same as, for example, residential buildings, or analogous to mini photovoltaic plants installed on the roofs of detached houses.

As an electric vehicle that transfers energy via a charger with the V2G service to the mains cannot be strictly classified as an energy storage or generation unit, there are currently no special regulations that can impose cooperation of such devices with the distribution network. In the majority of charging stations with bidirectional energy flow, the V2G function is not used. However, they do not constitute an autonomous island, and therefore all potential threats originating from the systems should be identified.

Imagine a situation in which due to, for example, human error, failure or incorrect use of the device, the V2G service is activated and electricity flows back to the network. This results in not only the risk of an electric shock, but also, for example, if the unit malfunctions, a fire risk. The main similarity between systems with V2G service and photovoltaic installations is of course the ability to return energy to the mains. For this reason, analogous security requirements should be set in stations with V2G service with the cooperation of the distribution network, as in the case of photovoltaic panel connection.

The basic protection against electric shock, which every charger with V2G service should be equipped with, is protection against the possibility of voltage flowing back to the supply network in the event of voltage decay in this network. Similarly, as in the case of photovoltaic installations, electricians should be protected against electric shock during the repair or operation of the electrical power equipment, in which, as a result of, for example, incorrect operation of the charger, there may be high voltage.

Sanchez-Sutil et al. [24] proposed the introduction of standardized rules for connecting electric vehicle chargers that had V2G function to the distribution network. By adapting these standards [25], the requirements of distribution network operators in the field of photovoltaic installations [26, 27] and the proposals presented in the IEEE 1547-2018 [25], it can be concluded that the scope of applied protections will be extended to include detection of abnormal situations in the dis

• overvoltage protection with function of short time delay
• undervoltage protection with function of short time delay
• overfrequency protection with function of short time delay
• underfrequency protection with function of short time delay.

In order to ensure proper cooperation of the charger with bidirectional electricity flow with the power grid, an automatic reclosing system may be considered. This will also be helpful in case of transient faults.

More and more dispersed energy sources are being connected to the distribution network. This state brings new and potentially dangerous situations. Let us consider the case when a part of the network is disconnected from the distribution network in order to carry out maintenance or repair a failure. Protection provided against the possibility of supplying voltage to the distribution network of one of the distributed sources can incorrectly interpret the voltage coming from another distributed source as the voltage coming from the distribution grid. As a result, it will not be possible to disable this part of the network from undervoltage. Therefore, the cooperation of the collateral used in installations of individual dispersed sources is very important. It is also recommended to use active methods of detecting disconnection from the distribution grid (loss of mains, LOM) instead of passive methods [28].

Many energy storages have the possibility of islanding. The main purpose of these storages is to stabilize the input of local renewable sources. They can also be used as a backup power source. Due to the fact that a charger with the V2G function is not always connected to energy storage, it cannot perform functions such as energy storage. Therefore, protection against islanding should be considered for systems with bidirectional electricity flows which are connected to the electricity grid.

Dolata [29] recommends supplying the protection automation from a guaranteed voltage source (UPS, buffer power supply), which is a source of electricity in case of a power failure in the mains. Analogous requirements should be specified for chargers with V2G service, as there is not always any energy storage in the form of an electric vehicle connected to them.

It is also necessary to take into consideration the potential negative impact on the grid of not only chargers with V2G service but all type of chargers for EVs.

The authors of this paper investigated the electrical energy quality of a charger installed in a circuit. After simulations (Figure 8) and careful measurements, they deemed the charger not dangerous [33].

Fig. 6. Block diagram of the simulation model [33].

The modelled DC charger was supplied from a three-phase grid with a nominal voltage of 400 V. The real distribution grid was mapped in the simulation model (transformer and cable line parameters). The modelled block diagram is presented in Figure 6 and described in detail [33]. The network was loaded by only one device which was the DC charger.

Fig. 7. Registered main current for the real charger during measurements.
Fig. 8. Simulated mains current and mains voltage for a charger equipped with LCL filter and connected to the real grid [33]
Fig. 9. Registered THDI and THDU.

During charging, the total harmonic distortion (current), THDI was about 7.8%, which even with a significant current drawn from the network had little effect on the total harmonic distortion (voltage), THDU, which did not exceed 2.2%.

Attention should be paid to the problem of simultaneous operation of many chargers in the common circuit, which will often take place, especially in urban areas. In such a situation, the disturbances caused by these chargers will overlap, which with the significant current values taken in total by such chargers, may have a noticeable effect on voltage deformation.

Conclusions

The development of electromobility will implicate changes and result in the emergence of new industries related to transport and the maintenance of charging infrastructure. The electricity market model and the electricity system that we know now will also change. Raising questions about the possibility of this ever happening is pointless, because we are already witnessing these changes [1, 3, 16, 20]. Therefore, we should focused on recognizing opportunities and risks that will appear in the coming years.

Undoubtedly, the number of electric cars, which, according to forecasts, will in the near future travel on the roads, will build a challenge for the National Power System. The issue of the impact of e-mobility on the quality of electricity has been often and very broadly discussed in literature around the world [28, 29, 30].

The purpose of this paper is to draw attention to the potential risks that may arise by the unintentional flow of voltage back to the network from the V2G charger. A deeper analysis of the problem raised should be made while the principles of connecting chargers with V2G service to the distribution network are developed.

Future studies will take into account the parallel work of various DC chargers (slow, fast, ultra-fast chargers with a capacity of around 20-200 kW) connected to the same circuit with other loads like houses, apartment and office buildings. The main purpose of these researches will be to investigate the real impact of DC chargers on the distribution grid and on the electric power quality (THDI, THDU, power losses, voltage drops, overloads). Based on the results, the next steps for research can be laid.

REFERENCES

[1] Development plan for electromobility in Poland “Energy for the future” , (in Polish: Plan rozwoju elektromobilności w Polsce “Energia do przyszłości”), Ministry of Energy, 09.2017
[2] Flasza J., Electromobility in Poland – the challenges and the opportunities including intelligent RES installations (in Polish: Elektromobilność w Polsce – wyzwania i możliwości z uwzględnieniem inteligentnych instalacji OZE), Autobusy, 6/2017, 1196 –1198
[3] Polish Parliament Act: Act of January 11, 2018 on electromobility and alternative fuels.
[4] Inauguration presentation of International symposium “Towards a Transalantic e-mobility Market” (Vehicles and grids of the future), 28th-29th October 2015
[5] Amditis A., Theodoropoulos T., Functional Integration of electric vehicles within the energy supply network, 2016 International Symposium on Power Electronics, Electrical Drives, Automation and Motion (SPEEDAM), 2016, 1190-1196
[6] Fernandez D., Pedraza S., Celeita D., Ramos G., Electrical vehicles impact analysis for distribution systems with THD and load profile study, 2015 IEEE Workshop on Power Electronics and Power Quality Applications (PEPQA), 2015, 1 – 6
[7] Musavi F., Eberle W., Overview of wireless power transfer technologies for electric vehicle battery charging, IET Power Electronics, 7 (2014), nr 1, 60 – 66
[8] Musavi F., Eberle W., Wireless Power Transfer: A survey of EV battery charging technologies, 2012 IEEE Energy Conversion Congress and Exposition (ECCE), 2012, 1804 – 1810
[9] Miśkiewicz M., Mobile energy storages in the National Power System – energy market model (in Polish: Mobilne magazyny energii w Krajowym Systemie Elektroenergetycznym – model rynku energii), CIRE – Problem materials, 14.04.2016
[10] Monteiro V., Goncalves H., Ferreira J.C., Afonso J.L, Batteries charging systems for electric and plug-in hybrid electric vehicles, New Advances in Vehicular Technology and Automotive Engineering, 2012, 149-168
[11] E. Palmberg, M. Alatalo, S. Haghbin, R. Karlsson and S. T. Lundmark, “Wireless charging using a resonant auxiliary winding,” 2015 Tenth International Conference on Ecological Vehicles and Renewable Energies (EVER), Monte Carlo, 2015, pp. 1 – 5
[12] Guziński J., Adamowicz M., Kamiński J., E-charging Infrastructure (in Polish: Infrastruktura ładowania pojazdów elektrycznych), Automatyka – Elektryka – Zakłócenia, Vol. 5, 15 (2014), nr 1, 74 – 83
[13] Polish Norm PN-EN 62196-1:2015-05
[14] Komarnicki P., Wenge C., Balischewski C., Electromobility – from hybrid to electric vehicles, European Copper Institute (in Plolish: Elektromobilność – od pojazdów hybrydowych do elektrycznych), 06.2019
[15] Douris C., Electric Vehicle-To-Grid Services Can Feed, Stabilize Power Supply, 12.2017
[16] Edwards Kayleigh, Nissan and Enel launch groundbreaking
vehicle-to-grid project in the UK, 10.2016
[17] Bielecki S., Electric vehicles as mobile sources of reactive power, (in Polish: Pojazdy elektryczne jako mobilne źródła mocy biernej), Przegląd Elektrotechniczny, 92 (2016), nr.11, 262 – 267
[18] Polish Parliament Act: The Act of 20 February 2015 on renewable energy sources
[19] Kałek P., Energy Storages. Current and future legal challenges, (in Polish: Magazyny energii. Obecne i przyszłe wyzwania prawne), Energia Elektryczna, 12/2016
[20] Guziński J., Adamowicz M., Kamiński J., Electric vehicles – technology development. Charging systems and cooperation with the distribution grid (in Polish: Pojazdy elektryczne – rozwój technologii. Układy ładowania i współpraca z siecią elektroenergetyczną), Automatyka – Elektryka – Zakłócenia, Vol. 3, 8 (2012), nr 8, 71 – 84
[21] Wiślański M., Electrical Vehicles as Distributed Energy Storage the potential for energy storage in the context of the development of electromobility, (in Polish: Pojazdy elektryczne jako rozproszone magazyny energii – potencjał magazynowania energii w kontekście rozwoju elektromobilności), Europa Regionum, 3/2017, tom XXXII, 133 – 145
[22] Habib S., Kamran M., Rashid U., Impact analysis of vehicle-to-grid technology and charging strategies of electric vehicles on distribution networks – A review, Journal of Power Sources, 277 (2015), 205 – 214
[23] Wang S., Zhang N., Li Z., Shahidehpour M., Modeling and impact analysis of large scale V2G electric vehicles on the power grid, IEEE PES Innovative Smart Grid Technologies, 2012, 1 – 6
[24] Sanchez-Sutil F., Hernández J. C., Tobajas C., Overview of electrical protection requirements for integration of a smart DC node with bidirectional electric vehicle charging stations into existing AC and DC railway grids, Electric Power Systems Research, 122 (2015), 104 – 118
[25] IEEE 1547-2018 – IEEE Standard for Interconnection and Interoperability of Distributed Energy Resources with Associated Electric Power Systems Interfaces
[26] The Distribution Network Operation and Maintenance Manual of PGE Dystrybucja S.A., (in Polish: Instrukcja Ruchu i Eksploatacji Sieci Dystrybucyjnej PGE Dystrybucja S.A.)
[27] The Distribution Network Operation and Maintenance Manual of TAURON Dystrybucja S.A., (in Polish: Instrukcja Ruchu i Eksploatacji Sieci Dystrybucyjnej TAURON Dystrybucja S.A.)
[28] Laaksonen H., New multi-criteria-based algorithm for islanding detection in smart grids, 2012 3rd IEEE PES Innovative Smart Grid Technologies Europe (ISGT Europe), 2012, 1 – 8
[29] Dolata M., Electrical protection in photovoltaic systems, (in Polish: Zabezpieczenia elektryczne w systemach fotowoltaicznych), maciejdolata.com, Sierpień 2015
[30] Fernandez D., Pedraza S., Celeita D., Ramos G., Electrical vehicles impact analysis for distribution systems with THD and load profile study, 2015 IEEE Workshop on Power Electronics and Power Quality Applications, 2015, 1 – 6
[31] Hadi Amini M., Boroojeni Kianoosh G., Cheng Jian Wang, Arash Nejadpak, Iyengar S. S., Karabasoglu O., Effect of electric vehicle parking lots’ charging demand as dispatchable loads on power systems loss, 2016 IEEE International Conference on Electro Information Technology, 2016, 499 – 503
[32] Kleiwegt E., Lukszo Z., Grid impact analysis of electric mobility on a local electricity grid, Networking, Sensing and Control (ICNSC), 2012 9th IEEE International Conference, 2012, 316 – 321
[33] Baraniak J., Starzyński J., DC Charger Simulation Results Compared to Measurements, 19th International Conference Computational Problems of Electrical Engineering, 2018


Authors: mgr inż. Joanna Baraniak, Warsaw University of Technology, Institute of Theory of Electrical Engineering, Measurement and Information Systems, Koszykowa 75, 00-662 Warsaw, E-mail: joanna.baraniak@ee.pw.edu.pl; prof. nzw. dr hab. inż. Jacek Starzyński, Warsaw University of Technology, Institute of Theory of Electrical Engineering, Measurement and Information Systems, Koszykowa 75, 00-662 Warsaw, E-mail: jacek.starzynski@ee.pw.edu.pl.


Source & Publisher Item Identifier: PRZEGLĄD ELEKTROTECHNICZNY, ISSN 0033-2097, R. 95 NR 11/2019. doi:10.15199/48.2019.11.53

Surge Protection Technical Supplements

Published by Electrical Installation Wiki, Chapter J. Overvoltage protection – Surge protection technical supplements


Lightning protection standards

The IEC 62305 standard parts 1 to 4 (NF EN 62305 parts 1 to 4) reorganizes and updates the standard publications IEC 61024 (series), IEC 61312 (series) and IEC 61663 (series) on lightning protection systems.

Part 1 – General principles

This part presents general information on lightning and its characteristics and general data, and introduces the other documents.

Part 2 – Risk management

This part presents the analysis making it possible to calculate the risk for a structure and to determine the various protection scenarios in order to permit technical and economic optimization.

Part 3 – Physical damage to structures and life hazard

This part describes protection from direct lightning strokes, including the lightning protection system, down-conductor, earth lead, equipotentiality and hence SPD with equipotential bonding (Type 1 SPD).

Part 4 – Electrical and electronic systems within structures

This part describes protection from the induced effects of lightning, including the protection system by SPD (Types 2 and 3), cable shielding, rules for installation of SPD, etc.

This series of standards is supplemented by:

The components of a SPD

The SPD chiefly consists of (see Fig. J50):

1) one or more nonlinear components: the live part (varistor, gas discharge tube, etc.);
2) a thermal protective device (internal disconnector) which protects it from thermal runaway at end of life (SPD with varistor);
3) an indicator which indicates end of life of the SPD; Some SPDs allow remote reporting of this indication;
4) an external SCPD which provides protection against short circuits (this device can be integrated into the SPD)

Fig. J50 – Diagram of a SPD

Technology of the live part

Several technologies are available to implement the live part. They each have advantages and disadvantages:

Zener diodes;
The gas discharge tube (controlled or not controlled);
The varistor (zinc oxide varistor).

The table below shows the characteristics and the arrangements of 3 commonly used technologies.

Fig. J51 – Summary performance table

Note: Two technologies can be installed in the same SPD (see Fig. J52)

Fig. J52 – The Schneider Electric brand iPRD SPD incorporates a gas discharge tube between neutral and earth and varistors between phase and neutral
End-of-life indication of a SPD

End-of-life indicators are associated with the internal disconnector and the external SCPD of the SPD to inform the user that the equipment is no longer protected against overvoltages of atmospheric origin.

Local indication

This function is generally required by the installation codes. The end-of-life indication is given by an indicator (luminous or mechanical) to the internal disconnector and/or the external SCPD.

When the external SCPD is implemented by a fuse device, it is necessary to provide for a fuse with a striker and a base equipped with a tripping system to ensure this function.

Integrated disconnecting circuit breaker

The mechanical indicator and the position of the control handle allow natural end-of-life indication.

Local indication and remote reporting

iQuick PRD SPD of the Schneider Electric brand is of the “ready to wire” type with an integrated disconnecting circuit breaker.

Local indication

iQuick PRD SPD (see Fig. J53) is fitted with local mechanical status indicators:

the (red) mechanical indicator and the position of the disconnecting circuit breaker handle indicate shutdown of the SPD;
the (red) mechanical indicator on each cartridge indicates cartridge end of life..

Fig. J53 – iQuick PRD 3P +N SPD of the Schneider Electric brand

Remote reporting
(see Fig. J54)
iQuick PRD SPD is fitted with an indication contact which allows remote reporting of:

cartridge end of life;
a missing cartridge, and when it has been put back in place;
a fault on the network (short circuit, disconnection of neutral, phase/neutral reversal);
local manual switching.

As a result, remote monitoring of the operating condition of the installed SPDs makes it possible to ensure that these protective devices in standby state are always ready to operate.

Fig. J54 – Installation of indicator light with a iQuick PRD SPD
Fig. J55 – Remote indication of SPD status using Smartlink

Maintenance at end of life

When the end-of-life indicator indicates shutdown, the SPD (or the cartridge in question) must be replaced.

In the case of the iQuick PRD SPD, maintenance is facilitated:

The cartridge at end of life (to be replaced) is easily identifiable by the Maintenance Department.
The cartridge at end of life can be replaced in complete safety, because a safety device prohibits closing of the disconnecting circuit breaker if a cartridge is missing.

Detailed characteristics of the external SCPD

Current wave withstand

The current wave withstand tests on external SCPDs show as follows:

For a given rating and technology (NH or cylindrical fuse), the current wave withstand capability is better with an aM type fuse (motor protection) than with a gG type fuse (general use).
For a given rating, the current wave withstand capability is better with a circuit breaker than with a fuse device.

Figure J56 below shows the results of the voltage wave withstand tests:

to protect a SPD defined for Imax = 20 kA, the external SCPD to be chosen is either a MCB 16 A or a Fuse aM 63 A,
Note: in this case, a Fuse gG 63 A is not suitable.
to protect a SPD defined for Imax = 40 kA, the external SCPD to be chosen is either a MCB 40 A or a Fuse aM 125 A,

Fig. J56 – Comparison of SCPDs voltage wave withstand capabilities for Imax = 20 kA and Imax = 40 kA

Installed Up voltage protection level

In general:

The voltage drop across the terminals of a circuit breaker is higher than that across the terminals of a fuse device. This is because the impedance of the circuit-breaker components (thermal and magnetic tripping devices) is higher than that of a fuse.

However:

The difference between the voltage drops remains slight for current waves not exceeding 10 kA (95% of cases);
The installed Up voltage protection level also takes into account the cabling impedance. This can be high in the case of a fuse technology (protection device remote from the SPD) and low in the case of a circuit-breaker technology (circuit breaker close to, and even integrated into the SPD).

Note: The installed Up voltage protection level is the sum of the voltage drops:

in the SPD;
in the external SCPD;
in the equipment cabling

Protection from impedant short circuits

An impedant short circuit dissipates a lot of energy and should be eliminated very quickly to prevent damage to the installation and to the SPD.

Figure J57 compares the response time and the energy limitation of a protection system by a 63 A aM fuse and a 25 A circuit breaker.

These two protection systems have the same 8/20 µs current wave withstand capability (27 kA and 30 kA respectively).

Fig. J57 – Comparison of time/current and energy limitations curves for a circuit breaker and a fuse having the same 8/20 µs current wave withstand capability
Propagation of a lightning wave

Electrical networks are low-frequency and, as a result, propagation of the voltage wave is instantaneous relative to the frequency of the phenomenon: at any point of a conductor, the instantaneous voltage is the same.

The lightning wave is a high-frequency phenomenon (several hundred kHz to a MHz):

The lightning wave is propagated along a conductor at a certain speed relative to the frequency of the phenomenon. As a result, at any given time, the voltage does not have the same value at all points on the medium (see Fig. J58).

Fig. J58 – Propagation of a lightning wave in a conductor

A change of medium creates a phenomenon of propagation and/or reflection of the wave depending on:
the difference of impedance between the two media;
the frequency of the progressive wave (steepness of the rise time in the case of a pulse);
the length of the medium.

In the case of total reflection in particular, the voltage value may double.

Example: case of protection by a SPD

Modelling of the phenomenon applied to a lightning wave and tests in laboratory showed that a load powered by 30 m of cable protected upstream by a SPD at voltage Up sustains, due to reflection phenomena, a maximum voltage of 2 x Up (see Fig. J59). This voltage wave is not energetic.

Fig. J59 – Reflection of a lightning wave at the termination of a cable

Corrective action

Of the three factors (difference of impedance, frequency, distance), the only one that can really be controlled is the length of cable between the SPD and the load to be protected. The greater this length, the greater the reflection.

Generally for the overvoltage fronts faced in a building, reflection phenomena are significant from 10 m and can double the voltage from 30 m (see Fig. J60).

It is necessary to install a second SPD in fine protection if the cable length exceeds 10 m between the incoming-end SPD and the equipment to be protected.

Fig. J60 – Maximum voltage at the extremity of the cable according to its length to a front of incident voltage = 4kV/us
Example of lightning current in TT system

Common mode SPD between phase and PE or phase and PEN is installed whatever type of system earthing arrangement (see Fig. J61).

The neutral earthing resistor R1 used for the pylons has a lower resistance than the earthing resistor R2 used for the installation.

The lightning current will flow through circuit ABCD to earth via the easiest path. It will pass through varistors V1 and V2 in series, causing a differential voltage equal to twice the Up voltage of the SPD (Up1 + Up2) to appear at the terminals of A and C at the entrance to the installation in extreme cases.

Fig. J61 – Common protection only

To protect the loads between Ph and N effectively, the differential mode voltage (between A and C) must be reduced.

Another SPD architecture is therefore used (see Fig. J62)

The lightning current flows through circuit ABH which has a lower impedance than circuit ABCD, as the impedance of the component used between B and H is null (gas filled spark gap). In this case, the differential voltage is equal to the residual voltage of the SPD (Up2).

Fig. J62 – Common and differential protection

Source URL: https://www.electrical-installation.org/enwiki/Surge_protection_technical_supplements

The Benefits of High-Voltage Direct Current (HVDC) Power

Published by Andreas Berthou, EE Power – Technical Articles: The Benefits of High-Voltage Direct Current (HVDC) Power, October 19, 2020


This article highlights ABB as HVDC has emerged as a viable complement to AC power transmission, with the ability to connect asynchronous AC grids and allow power transmission across long distances with minimal losses.

For the past century, alternating current (AC) systems have been the global standard for electrical transmission to businesses, applications, and homes. However, over the last several decades, High-Voltage Direct Current (HVDC) has emerged as a viable complement to AC power transmission, with the ability to connect asynchronous AC grids and allow power transmission across long distances with minimal losses.

This is essential for applications such as offshore wind farms, which can operate at considerable distances from where the power they generate is needed. In this way, HVDC technology is on course to unlock the full potential of Europe’s offshore resources and increase the efficiency and compatibility of energy systems across the world. Andreas Berthou explains the benefits of this transmission system.

Figure 1. Offshore wind
AC vs DC

AC transmission has established itself as the preferred global platform over the past century, due to the convenience of transformers in stepping voltage up or down as needed, as well as being easier to interrupt than DC grids. However, high-voltage AC transmission has a number of limitations, including shorter distance constraints and transmission capacity, as well as the impossibility of connecting two AC power networks of different frequencies.

Owing to a number of innovations over the years, HVDC transmission is now primed to supplant AC transmission, with HVDC offering an improved capacity for distance transmission and higher efficiency over those distances. While AC transmission is impossible between two networks of different existing energy infrastructures. This precise power flow allows new energy sources to be integrated seamlessly into power grids without the volatility that such integration can introduce to frequencies, HVDC transmission can connect networks that operate on any frequency or voltage. This allows renewable energy from various sources to be easily integrated into existing power grids, facilitating an efficient transition to renewable energy sources. HVDC transmission is reliable and easy to control, providing instant and precise control of power flow for new and existing grids. HVDC can expand the energy networks, making them more stable.

HVDC is more environmentally friendly than AC, providing more energy per square metre over greater distances more efficiently than AC systems, as well as lower losses and less space requirements. This increased efficiency reduces the carbon footprint of HVDC compared to AC, with losses being reduced from around 5-10% in AC transmission to around 2-3% for the same application in HVDC.

Figure 2. DC overhead lines
What is HVDC?

HVDC, pioneered by Hitachi ABB Power Grids in the 1920’s, and commercially established in the 50’s, differentiates itself from AC transmission systems through electrical current converter technology, converting AC to DC to more efficiently transmit across large distances with fewer transmission lines needed. HVDC is also commonly used to connect asynchronous AC networks, stabilising the surrounding grid while increasing grid capacity and affording greater control over power flow. HVDC systems use high-power semiconductor valves, tuned specifically by Hitachi ABB Power Grids for their applications.

Figure 3. HVDC light valves

HVDC is the method of choice for subsea electrical transmission and long-distance power transmission, owing to its ability to send large amounts of electricity across greater distances than AC transmission, with minimal losses. Offshore wind is becoming increasingly important, with WindEurope estimating that Europe’s offshore wind capacity will reach 450GW in 30 years, and HVDC transmission is an essential part of connecting remote offshore wind farms to the cities and areas where this electricity is used. To enable this integration with offshore energy, a hybrid HVDC breaker designed by Hitachi ABB Power Grids was recently tested by KEMA Laboratories as part of the EU-funded “Progress on Offshore Meshed HVDC Transmission Networks” project. Using optimized power semiconductors developed in-house by Hitachi ABB Power Grids, this breaker overcomes existing technical limitations by allowing the HVDC transmission system to maintain power flow even if there is a fault on one of the lines, breaking the direct current on the line and isolating the fault.

Another important development is HVDC Light®, a voltage-sourced converter solution pioneered by Hitachi ABB Power Grids in 1997, recently hailed by the World Economic Forum as “one of the greatest global energy innovations” of the last decade. HVDC Light provides more secure power control and quick power restoration, and allows long-distance underground high-voltage transmission, enabling easier transition to renewable energy in urban areas.

The future of HVDC

While AC fulfils an important role for energy transmission across shorter distances and to the end-user, HVDC technology is a more viable energy transmission solution in our increasingly connected global energy ecosystem. HVDC’s efficiency across long distances will be an essential part of global renewable energy solutions, seamlessly integrating clean energy into existing power infrastructures and ensuring that renewable energy is accessible and affordable.

Figure 4. HVDC Classic valves from North East Agra multiterminal link in India

This potential is already being shown through large-scale global developments using HVDC in renewable energy systems. Hitachi ABB Power Grids is supporting China in building the Zhangbei HVDC grid in the Beijing-Tianjin-Hebei area, the first grid installation of its kind in the world. When completed, this grid is expected to provide the area with a consistent supply of renewable energy through the integration of remote wind, solar and hydro energy, and could facilitate the adoption of similar systems in Europe and the US. Just last month Hitachi ABB Power Grids announced a major project with Scottish and Southern Electricity Networks (SSEN) Transmission, part of the UK energy giant SSE plc, to enable Europe’s first multi-link VSC HVDC connection. The link, which will connect Shetland to the UK transmission system for the first time, will enhance security of power supply and help transmit wind power generated on the islands, contributing to the UK’s decarbonization target of bringing all greenhouse gas emissions to net zero by 2050.

Another exciting HVDC project is the Dogger Bank development in the UK, consisting of three wind farm projects in the North Sea. The development will be the UK’s first offshore wind application of HVDC and is expected to power 4.5 million homes when completed in 2030. These developments not only represent the massive potential HVDC has for the future of the energy industry, but they are playing an essential role in strategies to reduce global warming and contributing to the UN Sustainable Development Goal of increasing access to reliable and affordable energy for all.

This article originally appeared in the Bodo’s Power Systems magazine


Author: Andreas Berthou received his Bachelor Of Science in Mechanical Engineering at Chalmers University of Technology, then Master Of Science in Business Management at Napier University. He work as a Senior Vice President, High Voltage Cables at ABB.


Source URL: https://eepower.com/technical-articles/the-difference-that-dc-makes/

Electric Power System of Tu-154M Passenger Aircraft

Published by Jacek F. GIERAS, University of Technology and Life Sciences, Bydgoszcz


Abstract. The paper discusses the electric power system of the Tu-154M aircraft. After brief introduction to aircraft power systems, the results of reverse design and analysis of the GT40PCh6 wound-field synchronous generator including short circuit have been presented. Electric power distribution and assignment of electric grids (channels) to respective aircraft energy consumers has been discussed. Most important electric loads, i.e., the fuel system with electric motor driven pumps, wing anti-ice electric system and exterior and interior lighting equipment have been described. An example of failure of GT40PCh6 synchronous generator is the fire of the Tu-154B-2 on January 1, 2011 before taking off at Surgut airport (flight 7K348).

Streszczenie. Artykul omawia system elektroenergetyczny samolotu Tu154M. Po krotkim wprowadzeniu do systemow elektroenergetycznych samolotow, przedstawiono wyniki projektowania odwrotnego oraz analizy generatora synchronicznego GT40PCh6 o wzbudzeniu elektromagnetycznym z uzwglednienium przebiegow pradow podczas zwarcia. Opisano dystrybucje energii elektrycznej oraz przyporzadkowanie odbiornikow energii elektrycznej samolotu do poszczegolnych sieci (kanalow). Scharakteryzowano najwazniejsze obciazenia elektryczne, tzn. system paliwowy z pompami napedzanymi silnikami elektrycznymi, system elektryczny zapobiegajacy osadzaniu sie lodu na frontowych powierzchniach skrzydel oraz oswietlenie zewnetrzne i wewnetrzne. Przykladem awarii generatora synchronicznego GT40PCh6 jest pozar Tu-154B-2 w dniu 1 stycznia 2011 przed startem na lotnisku w Surgucie (lot 7K348). (System elektroenergetyczny samolotu pasazerskiego Tu-154M)

Keywords: aircraft electric power system, distribution system, electric loads, electric motor-driven fuel pumps, fuel system, lighting, synchronous generator, Tu154M, wing anti-ice electric system
Słowa kluczowe: generator synchroniczny, odbiorniki energii, oswietlenie elektryczne, pompy paliwa napedzane silnikami elektrycznymi, system dystrybucji energii elektrycznej, system elektroenergetyczny samolotow, system odmrazania elektrycznego skrzydel, system paliwowy, Tu-154M

Introduction to aircraft electric systems

The function of the aircraft electrical system is to generate, regulate and distribute electrical power throughout the aircraft [4, 7]. Aircraft electrical components operate on many different voltages both AC and DC. Most systems use 115/200V AC (400 Hz) and 28V DC. There are several different electric generators on large aircraft (Fig. 1) to be able to handle loads, for redundancy, and for emergency situations, which include [4, 7, 8]:

1. engine driven main generators;
2. auxiliary power unit (APU);
3. ram air turbine (RAT);
4. external power, i.e., ground power unit (GPU).

Each of the engines on an aircraft drives one or more a.c. generators (Fig. 2) via special transmission system.

Fig. 1. Aircraft generators: 1 – main generator, 2 – APU, 3 – RAT, 4 – GPU [4].

The electricity produced by these generators is used in normal flight to supply the entire aircraft with power. The power generated by APUs is used while the aircraft is on the ground during maintenance and for engine starting. Most aircraft can use the APU while in flight as a backup power source. RATs are used in the case of a generator or APU failure, as an emergency power source. External power may only be used with the aircraft on the ground. A GPU (portable or stationary unit) provides AC power through an external plug. Aircraft generators are typically three-phase, salient pole, wound-field synchronous generators with outer stator with distributed-parameter winding and inner rotor with concentrated coil winding [4]. The field excitation current is provided to the rotor with the aid of a brushless exciter system consisting of two synchronous machines, i.e., wound-field synchronous exciter and permanent magnet (PM) sub-exciter. The power circuit is shown in Fig. 2. PM brushless generators are rather avoided due to difficulties with shutting down the power in failure modes. There are also attempts of using switched reluctance (SR) generators with no windings or PMs on the rotor. A generator control unit (GCU), or voltage regulator, is used to control generator output. The generator shaft is driven by a turbine engine with the aid of gears or directly by low spool engine shaft.

Fig. 2. Architecture of main wound-field synchronous generator [4].

Typical AC power system of aircraft is 115/200V, 400Hz, three-phase system. Since the speed of an aircraft engine varies from full power speed to flight idle speed (typically 2:1), and frequency is proportional to the generator rotational speed, a device for converting a variable speed to constant speed is necessary [7]. The so called constant speed drive (CSD), i.e., a complex hydromechanical device was common until the late 1980s. Nowadays, solid state converters have replaced unreliable CSDs with variable speed/constant frequency (VSCF) systems.

Typical aircraft have from 16 to 160 km of wire installed such that wire from one system is often collocated with wire from many other systems. Electrical wiring can be classified into power wiring (heavy current) and light current wiring. In modern aircraft, power wires, feeding e.g., electric motors, are not routed through the cockpit. Switches in the cockpit are connected to light current wires (control wires), which activate relays of heavy current circuit.

Table 1. AC power systems of Tu-154M aircraft

.
Fig. 3. Main power distribution systems 115/220V AC and 36V AC of Tu-154M.

1 – rectifiers VU-6A (backup and No 1), 2 – rectifier VU-6A No 2, 3 – right junction box (JB) 115/200 V, 4 – converter PTS-250 No 2, 5 – converter PTS-250 No 1, 6 – JB of kitchenette, 7 – JB of anti-ice system, 8 – right panel of generators, 9 – generator GT40PCh6 No 3, 10 – JB of APU 200V, 11 – generator GT40PCh6 of APU, 12 – generator GT40PCh6 No 2, 13 – generator GT40PCh6 No 1, 14 – external power connector for ShRAP-400-3F GPU, 15 – left panel of generators, 16 – left JB 115/220V, 17 – transformer No 2, 18 – transformer No 1, 19 – right JB 36V AC, 20 – left JB 36V AC, 22 – flight attendant’s switchboard, 23 – converter POS-125Ch [3, 13].

Electric power supply system of Tu-154M

The main power supply system of the Tu154M is a three-phase 115/200V, 3×40kVA, 400Hz, AC system [3, 10, 13]. The three-phase 115/200V AC power is delivered by three GT40PCh6 wound-field synchronous generators. The fourth GT40PCh6 AC generator is the APU generator. The APU is also equipped with 27V DC GS-12TO starter-generator.

The secondary three-phase, 36V, 400Hz, 46.8-A, 2×3kW AC system takes power from the main system via two three-phase 206/37V, Dy, TS330S04B transformers. The primary windings of TS330S04B transformers are fed from the navigation piloting system (NPK) bus bars. The 115/200V AC and 36V AC power systems are shown in Fig. 3 and described in Table 1. The third power system is the 27V, 200A, DC, single-circuit system (Fig. 4), which receives power from the main system via transformer and three VU-6A rectifiers and four 20NKVN-25 batteries.

The emergency 36V AC power system (instead of RAT) consists of two 20-30/36V, 400Hz, 250VA PTS-250 transistor inverters fed from batteries. It feeds among others the gyro horizon AGR-144. Another single-phase 115-V emergency system takes electric power from batteries via POS- 125TCh solid state converter.

The simplified electrical diagram of 115/200V AC power generation system with three main generators and APU generator is shown in Fig. 5. The block diagram of overall electric system of the Tu-154M is shown in Fig. 6.

Fig. 4. Power distribution system 27V DC of Tu-154M.

1 – Rectifier VU-6A No 2, 2 – right panel of protection control, 3 – Rectifier VU- 6A No 1, 4 – Left panel of protection control, 5 – junction box (JB) of kitchen, 6 – left power JB 27 V DC, 7 – electrical panel of flight attendant, 8 – rear JB (in left panel of generators), 9 – JB of APU and batteries, 10 – batteries 20NKBN-25, 12 – JB of batteries, 12 – JB of VU-6A backup rectifier, 14 – backup rectifier VU-6A, 15 – “PT” JB, 16 – electrical panel of household devices, 17 – electrical panel of crew cupboard, 18 – flight attendant’s switchboard [13].

Fig. 5. Simplified schematic of main electric power generation system 115/220V AC when all generators G1, G2, and G3 are in parallel.

1 – contactor TKS133DOD “reconnection of grid No 1 on generator No 3”, 2 – contactor TKS233DOD “switching generator No 1 on grid”, 5 – contactor TKS233DOD “switching APU on grid No 2”, 17 – contactor TKS233DOD “switching generator No 2 on grid”, 20 – contactor TKS233DOD “reconnection of grid No 3 on generator No 1”, 21 – contactor TKS233DOD “switching generator No 3 on grid”, 27 – contactor TKS233DOD “switching APU or GPU on grid No 3”, 38 – contactor TKS233DOD “switching APU on grid” [2].

Electric power distribution

The main three-phase, 115/200V, 400Hz power supply system is a three-channel system (Figs 3, 5 and 6). One GT40PCh6 generator feeds one channel (electric grid).

The generator No 1 mounted on the left turbofan engine No 1 feeds the grid No 1, which in turn feeds the left autonomous bus bars, left bus bar of navigation piloting system (NPK), radio navigation equipment, anti-collision flashing lights SMI-2KM, control systems of slats and stabilizers (motors No 1), fuel pumps No 1,3,5,8,10, rectifiers VU-6B No 1 (No 3), passenger cabins lighting, heaters of windshields of cockpit, hydraulic pumping station NS-46 of the second hydraulic system, and other loads. The total power consumption of the grid No 1 is 23.2kVA, 70A (excluding NS-46).

The generator No 2 of the grid No 2 mounted on the center engine No 2 feeds anti-ice electric heating elements of leading edges of wings (slats). The power consumption is 43.6 kVA, 130 A.

The third grid No 3 powered by the generator No 3 installed on the right engine No 3 is loaded with the right autonomous bus bars, right bus bar of navigation piloting system (NPK), control system of slats and stabilizers (motors No 2), fuel pumps No 2,4,6,7,9,11, fuel control system, rectifiers VU-6B No 2 (No 3), air conditioning system, hydraulic pumping station NS-46 of the third hydraulic system, household equipment and other equipment. The total power consumption is 12kVA, 45A (without household equipment and NS-46). The household equipment needs 13kVA, 60A.

In the case of failure of one of the generators, its grid is automatically reconnected to the operating generators.

The GPU supplies all three electric grids. After starting any turbofan engine and after switching on any GT40PCh6 generator, the first and the third grid is automatically connected to this generator while the GPU feeds only the second grid. If two generators are on, the GPU is automatically disconnected from the aircraft electric power system.

Control and protection devices of the main power system are located on the power panel of the flight engineer. The three-phase 36-V, 400-Hz, two-channel electric power system feeds the Kurs-MP-2 landing navigation and control unit, ARK-15M radio compass, Groza-154 radar, Doppler effect velocity and drift angle measure system DISS-3P, and hydraulic pressure gauge MET-4B. The 36V AC system also supplies the gyro horizon (attitude indicator), but its power is supplied independently of the PTS-250 converter, which receives electrical energy from batteries. The PTS-250 No 1 converter is used as an emergency 36V AC power source (Fig. 6). Connection of the converter to the network is made automatically.

Fig. 6. Block diagram of electric power system of Tu-154M [16].

The on-board 27V DC power system consists of three VU-6A rectifiers, GS-12TO starter-generator mounted on the APU, and two four 20NKBN-25 batteries (Fig. 4). The VU-6A rectifiers are the basic DC power sources. They get the power from the first and third grid (from the main 115/200 V AC system). There are two basic rectifiers and the third rectifier is for redundancy (Fig. 6). The third rectifier is switched on automatically in the case of failure of one of the basic rectifiers and operates in parallel with the remaining rectifiers. There is also provision for “forced” connection of the third reserve rectifier.

The 27V DC GS-12TO APU-mounted starter-generator delivers power to the DC grid after starting the APU on the ground until turbofan engines are started and GT40PCh6 synchronous generators operate. In the case of failure of the main 115/200V power system in the air, rechargeable batteries are used to supply the most important loads and to start the APU on the ground in the absence of GPU. Under normal operation, batteries are connected in parallel to smooth the DC bus voltage ripple. Rechargeable batteries are installed in the rear fuselage under the floor of the technical compartment. They can be accessed through a removable hatch in the floor.

In addition, there is a 27V AC power supply designed for household appliances: electric kettles and electric warmer in the kitchenette-buffet. The system gets its power from the main system through a TS-330S04A transformer connected to the grid No 3 via a switch mounted on the flight attendant switchboard (Figs 3 and 4). The transformer is installed on the right board, near the frame No 35, in junction box (JB) of the kitchenette (Fig. 3).

The single-phase 115V AC, 400 Hz power supply provides electric power to Landish-20 FM radio station, radio system RSBN-2SA of near-range navigation, Kurs-MP-2 navigation and control unit, and other radio equipment, as well 2IA-7A temperature meters of engine exhaust gases [3]. In the case of emergency, the electrical power to these loads comes from the converter MA-100M, which is supplied from batteries. The connection of converter is made automatically.

The cross section of basic distribution wires is:

• 1.93 to 35.0 mm2 for AC systems;
• 1.5 to 70.0 mm2 for DC systems.

Synchronous generators

The main generators are three 40-kVA, 115/200V, 400Hz, CSD GT40PCh6 wound-field synchronous generators driven by three D-30KU low-bypass turbofan engines (Fig. 7). Each generator feeds one channel (grid). There is also a reserve 40-kVA, 115/200V, 400Hz power source, the so called APU which consists of GT40PCh6 synchronous generator driven by independent TA-6A turbine engine (Fig. 8).

Fig. 7. Turbofan engine D-30KU.

1 – inlet guide vanes heating collector (VNA), 2 – centrifugal air separator of oil system, 3 – fuel-oil heat exchanger, 4 – main oil pump, 5 – front (main) accessory drive gearbox, 6 – hydraulic pump for thrust reverse, 7 – fuel pump, 8 – sensor of referred revolutions, 9 – place for aircraft hydraulic pumps NP-25 and NP-89, 10 – fuel pump regulator, 11 – temperature sensor, 12 – centrifugal regulator of low pressure (LP) rotor, 13 – rotational speed sensor for the LP rotor, 14 – synchronous generator GT40PCh6, 15 – rear accessory drive gearbox, 16 – constant speed drive (CSD), 17 – mechanism of frequency correction, 18 – air turbine of CSD, 19 – air turbo starter, 20 – overlapping cover of turbo starter, 21 – oil removal pump. http: //ru.wikipedia.org/

Fig. 8. APU with GT40PCh6 synchronous generator and TA-6A turboshaft engine.

1 – fuel pump-regulator, 2 – sensor of tacho generator, 3 – synchronous generator GT40PCh6, 4 – leads of synchronous generator, 5 – air-oil heat exchanger, 6 – adapter, 7 – fan, 8 – stabilizer of oil pressure, 9 – front suspension rigging, 10 – grid of compressor, 11 – radial-circular entrance, 12 – compressor, 13 – gas collector, 14 – combustion chamber, 15 – evaporation tube, 16 – head of flame tube, 17 – snail, 18 – exhaust pipe, 19 – air bypass pipeline, 20 – turbine, 21 – air regulator, 22 – bleed air pipe, 23 – spring, 24 – reducer [3].

The longitudinal section of the GT40PCh6 synchronous generator is shown in Fig. 9. From better packaging point of view, the PM brushless sub-exciter is placed inside the exciter.

Fig. 9. Wound-field air-cooled synchronous generator GT40PCh6:

1 – armature core of main generator, 2 – armature winding of main generator, 3 – armature winding of exciter, 4 – armature core of exciter, 5 – field winding of exciter, 6 – pole, 7 – field excitation system of exciter, 8 – rotor pole of main generator, 9 – armature of subexciter, 10 – PM, 11 – armature winding of subexciter, 12 – end shield, 13 – nozzle, 14 – housing, 15 – bearing, 16 – hollow shaft of rotor, 17 – shaft end, 18 – flanges, 19 – fan, 20 – field winding of main generator, 21 – point of lubrication. http: //s010.radikal.ru/i314/1010/42/cba147b70185.jp

The GT40PCh6 generator operates smoothly under the following conditions:

1. ambient temperature from +100 to −60 C;
2. cooling air temperature from +60 to −60 C;
3. atmospheric pressure up to 124 mm Hg;
4. effects of frost and dew;
5. shock accelerations up to 6g.

The housing monoblock is made of magnesium alloy with pressed steel sleeve mounted on the drive side around the ball bearing. The bearing nest has a pocket for the collection of waste grease that is removed from it with the aid of a plunger. Lubricant is applied to the bearing on the oil line through the point of lubrication.

There are longitudinal ribs on the inner surface of the housing, which increase its rigidity and form channels for passage of cooling air. Windows in the enclosure at the drive side are designed to exit the air. Titanium flange screwed to the end shield mounts the generator on the engine (Fig. 9). A box on the outer surface of the housing contains a differential current transformer for protection of the generator.

The rotor has two ball bearings. Seals of the bearings are threaded type with extra cuffs. The rotor salient poles, armature of the exciter and PMs of sub-exciter are pressed on the hollow shaft. The rotating passive rectifier consists of six silicon diodes D232A.

Cooling of the generator is accomplished by blowing air at a flow rate varying from 0.1 to 0.3 kg/s.

Dimensions, material data and winding diagrams of the GT40PCh6 synchronous generator are not available [3, 13, 10]. To obtain dimensions, winding parameters and detailed performance characteristics of the GT40PCh6 synchronous generator (Table 2), a reverse design on the basis of available sources [3, 10, 13] has been done. The 2D FEM has been used for electromagnetic analysis and synthesis. The 2D magnetic flux distribution in the cross section of the main generator as obtained from the FEM is shown in Fig. 10.

Fig. 10. Magnetic flux distribution in the cross section of GT40PCh6 synchronous generator as obtained from the 2D FEM.

The open circuit characteristics [3] at synchronous speed ns = f/p = const obtained from analytical calculations and 2D FEM are shown in Fig. 11.

Fig. 11. Open circuit characteristics at synchronous speed ns = const obtained from analytical calculations and 2D FEM.

Short-circuit currents can exceed more than 11 times the nominal current. Figs 12 to 15 shows the armature current Iash = f(t) waveforms for three-phase, line-to-line, line-to-neutral and two lines-to-neutral short circuits of the GT40PCh6 synchronous generator. The most dangerous are line-to-neutral (Fig. 14) and two lines-to-neutral (Fig. 15) short circuits. The obtained short-circuit current waveforms are very important since the subtransient and transient shortcircuit currents help to evaluate the possible damage during the electrical power system failure.

Fig. 12. Armature current Iash at three-phase short circuit of GT40PCh6 synchronous generator. The peak current is 911.2 A at 0.9 ms.
Fig. 13. Armature current Iash at line-to-line short circuit of GT40PCh6 synchronous generator. The peak current is 944.6 A at 0.95 ms.
Fig. 14. Armature current Iash at line-to-neutral short circuit of GT40PCh6 synchronous generator. The peak current is 1108.2 A at 0.95 ms.
Fig. 15. Armature current Iash at two lines-to-neutral short circuit of GT40PCh6 synchronous generator. The peak current is 1130 A at 0.6 ms.

Table 2. Parameters of GT40PCh6 synchronous generator

.
Fuel supply system

Civil transport aircraft use the wing structure as an integral fuel tank to store fuel. In larger aircraft, the fuel is also stored in the structural wing box within the fuselage. A typical wing tank is irregular, long and shallow [7]. The fuel is in direct contact with the outside skin. The Tu-154M has six fuel tanks: one central fuel tank (CWT) No 1, two inner wing tanks No 2, two outer wing tanks No 3 and one additional tank No 4. The Tu-154M fuel tank configuration is shown in Figs 16 and 17. The tanks No 3 are between spars 1 and 3 and ribs 14 and 45 of detachable parts of wings [12].

The CWT tank is generally categorized as hazardous due to the proximity to external heat sources, e.g., air conditioning units [7]. It requires tank inerting with the aid of nitrogen-enriched air from the on-board inert gas generating system. The tanks No 1 and 4 of the Tu-154M are inerted in the case of emergency landing without landing gears. The left and right wing tanks are usually categorized as nonhazardous as there is mostly no proximity of heat sources [7]. The wing leading edge slat section is equipped with anti-ice control system, typically with hot air ducts. These ducts take form of pipes with holes to allow air to heat the inner surface of leading edges. The hot air flow to the outer wing leading edges is controlled by the wing anti-ice valve [7]. The Tu-154M has electric anti-ice control system with heating elements embedded in slats.

The fuel system of the Tu-154M uses electric motor driven centrifugal pumps ECN-319, ECN-323 and ECN-325. Fuel pumps ECN-323 and ECN-325 are driven by 115/220-V AC induction motors (Fig. 18) and fuel pumps ECN-319 are driven by DC 27-V brush motors (Table 3). A flange mounted motor and pump constitute one integral unit (Fig. 19a). The feeding cables in fuel tanks are in aluminum tubes (Fig. 19b). Wiring system that delivers electric energy to fuel pump motors must be protected against electrical arcing and accumulation of static electricity that under some circumstances can cause ignition of the fuel-air mixture in the wing tank [6, 7, 9].

In general, there are two types of fuel pumps on typical aircraft [7]:

• Fuel transfer pumps (e.g., ECN-323, which perform the task of transferring fuel between the aircraft fuel tanks to ensure that the engine fuel feed requirement is satisfied;
• Fuel booster pumps (e.g., ECN-319, ECN-325) also called engine feed pumps, which are used to boost the fuel flow from the aircraft fuel system to the engine.

Fig. 16. Tu-154M fuel tank configuration: No 1 – center wing tank (CWT), i.e., collector tank, No 2 – inner left and right wing tank, No 3 – outer left and right wing tank, No 4 – additional tank [12].

Table 3. Fuel pumps of Tu-154M.

.

Commercial aircraft use open vent system to connect the ullage1 in each tank to the outside air [7].

Fig. 17. Tu-154M fuel system layout.

Fuel tanks, fuel pumps, fuel transfer lines, D30KU engine and APU have been shown. 1,2 – feed lines of upper transfer from tanks No 4 and 1 to tank No 2; 3 – faucet of reserve transfer; 4 – antifire faucet; 5 – discharge faucet, 6 – connector for maintenance of engines [12, 16].

Fig. 18. Layout of ECN-323 and ECN-325 fuel pumps.

1 – tank, 2 – outlet, 3 – axial wheel, 4 – collection snail, 5 – impeller, 6,7 – safety grid, 8 – connecting channel, 9 – electric motor, 10 – circulation orifice [12].

Fig. 19. Booster fuel pump ECN-325:

(a) cross section of fuel pump and induction motor; (b) feeding cable tubing. 1 – grid, 2 – induction motor, 3 – motor housing, 4 – shaft, 5 – tube, 6,7 – sealing rubber rings, 8 – pump housing, 9 – rotor, 10 – cover, 11 – snail, 12 – impeller, 13 – channel, 27 – conduit metal tube, 28 – tubing, 29 – terminal block, 30 – cover, 31 – electric cable. Construction of transfer fuel pump ECN-323 is similar [3, 9, 12].

The Tu-154M is equipped with the vent system. The Tu-154 uses fuel Jet A-1. Jet A-1 is a kerosene grade of fuel suitable for most aircraft turbine engines. It is produced to a stringent internationally agreed standard.


1Space between the fuel surface and upper wall of the tank.

Wing anti-ice system

Most civil aircraft use hot bleed air for anti-ice control of outer wing leading edges [7]. The Tu-154M must use electric resistive heating for anti-ice of the wing leading edge slats, as the turbofan engines are tail mounted and located far away from the wings. This would make the hot air bleed system very heavy and cumbersome.

The Tu-154M has three-phase, 115-V electrical wing anti-ice heating system (Fig. 20) [3, 9, 14]. To save electrical energy, heating elements are fed cyclically by adequate determination of time period. Under cyclic heating a thin layer of ice accumulates on slats which does not deteriorate aerodynamic properties of the aircraft. When the accumulation reaches a thickness threshold and the temperature of skin increases, the ice is taken out by the air stream.

Fig. 20. Leading edge wing anti-ice system: 1 – slat, 2 – outer skin/sheathing, 3, 5, 7 – thermal glass insulation, 4 – thermal “knife”, 6 – heating element, 8 – inner skin/sheathing [9, 14].

The generator GT40PCh6 No 2 driven by the mid turbofan engine (Fig. 5) feeds only the electric grid 2 dedicated to heating wing slats. The electric apparent power is 43.6kVA at 115V (phase voltage) and ≤ 130A.

Heating elements (composites) of one half of slats are divided into eight sections. The other half of slats has also eight sections. Section are fed in the following sequence:

1st, 2nd, . . . 8th, 1st, 2nd, . . . 8th . . . . Sections are numbered starting from the core part of the wing to the end of the wing. The current is on for 38.5 s and off for 269.5 s for each section.

In the leading part a thermal “knife” is installed along the slats. This part is made of 20-mm wide X20H80 NiCr foil. The thermal “knife” is not fed cyclically – it is steadily under current and is isolated from the outer skin by three layers of glass fiber 3 (Fig. 20). Also, the three layers 5 isolate the thermal “knife” from the heating element. On the inner skin/sheathing of heating element of the slat, thermal switches for cyclic operation of sections and thermal “knife” are installed. Thermal switches protect slats and heating elements against overheating.

Lighting

The lighting equipment of the Tu-154M is divided into external and internal equipment. External equipment is intended for taxiing, takeoff, landing, and indicate the plane in the air space at night. Interior equipment is used for illumination of the cockpit, passenger cabin and other chambers of aircraft, and emergency lighting. The external lighting equipment includes wing navigation (position) lights BANO-57 with 70-W SM-28-70 lamps, 115V SMI-2KM anti-collision flashing lights (45 flares/min), and 27V, 35.5A PRF-4 landing/taxi lights. The cockpit is equipped with a general illumination systems and lamps for lighting control boards, panel of flight engineer, top switchboard, middle console of pilots, aircraft panels, panels of automatic pressure control, workplace of navigator, etc. In addition, each crew member has lamps with a red cylindrical optical filter that allows the light to change from white to red.

General illumination of passenger cabins has been designed in form of central and side fixtures with fluorescent lamps. Each central fixture has two fluorescent lamps contained in the reflector and sealed with milky color plexiglas. Side lights are built-in into the lower panels of luggage bins. Individual passenger lamps equipped with lenses to focus the ligh beam are used at night after turning off the lights of the passenger compartment. Lamps are mounted in the bottom panel of luggage bins. Single-lamp fixtures are mounted in the toilets, hallways, kitchenette and above the mirrors.

Emergency lighting is provided to illuminate the passenger areas on the ground when the power is supplied from the on-board batteries. During flight, the emergency lighting of passenger cabins is turned on at night after turning off the general illumination. Emergency lighting is installed in passenger cabins, lobbies, dressing rooms and toilet passages.

Failures of electric power system

Failures of synchronous generators

The mean time between failures (MTBF) of GT40PCh6 synchronous generators is estimated as approximately 8000 to 8500 flight hours [2, 3, 13, 16].

Fig. 21. Tail part of Tu-154B-2 RA-85588 after fire at Surgut airport on January 1, 2011 [2].
Fig. 22. Closed electric circuit on assumption of abnormal scenario corresponding to 21st contactor TKS233DOD “switching generator No 3 on grid” [2].

There is known at least one case of main generator failure, i.e., the Tu-154B-2 RA-85588 while operating flight 7K 348 on January 1, 2011 from Surgut to Moscow (Domodedovo). The plane was taxiing to the runway while preparing for its takeoff from Surgut when the right engine caught fire on the taxiway (Fig. 21). Three out of 126 passengers and 8 crew members died.

Russia’s Interstate Aviation Committee (MAK) released their final report (in Russian) concluding the probable cause of the accident was the outbreak of fire in the right generator panel located between frames 62 and 64 in the cabin [2]. The generators were connected on the network after the engine start and exit to the idle mode. The cause of the fire was an electrical arcing produced by electrical currents exceeding 10 to 12 times the nominal current when two generators not synchronized with each other were brought online but got connected together instead of being connected to parallel busses (Fig. 22). The unsynchronized operation of the generators can be attributed to:

1. Poor technical conditions of contacts TKS233DOD (Fig. 22) responsible for connecting the generators with the electrical busses, that were damaged by prolonged operation without maintenance. A contact normally open was welded and fractured insulation material moved between contacts that are normally closed. These abnormal contact positions led to the connection between No 2 and No 3 generators (Fig. 22).

2. Differences in the schematic diagrams of generator No 2 and generators No 1 and 3. When the switch is moved from “check” to “enable” with no delay in the “neutral” position, the generator 2 is brought on line without time delay. This leads to increased wear of normally closed contacts in the TKS233DOD unit. The specific design of the electrical systems ensures power supply to each bus from either the APU or engine integrated drive generator.

Failures of other electrical equipment

On September 7, 2010, the Tu-154M RA-85684 Alrosa Mirny Air Enterprise Flight 514 aircraft from Udachny to Moscow suffered a complete electrical failure en route, leading to a loss of navigational systems. The electrically operated fuel transfer pumps were also affected and prevented transfer of fuel from the wing tanks to the engine supply tank in the fuselage.

After emergency decent below cloud level the crew were able to spot an abandoned air strip near town of Izhma (Fig. 23). The abandoned air strip is 1325 m, whereas the Tu- 154 requires a minimum of 2200 m. The aircraft landed at a speed of 350 to 380 km/h, faster than normal, due to the lack of flaps. Although the flaps are powered by hydraulics, the switches operating them are electrical. The impact was damped by the young trees, which have grown since the airport was closed. All nine crew members and 72 passengers evacuated using the aircraft’s evacuation slides. No injuries were reported.

Fig. 23. Emergency landing of Tu-154M RA- 85684 at abandoned air strip near town of Izhma on September 7, 2010. http: //www.airlinereporter.com/wpcontent/ uploads/2011/11/TU154a.jpg

On November 17, 1990, the cargo TU-154M, CCCP- 85664 of Aeroflot Airways was heading through Czech territory with a load of Winston cigarettes from Basel to Moscow. A switched-on cooker in the kitchenette caused a fire on board of the plane and the crew decided to land at the closest possible place. The crew made an attempt of emergency landing on the field near Dubenec village in the East Bohemia. There were only 6 crew members on board, all of them survived the air disaster.

On February 18, 1978, the Tu-154A, CCCP-85087 of Aeroflot Airways was standing on the apron at Tolmachevo Airport, Novosibirsk. The cabin heater was left working unattended between flights. A rag caught fire, which incinerated the cabin. A fire that broke out in the passenger cabin engulfed the rear part of the airframe. The forward fuselage burnt out. There were no fatalities.

Conclusions

The electric system of the Tu-154M aircraft is an outdated system typical for aircraft being designed in the 1960s. There are three GT40PCh6 wound-field synchronous generators driven by D-30KU low-bypass turbofan engines and one GT40PCh6 generator driven by the TA-6A APU turboshaft engine. The APU is also equipped with the 27V DC GS- 12TO starter generator. The Tu-154M is not equipped with a RAT.

Main synchronous generators GT40PCh6 are air cooled generators. Air cooling reduces the rated power and increases the mass of generators. Nowadays, modern VSCF wound-field synchronous generators are oil cooled with rated power up to 250kVA (Boeing 787 Dreamliner).

Reversed design and analysis of GT40PCh6 main synchronous generators deliver important information on steady-state and transient performance of these machines. Transient characteristics, especially short-circuit waveforms are very helpful in investigation of electric power system after malfunction, failure or crash.

BIBLIOGRAPHY

[1] Ellis G.: Air crash investigation of general aviation aircraft, Greybull, WY, USA, Capstan Publications, 1984.
[2] Final Report on results of investigation of aviation accident involving the Tu-154B-2, tail number RA-85588, airport Surgut, on January 1, 2011, in Russian, Interstate Aviation Committee (MAK), Moscow, 2011.
[3] Electrical equipment of aircraft Tu-154B(M), in Russian, Rilsk, Aviation College of Technology, 2000.
[4] Gieras JF.: Advancements in electric machines, London-Boston-Dordrecht, Springer, 2008.
[5] Hill R., Hughes W.J.: “A review of flammability hazard of Jet A fuel vapor in civil transport aircraft fuel tanks”, Report DOT/FAA/AR-98/26, US Dept of Transp., Springfield, VA, 1998.
[6] Kosvic T.C., Zung L.B., Gersten M.: “Analysis of fuel tank fire and explosion hazards”, Technical Report AFAPL-TR-71-7, Air Force Propulsion Laboratory, WPAFB, Ohio, 1971.
[7] Moir I., Seabridge A.: Aircraft systemes: mechanical, electrical and avionics subsystems integration, 3rd ed., Chichester, UK,J. Wiley & Sons, 2008.
[8] Ronkowski M., Michna, M., Kostro, G., Kutt, F.: Electrical machines around us, in Polish, Gdansk University of Technology, Gdansk, Poland, 2011.
[9] Soshin, V.M.: Aircraft Tu-154M, book 2, ed. Samara State Aerospace University, Samara, 2005.
[10] Timofieyev, J.M.: Electrical equipment of Tu-154M aircraft, Federal Air Transport Service of Russia, Academy of Civil Aviation, Sankt-Petersburg, 2000.
[11] Tu-154. Catalogue of parts and compilation of units. Chapter 27: Control, in Russian, Avia-Media, 1984, updated 2003.
[12] Tu-154M. User’s technical guidance, Chpt. 28. Fuel system.
[13] Tu-154B. User’s and technical service manual, Book 7, Part 1. Electric equipment, in Russian, Samara, Aviakor, 1994.
[14] Wing of Tu-154 aircraft, in Russian, Virtual cabinet of aircraft construction, [web page] http: //cnit.ssau.ru/virt{_}lab/krilo/index.htm [Accessed on Nov. 28, 2012].
[15] Wood R.H., SweginnisR.W.: Aircraft accident investigation, 2nd ed., Casper, WY, USA, Endeavor Books, 2006.
[16] Znichenko V.I: Construction and user manual of Tu-154M aircraft, Federal Air Transport Service of Russia, NLMK, Academy of Civil Aviation, Sankt Petersburg. 1998.


Authors: Prof. Jacek F. Gieras, Ph.D., D.Sc., IEEE Fellow, Department of Electrical Engineering, Electrical Machines and Drives, University of Technology and Life Sciences, Al. S. Kaliskiego 7, 85-796 Bydgoszcz, Poland, email: jacek.gieras@utp.edu.pl


Source & Publisher Item Identifier: PRZEGLA˛D ELEKTROTECHNICZNY, ISSN 0033-2097, R. 89 NR 2a/2013