Published by Jim Galloway, International Association of Electrical Inspectors (IAEI) Magazine, Electrical Fundamentals – The Dangers of Stray Current Damage in Electrical Systems & Arc Flash Protection, July 3, 2019
The new extension to the factory is finally finished. The engineers have produced a state-of-the-art design; the qualified electricians have completed a professional installation with quality hardware; and the thorough electrical inspections verifying that everything is up to Code are complete. Now that the power is on, the machinery installation crews are busy getting everything ready for production.
But suddenly there is trouble in the plant. Hundreds of amperes are flowing in an uncontrolled fashion, surging through metallic conduit and panels, melting EMT connectors, arcing the bonding wires in a 3-phase receptacle, and burning through the insulation of the power cord to the brand new, million-dollar machine from Europe. If it continues, soon a live phase conductor will be in contact with a red-hot grounding wire, and an unsuspecting worker could be seriously hurt or even killed when they investigate the problem.
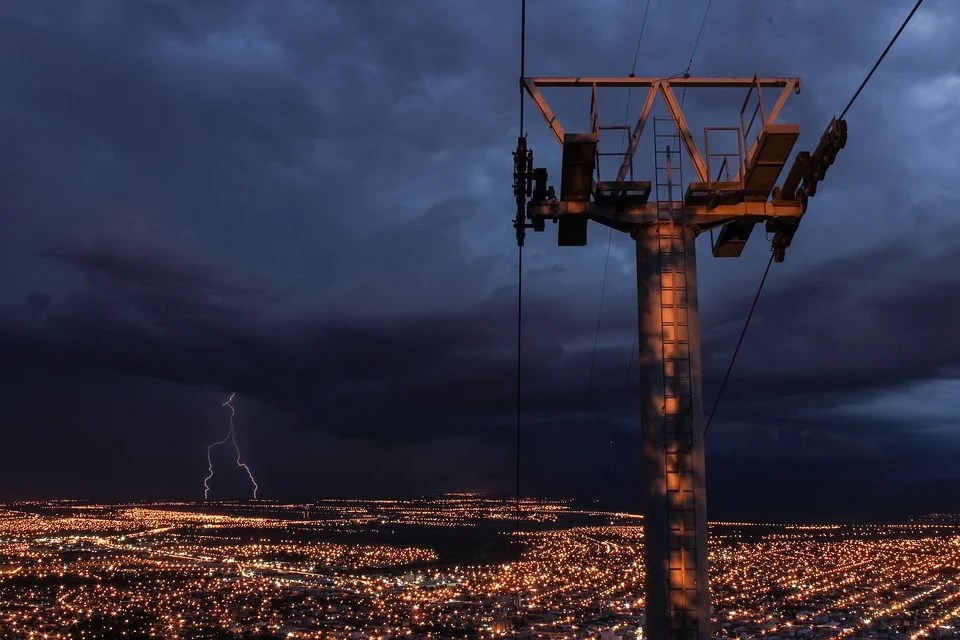
What is going on? Did a something come loose? Could it be a lightning strike? Is the foreign-made machine incompatible with our electrical network? Is the damage being caused by 1st, 3rd, 5th, 7th, or 9th level harmonics? Why hasn’t the over-current protection system reacted and tripped a breaker? There’s a very good chance that the problem has something to do with the common arc welding process being used to attach mechanical hardware as part of the new machine installation. But how?
Stray welding current
A stray current is a flow of electric current through unintended conductors such as building structures, electrical grounding or bonding conductors, or other equipment due to electrical supply system imbalances or improper equipment hookup. Often in industrial or construction environments, this trouble occurs due to a very simple error in setup by a welder. In Ontario, Canada, there has recently been a well-documented case of an electrical explosion and at least one fatal electrocution due to damage in a facility’s electrical system where the root cause was identified as stray welding current (SWC).1-3
Arc welding machines are designed to provide alternating or direct current on the order of hundreds of amperes for industrial, commercial, and residential or hobbyist applications. These specialized power sources are designed to provide a low-resistance electrical circuit (typically less than 0.25 Ohms) on the secondary (or output) side; from an electrical engineer’s perspective, this is essentially a short-circuit condition.
This secondary welding circuit is intended to be completed as an isolated, closed-loop system with two cables (see Image 1). It consists of the following parts:
Electrode lead — is the secondary circuit conductor transmitting energy from the power source to the electrode holder, gun, or torch.
Workpiece lead — is the secondary circuit conductor that is attached to the workpiece by the return current clamp and completes the welding circuit (these devices are commonly and incorrectly referred to as the ground cable and the ground clamp).

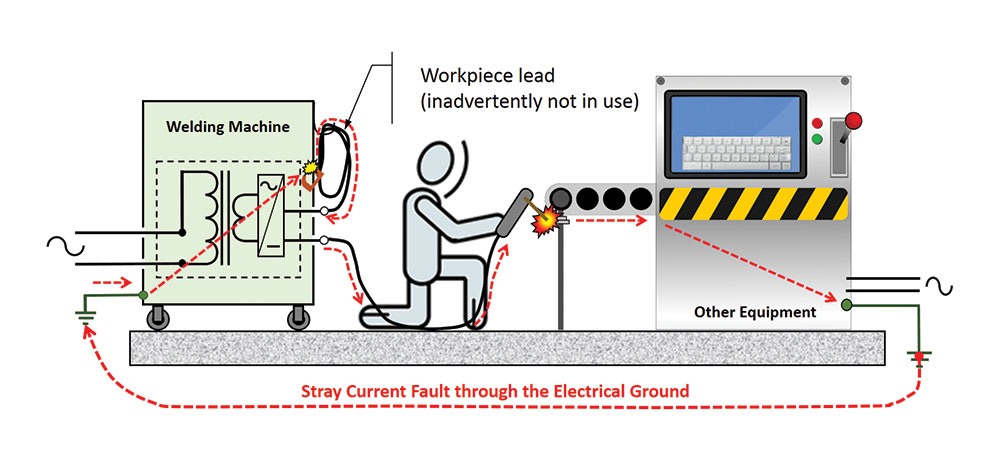
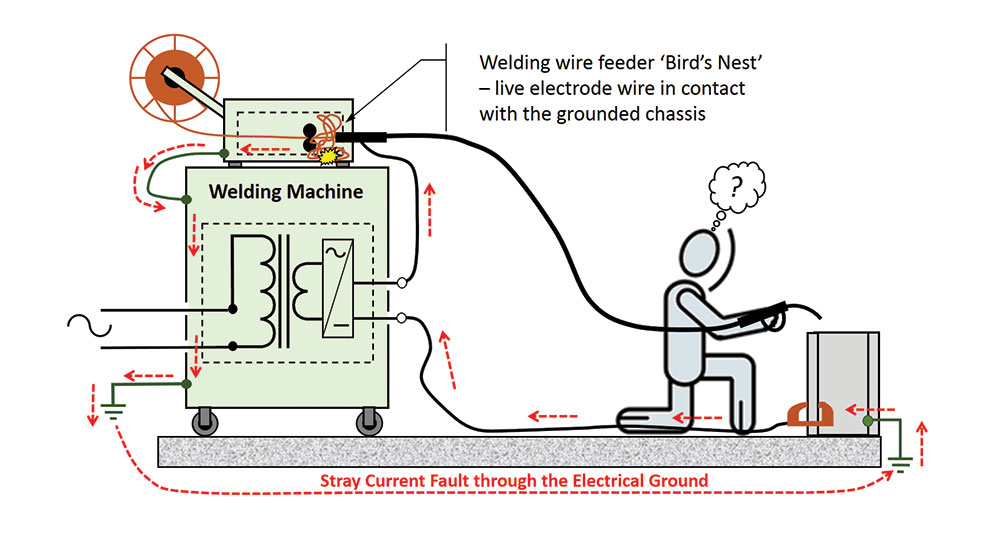
The SWC faults can occur with simple setup errors or minor system faults, which can introduce current on the order of hundreds of amperes into building structures, electrical networks, and machinery. Two common examples of SWC are illustrated in Images 2 and 3. However, there are many other possibilities as the welding current will always find the path of least resistance to its source. Often, the SWC fault involves other machinery such as fabricating equipment, power tools, other welding machines, and cranes or hoists. These SWC faults can also originate from portable engine-driven or battery-powered welding equipment that do not even derive power from the grid, and they can damage equipment even when powered off.
Surprisingly, there is currently no foolproof system available to stop these damaging stray current faults. They are not interrupted by the overcurrent protection devices installed even in modern electrical networks, and they are not detected or interrupted in circuits protected by ground-fault circuit interrupter (GFCI) devices. The focus has always been on measuring current flow in the intended conductors, and the assumption is that the grounding or bonding conductors would never see current levels that exceed the level where the overcurrent protection devices would trip.
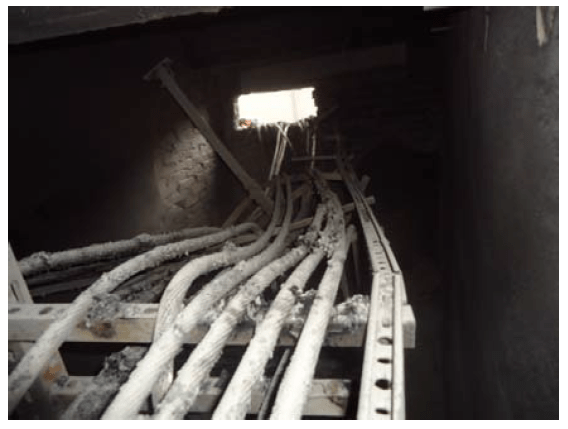
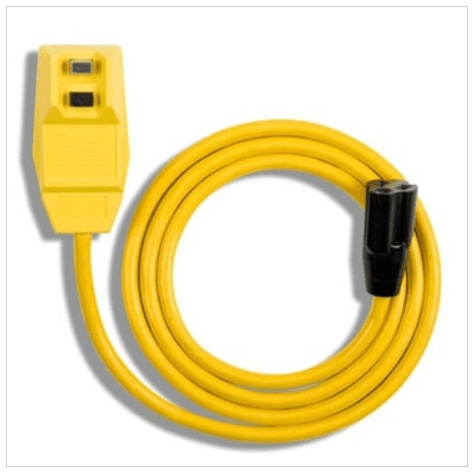
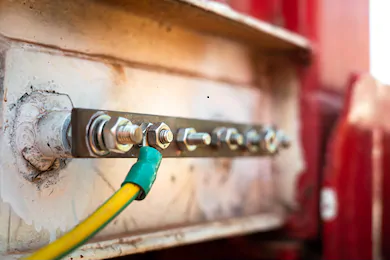
The scenario described in the introduction should not be happening. However, it is far too common of an occurrence in any facility where welding has been performed to be ignored. An example of the sort of damage that can occur is shown in Image 4. Beyond the electrical systems damage, SWC can cause arcing and fires in unexpected locations in a facility, overheating of lifting chains or slings (leading to arcing or annealing), damage to machinery bearings, and arc strikes leading to undesirable metallurgical transformations in certain alloys. Cases of accelerated corrosion caused by stray direct current electrolysis is also a concern on marine structures and buried metallic infrastructure. Stray current damage, therefore, can also be considered a problem from an economic standpoint since much of the damage may be initially hidden from view—even before it becomes an immediate safety issue. Tens of thousands of dollars of damage can occur in a facility or to machinery and systems from one SWC event, which may not even be immediately detected.

What can be done?
Stray currents from welding operations can be avoided through the strict adherence to rules of the applicable welding safety standards (e.g., ANSI Z49.1:2012 or CSA W117.2-19). These practices—also spelled out in equipment manuals—include locating the workpiece lead return attachment point as close as practicable to the arc, using well-maintained welding cables of sufficient ampacity, and ensuring that the work return current clamp is firmly attached on an intentionally cleaned spot (free of mill-scale, paint, etc.)4 All professional welders should be following these rules; however, it must be noted that anyone can buy a welding machine capable of producing hundreds of amperes and misapply it.
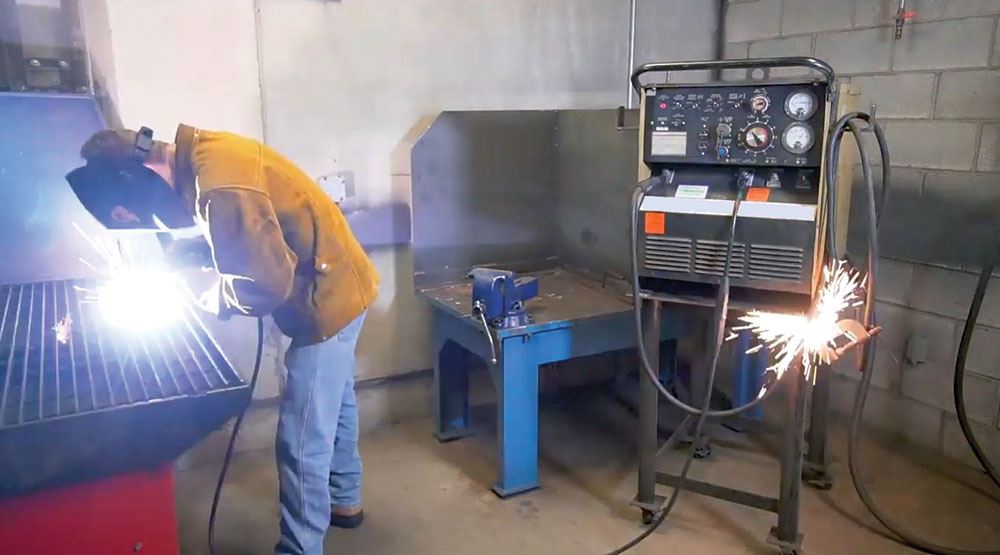
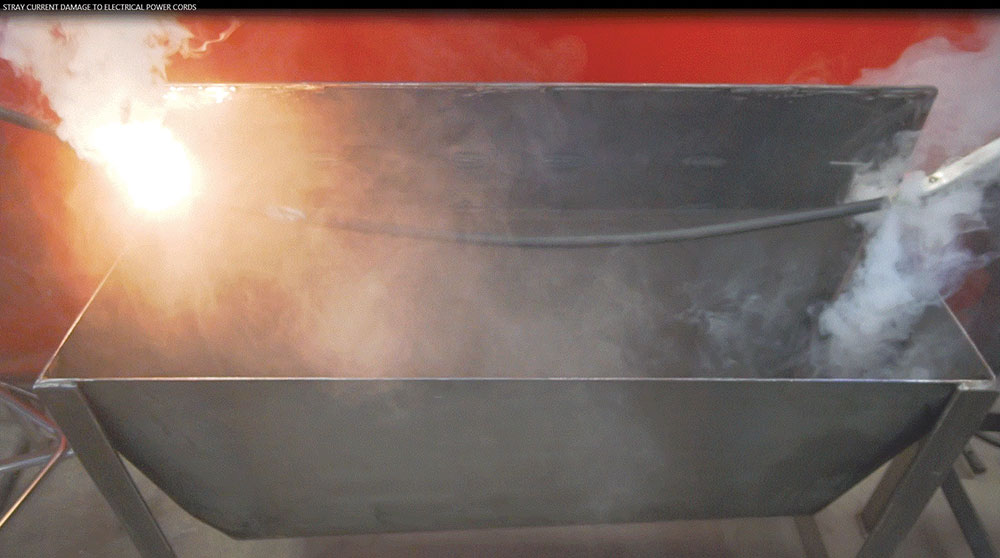
Conestoga College in Cambridge, Ontario, recently produced educational videos to explain the SWC problem; to show just how easy it is to inadvertently create these damaging fault conditions; and to demonstrate the serious damage that can occur in a machine’s power cord. These videos are now publicly available on the college’s YouTube channel. (See screenshots in Images 5 and 6). The goal of the project is to better inform welding educators, welders, and the welding industry, in general, of the SWC hazard. The electrical engineering and inspection community also needs to be more aware of the SWC problem, what to look for, and how it happens.
This work was sponsored by EnerDynamic Systems Inc. (ESI) of Brantford, Ontario. ESI partnered with Conestoga College to assist them in extending a patent-pending design for a stray current interrupter device from renewable energy systems into arc welding applications. The partnership had the goal of developing an engineering control device that can make the damage from SWC a thing of the past.
References
1. D. Hisey, “Stray Current Goes to College,” Canadian Welding Association Journal, vol. 14, pp. 20-25, 2016.
2. Office of the Chief Coroner of Ontario, DOKIS, Kelly (Inquest), Kitchener, Ontario, Canada: Queen’s Printer for Ontario, June 16th–19th, 2003.
3. D. Hisey, “How to Prevent Stray Welding Current Damage in Your Electrical System,” 17 November 2017. [Online]. Available: https://www.ecmweb.com/shock-electrocution/how-prevent-stray-welding-current-damage-your-electrical-system. [Accessed 27 December 2018].
4. Canadian Standards Association, CAN/CSA-W117.2-19 – Safety in Welding, Cutting, and Allied Processes, Toronto: Canadian Standards Association, 2019.
5. Conestoga College & Enerdynamic Systems Inc., “The Problem of Stray Welding Current,” 24 January 2019. [Online]. Available: https://www.youtube.com/watch?v=80ehl2nDXUk. [Accessed 24 January 2019]
6. Conestoga College & Enerdynamic Systems Inc., “Stray Welding Current Damage to Power Cords,” 24 January 2019. [Online]. Available: https://www.youtube.com/watch?v=kIVH5V9ntrY. [Accessed 24 January 2019]