Published by Dalibor VALEK, Radomir SCUREK,
Technical University of Ostrava, Faculty of Safety Engineering
Abstract: This article describes the method used to graph theory in security analysis. For the pursposes of this study, an environment is referred to here as a network of power lines and devices and a power grid is considered as a system of vertices which combine to make a network. Exploration of Fiedler´s theory will be applied herein to select the most important power lines for the entire network. Components related to these lines are logicly ordered and considered by the author´s modified analysis. This method has been improved and optimalized for risks related with illegal acts. Each power grid component has been connected with a variety of possible attacks and this device was gradually evaluated by five coefficients which takes values from 1 to 10. the level of risk was also assessed on the coefficient basis. In the last phase the most risky electricity network devices have been selected. Security measures have been proposed on the selected devices.
Streszczenie. W artykule opisano wykorzystanie teori grafów w analizie zabezpieczeń. Opracowano model sieciowy z wykorzystaniem teorii Fiedlera. Każdy z elementów sieci połaczono z różnymi formami ataku i opisano odpowiednimi wspolczynnikami. Na tej podstawie wybrano najbardziej ryzykowny wariant. Metoda wyboru najważniejszych linii w sieciach rozdzielczych i przesyłowych.
Key words: Security, matrix, power grid, graph partitioning, analysis.
Słowa kluczowe: bezpiecześtwo, sieci rozdzielcze i przesyłowe, teoria grafów
Introduction
Significant diversification of technical infrastructure from telegraph to internet has been realized within the last fifty years. From a wide point of view, the electric network, traffic network and communications network makeup the foundation of all prosperous companies. Usually these networks are based on a large amount of heterogeneous components characterized by complex dependencies and relationships between them. To ensure the structural integrity, effectivity and overall reliability of the network, illegal acts, security and terrorist protection must be considered.
There has been extreme growth in the consumption of electricity within last two decades. It was caused mainly by the social-economic changes in eastern Europe. Directly proportional to energy consumption has been the rise in newly-built and expanded nuclear power plants and power plants producing electricity from renewable sources.
After the disaster at Fukushima nuclear power plant, discussions started in Europe about the safety of nuclear power plants and the consequences of radioactive substance leaks. In the event of a radioactive leak, for instance, in Europe; there would be reduced production of electricity from nuclear power plants and significant reduction in annual electric energy production. There would, as well, be a very serious impact to energy security. This shortfall would be covered mainly by electricity produced from renewable energy sources and fossil fuel plants. If there would be a massive production of electricity from renewable energy sources, there would be many more opportunities to one-off the impacts to the transmission system.
These hard predictable impacts are caused mainly by renewable sources, mainly caused by wind power plants. Wind power plants work on the opposite principle than conventional power plants because they supply electricity only in case of wind blowing.
During these large fluctuations of electricity transfer, the important thing is to have the robust electricity system, such as electrical wiring, transformers or power plants, be resistant to component damage and to ensure these components are secured against the attacks of different crime or terrorist organizations. These attacks could cause blackout which could mean very severe consequences to human life and country‘s economy. Therefore it will be increasingly important to deal with security measures on devices across our electricity system. With selection of the most important components helps the graph theory which is described in this article.
Power grid
All devices that provide electricity from the production to the final customer are components where failure can result in a threat of the electricity supply to the final consumer. Among the main devices in electricity system is the electrical grid, electrical stations and electrical wiring.
Devices which are considered in the analysis are parts of the electrical grid and the power plants. The Electrical grid is the system of interconnected devices which is used for electricity transmission, transformation, and distribution. Further devices are used for metering, controlling while other devices are used for passive or active protection.
The transmission system is a system of devices which is used to transmit electrical energy with a voltage of 400 kV and 220 kV (depends on the country) from the manufacturers to the power nodes. The Distribution system transmits electrical energy with a voltage of 110 kV and 22 kV (depends on the country) from the transmission system to the customers. Customers in this context are the cities, the factories and the households.
Voltage is transmitted by the different types of wiring. Usage of a specific wiring type which depends on many factors such as quantity of the transmitted voltage, quantity of the transmitted electric current, voltage drop and so on. Wiring is most often outdoors but can also be cabled on the ground or under the ground, the latter option being the more expensive solution. Outdoor wiring has to be resistant to weather changes, extreme weather conditions, humidity and it must have sufficient mechanical solidity to the intention damage. Cable wiring is used in residential areas, industrial areas and in commercial buildings.
Outdoor wiring is carried by electrical pylons. Construction of electrical pylons can be made of wood, reinforced concrete, steel or aluminum alloy. Many types of electrical pylons exist and the difference is mainly it their design or construction.
Electrical pylons are designed from the construction point of view to resist extreme weather conditions and wind power. Instead of main cantilevered pylons, the grid consists of reinforced pylons to ensure stability in case wires break. Without this reinforcement, the main cantilevered pylons would not stay in the right position. These reinforcement pylons are made of special steel which can resists the climatic exposure [1].
Electrical stations [1] belong to electrical grid and are divided into transformations, switch stations and substations. Most of these devices are created by the substations which can be a single building or a bounded area. These substations take care of the input and output electricity flow and they are consisted of conductors, insulators and switch, safety or control devices [4]. In the buildings are mainly situated substations with voltage up to 35 kV and in the outdoor areas are situated substations with very high voltage over 52 kV.
Utilization of graph theory
Electrical wiring, telecommunication, transport infrastructure or others engineering network form system of nodes which make together graphs of different shapes with many degrees of complexity. Many networks are designed on the basis of landscape relief.
Graph characteristics
By the graphs we can represent a set of objects which we illustrate the interdependence of the various elements. Objects are assigned as vertices (power plants, transformers etc.) and their connections are called edges (transmission network, distribution network). Graph can be basically represented by simple model of a real network which emphasizes topological properties of objects and neglects their geometric properties. Graphs can be divided as a directed and undirected. Undirected graph is defined as G = (V,E) where V indicates vertices and E indicates edges. In case of undirected graph we do not consider the order of vertices which is used in case electrical network analysis [5].
Graph theory
Given a connected graph G it is possible possible to divide it into two smaller graphs having roughly the same number of edges and vertices and one shared edge. There are many methods to achieve this. One is the Spectral graph Partitioning. This method involves the usage of Laplacian matrix and divide vertices of a connected graph G into two subgraphs by usage of Laplacian matrix eigenvectors [3].
Adjacency matrix
Graph can be represented by the adjacency matrix. It is defined as G, A(G) = (ai,j)
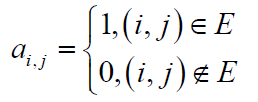
This means that the adjacency matrix A represented by the graph G has for i-th row and j-th column value equal to 1 in case there is an edge between node i and j. Otherwise there is assigned value 0 for this position.
Degree matrix
Other matrix defined by graph G is degree matrix D(G) = (di,j)
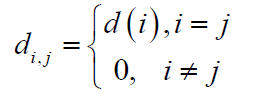
Degree matrix is a diagonal matrix, which provides us information about degrees of each vertex – number of edges entering or exiting from concrete vertex. This matrix is used together with the adjacency matrix to create a Laplacian matrix.
Laplacian matrix
Laplacian matrix is another way how to represent graph.
Matrix L(G) defined by graph G: L(G) = D(G) – A(G)
Laplacian matrix is difference between the degree matrix and adjacency matrix.
Spectral graph partitioning
Spectral graph partitioning is based on simple principle. For the graph G defined by vertices and edges G = (V,E) which has to be dividend is calculated Laplacian matrix L(G). By the spectral partitioning of Laplacian matrix are calculated eigenvalues and eigenvectors. Such an eigenvector which is related with the second smallest eigenvalue provides us required graph partitioning. This vector is named as a Fiedler´s vector.
Algorithm for finding the most important electrical wirings
Input parameter of the algorithm to calculate the most important electrical wirings is adjacency matrix. Values of single rows and columns of the adjacency matrix are the inputs given by user according to the power lines map. These values are loaded into Excel and then exported to computer program.
Computer program then calculate from adjacency matrix the degree matrix and Laplacian matrix followed by spectral graph partitioning and finding the required Fiedler´s vector. Distribution of final graph is determined by the sign related to Fiedler´s vector. Vertices with positive numbers are assigned to first part of graph and vertices with negative numbers are assigned to second part of graph. As a most important power line is then selected line which connects both parts of graph.
Example of spectral graph partitioning
To illustrate the above theory, a very simple example of spectral graph partitioning is shown.
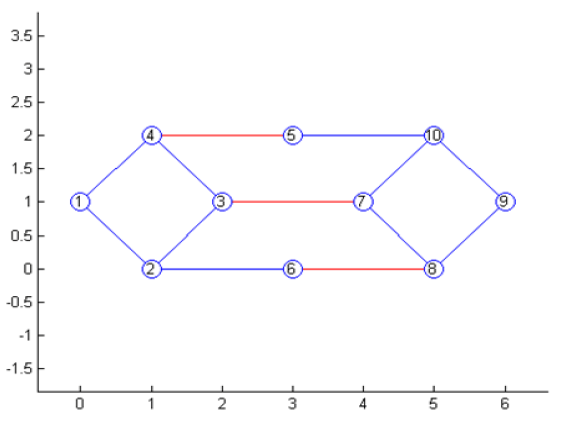
Given a simple network of ten vertices and eleven edges. To the single vertices are assigned coordinates to display them in program according to its potential deployment in the territory.
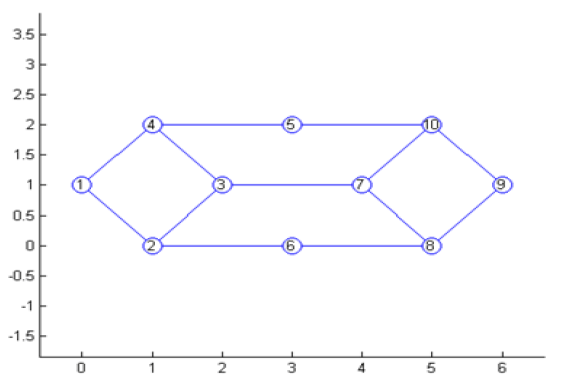
According to picture 1 is designed adjacency matrix where single rows and columns are valued on the basis of existence the edges between single vertices.
From adjacency matrix, we can get according to defined equation the Laplacian matrix and Fiedler´s vector related to the second smallest eigenvalue.
Table 1. Adjacency matrix
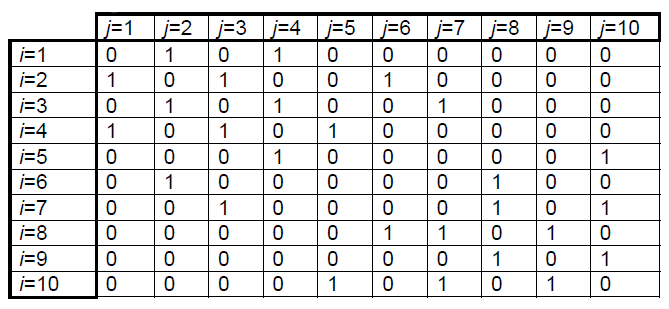
Table 2. Laplacian matrix and related Fiedler´s vector
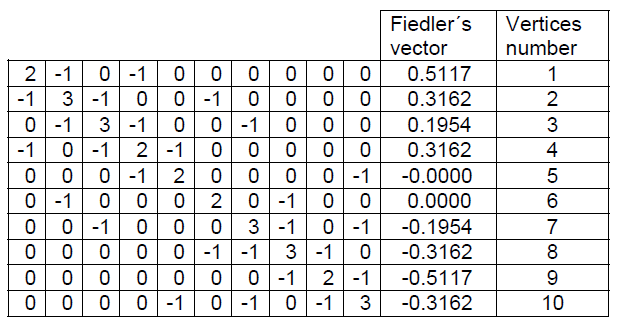
Fiedler´s vector divides the network into two approximately equal parts. Positive values of vertices are part of the first portion and negative values of vertices are part of the second portion. Red marked edges displayed on the picture number 2 represent the smallest amount of edges between both network parts. If we bring this situation into the electrical grid environment so we talk about electrical lines in which its failure mean blackout on the largest possible area.
Graph theory and its spectral graph partitioning is able to select the most important power lines. Then we can use conventional risk analysis only on the selected components of transmission and distribution network.
Analysis of attack on the electricity system
For consideration of vulnerability of single objects in the electricity system can be used modified method FMEA. This method was modified by the author to be more suitable for consideration of illegal acts. Further in the article, represented analysis named by shortcut FMEAIA (Failure Model and Effect Analysis of Illegal Acts) will be explored.
Classic FMEA method [2] is most commonly used in automotive industry to search and evaluation of potential defects in processes and products. This analysis stands on the subjective evaluation of its author. It means that analysis is highly dependent on the author’s experiences. Level of risk is determined by the multiplying of subjectively evaluated coefficients which are Occurrence, “O“, Severity, “S“, Detection, “D” and in additional in FMEAIA analysis is Appeal, “A” and Accessibility, “AA“.
Level of risk is calculated according to formula:
R = (O · S · D · A) / AA
Values of each coefficient may vary from 1 to 10 according to table 3.
In the evaluation process of the electricity system we should start with the selection of the most important places given from Spectral graph partitioning method described above. Selected devices placed on calculated territory should be considered in the analysis according to above described method of FMEAIA.
Example of analysis procedure according to FMEAIA method can be used as follows:
1. Distribution of system into the devices in terms of production and in term of the electricity wiring.
2. Distribution of devices into the buildings, pylons, wiring and further devices which are fixed with the ground (for example wind power plants, photovoltaic power plant etc.).
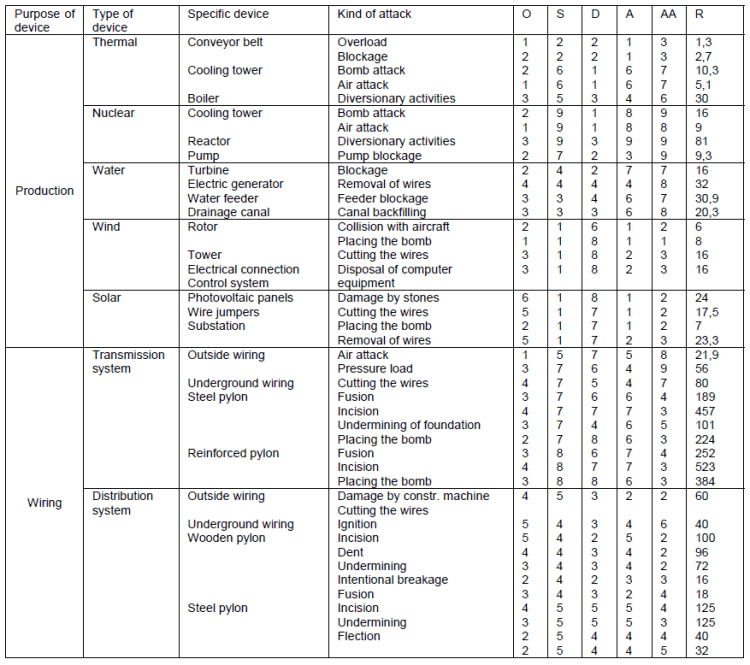
3. Distribution into the further smaller technical devices. Example of evaluation of several selected devices is shown in the table 4.
There are many types of attacks which could be considered but for purpose of this this article were used only few attacks to better illustration of FMEAIA method. On the basis of above analysis was found out that the highest value of risk has following attacks:
1. Incision of reinforced and steel pylon in transmission system.
2. Placing the bomb on the reinforced and steel pylon in terms of transmission system.
3. Pylon fusion by the welding machine.
Proposal of security measures
The procedure of risk evaluation is followed by the phase of security measures proposed on the highest risk evaluated devices. Security measures should be effective, economical and easily feasible. In general the principle ALARA should be considered in this case because this principle takes into account value of protected object and value of devices which protect this object.
For the minimalization of risk represented by the incision and fusion of reinforced and steel pylon in transmission system it is possible to apply measures which physically prevent contact with single pylon or make activity of attacker more uncomfortable and time prolonged. Among the suitable security measures we can classify:
• Usage of hardened steel for lower part of pylon construction.
• Concreting of pylon foundations up to height 2 meters above the ground level.
• The definition of perimeter around the pylon by the fence or barbed wire.
Proposed security measures are suitable to be realized mainly in terms of reinforced pylons which are included in grid of cantilevered pylons. Distance between cantilevered pylons of Donau type can be in suitable terrain 500 meters. For the type of attack with bomb usage can be applied similar security measures like in case of the incision and fusion the pylon but in case of bomb attack it depends on the level of energy which will be released within the explosion.
Table 3. Classification of each coefficient
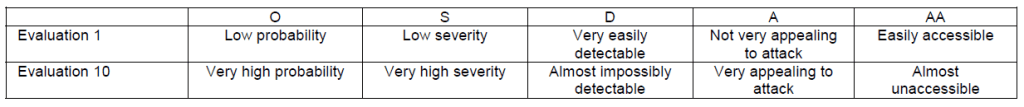
Table 4.
Conclusions
This article describes components which are included in the electricity system and components used for the transmission and distribution of electric energy which is connected to the network. This network can be understood as vertices connected together with edges. In this case was used the graph spectral partitioning method to select the most important power lines. After this selection we are able to consider components included in calculated territory with conventional risk analysis. Applied risk analysis was modified by author from FMEA analysis to have more suitable analysis for the illegal acts. Two new coefficients were applied to this modified analysis – appeal and accessibility. Due to this modification this FMEAIA analysis is more suitable for illegal acts consideration. The result from the analysis is that the most risky devices in terms of illegal acts are mainly devices for transmission of electric energy which have much better accessibility then the devices for electricity production. Due to this conclusion, it is necessary to select the most important devices in specific terrain. Security measures to reduce the risk of attack to an acceptable level must be applied to these devices.
REFERENCES
[1] Internet encyclopedia of energy. Elektrizační soustavy [online].[cit. 2014-03-20]. Available from WWW
[2] Internet source Process Quality Management. FMEA – Failure Mode and Effect Analysis [online]. [cit.2014-03-20]. Available from WWW <URL: http://www.pqm.cz/NVCSS/fmeacs.html>
[3] SLININGER, B.: Fiedler´s Theory of Spectral Graph Partitioning, University of California, March 2013. Available from pdf format on WWW <URL:http://www.cs.ucdavis.edu/~bai/ECS231/returnsfinal/Slininger.pdf>
[5] OCHODKOVÁ, E.: Graph algorithms, Technical university of Ostrava, faculty of electrotechnics and informatics, Ostrava,
Authors: Dalibor VALEK, Radomir SCUREK , Technical university of Ostrava, Faculty of safety engineering, Lumírova 13/630, Ostrava – Výškovice, 70030 , dalikk@email.cz, radomir.scurek@vsb.cz
Source & Publisher Item Identifier: PRZEGLĄD ELEKTROTECHNICZNY, ISSN 0033-2097, R. 90 NR 11/2014. doi:10.12915/pe.2014.11.41
