Published by Chokkuea W1, Pattanasethanon S2, Suwapaet N3 and Saengprajak A4, Mahasarakham University
Abstract. Availability of solar energy is crucial for most technological solar applications. The objective of this study is to predict monthly average and global solar radiation patterns on Maha Sarakham horizontal surface of Thailand. Two correlation equations have been successfully developed, one from Angstrom model and the other from Liu-Jordan model, with the minimum and maximum clearness index 0.45 and 0.65 for the equation derived from Angstrom model and 0.30 and 0.95 for the equation derived from Liu-Jordan model. Data of sunshine hours as well as global and diffuse solar radiation was collected at the location and was predicted using equations developed from corresponding models. After validation procedure was conducted, the empirical data was then compared to predicted data. It can be concluded that the developed equations can be used to estimate the diffuse and global solar radiation and also indicate the solar energy availability at Maha Sarakham of Thailand with satisfactory level. This obtained knowledge and information can be applied to other locations with the same geographical conditions as well as used in further researches.
Streszczenie. Celem artykułu jest prognozowanie przeciętnych miesięcznych i globalnych możliwości systemu solarnego w Tajlandii w miejscowości Maha Sarakham. Opracowano równania korelacyjne bazujące na modelach Angstroma i Liu-Jordana z indeksem przejrzystości powietrza 0.45 – 0.65 (Angstrom) i 0.30 – 0.95 (Liu-Jordan). Otrzymane równania pozwalają na prognozowanie wydajno sci systemów słonecznych także w innych geograficznych warunkach. Analiza i prognozowanie możliwości systemu solarnego w Maha Sarakham w Tajlandii
Keywords: Solar radiation, Correlation equations, Sunshine hours.
Słowa kluczowe: systemy solarne, równanie korelacyjne, prognozowanie.
1. Introduction
Solar energy is a major world’s renewable energy resource. It is considered as a vital energy for not the other living things on Earth, but also human. From prehistoric time, ancient people have discovered how to utilize sunlight and its heat to improve their daily life activities. To date, emerging of various innovative solar energy technologies (e.g. photovoltaic electrification system, solar thermal process for heating and cooling systems, solar lighting) promotes the solar energy utilization widely spread to any parts of the world. Moreover, these technologies have been proved that they can also serve environmental protection purposes as preventing the environment from many critical problems concerning the fossil fuel utilization. Availability of solar energy depends on circumstance factors which are different according to geographical variations and time periods. Thus, these factors need to be carefully considered in solar energy system designs and installations.
Solar irradiation is a fundamental parameter in solar energy availability and needed in solar energy system design. Like any other circumstance factors, the solar irradiation associates with geographical variations and time periods (day and night times, seasons, and local climates). Specific solar irradiation patterns (local manner) must be exactly known by world’s designers and manufacturers before crating the best solar equipments which meet the market demands. Understanding the global solar radiation patterns or distributions requires a collection of radiation data from various countries [1]. Direct measurement, using pyranometer and data loggers, is the best way to collect the desire data which the relationship between the solar radiation and sunshine hours can be pointed out by proper statistical procedures to obtain the average solar radiation pattern throughout the global ground surface. In general, raw data should be transformed to be non-dimensional data before use to estimate the solar radiation pattern since it usually gives higher correlation than the previous one.
The solar radiation which passes through the atmosphere and reaches the ground surface is known to be diminished by scattering, reflection, and absorption along its way due to gaseous molecules, aerosols, water vapor, ozone and clouds. During its way to the earth surface, a majority of sunlight energy reduction is from the reflection by clouds [2, 3].
A number of correlation equations involving global solar radiation and sunshine hours in different locations have been proposed by various workers. Among these, Angstrom model is the most popular principal which is derived by worldwide researchers. Hirunlabh J. et al. (1994), for example, developed a correlation with solar radiation using sunshine hours for; Bangkok (monthly during 1982-1992) with the regression coefficients a = 0.3224 and b = 0.3697, Chiang Mai (monthly during 1982- 1988) with the regression coefficients a = 0.3302 and b = 0.4087, Hat Yai (monthly during 1981-1987) with the regression coefficients a = 0.2978 and b = 0.3826, and Ubon Ratchathani (monthly during 1982-1988) with the regression coefficients a = 0.3009 and b = 0.4076 [4].
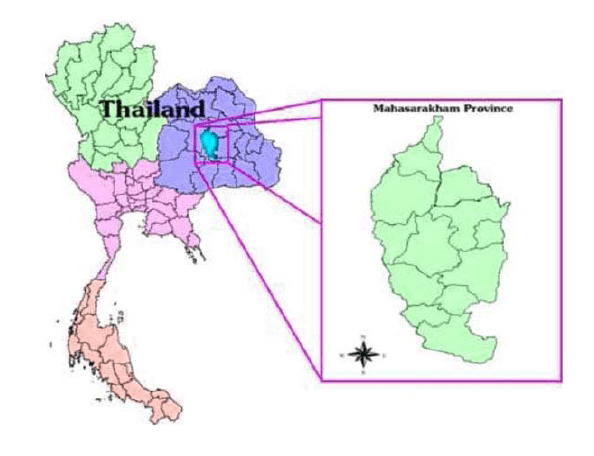
Located in the center of the region as shown in Figures 1, Maha Sarakham is considered as a good representative of 19 Northeast Thailand provinces. Thus, it is feasible that the availability of solar energy studied here can be surely used with other northeastern Thailand provinces for future researches.
2. Methodology
2.1 Station and daylight availability
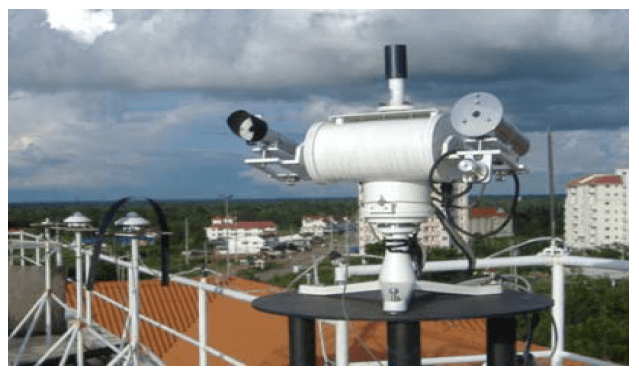
The daily solar radiation data during sunshine hours were collected from a daylight measuring station on a flat roof of five-story building at Faculty of Engineering, Mahasarakham University (MSU), Mahasarakham province, Thailand (latitude 16o14’N, longtitude 103o15’E) as shown in Figure 2. This meteological station is classified as a general station in accordance with International Daylight Measurement Program (IDMP) of the Commission International de l’ Eclairage (CIE). It is located near the center of northeastern Thailand (latigude 16o11’N, longtitude 103o04’E) [6]. Data collecting period in this study covers last five year duration (2005-2009).
2.2 Horizontal solar radiation modeling
2.2.1 Data analysis
Several types of proposed relationships that can be used to predict by monthly mean daily global solar radiation, as a function of readily measured climatic data [7, 8]. Among the existing relationships, the simplest one is Angstrom-Prescott regression equation which combines the monthly mean daily global solar radiation to the number of light time hours. In addition, this equation can also predict the global solar radiation in several other location types with greater extent [9]. The equation is of the form:

where H̅ is the measured monthly mean daily global solar radiation on a horizontal surface, n̅ is the monthly mean daily bright sunshine hours, N̅ is the maximum possible daily sunshine hours or day length, n̅/N̅ is the fraction of sunshine hours, H̅0 is the monthly mean extraterrestrial solar radiation on horizontal surface, given by Igbal (1983) [7] as follows:
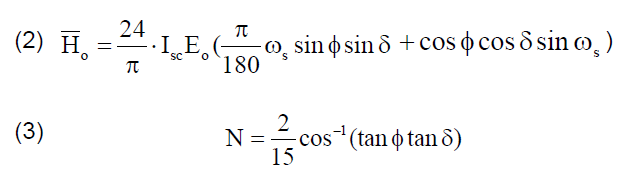
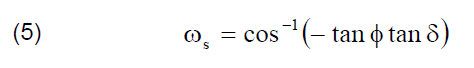
where Isc is the solar constant, Eo is the eccentricity correction factor, ϕ is the latitude, δ is the solar angle of declination and can be approximately given by:
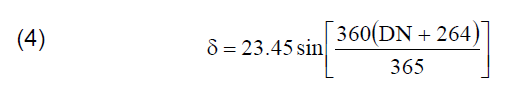
where DN is defined as the number of day elapsed in given year up to a particular data collecting period [10]. ωs is the sunset hour angle given by:
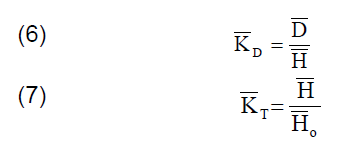
The relationship between monthly-average values of diffuse and global irradiation was first developed by Liu and Jordan (1960) using regression method form which D̅/H̅ as a function of K̅T, where D̅ is monthly average daily diffuse radiation pattern on horizontal [11], K̅D is diffuse ratio and K̅T is clearness index.
2.2.2 Mathematical analysis
Two most widely used statistical indicators in dealing with evaluation of solar radiation estimating models are root-mean-square-deviation (RMSDS) and mean bias deviation (MBD) [12-15] which are orderly defined as:
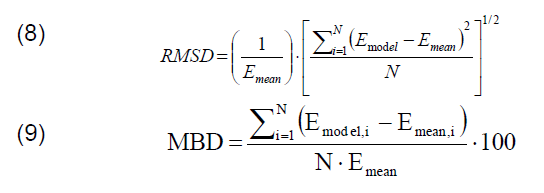
where Emean is the mean of dependent variable testing data, Emodel is the predicted dependent variable from the same independent variable set as mentioned above (obtained from the model), Emeas is the measured value of dependent variable corresponding to particular independent variable set and N is the number of data records in the testing set. In order to gain more accuracy and precision, some statistical indicators also need to be defined as follow:
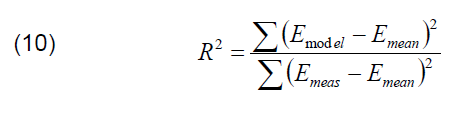
where R2 is the determination coefficient
Prepared monthly average daily bright sunshine hours, clearness index and diffuse ration data to figure out the correlation are shown in and Figure 3, Figure 4 and table 1.
a) data of monthly average, b) data of daily
Figure 3 shows the relationship between clearness index and sunshine fraction. In figure 3(a), the obtained correlation properly fit to the monthly average daily data. The correlation is:
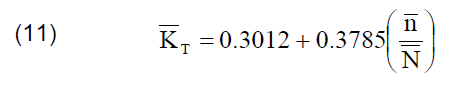
Table 1. Monthly-averaged daily bright sunshine hours, clearness index and diffuse ratio for MSU
From the results, the correlation coefficient at 0.8862 indicates high positive relationship between the measured monthly mean daily fraction of sunshine hours and the monthly mean daily clearness indexes while the determination coefficient at 0.9414 implies that a 94.14% clearness index can be achieved by using sunshine fraction data. In figure 3(b), the result from regression analysis, the following correlation shows that it properly fit to the daily data
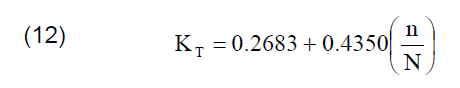
where, KT is daily clearness index. The correlation coefficient is 0.7546 and determination coefficient at 0.8687 implies that a 86.87% clearness index can be achieved by using the sunshine fraction data.
a) data of monthly average, b) data of daily
Figure 4 shows the relationship between diffuse ratio and clearness index. In figure 4(a), result from the regression analysis, the following correlation shows that it properly fit to the monthly average daily data. (13)

The minimum and maximum clearness indexes of monthly average daily are 0.45 and 0.65, respectively with the correlation coefficient at 0.8711 indicates highly positive correlation between the measured daily sunshine hour fraction and the daily clearness index while the determination coefficient at 0.9333 implies that a 93.33% clearness index can be achieved by using the sunshine fraction data.
In figure 4(b), result from the regression analysis, the following correlation shows that it properly fit to the daily data.
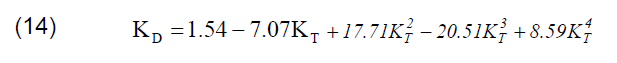
The minimum and maximum daily diffuse are 0.30 and 0.95, respectively. The correlation coefficient at 0.7435 indicates that there is an intermediate positive relationship within this correlation while the determination coefficient at 0.8623 implies that a 86.23% clearness index can be achieved by using the sunshine fraction data.
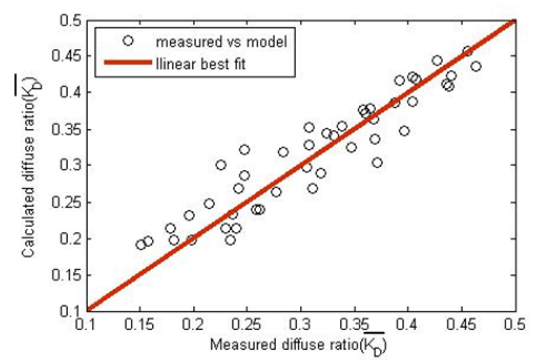
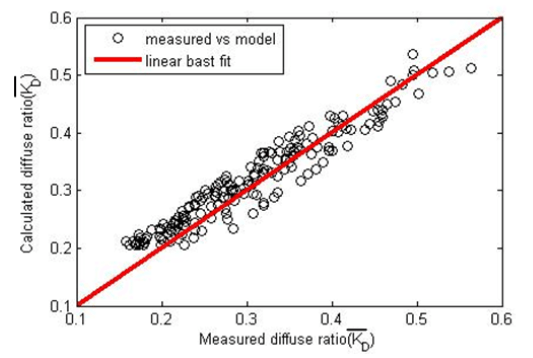
The figure 5 and 6 respectively illustrate the measured vs. calculated clearness index and measured vs. calculated diffuse ratio plotting in term of monthly average daily while the figure 7 and 8 respectively illustrate the same plotting in term of daily. The best trend line fit to the data in figure 5, 6, 7 and 8 are shown in table 2.
Table 2. Statistical indicators of regression equations
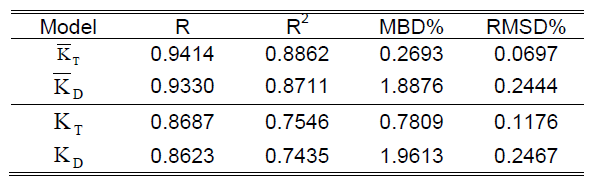
From Table 2, the regression analysis between the clearness index and sunshine fraction gives 0.2693% MBD and 0.0697% RMSD for monthly average data and 0.7809% MDB and 0.1176% RMSD for daily data while the regression analysis between the diffuse ratio and clearness index gives 1.8876% MBD and 0.2444% RMSD for monthly average data and 1.9613% MBD and 0.2467% RMSD for daily data, respectively.
3. Conclusion
This study mainly focuses in developing some proper equations from the relationship between the monthly average daily global and diffuse irradiation pattern in order to predict the availability of solar energy on horizontal ground surface around Maha Sarakham, Thailand. It can be concluded that the following equation is the most suitable for solar energy availability estimation with minimum and maximum clearness index of 0.45 and 0.65, respectively.
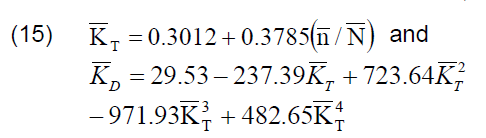
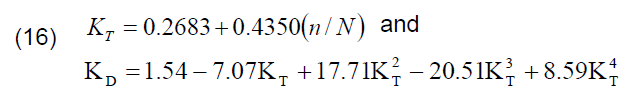
The following equation is the second acceptably one with minimum and maximum clearness index of 0.30 and 0.95, respectively.
The calculated values obtained from each equation are comparable to the empirical measuring values at acceptable level. Moreover, the a and b values obtained from the proposed equation (the first one) appear to be considerably close to the values previously reported by Hirunlabh . et al. [4]. The developed equations as well as the obtained information from the study can benefit designers and manufacturers in producing the best solar energy utilization equipments that fit to local conditions and benefit to any researchers in this field to use as guideline in future works.
REFERENCES
[1] Ibrahim SMA. Predicted and measured global solar radiation in Egypt. Solar Energy 35(2):185-188, 1985.
[2] Exell RHB. The intensity of solar radiation. King Mongkut’s University of Technology Press,Thornburi: 549-554, 2000.
[3] Angstrom,A.S.,Solar and Terrestrial radiation. Meteo-rological Society. 50:.121-126, 1924.
[4] Hirunlabh, J., Santisirisomboon, J. and Namprakai, P., Assessment of Solar Radiation for Thailand. Proceedings of International Workshop: Calculation Methods for Solar Energy Systems, 29-30.09, University of Parpignan, France,1994.
[5] Laosuwan,T., Pattanasethanon,S., and Sa-Ngiamvibool W., Using GIS, RS for soil erosion mapping. Available from: http ://geospatialworld.net/Regions/ArticleView.aspx?aid=30407#sthash.j9E5Cqqp.dpuf [Last accessed on 2014 June 12].
[6] Pattanasethanon S, Lertsatithanakorn C, Atthajari yakul S, Soponrpnnarit S., All sky modeling daylight availability and illuminance/irradiance on horizontal plane for Mahasarakham, Thailand. Energy conver-sion and Management,48(5):1601- 1614, 2007.
[7] Igbal M., An introduction to solar radiation. Academy press. New yoke: 6-51,1983.
[8] Klein, S.A., Calculation of Monthly Average isolations on Tilted Surfaces, Solar Energy. 19: 307-311, 1977.
[9] De Cario, F., Groppi, C., Festa, R., and Rao, C.F.R., A procedure to Obtain Global Solar Radiation Maps from Sunshine Duration at isolated Stations in a Region with a Complex Orography, Solar Energy, 37: 91-108, 1986.
[10] Laosuwan, T., Pattanasethanon, S., Sa-ngiamvibool, W., Automated Cloud Detection of Satellite Imagery Using Spatial Modeler Language and ERDAS Macro Language. IETE Technical Review, 30: 183-90, 2013
[11] Liu, B.Y.H. and Jordan, R.C. The interrelationship and characteristic distribution of direct, diffuse and total solar radiation. Solar Energy 4, (1),1960.
[12] Enrique R, Solar Alfonso, Robledo Luis. Statistical assessment of a model for global illuminanec on inclined surface from horizontalglobal illuminance. Energy Convers Manage,43: 693-708, 2002.
[13] Kjaersgaard, J.H., Plauborg, F.L., and Hansen, S., Comparison of models for calculating daytime long-wave irradiance using long term data set. Agricultural and Forest Meteorology 143:49–63, 2006.
[14] Gueymard C.A. and Myers D.R., Solar radiation measurement: Progress in radiometry for improved modeling, in Modeling Solar Radiation at the Earth Surface, V. Badescu, Ed., Springer, 2008.
[15] Anusasananan, P., Masiri, I., Janjai, S., Comparison of clear sky models for estimating downward longwave radiation in Thailand. 5th International Conference on Sustainable Energy and Environment (SEE 2014): Science, Technology and Innovation for ASEAN Green Growth, Bangkok, Thailand, 2014.
The correspondence address is:
Wutthisat Chokkuea, Faculty of Engineering, Mahasarakham University Khamriang, Kantharawichai, Maha Sarakham 44150 Thailand e-mail: wutthisat.c@msu.ac.th
Source & Publisher Item Identifier: PRZEGLĄD ELEKTROTECHNICZNY, ISSN 0033-2097, R. 91 NR 8/2015. doi:10.15199/48.2015.08.28
