Published by 1. Barbara KULESZ1, 2. Andrzej SIKORA2, 3. Damian SŁOTA3, Politechnika Śląska, Katedra Elektrotechniki i Informatyki(1,2), Politechnika Śląska, Katedra Zastosowań Matematyki i Metod Sztucznej Inteligencji (3) ORCID: 1. 0000-0002-3602-6013; 2. 0000-0003-3498-5621 3. 0000-0002-9265-5711
Abstract. The issue of the equivalent scheme parameter identification for the insulation system in an electrical machine is discussed in the paper. The presented method is based upon a recorded voltage waveform, and Artificial Bee Colony algorithm is used in calculations. A numerical example is presented.
Streszczenie. W artykule przedstawiono problem identyfikacji parametrów schematu zastępczego układu izolacyjnego maszyny elektrycznej. Zaproponowana metoda identyfikacji wykorzystuje zarejestrowane przebiegi napicia i algorytm roju pszczelego (Artificial Bee Colony Algorithm). Zamieszczono przykład obliczeniowy.(Narzędzie identyfikacji parametrów układu izolacyjnego maszyny elektrycznej).
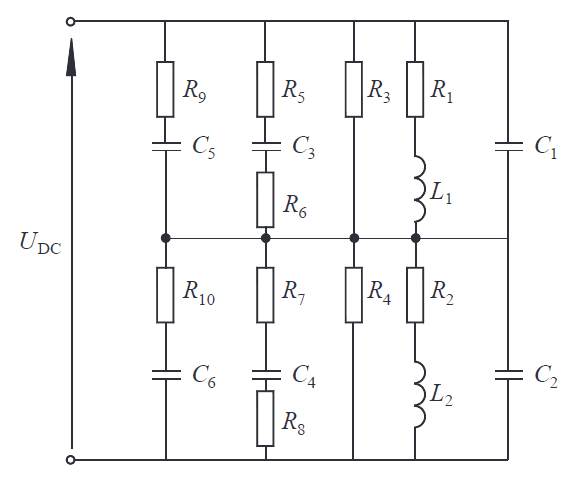
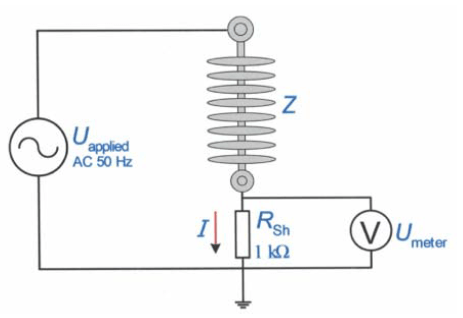
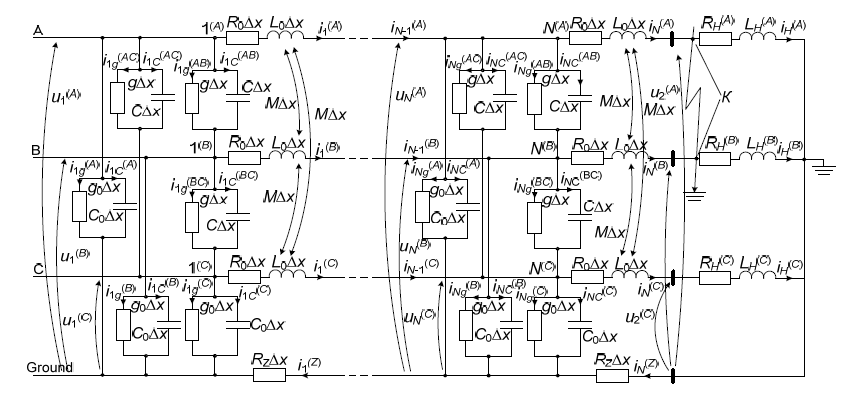
The electrical machine is a key element responsible for the correct performance of the machine. The technical condition of the insulation practically dictates the useful life of the device. Insulation is subjected to mechanical, chemical, electromagnetic, and thermal stresses; it is characterized by its resistance to heat, electrical strength, and heat conductivity coefficient. The problem of diagnosing the current state of the insulation and forecasting its progress of degradation is most important for all users of electrical machines and drives. At present, there are numerous insulation diagnostic methods exist; they can be classified e.g. on the basis of applied diagnostic voltage [2,3,4]. Among the most popular tests run with AC voltage, we may list the dielectric loss tangent tanδ measurement, partial discharge tests or the dielectric frequency response [5,7]. Among DC voltage tests, we can list the polarization method (recovery voltage test and insulation discharge current); quantities such as the polarization index (PI), capacitance of insulation system C, and the dielectric discharge DD are evaluated. Insulation may also be tested with step voltage (the voltage magnitude increases with time). When insulation-to-ground (that is, the main insulation in the machine) has been tested, turn-to-turn insulation measurements may also be performed [1,5,6]. Here, we may list the test of discharge current flowing when a loaded capacitor has been connected to the winding to the winding – surge test) or the test with voltage induced in the winding when constant current flowing through the winding has been switched off (recording of voltage waveform, assessment of induced voltage frequency and logarithmic decrement). The application of a given method depends on the goal of the measurements, available facilities/measurement devices, competence of diagnosing person/s, as well as the condition (age, wear) of insulation. Methods should be inexpensive and effective, easy to implement, and interpret. Often, more or less complex equivalent schemes are used to describe the insulation system. Such schemes take into account elements such as winding resistances and inductances, capacitances-to-ground and turn-to-turn capacitances. In practice, each different machine should be represented by its own (dedicated) equivalent scheme. An example of an equivalent scheme is shown in Fig.1. The values of the parameters in the scheme will be time-dependent (in particular, in the case of old insulation parameters, will depend on applied voltage). However, the problem is how to identify these parameters. If the present values of the parameters were determined and compared with the previous ones, it would be possible to predict the future performance of the insulation system. This would be an interesting diagnostic tool.
Fig.1. Example of an equivalent scheme for insulation system – for a coil consisting of two turns: R1, R2– turn resistances, L1, L2 – turn inductances, C1 to C6– capacitances of insulation-to-ground, R3 to R10 – resistances of insulation-to-ground
Description of the proposed test method
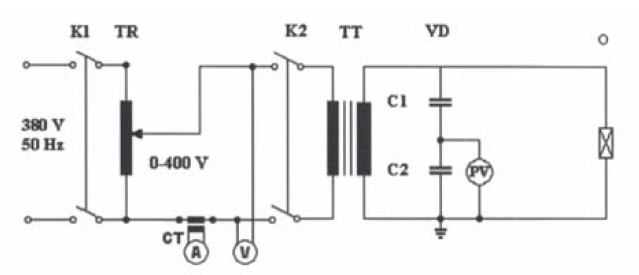
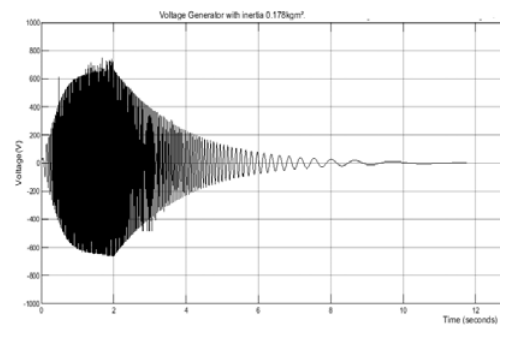
The main issue is how to reproduce the parameters of the proposed model (circuit) of the insulation system on the basis of relatively simple measurements. We propose a procedure divided into two stages. During the first stage, the insulation system should be performed using the reflected wave method. Roughly, this method consists of supplying the circuit with DC voltage in such a way that the current flowing through the winding should not exceed 10% of the winding’s rated current. The circuit is opened, and the waveform of voltage induced at the winding is recorded. An example of a recorded waveform is shown in Fig.2.
In conventional methods, the recorded waveform is used to determine voltage oscillation frequency, waveform envelope (logarithmic decrement), and maximum value of the induced voltage. In our procedure, during the second stage we shall try to mathematically reproduce the parameters of the equivalent scheme of the insulation system.
Fig.2. Voltage waveform recorded at the winding of a low-power electrical machine; winding insulation has been impregnated by VPI
Reproduction of equivalent scheme parameters using the artificial bee colony (ABC) algorithm Problem formulation
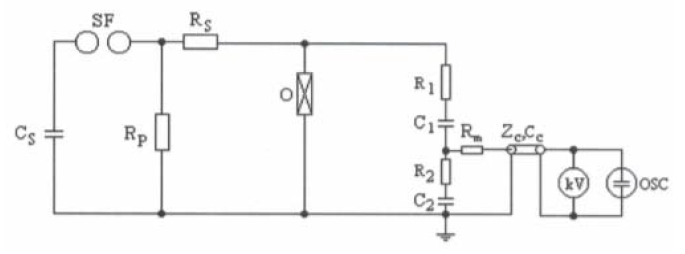
If we want to propose a novel method for reproducing parameters of an equivalent scheme of electrical machine, the first step will be to check this method with a simple trial electric circuit. This is shown in Fig.3.
Fig.3. a) Model of a simple real inductor (coil), supplied from a DC source, switch s closed, t < 0; b) model with switch open, t ≥ 0 ; R, L, resistance and inductance, Rin, Cin, resistance and capacitance of the insulation system, u(t) – voltage induced at the terminals (energy stored in the magnetic field and later discharged through the insulation system)
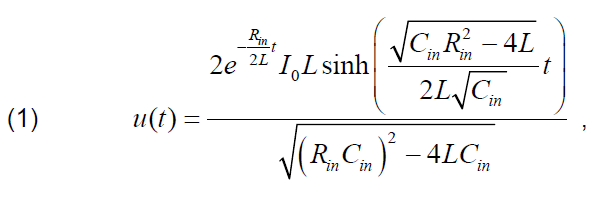
It has been assumed that this circuit should be supplied by DC current until steady-state is reached; then, switch is tripped (opened), and voltage will be induced at circuit terminals. This voltage may be expressed by the following relationship:
.
where: u(t) – voltage induced at the circuit terminals after the switch has been opened, I0 – current (DC) flowing in the circuit before opening the switch, Rin, Cin – resistance and capacitance of coil insulation, respectively, L – coil inductance.
The elements shown in Fig.3a are solely the coil parameters, i.e., wire resistance and coil inductance. The resistance and capacitance of the insulation have been taken into account in Fig3b, while the resistance has been neglected, since it is much lower than the insulation resistance. For simulation purposes, we assumed that Rin= 20 kΩ, Cin = 2 nF, L = 0.2 H, I0 = 0.5 A. An exemplary waveform has then been generated for the purpose of testing the computation method. This voltage is shown in Fig.4.
In the next step, we have formulated an algorithm for reproducing parameters of the scheme shown in Fig.3b solely on the basis of the discretized values of waveform shown in Fig.4.
Fig.4. Voltage waveform generated for the scheme shown in Fig.3
Proposed computational method – swarm algorithm
The ABC algorithm was proposed by Karaboga in 2005 [8]. It has been formulated on observation of a a behaviour of swarm of bees searching for food. The exact description of the algorithm may be found elsewhere [9,10]. The algorithm may be implemented in, e.g. Mathematica software, and this procedure has been adopted here. The initial stage of the algorithm consists of setting the general algorithm parameters, setting the starting point, and first calculating the equivalent scheme parameters.
1.Parameter setting
SN (Swarm Number) – this is equal to the number of ‘bee-scouts’. We set SN at 20. D (Dimension) – this is the number of ‘food sources’ discovered (equivalent to the size of the vector xi , i = 1,…,SN). In our case, since we search for values of parameters Rin, L, and Cin,D = 3. lim – this is the number of corrective explorations around the food source xi (corrections of the ‘nectar source position’; in this case the location of the food corresponds to the values of the equivalent scheme parameters); it is assumed that lim = SNꞏD (here it is equal to 60). MCN (Maximal Cycle Number) – maximum number of cycles (iterations). We set MCN at 20.
2. Determination of the ‘starting point’
The initial population of ‘bees’ is defined; in other words, some parameters of the equivalent scheme are randomly selected. They are represented by the vector xi,i = 1,…,SN.
3. The values of the function F(xi) are calculated, i = 1,…,SN. The function F(xi) is defined as a deviation of the waveform calculated on the basis of calculated scheme parameters (provided at the starting point) from waveform input to the procedure (Fig.4). The comparison of solutions achieved by different (subsequent) iterations is based upon comparing the obtained values of this deviation. The best possible solution – from among these calculated! – is the one where deviation is the least. Main part of the algorithm: the first ‘location of nectar sources’ (corresponding to randomly selected values of the equivalent scheme parameters) will be corrected. The values of the parameters in iteration #2 will be chosen close to the values of the parameters selected in iteration #1.
1. Modification of equivalent scheme parameters a) Formula (2) is adopted by each ‘bee-scout’ and position xi(parameter set) is thereby modified.
.
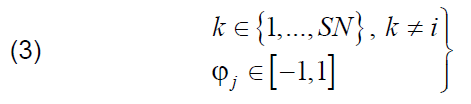
where
.
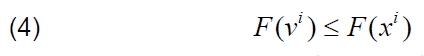
are numbers selected at random. b) Now the deviation in this step F(vi) is compared with the previous deviation F(xi) and if the following relationship
.
is true, then new parameters (vector vi) replace previous parameters (vector xi). If not, the parameters xi remain unchanged and the procedure shown in Step 6 is adopted. Steps (a) and (b) are repeated lim times (we try to find slight divergences of the parameters from their previous values).
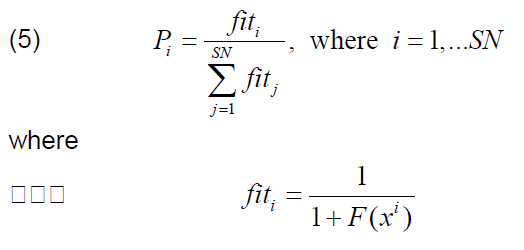
2. The probabilities Pi for the positions xi selected in step 1 are calculated:
.
Each onlooking bee (i.e. bee-viewer) selects one ‘food source’, i.e. the parameter set xi, i = 1,…,SN (from all possible sources), with probability Pi . One set may be selected by any number of bees.
4. Next, another modification of the parameter set is performed (each onlooking bee modifies the set according to the procedure presented in Step 1).
5. The important step is to select the BEST ‘food source position’, i.e. the best parameter set xbest from among all the calculated sets. If this new xbest is better than the one selected in the earlier iteration, then it is assumed as the xbest location for the entire algorithm.
6. The alternate procedure, if the parameter set has not been improved (relationship (4) has been found to be false). The new parameter set is adopted in accordance with the following formulas:
.
Steps (1-6) must be repeated MCN times.
Calculation results
The selected calculation results are shown below. Since the number of full computational cycles was 20, only a few results are presented. Fig.5 presents the results in graphical form, the selected numerical results are set out in Table 1.
Table 1. Calculated equivalent scheme parameters – selected results (parameters of the reproduced waveform were Rin = 2 kΩ, L = 0.2 H, Cin = 2 nF)
.
Fig.5. Calculation results: blue line – voltage waveform u(t) input into the algorithm; red line – waveform reproduced on the basis of parameters Rin, L, Cincalculated in the given cycle (parameters of the reproduced waveform were Rin = 2 kΩ, L = 0.2 H, Cin = 2 nF)
Fig.6. Deviation of the calculated waveform in a given calculation cycle (from the 1 to MSN = 20) from input waveform (numerical data as in Table 2)
To test the influence of noise on algorithm performance, randomly-generated “disturbance” was added to the original waveform, the magnitude of the noise magnitude equal to not more than 4% of the original values. The algorithm was run, and results are shown in Fig.7.
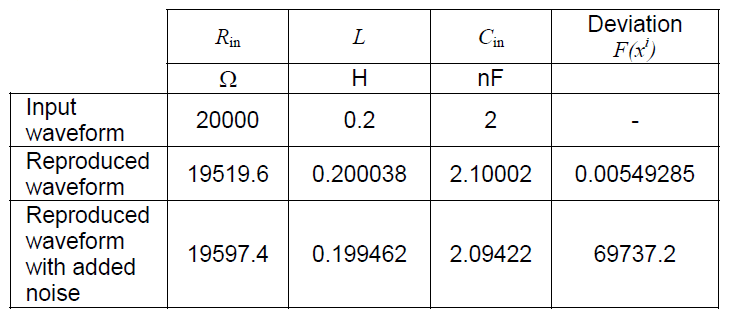
Fig.7. Calculation result for waveform with added noise: blue dots – voltage waveform input into the algorithm; red line – waveform reproduced on the basis of calculated parameters Rin, L, Cin best fit, calculation cycle #20; deviation F(xi) = 69737.2, parameters Rin = 19597.4 Ω, L = 0.199462 H, Cin = 2.09422 nF
Table 2. Comparison of calculated equivalent scheme parameters for smooth and noisy input waveform
.
Conclusions
We wanted to provide a tool for identification of electrical circuit parameters when a single signal waveform for this circuit is known. The proposed end purpose is to diagnose machine insulation (basing on equivalent parameters of the insulation scheme). We have applied swarm-type mathematical algorithm (ABC) to the task of identifying three parameters of electrical circuit, with induced voltage waveform acting as input data. Two cases have been analysed: with a smooth input waveform and a waveform ‘contaminated’ by random noise. The proposed algorithm performed well. Future investigations will be centred on increasing the number of circuit elements and on possible attempts to reproduce real-life signals obtained from existing insulation systems.
REFERENCES
[1] Decner A., Glinka T., Polak A., Zawilak J., Izolacja zwojowa – badania diagnostyczne, Przegląd Elektrotechniczny, nr 12/2008, 35-37 [2] Saha T.K., Review of modern diagnostic techniques for assessing insulation condition in aged transformers, IEEE Transactions on Dielectrics and Electrical Insulation,10/5 (2003), 903 – 917 [3] Saha T.K., Purkait P., Investigation of an expert system for the condition assessment of transformer insulation based on dielectric response measurements, IEEE Transactions on Power Delivery, 19/3 (2004), 1127 – 1134 [4] Stone G.C., Boulter E.A., Culbert I., Dhirani H., Electrical Insulation for Rotating Machines: Design, Evaluation, Aging, Testing, and Repair. 2nd Edition, Wiley-IEEE Press, July 2014 [5] Perisse F., Werynski P., Roger D., A New Method for AC Machine Turn Insulation Diagnostic Based on High Frequency Resonances, IEEE Transactions on Dielectrics and Electrical Insulation, 14/5 (2007), 1308 – 1315 [6] Grubic S., Aller J.M., Bin Lu, Habetler T.G., A Survey on Testing and Monitoring Methods for Stator Insulation Systems of Low-Voltage Induction Machines Focusing on Turn Insulation Problems, IEEE Transactions of Power Electronics, 55/12 (2008), 4127 – 4136 [7] Robalino D. M., Cheng J., Werelius P., Alvarez R.,A study of oil-paper insulation voltage dependency during frequency response analysis, 20th International Symposium on High Voltage Engineering, Buenos Aires, Argentina, 2017 [8] Karaboga D., Basturk B., On the performance of artificial Bee Colony (ABC) algorithm, Applied Soft Computing, 8 (2008), 687-697 [9] Hetmaniok E., Słota D., Zielonka A., Wituła R., Comparison of ABC and ACO Algorithms Applied for Solving the Inverse Heat Conduction Problem, SIDE 2012 and EC 2012, LNCS 7269, 249-257, 2012, Springer -Verlag Berlin Heidelberg. [10] Sikora A., Kulesz B., Zielonka A., Application of swarm algorithm to solving voltage unbalance problem in DC tram traction supply system, 2018 Innovative Materials and Technologies in Electrical Engineering (i-MITEL). IEEE, 2018, DOI: 10.1109/IMITEL.2018.8370483
Autorzy: dr hab. inż. Barbara Kulesz, Politechnika Śląska, Wydział Elektryczny, ul. Bolesława Krzywoustego 2, 44-100 Gliwice, E-mail: barbara.kulesz@polsl.pl; dr inż. Andrzej Sikora, Politechnika Śląska, Wydział Elektryczny, ul. Bolesława Krzywoustego 2, 44-100 Gliwice, E-mail: andrzej.sikora@polsl.pl, prof.dr hab.inż. Damian Słota, Politechnika Śląska, Wydział Matematyki Stosowanej, ul. Kaszubska 23, 44-100 Gliwice, e-mail: Damian.slota@polsl.pl
Source & Publisher Item Identifier: PRZEGLĄD ELEKTROTECHNICZNY, ISSN 0033-2097, R. 98 NR 11/2022. doi:10.15199/48.2022.11.59
Published by 1. Diego GIRAL-RAMÍREZ1, 2. Cesar HERNÁNDEZ-SUAREZ1, 3. José CORTES-TORRES2, Universidad Distrital Francisco José de Caldas, Bogotá, Colombia (1) Universidad Industrial de Santander, Bucaramanga, Colombia (2) ORCID: 1. 0000-0001-9983-4555, 2. 0000-0002-7974-5560, 3. 0000-0001-9232-6785
Abstract. Distributed Generation (DG) is a small-scale technology linked to consumers through the distribution system and has a high potential for technical, economic, and environmental benefits. The incorporation of generation at demand points produces a variety of load flow and fault currents, changing unidirectional flows to bidirectional structures and altering the characteristics of fault currents. The traditional methods for fault location that are implemented correspond to the traveling wave method and the impedance method. DG inclusion establishes new challenges, so it is necessary to propose or adopt models that improve the location process. During the last years, several Artificial Intelligence (AI) techniques have been introduced, where it presents good results due to its high performance and capacity to provide a fast response. This paper reviews AI-based techniques for fault location in distribution networks with DG. Although the advances are promising, many questions still need to be answered; the permanent work is to identify the advances in AI to obtain better results. Additionally, the implemented strategies must be scalable to ease the computational load and to be able to solve problems of greater complexity.
Streszczenie. Generacja rozproszona (DG) to technologia na małą skalę powiązana z konsumentami za pośrednictwem systemu dystrybucyjnego, która ma wysoki potencjał korzyści technicznych, ekonomicznych i środowiskowych. Włączenie generacji w punktach odbioru wytwarza różnorodne przepływy obciążenia i prądy zwarciowe, zmieniając przepływy jednokierunkowe na struktury dwukierunkowe i zmieniając charakterystyki prądów zwarciowych. Zaimplementowane tradycyjne metody lokalizacji zwarcia odpowiadają metodzie fali biegnącej i metodzie impedancyjnej. Dyrekcja Generalna ds. integracji stawia nowe wyzwania, dlatego konieczne jest zaproponowanie lub przyjęcie modeli usprawniających proces lokalizacji. W ciągu ostatnich lat wprowadzono kilka technik sztucznej inteligencji (AI), które dają dobre wyniki ze względu na wysoką wydajność i zdolność do szybkiego reagowania. W niniejszym artykule dokonano przeglądu opartych na sztucznej inteligencji technik lokalizacji uszkodzeń w sieciach dystrybucyjnych z DG. Chociaż postęp jest obiecujący, wiele pytań wciąż wymaga odpowiedzi; stałą pracą jest identyfikacja postępów w sztucznej inteligencji w celu uzyskania lepszych wyników. Dodatkowo wdrażane strategie muszą być skalowalne, aby zmniejszyć obciążenie obliczeniowe i móc rozwiązywać problemy o większej złożoności. (Inteligentne algorytmy lokalizacji uszkodzeń dla sieci dystrybucyjnych generacji rozproszonej: przegląd)
Keywords: intelligent optimization, distributed generation, artificial intelligence, machine learning, fault location. Słowa kluczowe: lokalizacja uszkodzeń, sieć rozproszona, sztuczna inteligencja
Introduction Energy systems are continuously evolving. They must be designed under adaptive models allowing them to adapt to network operators’ and consumers’ constant changes. In order to overcome the challenges of the new electrical systems, it is necessary to incorporate electronic, electrical, information, and advanced manufacturing technologies, which is a requirement for the new energy business models, in a sector that in its transition seeks to integrate: renewable sources, direct current transport systems, energy storage, metering systems, smart grids and the participation of endusers [1].
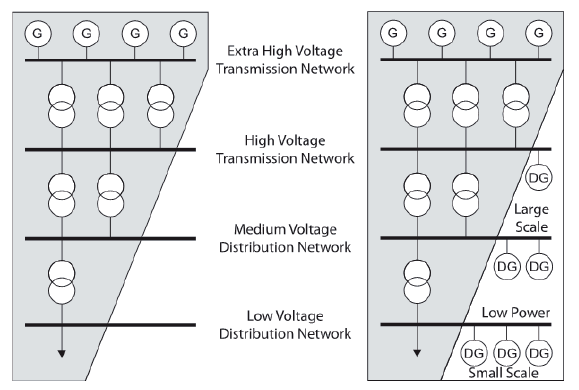
DG represents a “change in the philosophy of electric power generation” that is not new [2], and its implementation allows taking on the challenges of new energy business models. DG has an extensive list of advantages. However, it generates problems on the distribution networks and the transmission system, depending on the own characteristics of the electric power system and the level of penetration [3]. With the connection of generation to the distribution network, part of the system loses its radial system characteristics, modifying: the unidirectional flow, the magnitude, and direction of the short-circuit currents, which causes the incorrect operation of the protection system, failures in the overcurrent schemes and general variation in the operation of the system, affecting the security and reliability in the supply and quality of the energy delivered [4]. DG can be connected at various voltage levels from 120/230 V to 150 kV. As shown in Fig.1, only low power generators can be connected to the lower voltage networks, but large installations of a few hundred megawatts are connected to the busbars of high voltage distribution systems [5].
Many small units integrated into the distribution grid are renewable energy sources, such as wind turbines, small-scale hydroelectric plants, and photovoltaic panels, but high-efficiency non-renewable energy sources, such as small combined heat and power plants, are also implemented. The technologies implemented for DG can be classified according to the resource of generation and type of storage [6], [7]. Distributed Energy Resources (DER) include all forms of electricity generation and storage interconnected to the power system at the medium and low voltage distribution levels [8].
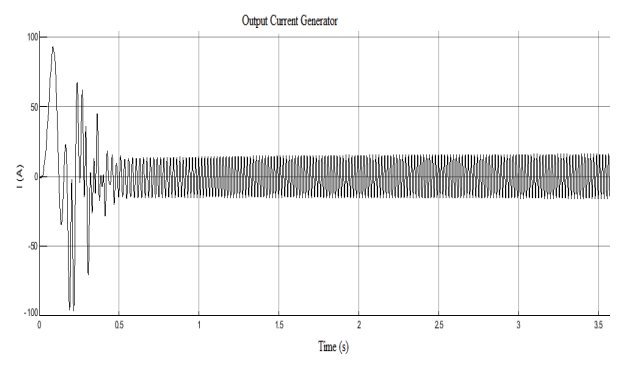
DG integration generates benefits. These benefits include the reduction of line losses, minimization of environmental impacts, increase in efficiency, safety and service provision indicators, reduction of congestion in the transmission and distribution network, and improvement in voltage profiles [5]. However, it also has disadvantages, such as changes in unidirectional flows by bidirectional structures, alteration of fault current characteristics (Fig.2), protection system sensitivity, and network reliability.
The rate of change of fault currents depends on the capacity of the DG incorporated in the system [9]. The protection system adjustment requires the characterization of the performance of the current flows as a function of the type of fault. For example, for three-phase failure in radial systems, the network contribution to the total fault current will be reduced by the DG contribution. Because of this reduction, the short circuit can remain undetected because the grid contribution to the short circuit current never reaches the pickup current of the power relay. Overcurrent relays, directional relays, and reclosers depend on their operation to detect an abnormal current. These problems depend on the protection system applied and, consequently, on the type of distribution network [9], [10]. In general, protection problems can be divided into three categories: Fault detection problems, Fault location problems, Selectivity problems.
In distribution networks with DG penetration, fault location poses a large number of challenges; the traditional methods developed cannot be applied directly due to the variation in short-circuit capacities, the position of the generation systems, bidirectional current flows, the presence of non-homogeneous lines, unbalanced loads, as well as the various branches and laterals [11]. In recent years, several methods have been proposed for fault location in distribution lines. The proposed models have multiple techniques, some deterministic and others probabilistic, and their applications are diverse. However, like many areas of engineering, they are limited by the application system. In the case of fault location, the developed models focus their efforts on solving problems of centralized architectures in transmission and distribution. Therefore, it is necessary to identify and implement fault location strategies that are fast and accurate when incorporating end-user-side generation [12].
Fig.1. DG connection [5]
Fig.2. DG contribution to fault currents [9]
This article reviews AI-based techniques for fault location in distribution networks with DG. This article is structured as follows: the first section corresponds to the introduction, the second section presents the review of fault location techniques, which represents the current regulations, the classification of location methods, some background, and a comparative analysis according to the information presented. Finally, in the last section, the general conclusions of the work are presented.
Fault location in distribution networks with DG
The generation at the demand points produces a variation of the load flow and fault currents. Therefore, improving fault diagnosis schemes for this type of architecture is a relevant factor; the early location of a fault accelerates the restoration process, which improves the reliability indicators of the system [13]. In distribution networks, non-homogeneous lines, out-off balance loads, and various branches interfere with the direct application of traditional fault location methods.
Fault location schemes in distribution networks that do not use physical inspection are designed for unidirectional power flows, posing more challenges for networks with DG incorporation [11], Therefore, it is necessary to develop advanced and accurate techniques that adapt to new challenges and permanent changes in distribution networks [14].
On DG fault location, several techniques have been presented in the literature, which is based on modifications of traditional methods: traveling wave methods and impedance methods; additionally, during the last years, a considerable number of knowledge-based techniques have been proposed for fault location. IA is a multidisciplinary area that belongs to the knowledge-based strategies and has presented great results for this type of problem due to its high performance, adaptation, and capacity to provide a fast response during the fault location process. However, it requires a high volume of information for the training and validation tests of the different models, which can generate slow convergence characteristics and high computational load.
In IA for fault location, there is no one technique that is the best, each structure has a considerable number of advantages and disadvantages, but a model that benefits a specific activity or metric and that also fits the current challenges of distribution systems can be proposed. The following is a review of fault location techniques for DG systems, which presents the current regulations, the classification of location methods, some background information, and a comparative analysis according to the provided information.
Standards Fault Location
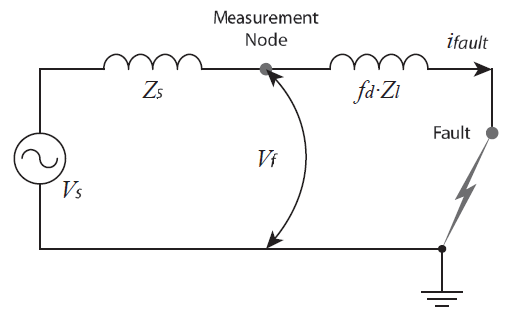
According to the IEEE standard [15], fault location techniques are classified into impedance-based and traveling wave technologies. Impedance-based algorithms use fundamental frequency (60Hz) voltage and current phasors recorded by digital relays, digital fault recorders, and other Intelligent Electronic Devices (IED) during a fault to estimate the apparent impedance between the IED and the short-circuit fault location. Algorithms that estimate the fault distance from measurements at one end of the line are defined as single-ended impedance-based algorithms; those that use measurements at more than one end of a line are called multiple-ended impedance-based algorithms [16], [17]. Fig.3 shows the simple circuit of the impedance based method. The measurement to find the fault distance from the measurement node fd is the value of the impedance per unit line of the distribution system.
The advantage of the impedance-based method is that it is cheaper compared to the traveling wave method, only requiring measurement data from the distribution line. The data must be recorded frequently to monitor the power system. The main disadvantage is the inaccuracy in fault location due to the reconfiguration of the system each time a DG source is disconnected or connected, which generates the method to provide multiple estimates of fault location [18], [19]. Variations of the method, such as the conversion of estimated apparent line reactance to distance and Thevenin’s equivalent method, can be used to calculate fault voltage and current [20].
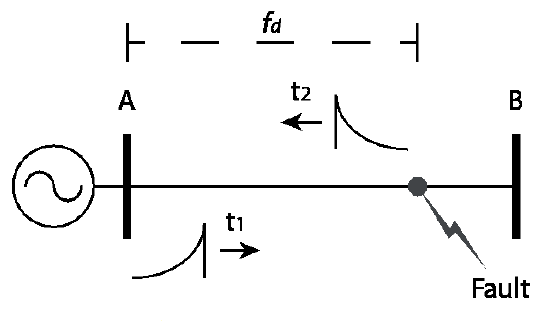
On the other hand, traveling-wave fault location algorithms depart from the system’s operating frequency, using the high-frequency waves generated by the fault to determine the location. Fault location using traveling wave technology (Fig.4), uses the time (t1 and t2) it takes for a wave to travel from the fault point (fd) to the fixed reference point (Node A) where the measurement is taken [15]. The method records the nodes from where the wave is transmitted and where it is reflected. In order to identify the fault location, it is necessary to measure the sum of the fault wave traveling time reflected at the recording node. The advantage of this method is that the load variation, series capacitor bank, and high resistance to the ground do not affect the location technique. Subsequent to the impedance method, traveling wave fault location techniques can also be classified into single-ended (Fig.4) and two-ended algorithms. The disadvantage of this method is that the equipment and devices used in the procedure are high-priced, such as GPS and transient waveform capture sensors.
Fig.3. Impedance based method
Fig.4. Traveling wave method
Several fault location algorithms have been developed in the traveling wave and impedance-based categories. Most of these algorithms aim for the same goal, which is to locate the fault with the highest accuracy. Each study makes different assumptions and uses a data variety to achieve this result. What is the best fault location algorithm? Unfortunately, there is no one-size-fits-all answer. The correct answer is that it depends. It depends on the data available for fault location, the system to which the algorithm will be applied, and the characteristics of the fault [16].
IA Techniques for DG System Troubleshooting
With the accelerated development of distribution networks, users have demanded higher reliability and quality of service delivery. Statistical data show that most power grid failures occur in the distribution network, and 80% of distribution network failures are line failures [21].
Fault location in distribution lines is the first step to maintaining the safety and operation of the system [22]. After a disturbance occurs, the protection scheme must detect and locate the fault to isolate the area. The response must be fast and accurate to avoid damage to the equipment and prevent the failure from spreading to the entire system [10], [19].
Protection schemes prefer to disconnect DG sources upon a fault or any other disturbance to ensure there is no contribution to the fault current. However, the practice of removing DG is not reliable. Moreover, non-selective removal of DG is neither recommended nor acceptable in a multi-service power supply market [23]–[25]. During the last few years, several methods have been proposed for fault location in systems integrating DG; Fig.5 shows the classification of the methods according to traditional and intelligent system-based strategies.
It is relevant to identify and localize the fault diagnosis in distribution networks. In order to fulfill the demand, more advanced and accurate techniques are required to adapt to the new challenges of the distribution system, such as the incorporation of DG and the increased participation of DER. Because of the structure, wide applications, and excellent results obtained in different engineering areas, knowledge-based methods correspond to computer science that can solve the new challenges in fault location.
Fig.5. Classification of fault location methods for DG networks [23], [24]
Knowledge-based methods
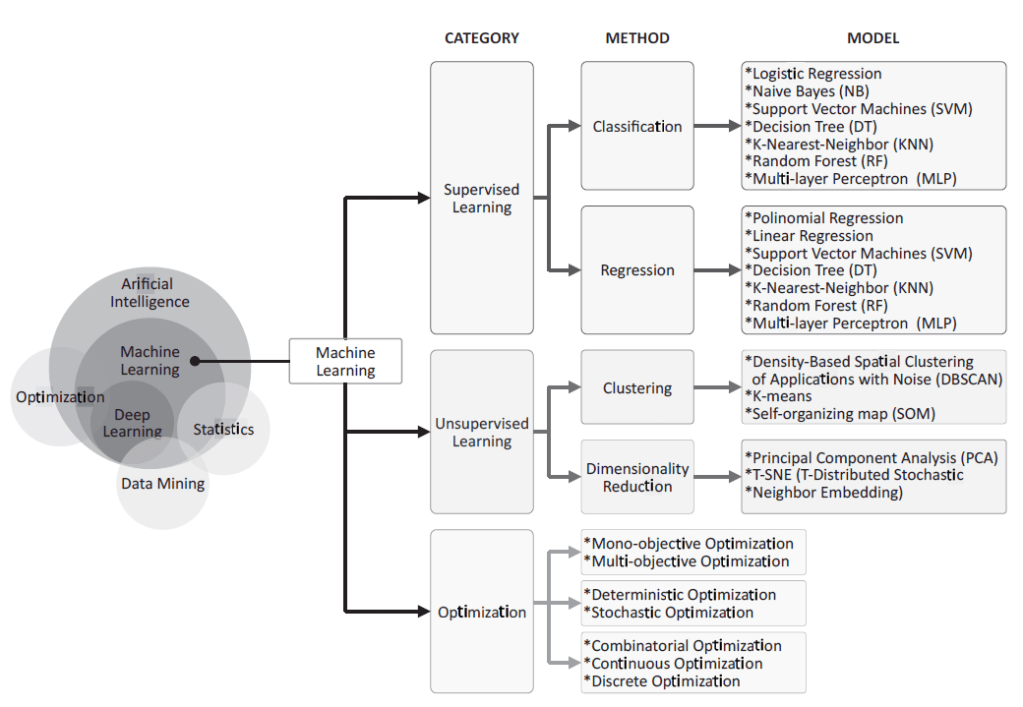
IA, a multidisciplinary area that combines branches of science such as logic, computer science, and philosophy, is concerned with designing and creating artificial entities capable of solving problems using human behavioral algorithms. A significant number of AI-based techniques have been proposed in the literature for power system analysis. However, there is no single algorithm that solves better a general problem. IA is oriented according to the problem to be solved. A proposed hierarchical organization of learning algorithms and their dependency is shown in Figure 6 [26], [27].
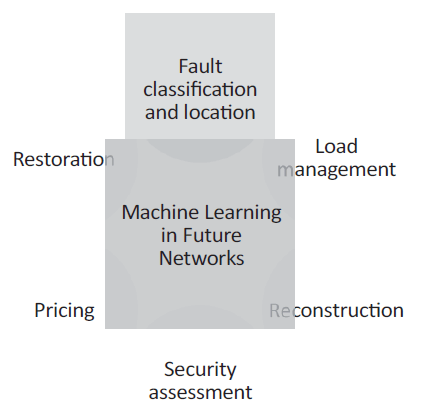
Learning machines are a subfield of AI and computer science; they have evolved from pattern recognition to analyzing the structure of data and fitting it into models that users can understand and replicate. This advance is considered the starting point for the development of data-driven services in the power sector. Figure 7 provides some applications of learning machines in the future of power grids.
For fault location using AI, the most commonly used techniques implement neural networks, support vector machines, fuzzy logic, genetic algorithms, and the matching approach. However, some methodologies are available in the literature, some new ones arising from authors’ proposals for specific applications, and others based on hybrid models. These proposals use the “No-Free-Lunch” principle [28], characterize the advantages and disadvantages of two or more strategies, and then combine them in such a way that the overall algorithm is better than the individual ones [29], [30].
In the field of optimization, there have been numerous studies focusing on the design of the algorithms for specific problems considering different backgrounds and objectives. According to the research approaches, the principal studies on intelligent optimization algorithms can be divided into separate groups. Fig.8 presents a proposal for the taxonomy of intelligent optimization algorithm [31].
Fig.6. Hierarchical organization of IA algorithms [27], [32]
Fig.7. Learning machines applications in the future of power grids [33]
Fig.8. Taxonomy of intelligent optimization algorithms [34]
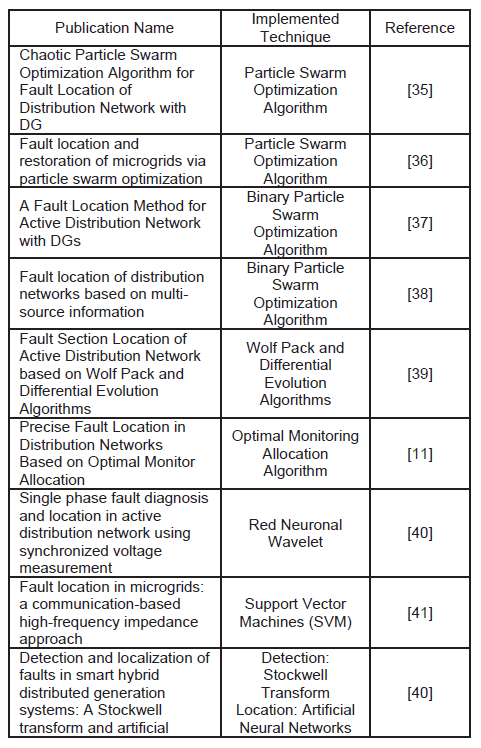
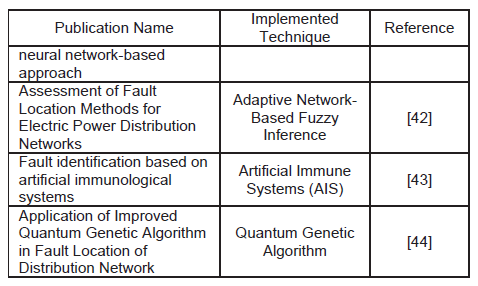
Table 1 presents some examples of knowledge-based techniques for fault location in distribution lines with DG.
Table 1. Example of knowledge-based techniques
.
.
According to the “No-Free-Lunch” theorem, no single technique is best. Each technique structure has some advantages and disadvantages, allowing them to be characterized for specific problems. Fault localization using IA methods generates new challenges because it requires training and validation data, along with robust processing equipment [45], [46]. The main challenges regarding the possible implementation of intelligent techniques for fault localization are:
• The quality and selection of information for model training and validation. • Limited or inaccurate training and validation information. • Slow convergence in the training process according to the criteria of the model to be implemented. • Retraining every time there are changes in the system state. • High computational load. • Not only must they deliver good results and solve complex tasks, but they must also be designed to be efficient.
Background Analysis
The background is analyzed from three approaches, fault location in distribution lines, IA and optimization techniques for fault location in distribution networks, and IA techniques for fault analysis in DG. Relevant research relating to some of the described approaches was identified. The review starts with a general description of the publications and then specifies each one of them from their objectives, methodology, results, and simulation tool used.
In the field of fault location in distribution lines, three publications and the IEEE standard are described. It is essential to present as background the standard C37.114- 2014 – IEEE [15], a guide for determining fault location in alternating current transmission and distribution lines. This paper presents the description of traditional approaches and measurement techniques used in modern devices for fault location: single and two-terminal impedance-based methods and the traveling wave method.
Regarding the different studies in this field during the last few years, several methodologies describe techniques, such as Wavelet transforms, monitoring systems, and others. In addition, proposals are made to improve the model based on traveling waves. [47] propose an adaptive protection scheme for the localization of single-phase faults using traveling waves, and [48] analyze the localization of high impedance faults through the communication system. The results obtained in each of the studies allow identifying that the strategies selected for the adjustment of the respective models have good performances. However, they do not present comparative analysis with other types of strategies, [48] analyzing the feasibility of implementing the strategy for smart grids. Regardless, they do not quantitatively validate the statement. [49] use the Stockwell transform to obtain a classifier. Nevertheless, although the analysis performed can be extrapolated to fault location, the results presented are focused on fault classification. In general, the three papers presented use radial case studies; the models are not evaluated for bidirectional stream flows.
Below are described the two publications cited for the distribution line fault location.
Authors in [48] analyze the faults that do not touch the ground, highlighting the shortcomings of the current location systems to characterize this type of disturbances. The location of high impedance faults in distribution systems is currently little analyzed; the problem lies in the fact that the identification systems use as criteria the increase of the current magnitude, a high impedance fault does not cause a considerable change in the current flow. Therefore, it is not easily detectable. The solution to identify and locate these faults corresponds to visual diagnosis by the maintenance service or by the users. In order to identify and characterize these faults in the networks, the authors propose a model based on the “Frequency Power Line Carrier Communication Guardian.” The implemented technique is a radial circuit with a feeder, a distribution line, and a monitoring system. This circuit also includes two measurement transformers, four switches, a coupling capacitor, and a programmable logic controller into the system. MATLAB and PSCAD are used as simulation tools.
Authors in [47] analyze the overcurrent protection schemes for shunt faults in distribution systems, specifically, evaluate the disadvantages of traveling waves for the single-phase faults analysis. The authors develop an adaptive model of the traveling wave technique, which allows the proposed model to accurately identify the singlephase ground fault from other short-circuit failures. The implemented system is a radial circuit with two nodes and a distribution line. The simulation is performed through a protection scheme for the overcurrent function.
Authors in [49] globally analyze the use of signal processing and techniques for fault identification in distribution lines. The authors present a short description based on bibliographic references on the Wavelet Transform (WT), the Discrete Wavelet Transform (DWT), the Hilbert Huang Transform (HHT), and the Gabor Transform (GT). Specifically, the authors propose an algorithm that decomposes the voltage and current signal through the Stockwell Transform; from this decomposition, they obtain the S matrix and use the mean values of the matrix as the fault index. The study was carried out in MATLAB using the IEEE-13 bus test system.
In the area of AI and optimization techniques for fault location in distribution networks, three publications work together with the two approaches and are related to the present research proposal are described. Additionally, [50] implement the Discrete Wavelet Transform (DWT). The authors implement six AI strategies, Bayes, multilayer neural networks, adaptive neuro-fuzzy inference systems (ANFIS), and support vector machine (SVM) as classification techniques. [51] implement wavelet transform and adaptive neuro-fuzzy inference systems (ANFIS) to locate transient fault zones. And, [52] implement artificial neural networks backpropagation for overhead line fault location.
Besides, [50], uses statistical analysis to compare different classification strategies establishing advantages and disadvantages of the models implemented. [51] and [52] do not present discussions on other possible IA techniques, nor do they include proposals for the bidirectional current systems analysis. Several IA and optimization techniques can provide efficient results to the fault location process. In the same way, [50] incorporate statistical metrics while [51] include performance metrics based on computational load and execution times, which are relevant characteristics for this type of strategy. However, in the fault analysis area, this metric is rarely studied, as identified in [52], where the model performance is analyzed but not its response time; the objective is to locate the fault in the shortest possible time.
Below are described the three publications cited for the area of IA and optimization techniques for fault location.
Authors in [50] implement the Discrete Wavelet Transform (DWT) for the analysis of fault current signals that are obtained through simulations in MATLAB, as classification techniques; they perform a comparative analysis of six strategies of AI, Bayes, multilayer neural networks, adaptive neuro-fuzzy inference systems (ANFIS) and support vector machine (SVM). Average absolute error, root average square error, kappa statistic, success rate, and discrimination rate are used to compare the strategies. The results show that the ANFIS and SVM classifiers are the most effective ones, and their performance is substantially superior to other classifiers. The simulations and design of the classifiers are performed in MATLAB, which implements a radial distribution system.
Authors in [51] develop a method to locate the transient fault zone and classify the fault type in power distribution systems using the wavelet transform and adaptive neurofuzzy inference systems (ANFIS). The study highlights the challenges, costs, and low accuracy of the recent fault location techniques in distribution lines. The strategy presented by the authors extracts current signals from the main feeder, and through ANFIS networks, four algorithms are implemented to locate the fault zone, one algorithm for each branch fault. The model has lower complexity than traditional methods; this criterion is established by the computational load and execution time decrease. Additionally, this method represents a higher accuracy; the maximum error observed was less than 2 %. The simulations are performed in EMTP-RV for a 25 kV radial distribution system.
Authors in [52] describe a fault location algorithm for overhead power distribution lines based on an artificial neural network. In general, techniques based on neural networks perform better in the presence of fault resistance, power system parameter variations and do not require accurate knowledge of the configuration of the power system configuration. Artificial neural network feedforward with backpropagation algorithm with a Levenberg- Marquardt training function is used. The inputs to the neural network are trained through the use of frequency information of fault data that were obtained with digital filtering. The algorithm is tested widely for various system conditions according to the type of fault generated in the overhead distribution system that has been modeled with MATLAB software.
AI techniques for failure analysis in DG studies work with both approaches. [53] implement neural networks, [53] support vector machines, and [54] support vector machines, and [55] metaheuristic optimization.
The results presented in [53], [54], [55] allow us to identify the performance of the selected techniques; good results and relevant metrics are presented for the type of problem analyzed. However, some techniques have been proposed in the literature in recent years, and as identified in the papers cited below, there is no single best algorithm for a general problem. If an algorithm outperforms others in some function, there will be some tasks in which other algorithms will be more efficient. A possible strategy to improve performance is to propose algorithms based on hybrid structures; this allows characterizing the advantages and disadvantages of two or more approaches and then combining them so that the overall algorithm is better than the individual ones.
Below are described the three publications that work on DG fault location approaches.
Authors in [53] propose a system based on electrical synaptic transmission for locating faults in distribution lines with DG for the bidirectional current flow analysis. The bidirectional electrical synaptic transmission characteristics are related to the direction of the current in a distribution system by the incorporation of generation at the demand points. In order to verify the accuracy of the method in this research, three types of faults are analyzed, single faults, multiple faults, and misinformation faults. Additionally, the efficiency of the model is compared as a function of the complexity of the distribution network. Finally, the strategy, methodology, and metrics implemented demonstrate that the model has efficient results. The models are analyzed through matrix structures, using MATLAB as a simulation tool.
Authors in [54] propose an augmented current tracing algorithm with a support vector machine. The objective of the tracing algorithm is to construct a trace of the flow and direction of currents from connected sources at different nodes of the distribution system. The support vector machine is trained as a classification technique to identify the traced fault streams. The plotting and classification are compared with the original circuit equivalents. For the support vector machine, it was evaluated and compared using different kernel methods, improving the sensitivity to very low-level faults. In general, the proposed procedure represented efficient results, with good fits for the overcurrent protection scheme on the primary side of the distribution network. The simulation tool is not specified.
Authors [55] analyze fault location for the improvement and safety of DC distribution networks. For this type of system, when a line fails, the capacitor of the conversion system discharges rapidly, causing the fault current to increase in a short time, which is extremely detrimental to the safety of the system. So, it is required that the fault is located in the shortest possible time. DC networks are the most promising power distribution method for new loads being connected to the system, such as electric cars, smart buildings, and data communication. The authors highlight that there is little research on fault identification and location methods. A particle swarm algorithm is proposed for parameter identification. The objective is to optimize the measurement results to decrease the errors caused by inaccurate sampling. The results show that the method is not affected by transition resistance; and, the positioning accuracy is high. The fault location method is verified in the MATLAB simulation platform.
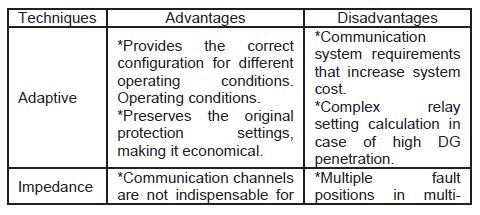
Comparative Analysis
Table 2 displays a comparative analysis of the previously mentioned fault location methods for distribution systems integrating DG.
In order to overcome the challenges of new electrical systems, it is necessary to incorporate advanced computational strategies. During the last few years, several techniques have been presented for fault location in distribution lines with DG, where IA has presented great results due to its high performance and capacity to provide a fast response during a fault. From these reviews, it is evident that there is no optimal solution to the problem of fault location in distribution lines with DG. Because of the generality of IA, it is not possible to characterize an algorithm as the best strategy for fault location. Although the advances are promising, many questions still need to be answered. The ongoing work is to identify the advances in IA to obtain better results. Additionally, the strategies implemented must be scalable to ease the computational load and be able to solve problems of higher complexity.
REFERENCES
[1] U. del V. Ministerio de Minas y Energía, Universidad Nacional de Colombia, UPME, Observatorio Colombiano de Energía. Aproximación a las condiciones para su conformación. 2018. [2] R. Naghizadeh, H. Afrakhte, and M. Ziapour, “Smart Distribution Network Reconfiguration Based on Optimal Planning of Distributed Generation Resources Using Teaching Learning Based Algorithm to Reduce Generation Costs, Losses and Improve Reliability,” in Electrical Engineering (ICEE), Iranian Conference on, 2018, pp. 1125–1131, doi: 10.1109/ICEE.2018.8472451. [3] M. B. de las Casas, H. R. Quintero, I. O. Sosa, D. S. Morales, and L. E. L. Mendoza, “Influencia de la generación distribuida en los niveles de cortocircuito y en las protecciones eléctricas subestaciones de 110/34, 5 kV,” Ing. Energética, vol. 30, no.1, pp. 3-a, 2009. [4] T. C. Srinivasa Rao, S. S. Tulasi Ram, and J. B. V. Subrahmanyam, “Fault Signal Recognition in Power Distribution System using Deep Belief Network,” J. Intell. Syst., vol. 29, no. 1, pp. 459–474, Dec. 2019, doi: 10.1515/jisys-2017-0499. [5] N. Jenkins, J. . Ekanayake, and G. Strbac, Distributed Generation. India, 2014. [6] T. Adefarati and R. C. Bansal, “Integration of renewable distributed generators into the distribution system: a review,” IET Renew. Power Gener., vol. 10, no. 7, pp. 873–884, 2016. [7] C. L. Trujillo et al., Microrredes eléctricas, Primera Ed. Bogotá, 2015. [8] L. Strezoski, I. Stefani, and B. Brbaklic, “Active Management of Distribution Systems with High Penetration of Distributed Energy Resources,” in IEEE EUROCON 2019 -18th International Conference on Smart Technologies, 2019, pp. 1–5, doi: 10.1109/EUROCON.2019.8861748. [9] D. Gaonkar, Distributed generation. Croatia: BoD–Books on Demand, 2010. [10] X. Chen and Z. Jiao, “Accurate Fault Location Method of Distribution Network with Limited Number of PMUs,” in 2018 China International Conference on Electricity Distribution (CICED), 2018, pp. 1503–1507, doi: 10.1109/CICED.2018.8592074. [11] H. Sun, H. Yi, F. Zhuo, X. Du, and G. Yang, “Precise Fault Location in Distribution Networks Based on Optimal Monitor Allocation,” IEEE Trans. Power Deliv., vol. 35, no. 4, pp. 1788–1799, 2020, doi: 10.1109/TPWRD.2019.2954460. [12] S. F. Alwash, V. K. Ramachandaramurthy, and N. Mithulananthan, “Fault-Location Scheme for Power Distribution System with Distributed Generation,” IEEE Trans. Power Deliv., vol. 30, no. 3, pp. 1187–1195, 2015, doi: 10.1109/TPWRD.2014.2372045. [13] A. Tashakkori, P. J. Wolfs, S. Islam, and A. Abu-Siada, “Fault Location on Radial Distribution Networks via Distributed Synchronized Traveling Wave Detectors,” IEEE Trans. Power Deliv., vol. 35, no. 3, pp. 1553–1562, 2020, doi: 10.1109/TPWRD.2019.2948174. [14] S. Seghir and T. Bouthiba, “Impedance correction method of distance relay on high voltage transmission line,” Przegląd Elektrotechniczny, vol. 97, 2021. [15] IEEE, “Guide for Determining Fault Location on AC Transmission and Distribution Lines,” C37.114-2014. pp. 1–76, 2015, doi: 10.1109/IEEESTD.2015.7024095. [16] S. Das, S. Santoso, and S. N. Ananthan, Fault Location on Transmission and Distribution Lines: Principles and Applications. John Wiley & Sons, 2021. [17] J. Herlender, J. Iżykowski, and E. Rosołowski, “Impedancedifferential relay as a transmission line fault locator,” Przegląd Elektrotechniczny, vol. 93, 2017. [18] S. Dadary and H. Afrakhte, “Accuracy improvement of impedance-based fault locating method in distribution systems with DGs considering loss of laterals and load variations,” Int. Trans. Electr. Energy Syst., vol. 27, no. 11, p. e2420, Nov. 2017, doi: https://doi.org/10.1002/etep.2420. [19] H. H. Goh et al., “Fault location techniques in electrical power system: A review,” Indones. J. Electr. Eng. Comput. Sci., vol. 8, no. 1, pp. 206–212, 2017. [20] International Electrotechnical Commission, “IEC 60909 – Shortcircuit currents in three-phase,” vol. 0. 2016. [21] B. Zhang, H. Liu, J. Song, and J. Zhang, “Simulation on Grounding Fault Location of Distribution Network Based on Regional Parameters,” in 2019 IEEE 19th International Symposium on High Assurance Systems Engineering (HASE), 2019, pp. 216–221, doi: 10.1109/HASE.2019.00040. [22] B. Jiang, X. Dong, S. Shi, and B. Wang, “Fault line identification of Single Line to Ground fault for non-effectively grounded distribution networks with double-circuit lines,” in IEEE Power and Energy Society General Meeting, Jul. 2015, vol. 2015- Septe, no. 51120175001, pp. 1–5, doi: 10.1109/PESGM.2015.7286346. [23] A. Bahmanyar, S. Jamali, A. Estebsari, and E. Bompard, “A comparison framework for distribution system outage and fault location methods,” Electr. Power Syst. Res., vol. 145, pp. 19– 34, 2017, doi: https://doi.org/10.1016/j.epsr.2016.12.018. [24] R. Kumar and D. Saxena, “A Literature Review on Methodologies of Fault Location in the Distribution System with Distributed Generation,” Energy Technol., vol. 8, no. 3, p. 1901093, Mar. 2020, doi: https://doi.org/10.1002/ente.201901093. [25] N. Gana, N. F. Ab Aziz, Z. Ali, H. Hashim, and B. Yunus, “A comprehensive review of fault location methods for distribution power system,” Indones. J. Electr. Eng. Comput. Sci., vol. 6, no. 1, 2017, doi: http://doi.org/10.11591/ijeecs.v6.i1.pp185-192. [26] K. S. M. H. Ibrahim, Y. F. Huang, A. N. Ahmed, C. H. Koo, and A. El-Shafie, “A review of the hybrid artificial intelligence and optimization modelling of hydrological streamflow forecasting,” Alexandria Eng. J., 2021. [27] S. Barja-Martinez, M. Aragüés-Peñalba, Í. Munné-Collado, P. Lloret-Gallego, E. Bullich-Massagué, and R. Villafafila-Robles, “Artificial intelligence techniques for enabling Big Data services in distribution networks: A review,” Renew. Sustain. Energy Rev., vol. 150, p. 111459, 2021, doi: https://doi.org/10.1016/j.rser.2021.111459. [28] D. H. Wolpert and W. G. Macready, “No free lunch theorems for optimization,” IEEE Trans. Evol. Comput., vol. 1, no. 1, pp. 67–82, 1997, doi: 10.1109/4235.585893. [29] Y. Shi, Y. E. Sagduyu, T. Erpek, K. Davaslioglu, Z. Lu, and J. H. Li, “Adversarial Deep Learning for Cognitive Radio Security: Jamming Attack and Defense Strategies,” in 2018 IEEE International Conference on Communications Workshops (ICC Workshops), 2018, pp. 1–6, doi: 10.1109/ICCW.2018.8403655. [30] C. Hernández, D. Giral, and H. Marquez, “Evolutive Algorithm for Spectral Handoff Prediction in Cognitive Wireless Networks,” HIKARI Ltd, vol. 10, no. 14, pp. 673–689, 2017, doi: 10.12988/ces.2017.7766. [31] M. Bkassiny, Y. Li, and S. K. Jayaweera, “A Survey on Machine-Learning Techniques in Cognitive Radios,” IEEE Commun. Surv. Tutorials, vol. 15, no. 3, pp. 1136–1159, 2013, doi: 10.1109/SURV.2012.100412.00017. [32] M. S. Ibrahim, W. Dong, and Q. Yang, “Machine learning driven smart electric power systems: Current trends and new perspectives,” Appl. Energy, vol. 272, p. 115237, 2020, doi: https://doi.org/10.1016/j.apenergy.2020.115237. [33] A. Sharifzadeh, M. T. Ameli, and S. Azad, “Power System Challenges and Issues,” in Application of Machine Learning and Deep Learning Methods to Power System Problems, Springer, 2021, pp. 1–17. [34] F. Tao, L. Zhang, and Y. Laili, Configurable intelligent optimization algorithm. Springer, 2016. [35] K.-C. Chang, R. Zhang, H. Deng, F.-H. Chang, H.-C. Wang, and G. D. K. Amesimenu, “Chaotic Particle Swarm Optimization Algorithm for Fault Location of Distribution Network with DG BT,” in International Conference on Advanced Intelligent Systems and Informatics, 2022, pp. 256–266. [36] W.-C. Lin, W.-T. Huang, K.-C. Yao, H.-T. Chen, and C.-C. Ma, “Fault Location and Restoration of Microgrids via Particle Swarm Optimization,” Applied Sciences , vol. 11, no. 15. 2021, doi: 10.3390/app11157036. [37] W. Bao, Q. Fang, P. Wang, W. Yan, and P. Pan, “A Fault Location Method for Active Distribution Network with DGs,” in International Conference on Smart Grid and Electrical Automation (ICSGEA), 2021, pp. 6–10, doi: 10.1109/ICSGEA53208.2021.00010. [38] W. Li, J. Su, X. Wang, J. Li, and Q. Ai, “Fault location of distribution networks based on multi-source information,” Glob. Energy Interconnect., vol. 3, no. 1, pp. 76–84, 2020, doi: https://doi.org/10.1016/j.gloei.2020.03.005. [39] H. Yang, Y. Guo, and X. Liu, “Fault Section Location of Active Network based on Wolf Pack and Differential Evolution Algorithms.,” Int. J. Performability Eng., vol. 16, no. 1, 2020. [40] H. Lala, S. Karmakar, and S. Ganguly, “Detection and localization of faults in smart hybrid distributed generation systems: A Stockwell transform and artificial neural networkbased approach,” Int. Trans. Electr. Energy Syst., vol. 29, no.2, p. e2725, Feb. 2019, doi: 10.1002/etep.2725. [41] S. Beheshtaein, R. Cuzner, M. Savaghebi, S. Golestan, and J. M. Guerrero, “Fault location in microgrids: a communicationbased high-frequency impedance approach,” IET Gener. Transm. Distrib., vol. 13, no. 8, SI, pp. 1229–1237, 2019, doi: 10.1049/iet-gtd.2018.5166. [42] S. K. Yellagoud and P. R. Talluri, “Assessment of Fault Location Methods for Electric Power Distribution Networks,” in 2018 4th International Conference for Convergence in Technology (I2CT), 2018, pp. 1–8, doi: 10.1109/I2CT42659.2018.9058148. [43] D. Sonoda, A. C. Z. de Souza, and P. M. da Silveira, “Fault identification based on artificial immunological systems,” Electr. Power Syst. Res., vol. 156, pp. 24–34, 2018, doi: https://doi.org/10.1016/j.epsr.2017.11.012. [44] X. Wang, X. Yu, Y. Xue, Y. Zhu, and J. Fu, “Application of Improved Quantum Genetic Algorithm in Fault Location of Distribution Network,” in Proceedings of 2018 IEEE 3rd advanced information technology, electronic and automation control conference (IAEAC 2018), 2018, pp. 2524–2529. [45] H. M. M. Maruf, F. Müller, M. S. Hassan, and B. Chowdhury, “Locating Faults in Distribution Systems in the Presence of Distributed Generation using Machine Learning Techniques,” in 2018 9th IEEE International Symposium on Power Electronics for Distributed Generation Systems (PEDG), 2018, pp. 1–6, doi: 10.1109/PEDG.2018.8447728. [46] C. Darab, R. Tarnovan, A. Turcu, and C. Martineac, “Artificial Intelligence Techniques for Fault Location and Detection in Distributed Generation Power Systems,” in 2019 8th International Conference on Modern Power Systems (MPS), 2019, pp. 1–4, doi: 10.1109/MPS.2019.8759662. [47] X. He, Q. Qian, Y. Wang, Y. Wang, and S. Shi, “Adaptive traveling waves based protection of distribution lines,” in 2018 2nd IEEE Conference on Energy Internet and Energy System Integration (EI2), 2018, pp. 1–5, doi: 10.1109/EI2.2018.8582627. [48] B. Nuthalapati and U. K. Sinha, “Fault Detection and Location of Broken Power Line Not Touching the Ground,” Int. J. Emerg. Electr. Power Syst., vol. 20, no. 3, pp. 2–11, Jul. 2019, doi: 10.1515/ijeeps-2018-0321. [49] R. Sharma, O. P. Mahela, and S. Agarwal, “Detection of Power System Faults in Distribution System Using Stockwell Transform,” in 2018 IEEE International Students’ Conference on Electrical, Electronics and Computer Science (SCEECS), 2018, pp. 1–5, doi: 10.1109/SCEECS.2018.8546879. [50] V. Veerasamy et al., “High-impedance fault detection in medium-voltage distribution network using computational intelligence-based classifiers,” Neural Comput. Appl., vol. 31, no. 12, pp. 9127–9143, Dec. 2019, doi: 10.1007/s00521-019-04445-w. [51] A. Khaleghi, M. Oukati Sadegh, M. Ghazizadeh-Ahsaee, and A. Mehdipour Rabori, “Transient fault area location and fault classification for distribution systems based on wavelet transform and adaptive neuro-fuzzy inference system (ANFIS),” Adv. Electr. Electron. Eng., vol. 16, no. 2, pp. 155–166, Jun. 2018, doi: 10.15598/aeee.v16i2.2563. [52] Y. Aslan and Y. E. Yağan, “ANN based fault location for medium voltage distribution lines with remote-end source,” in 2016 International Symposium on Fundamentals of Electrical Engineering (ISFEE), 2016, pp. 1–5, doi: 10.1109/ISFEE.2016.7803203. [53] Z. Sun, Q. Wang, and Z. Wei, “Fault location of distribution network with distributed generations using electrical synaptic transmission-based spiking neural P systems,” Int. J. Parallel, Emergent Distrib. Syst., vol. 0, no. 0, pp. 1–17, Oct. 2019, doi: 10.1080/17445760.2019.1682145. [54] W. Fei and P. Moses, “Fault current tracing and identification via machine learning considering distributed energy resources in distribution networks,” Energies, vol. 12, no. 22, p. 4333, Nov. 2019, doi: 10.3390/en12224333. [55] Y. Hui, X. Yan, Q. Bin, and W. Qi, “Fault Location Method for DC Distribution Network Based on Particle Swarm Optimization,” in 2019 IEEE 2nd International Conference on Electronics Technology (ICET), 2019, pp. 335–338, doi: 10.1109/ELTECH.2019.8839476.
Authors: Diego Armando Giral Ramírez, professor Universidad Distrital Francisco José de Caldas, Bogotá, Colombia. E-mail: dagiralr@udistrital.edu.co Cesar Augusto Hernández Suarez, professor Universidad Distrital Francisco José de Caldas, Bogotá, Colombia. E-mail: cahernandezs@udistrital.edu.co José David Cortes Torres, professor Universidad Industrial de Santander, Bucaramanga, Colombia. E-mail: jose.cortes@saber.uis.edu.co
Source & Publisher Item Identifier: PRZEGLĄD ELEKTROTECHNICZNY, ISSN 0033-2097, R. 98 NR 7/2022. doi:10.15199/48.2022.07.23
Published by Robert CZECHOWSKI, Politechnika Wrocławska, Katedra Elektroenergetyki
Abstract. Smart Grid is both a concept and a way to mitigate infrastructural deficiencies and counteract the effects of the growing demand for electrical energy. One of the ways ensuring an increase in power grid’s management efficiency is utilization of the latest communication solutions. Such solutions ensure reduced energy consumption and leveling curve of daily load, decreased losses and – thanks to automated energy balancing – increased transfer security.
Streszczenie. Smart Grid jest koncepcją i zarazem sposobem na złagodzenie braków infrastrukturalnych oraz przeciwdziałania skutkom rosnącego popytu na energię elektryczną. Jednym ze sposobów zapewniających wzrost efektywności zarządzania elektroenergetycznego jest wykorzystanie najnowszych rozwiązań komunikacyjnych. Rozwiązania takie zapewniają mniejsze zużycie energii, wyrównanie krzywej dobowego obciążenia, zmniejszenie strat dzięki automatycznego bilansowania energii i większe bezpieczeństwo transferu. (Polityka bezpieczeństwa i dobre praktyki w implementacji rozwiązań inteligentnych sieci elektroenergetycznych).
Słowa kluczowe: inteligentne sieci elektroenergetyczne, bezpieczeństwo cyfrowe, inteligentne opomiarowanie, polityka bezpieczeństwa. Keywords: smart power grid, digital security, smart metering, security policy.
Introduction
Development of ICT (Information and Communication Technologies) networks cooperating with virtually every industry sector observed in the recent decades has seen an increased use in comprehensive management in electrical energy transmission and distribution system. This development is headed to in-creased integration of this grid with a power system where the said grid performs more and more functions integrating the system, i.e. the SCADA (Supervisory Control and Data Acquisition) system supervising the technological process, PLC (Power Line Communication) transmission, or encryption and transmission of control commands by use of open communication standards such as PRIME (standard according to Prime Alliance). Thereby, utilization of smart solutions, predominantly those within Smart Metering, performs an increasingly important role in ensuring security and reliability of a power system [1].
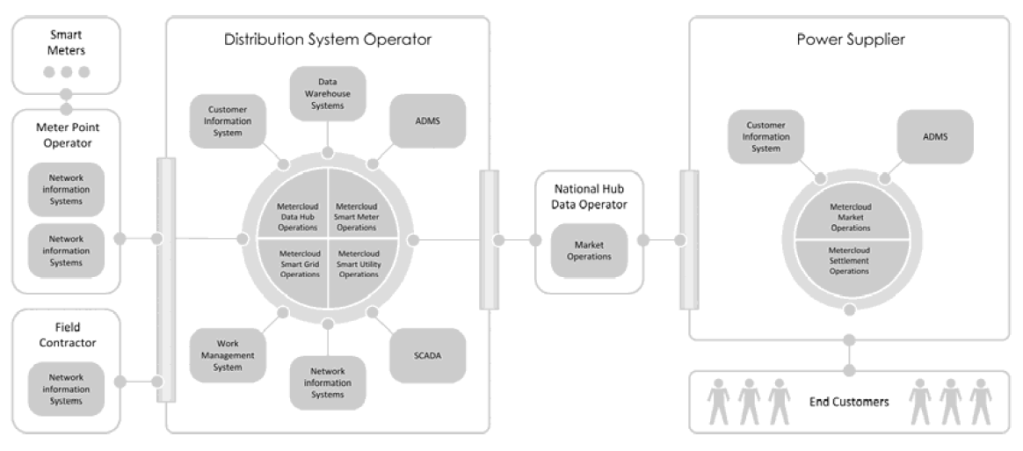
The amazing development of information technology and telecommunications will create new tools that can be used in the energy sector, from centralized process management, data mining to encrypted data transmission by use of PLC and cryptographic algorithms such as AES (Advanced Encryption Standard). Modernization of distribution grids and replacing the traditional electricity meters with smart meters, which is the technical aspect of the modern grid, is not all. A key role that cannot be omitted in such investments is also ensuring electrical security of said grids, which will requires familiarity with many issues that are all but unknown to electrical power engineers such as security specialists. Implementation of automatic metering devices will allow for the structure of a traditional grid to resemble modern ICT (Information and Communication Technologies) grids. Implementation of smart power grids will require cooperation of not only electricians, who will perform the existing installation tasks, but all new specialists in widely understood information technology, from network administrators, ICT security specialists, data base and warehouse administrators, to analytics of the layer managing the processes and business layer (Fig. 1).
The new infrastructure constructed according to the new Smart Grid concept will grant the distribution grid operators not only metering or statistical data that can be used by a given supplier to improve the quality of services or increase the income, but also new challenges related to security, which will be evident in the search for specialists and conducting specialized training courses.
Changes will also include the out-look of hazards each big grid has to face, and security policies which will have to be verified in terms of new design assumptions and potential dangers [2].
If advanced automation of grids and systems is entrusted entirely to external IT companies, it will lead to nobody from the power supplier’s side being fully familiar with these often complex power grids and systems, be it electricians or IT technicians. Moreover, there will be a problem of access to the structure and confidential information of the so-called third party (discussed later in this article), which poses an additional threat to the whole system due to dependency on an independent service provider. It is obvious that such a state cannot adversely affect the power infrastructure security and the power sector’s subjectivity. The two above issues can be resolved by investing in own personnel through creation of an AMI (Advanced Metering Infrastructure) specialized team consisting of electricians and IT technicians or even better – specialists in both these areas.
Basic functionality of the AMI will ensure metering of all endpoints and intermediary points and automation of communication with them. Intrusions and tampering with such functionality usually have very little effect on the entire power system’s performance. One would have a problem with not only tampering with and lowering readings of the meter, but also having to face the risk of depriving many clients of electrical power through mass disconnection of meters’ power (switching the relay in the meter) [3].
Fig.1. Smart Grid Investment Matrix
Next to the completely basic functions of disabling and real-time reading, the AMI has many other functions like control of collection while changing time-zones or displaying prices according to which the automation systems can engage or disengage specific receiver through integration with e.g. the HAN (Home Area Network). Tampering with such functions on a large scale may lead to the power system’s overload or cause problems to any given consumer by exposing them to costs they would not incur without interference of third parties [2].
One of the main hazards is the possibility of cybercriminals or cyberterrorists’ interference, people who seriously impede the continued operation of computer systems and networks, or various electronic systems, depending on the scale of damage [3].
Increased automation and communication within smart grids certainly comes with many benefits, but it is not devoid of flaws, either – due to the availability of the ICT technology in a new, hitherto unknown (for such solutions) branch of industry, there will surely be individuals willing to test their skills and abilities, which will translate into these grids’ increased vulnerability to attacks. Ensuring years of proper functionality of such grids, their safety and protection from cyber criminals or hackers attack becomes a serious problem [4].
Resources protected in smart power grids are: access to management software, inventory of computer equipment, company’s data, personnel (including a list of ICT/AMI specialists), documentation of metering equipment, like e.g. access to the ERP (Enterprise Resource Planning) system and company’s critical data: data concerning contractors, commercial information, data endangering the positive image, ways of unauthorized access, the so-called Information Security Policy [5].
In summary, attacks on smart power grids can be divided as follows:
a) by the attack location in the power supplier infrastructure:
• attack on AMI devices (main meters),
• attack on the data transmission medium, intermediate devices (active and passive),
• attack on the operator’s datacenter (extortion of passwords and access to services by use of various techniques, even bordering on social engineering, attack on access control servers, databases, warehouses and permissions).
b) by the target and scale of a potential attack:
• attack on a single client [6], • attack on the functionality of the entire system or its significant portion [7].
Hazards and security of the Smart Grid
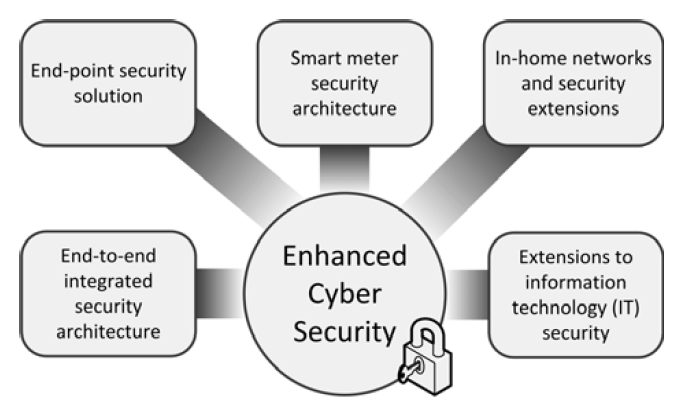
The subject of smart grids has long been taking the leading position in programs and publications related to grid development. Smart grids indicate wide application of innovative solutions, from automated electricity meter readings to full utilization of databases’ functionality (Fig. 2.). These solutions will relate to new innovative uses in most of the already existing technologies, in electrical, IT grids and within the energy market. Smart grids are not only a modern infrastructure, but new products and services offered for the benefit of the customer, which will allow for more efficient management of the power grid. The role of the operator is to ensure a modern, energetically efficient and productive infrastructure allowing service and energy providers for unhindered competitive activities in the conditions of growing participation of distributed generation and the active role of energy consumers [7].
Unlike typical acts of mechanical sabotage, an attack on an electronic energy distribution grid can be carried out with little resources, in a coordinated and very precise way. Moreover, it can be initiated via a public network from remote places and performed in the form of a coordinated attack from multiple places at once. Several places can be attacked simultaneously, which can more quickly contribute to discovering weaknesses of the entire security system [1].
Fig.2. Enhanced Cyber Security
In order to maintain a high level of security, it is necessary to observe predefined procedures and security policies. A grid of meters and concentrators is starting to look more and more like a traditional corporate network, which means that similar security measures can be put in place, including systems for intruder detection, access control and event monitoring. Especially vulnerable to packet data attacks are concentrators which, connected to Ethernet switches, utilize the commonly used TCP/IP protocol [1].
Transformation of the current grid structure into a smart grid necessitates a series of novel security solutions borrowed from already used ones. Typical problems of modern computing include hacking, data theft, and even cyberterrorism, which will sooner or later also affect power grids. Introduction of smart power grids through installation of remote reading meters, electronic grid elements, construction of new information systems consisting of data on energy usage causes energeticists many new security related problems. A complex multi-layered security system requires an overall concept of providing information security.
Security in Smart Grid can be divided into three groups:
a) by the continuity and security of services:
• ensuring continued electrical energy supply at a contractually guaranteed level, binding the supplier and customer (it also concerns cases of bidirectional energy transfer – smart grids with the participation of prosumer),
• ensuring confidentiality of information on clients and security of statistical data generated by them, such as “consumption amount”, time of the greatest energy demand or its total absence,
• security related to energy distribution management process, and telemetry and personal data protection in datacenters,
b) by security class:
• protection from unauthorized access to digital data transmission media and physical security of devices in intermediate stations,
• protection of end-use telemetric devices from unauthorized access, transmission disruption or complete lock of their activities,
• analytical optimization models and decision-making processes,
c) by policy:
• data access policy – user authorization, permission management,
• management security policy – investment processes’ principles and rules,
• system security policy – reaction to incidents, managing confidential information like passwords, cryptographic keys.
Introduction of smart software will contribute to intensified attacks on that grid due to the appearance of a new attack target with a very specific, hitherto unknown architecture which will be a challenge, especially for specialists in computer networks and hosting. ICT systems containing crucial statistical or personal data in one place are particularly exposed to attacks, which will be performed over a computer database on the grid operator’s center. If some grid security measures are broken at that time, especially devices responsible for communication and access to concentrators there will not be a possibility to replace them. The learning and dissemination of an effective method to break the security algorithms will not only undermine the entire system, but also entail more expenditures [8]. This happens because there is no technical possibility to easily and cheaply replace these devices software in terms of increased security during access authorization to data and device control. The only possibility of continuous care for a high level of security of these devices is firmware update, and utilization of authentication and encryption based on ID, serial number, password or hash unique to that device and known only to the operator. Based on a given meter’s ID, the grid operator can generate a unique code (intended solely for communication with that device only) allowing for further authorization.
Unsecured smart grids implemented today might result in a disaster in the future. A person able to bidirectionally transmit data in metering and billing systems can, to a degree, control pre-payment meters and their internal power disconnection mechanisms. Moreover, they can change the tariff assigned to a meter, and make other changes inconvenient to the consumer and expose them to additional expenses.
Utilization of standard information technologies in power systems is a certain benefit, but it also makes these systems vulnerable to capture. It especially concerns communication standards like PRIME, a fully open, low voltage power line communication standard, available free of charge. The main reasons for arising vulnerabilities in a secured infrastructure are:
• implementation errors, • closed and poorly tested software, • errors in system design and security management, •utilization of obsolete or poorly tested technologies, • disregard of information security issues.
Utilized solutions have to ensure enough security so even despite a successful attack on one of the grid component, subsequent security breaks do not entail escalating loss of trust in further equipment or services. When designing a secure power grid, one should assume that it will sooner or later be under an attack by a cybercriminal who is familiar with widely used security measures of ICT systems and has enough practical skills to be able to bypass them and properly authorize his or her access to the Smart Grid [1].
Such actions may be done via uploading malicious software. That is why proper certifications and advanced authentication methods are required. Unfortunately, these aspects are often disregarded by beginner installers and system administrators, which puts the system at risk of serious consequences already at the initial implementation phase. As indicated by experience from very well secured systems (even the banking ones witch specifics make them considered most secure), not even the best security measures are unbreakable. Using any security means is definitely better than not using one, even if they fail to prevent, they at least significantly impede and limit unauthorized access to the smart grid unauthorized people with average skills and knowledge. It is worth noticing that even average security measures significantly prevent form a successful attack by people who should not have such access at all. It is much more difficult to defend yourself against people with much experience who have previously performed successful attacks of that nature, on grids with similar structure and operating principle. In case of an attack by an “proficient specialist”, successful defense depends on multiplicity of mechanisms with various principle of operation, which will ensure enough time for the intrusion prevention or intrusion detection systems to kick in.
Threat classification
Some users are concerned with lack of control over gathering, processing, accessing and using sensitive personal data. The problem, of course, is a little more extensive to this and also concerns unauthorized gathering, acquiring, using and disclosing information obtained by inference from the so-called metadata. That is why it is necessary to implement a comprehensive security strategy for information transfer, personal and telemetry security. Smart Grid and Smart Metering, which simultaneously identify specific devices and their utilization, can disclose clients’ profiles and pose new threats to their privacy, such as:
• identity theft,
• disclosure of personal behavioral patterns,
• gathering and grouping consumers by behavioral patterns,
• possibility of disclosure of controlled devices located in a given house or apartment,
• real-time usage monitoring – danger of revealing a consumer’s absence in a house or apartment,
• manipulating energy prices transferred to a meter; e.g. transferring a significantly lowered price of energy during peak hours and displaying it for many consumers can cause even a significant shift in behavior in terms of energy usage, a significant increase in energy consumption by many consumers deceived that way might be dangerous to the grid.
Threat sources
The growing energy telecommunication grid is increasingly vulnerable to actions that could disrupt its operation. It is possible to both intercept important information, especially of administrative nature, related to energy commerce, and perform an attack to block the functioning of a given grid portion or service (like access to the database server). What may be particularly dangerous is a potential blockade of real-time information transferring grid functionality related to security and control. Intrusions to the grid can also be performed by authorized users from within the system.
The most common threats to information systems include:
• blocking access to a service, • hacking into an information system’s infrastructure, • data loss, •data theft, • confidential data disclosure, • information falsification, • software code theft, • hardware theft, • damage to computer systems [2].
Making an ICT power grid available for the needs of external users is a potential source of threat. It is necessary to separate information transferred for the needs of the power sector to the eternal traffic. Moreover, the administrative and office traffic should also be separated from traffic related to remote supervision over energy facilities. The most commonly encountered problems related to incorrect grid architecture design and its management are:
• lack of proper security architecture, • errors in information security management, • software errors, • human errors and intentional actions, • insufficient security monitoring.
Lack of clear separation of these grids could potentially cause an intrusion into a power plant control system or a distribution system by way of access through the administrative network, or cause actions blockade and deletion of data from the SCADA system. The causes of such threats are found in:
• vulnerabilities of operating systems which are potential targets for hackers attacks,
• unsatisfied employees, e.g. a fired employee might attempt hacking for revenge or sabotage, incorrectly installing antivirus software and planting malicious software that will cause damage within the smart grid.
Security policy
Systems performing security-related functions consist of such elements as: sensors, programmable devices, communication systems, actuators and power. Abuse related to ICT systems security and failures are becoming increasingly commonplace, possibly resulting in enormous financial losses, lost reputation, high repair costs and even business failure [1].
Smart Grids are of ever more significant strategic value in terms of energy security. A smart grid is a modernization of existing power grids, but it will be subject to the same elementary requirements put forwards for computer networks. In order to ensure basic security, all of the below conditions have to be met:
• confidentiality – ensuring the information is available only to authorized individuals,
• integrity – ensuring accuracy and completeness of information and processing methods,
• availability – ensuring that the authorized individuals have access to information and related assets when it is needed.
In case of violation or failure in meeting the above key norms of AMI systems security infrastructure management, the following rules should be observed:
• each change system configuration requires verification for compliance with security policy,
• failure to observe the system’s security policy norms should cause it to be physically disconnected from the grid,
• decision to connect or disconnect the system should me bade by authorized individuals.
Moreover, one should follow a principle of assigning permissions for applications, grid active devices and database systems with regard to permission hierarchy of people managing the entire power system. Access to the resources should only be limited to people allowed to have it. One should also determine:
• the level of acceptable risk, • access control mechanisms, •access authorization and identification mechanisms, •recording changes made within the system: regarding configuration and data modification.
Moreover, it becomes increasingly important to ensure data verification, reliability and security. In order to decrease the amount of incorrect data, grids are secured from attempts to hack and manipulate data hackers should have no access to. Security policy procedures that hamper the work of normal application users are constantly added to. It is not difficult to predict the consequences of such a security policy. Security of a system protected this way becomes more and more unattainable. That is why user authorization or access control that differs from statistical passwords becomes the increasingly important [1].
A power system can be considered as one of the most critical systems of strategic importance in functioning of the entire country. Inactivity or destruction of such a system would weaken national security or economic and social wellbeing of the society and its neighbors, both in the physical world and cyberspace. Protection of the most important infrastructures includes:
• physical security encompassing all predictable threats regarding human errors, systems protection from physical destruction or tampering e.g. with the circuitry, and natural disasters,
• cyber security, a security policy which, apart from the organizational concept of security supervision, includes legal regulations, research work, training courses, etc.
Fig.3. Paths of information flow in Smart Grid
Presently, the functioning of a power grid and efficient control of its operation depend on various computers, computer networks, software and communication technologies, from the point of view of efficient control (Fig. 3).
While creating one’s own security policy, it is a very good practice to place oneself in the role of an attacker. It allows for avoiding the most common mistakes, at the designing stage. Unauthorized interference of a cybercriminal with a computerized power infrastructure may lead to enormous losses resulting both directly (e.g. inability of the enterprise to perform daily operation) and indirectly (e.g. failure to carry out contracts on time, loss of company good image) from power shortage of particular consumers [9].
Security policy model
A critical and often neglected component of this process is a security policy which usually takes the following form: threat model – security policy – security mechanisms.
Security policy is understood as a document which clearly and concisely states the intended tasks of security mechanisms. It results from our understanding of the threats and is a key influence on the construction of our systems. A security policy often takes the form of certain statements regarding which users can have access to which data. It plays the same role in both specifying the requirements of the security system and assessment whether these requirements have been met, similarly to system specification in regards to overall functionality. Indeed, a security policy can be a part of system specification and, just like specification, its main role is to maintain communication.
Security policy model is a concise expression of security properties that are to be present in a system or a generic system type. It is a document in which the entire environment or customer management agrees on security goals. It can also be the basis for a formal mathematical analysis. Security goal is a more detailed description of security mechanisms ensured by specific implementation and their relation to the security goals list. Finally, there is also third the use of the term “security policy” which refers to a list of configuration settings of a security-related product [10].
Monitoring systems
A significant number of secured systems is related to environment monitoring. The most obvious example are electricity consumption meters.
We focus mainly on attacks on communication means (although damaging meters is also somewhat of a concern), but many other monitoring systems are very vulnerable to physical damage. Water, energy and gas consumption meters are usually located within rooms belonging to consumers who may have reasons to cause incorrect meter readings. Such devices are also at a great risk of tampering. In both metering and monitoring systems, we have to provide evidence in order to prove tampering. The opponent could gain the upper hand by not only falsifying communication (e.g. by repeating old messages) but also falsely stating that someone else has done it. [11].
Cyberterrorism
It is quite a challenge to protect each and every one of extensive distribution systems, with cyberterrorism becoming a particularly serious problem. These days, destroying important objects (factories and power plants, but also computer databases) does not require significant power or resources. Examples show that a single person with proper knowledge and access to computer technology is able to perform a successful attack on a power grid. Additionally, cyberterrorism is cheap, it does not put the perpetrator in immediate danger and can be catastrophic in results. By disrupting the operation of banking computer systems, a cyberterrorist could cause a collapse of the world economy. By introducing false data into systems managing a military, power and fuel in-frastructure, they could initiate explosions of pipelines, demolition of water intakes and destruction of nuclear power plants [12].
Conclusion
Power grids with transformer stations as nodes and high-voltage lines as edges (in graphical representation) often fall to local failures. Still, in most cases damage resulting in failures of individual stations or transmission lines does not have any significant impact on the functioning of the entire grid. The role of the station (or line) that has been damaged is temporarily taken by a neighboring station (accordingly parallel), and the entire system operates properly. From time to time, however, there are such failures in a power grid where a single failure triggers a cascade of further events and causes transformer stations in large geographical areas to shut down, resulting in enormous financial losses.
This paper was realized within NCBR project: ERA-NET, No 1/SMARTGRIDS/2014, acronym SALVAGE. “Cyber-Physical Security for the Low-Voltage Grids”
REFERENCES
[1] Flick T., Morehouse J., Securing the Smart Grid. Next Generation Power Grid Security, Elsevier Inc. 2011. [2] Wilczyński A., Tymorek A., Rola i cechy systemów informacyjnych w elektroenergetyce, Rynek energii, 2 (87) 2010. [3] Billewicz K., Samrt metering. Inteligentny system pomiarowy., Instytut Energoelektryki Poli-technika Wrocławska, Wydawnictwo Naukowe PWN, 2012. [4] Ball P. Masa krytyczna, Wydawnictwo Insignis, Kraków, 2007. [5] Billewicz K., Problematyka bezpieczeństwa informatycznego w inteligentnych sieciach., Instytut Energoelektryki Politechnika Wrocławska, 2012. [6] Electronic Privacy information Center, Concerning Privacy and Smart Grid Technology, The Smart Grid and Privacy, dostępne w: epic.org/privacy/smartgrid/smartgrid.html, 27.11.2014. [7] Czyżewski R., Babś A., Madajewski K., Sieci inteligentne – wybrane cele i kierunki działania operatora systemu dystrybucyjnego., Acta Energetica, 2012, nr 1, 30-35 [8] A.T. Kearney GmbH, Raport Technologiczny, Infrastruktura Sieci Domowej (ISD) w ramach Inteligentnych Sieci / HAN within Smart Grids., 2012, [9] Żurakowski Z., Safety and Security Issues in Electric Power Industry, 19th International Con-ference SAFECOMP 2000, Rotterdam, The Netherlands, October 2000. [10] Anderson R.J., Inżynieria zabezpieczeń (Model polityki bezpieczeństwa), Wydawnictwo Nauko-wo-Techniczne, Warszawa 2005, [11] Anderson R.J., Inżynieria zabezpieczeń (Systemy monitorujące), Wydawnictwo Naukowo-Techniczne, Warszawa 2005, [12] Fronczak A., Fronczak P., Świat sieci złożonych. Od fizyki do Internetu. Wydawnictwo PWN, 2009 r.
Author: MSc Eng. Robert Czechowski, Power System Control and Protection Division – Department of Electrical Power Engineering, Wroclaw University of Technology, 50-370 Wrocław, Wyb. Wyspiańskiego 27, e-mail: robert.czechowski@pwr.edu.pl.
Source & Publisher Item Identifier: PRZEGLĄD ELEKTROTECHNICZNY, ISSN 0033-2097, R. 92 NR 3/2016. doi:10.15199/48.2016.03.42
Published by 1. Wichet THIPPRASERT, 2. Annop RUPDEE, Department of Electrical Engineering, Faculty of Engineering, Rajamangala University of Technology Lanna Chiang Rai, 99 Sai Khao, Phan, Chiang Rai, 57120, Thailand. ORCID: 1. https://orcid.org/0000-0002-7773-4331; 2. https://orcid.org/0000-0002-1657-870X
Abstract. This research is aimed to test the high voltage (HV) polymeric insulators to study Electrical Performance and deterioration at the insulator’s surface under the wheel test conditions. The samples of this research are four new silicone rubber with fiber-reinforced plastic rod insulators, FXB 22/70 model 22 kV that randomized from the commercial market in Thailand. The experiments in this research are the IEC/TR 62730 standards HV polymeric insulators for indoor used tracking wheel test. The results found that the samples’ resistance before and after the wheel test of 30,000 cycles has the lower resistance of 10 mm distance on the samples of 37.0 and 7.76 GΩ, respectively. The sample resistances were higher than 2 MΩ resistances, less than 3 mm erosion depth, and no punctured on the shed, housing, or interface that the criteria of the IEC/TR 62730 standards are accepted. Further, the hydrophobicity of the samples before and after the treatment were reduced from HC 1 to HC 6 that classified use STRI’s guide. The average leakage currents of the first 10,000 and 30,000 cycle’s wheel test were 0.037 mA and 0.074 mA, respectively. While, after 6,000 cycles of the test, the thermography showed that the areas at the end of insulator near the ground terminal were higher temperature than other, else after 30,000 cycles test, the insulator’s temperatures were higher at the core rod. Furthermore, the 1000x SEM photography shown that the three punched samples of the insulator’s surfaces of the new were smooth. After 15,000 cycles, the skins have aging than more and deeper textures after 30,000 cycles testing. Besides, the Fourier transform infrared spectroscopy found that the ATH of the samples before and after the treatment was reduced from 3,445.4 cm-1 to 3,367.8 cm-1, while other composites were not significantly different. Also, the results of low frequency dry flashover voltages of new and tested samples were 133.8 and 140.0 kV, respectively. The low frequency wet flashover voltages of before and after the wheel tested was 115.5 and 107.3 kV, respectively. Finally, the impulse flashover voltage test shown that the positive “polarity lightning impulse voltages of the new and tested samples were 235.4 and 231.53 kV, and the negative” polarity lightning impulse voltages were 261.9 and 256.4 kV, respectively.
Streszczenie. Niniejsze badanie ma na celu przetestowanie izolatorów polimerowych wysokiego napięcia (WN) w celu zbadania wydajności elektrycznej i pogorszenia się powierzchni izolatora w warunkach testu koła. Próbki z tego badania to cztery nowe gumy silikonowe z izolatorami prętowymi z tworzywa sztucznego wzmocnionego włóknami, model FXB 22/70 22 kV, które zostały losowo wyselekcjonowane z rynku komercyjnego w Tajlandii. Eksperymenty w tych badaniach to zgodne z normą IEC/TR 62730 polimerowe izolatory wysokiego napięcia do badań metoda karuzelowa w pomieszczeniach. Wyniki wykazały, że rezystancja próbek przed i po teście kołowym 30 000 cykli ma mniejszą rezystancję odległości 10 mm na próbkach odpowiednio 37,0 i 7,76 GΩ. Rezystancje próbki były wyższe niż rezystancje 2 MΩ, głębokość erozji mniejsza niż 3 mm i brak przebicia na osłonie, obudowie lub interfejsie, zgodnie z kryteriami normy IEC/TR 62730. Co więcej, hydrofobowość próbek przed i po obróbce została zmniejszona z HC 1 do HC 6, które sklasyfikowano według przewodnika STRI. Średnie prądy upływu pierwszego testu koła 10 000 i 30 000 cykli wynosiły odpowiednio 0,037 mA i 0,074 mA. Podczas gdy po 6000 cykli testu termografia wykazała, że obszary na końcu izolatora w pobliżu zacisku uziemienia miały wyższą temperaturę niż inne, w przeciwnym razie po 30 000 cyklach testu temperatury izolatora były wyższe na rdzeniu pręta. Co więcej, fotografia 1000x SEM pokazała, że trzy próbki wycięte (przygotowane) powierzchni nowego izolatora były gładkie. Po 15 000 cykli skóra starzeje się bardziej i głębsze tekstury po 30 000 cyklach testowania. Poza tym spektroskopia w podczerwieni z transformacją Fouriera wykazała, że ATH próbek przed i po obróbce zmniejszyło się z 3445,4 cm-1 do 3367,8 cm-1, podczas gdy inne kompozyty nie różniły się istotnie. Również wyniki napięć suchego przeskoku niskoczęstotliwościowych próbek nowych i badanych wyniosły odpowiednio 133,8 i 140,0 kV. Napięcia przebicia mokrego o niskiej częstotliwości przed i po badanym kole wynosiły odpowiednio 115,5 i 107,3 kV. Wreszcie, test napięcia udarowego przeskoku wykazał, że dodatnie „napięcia udaru piorunowego polaryzacji nowych i badanych próbek wyniosły 235,4 i 231,53 kV, a ujemne” napięcia udaru piorunowego polaryzacji wyniosły odpowiednio 261,9 i 256,4 kV. (Wydajność elektryczna izolatora kompozytowego zgodnie ze standardowym testowaniem IEC / TR 62730 dla systemu dystrybucji 22 kV)
Keywords: Composite Insulator, Tracking Wheel Test, Electrical Performance. Słowa kluczowe: Izolator kompozytowy, Metoda karuzelowa, Właściwości elektryczne.
Introduction
Insulators play important role for proper performance of transmission and distribution lines for power systems. Insulators are varied by design, types of voltages and types of material used for production of insulators. The exact insulators are installed in appropriate power system based on type of voltage. The insulators work in outdoor; they endure some influences which come from rain, fog, snow, sunlight, pollution, corrupt electric dust and salinity in the air. Therefore the basic demands of insulator are that they own enough electric insulated strength; they can support stated mechanical load; they can endure disadvantage environment and atmosphere effect. The tremendous growth in the application of non-ceramic composite insulators is due to their advantages over the traditional ceramic and glass insulators. The advantages are light weight, resistance to vandalism, better performance in the presence of heavy pollution in wet conditions and better withstand voltage [1] than porcelain insulators.
Withstand ability of insulators under polluted conditions are some of the most important factors, which determine the insulation level of distribution system.
The continuous operation of distribution system mainly depends on the environment and weather conditions, insulation design, which may cause flashover on polluted insulators leading to system outages, if the design is inadequate. Most insulators are used outdoors, on high voltage overhead distribution lines and in substations, and are required to withstand extreme changes in environmental conditions[1],[2].
Therefore to guideline for solving problems above, in this work to study electrical performance of HV polymer insulation for tracking indoor and outdoor applications and erosion by testing wheels used to provide general indications about the quality of design and materials related to stresses that occur in pollution environments. This test is based on the IEC 62730 standard.
Fig.1. Composite insulator, Type FXB-22/70, Rated voltage 22 kV
Table 1. Parameter of tested Composite Insulators
.
Test Specimens
The test specimen is a FXB-22/70 composite insulator, Its structural parameters and structure schematic diagram are shown in Fig. 1 and Tab. 1, H is the structure height, h is arc distance, L is creepage distance, and D is diameter distance.
Tracking Wheel test and Test Procedure
The IEC method is based on simultaneous testing of four specimens, mounted on a “wheel”, as shown in Fig. 2. During the test the specimens go in one cycle through four positions, where they remains stationary for approximately 40 s. In the first part of the cycle, the insulator is dipped into a saline solution. The second part of the test cycle permits the excess saline solution to drip off the specimen. In the third part the specimen is connected to a power frequency voltage. In the last part of the cycle the surface of the specimen that has been heated by the arcing discharges is allowed to cool. The main test parameters are listed in Tab. 1. The IEC standard [3] required that the total test voltage will be 28.6 V/mm multiplied by the creepage distance. The creepage distance of the tested composite insulator was estimated as 815 mm.
This test was performed at 20 ± 5 °C salinity and 1.40 kg/m3 ± 0.06 kg/m3 under 23.3 kV electrical stresses in accordance with the wheel test of IEC/TR 62730 [3]. This is a well-established standard technique, and the data presented is specifically applicable to the polymeric insulators and silicone rubber materials [2].
Fig.2. Tracking wheel test arrangement, IEC standard [3]
Fig.3. Model of test setup at High Voltage Laboratory. 1) Water Tank 1.6 m3 2) Composite Insulators 3) High Voltage 4) Structure 5) HV Bussing 6) Motor and Control set
For salt solution will need to change the salt solution used to dip insulators 1 times a week so that each week there is a break (Interruption period) for checking insulators. During this test break must not exceed 1 hour and will not be included in the total testing period. In addition, there can be 1 longer period of normal suspension than 60 hours and 1 additional test period The additional wheel for 3 times the total duration of the test stop test report must record all test intervals. In Fig. 3 is shown model of test setup according to IEC standard[3],[4].
Table 2. Test parameters in standard IEC test procedure [3]
.
Results Analysis and Discussion
During the initial phase of the study involving the accelerated aging tests performed on the 22 kV composite insulators, the level of salt deposition on the surface of insulators was low. The parameters to be studied and analysed like the dissipation factor and leakage current showed low values. However, from the transition periods up until the completion of 30,000 cycles, the polymer insulators showed considerable changes in the above mentioned parameters.
Insulation Resistance Surface of Composite Insulator Measurement
The surface insulation resistance was measured under 4 cases; Top, Middle, Bottom and Overall. In each case, the measurement was made between 2 points and follows; Top, Middle and Bottom: Two adjacent points at the top or Middle or Bottom of the insulator, with 5 mm to 10 mm spacing interval. And Overall: The topmost and the bottommost points of the test object, as shown in Fig. 4. At ambient temperature 29.2 °C, Relative humidity 70.1 % and atmospheric pressure 100.858 kPa.
Fig.4. Testing of surface insulation resistance
According to IEC/TR 62730 Standard the test is regarded as pass, if on both test specimens: Not tracking, (a Meg Ohm-meter shall be applied along any suspect path, using 1 kV DC or higher. The probes shall be between 5 mm to 10 mm a part. A resistance of less than 2 MΩ shall constitute failure), For Composite Insulators: erosion shall not reach the core and in any case the erosion depth shall be less than 3 mm, resin insulators: erosion depth is less than 3 mm. And not shed, housing or interface is punctured [3].
Table 3. Insulation resistance surface
.
Surface insulation resistance testing of composite insulator at Top, Middle, and Bottom or Overall, it is reduced more than 68.2 percent’s of Middle specimens shown in Tab. 3. When observed and analyzed by SEM technique to evaluate the performance and degradation of Composite Insulators in Fig.5 and Fig. 6. The result showed in Fig. 6 the EDAX spectra of untreated fresh sample without pollution (a) and after test 30000 cycle (b). Fig. 6 (b) present chemical composition analysis then treated insulator sample, found that the surface sample increase oxygen percentage and the carbon percentage decreased compared with the bulk samples. It was hypothesized and demonstrated that the methyl groups were oxidized into O-H groups in these surface structure regions with moisture (H2O) and surface composite insulator was the backbone polymer was formed by chain of carbon atom which carbon had decreased from electrical discharge.
Fig.5. SEM micrographs of fractured surfaces of composite insulator after 0, 15,000, 20,000 and 30,000 cycles (S0, S15,000, S20,000 and S30,000) aging in tracking wheel
The other chemical content of external pollutant materials collected from the surface. This material includes elements such as calcium, aluminum and iron.
Additionally, detached material from the insulator’s steel grading ring, such as zinc from the galvanization layer and iron, is also present. Environmental salts such as chloride, and magnesium are also present. These pollutants, in the presence of moisture, contribute greatly to the increase in the conductivity of the insulator surface, hence increasing frequency of corona discharges. Deterioration in insulation properties and increase in surface conductivity of the insulator cause increasing corona discharge intensity and frequency. Such increase in conductivity is mainly due to accumulated contaminants such as salts, earth materials and other pollutants [5],[6],[7].
Impedance measurement of Composite Insulator
Impedance measurement of composite insulators testing at ambient temperature 29.6 C, relative humidity 69.1 % and atmospheric pressure 100.885 kPa.
At 30,000 cycles testing, insulation resistance of composite insulator reduced by 11.69% shown in Tab. 4. It is deterioration in insulation properties and increase in surface conductivity of the insulator cause increasing corona discharge intensity and frequency. Such increase in conductivity is mainly due to accumulated contaminants. When receiving high voltage therefore causing some discharges Resulting in an increased leakage current which results in the heat of the contaminated wet insulation surface in Fig.8.
Fig.6. EDAX results of untreated fresh sample without pollution: p1 (a) And after test 30,000 cycles: p2 (b)
Table 4. Impedance measurement of composite insulators at 30,000 cycles testing
.
Table 5. Power-frequency Dry flashover voltage test
.
Table 6. Power-frequency Wet flashover voltage tests
.
where :Va : Average value of voltage under actual test condition; Vs : Voltage under standard atmospheric condition
Table 7. Lightning Impulse Wet Flashover Voltage Test
.
Where V50 : Calculation of 50% disruptive voltage, Va : V50 Under actual test condition; Vs : V50 Under standard atmospheric condition
Fig.7. Test Circuit of Impedance measurement
Fig.8. The waveform of leakage current during partial discharge at 30000 cycles
At 30,000 cycles testing, insulation resistance of composite insulator reduced by 11.69% shown in Tab. 4. It is deterioration in insulation properties and increase in surface conductivity of the insulator cause increasing corona discharge intensity and frequency. Such increase in conductivity is mainly due to accumulated contaminants. When receiving high voltage therefore causing some discharges Resulting in an increased leakage current which results in the heat of the contaminated wet insulation surface in Fig.8.
Power frequency Flashover Voltage Test
According to IEC Standard[3]. Fig.9 test circuit consist of K1: Circuit breaker, KM2-F-800 Frame, KM2-T500 Trip unit, TR: Regulating transformer “HIPOTRONICS, INC” 380/0- 400V, CT: Current transformer 100T, W/R 365/U core, ratio 500/5 A, A: Ammeter for output regulating transformer “WESTON” type 1944, 5 A, W/0-500 VAC, V: Voltmeter for output regulating transformer “API” type 7045-50Ua, 5A, W/0-500 VAC, K2: Secondary contactor “ASEA” EG 315 size 5, TT: Testing transformer “HIPOTRONICS, INC” model 7300-150,150 kVA, 400V/0-300 kV, VD: Voltage divider, bushing “LAPP” style POC-A, C1 = 382 pF ,C2 = 2146 pF, PV: AC Peak voltmeter “API” type 7045-50Ua, W/0-60/120/320 kV and O: Object under test.
Fig.9. Power frequency wet flashover voltage test
Lightning Impulse Wet Flashover Voltage Test
Fig.10. Lightning Impulse Wet Flashover Voltage Test
Lightning impulse wet flashover voltage test circuit consist CS: Charging capacitor, SF: Spark gap, RP: Parallel resistor, RS: Series resistor, CL: Load capacitor, O: Test object, R1: H.V. arm resistor of voltage divider, C1: H. V. arm capacitor of voltage divider, R2: L.V. arm resistor of voltage divider, C2: L.V. arm capacitor of voltage divider, Rm: Matching resistor 75 Ω, ZC: Measuring cable “ZUHNER” 75 Ω 30 m, CC: Measuring cable capacitance 67 pF/m, kV: Impulse peak voltmeter “HAEFELY” Model SV642, OSC: Digitizing recorder “High Volt” Model “HiRES Digital Recorder” in Fig.10. At 100.712 kPa, 30.3°C, atmospheric pressure 100.7 kPa, Humidity 71.0 %, 0.905 inHg, 21.9 g/m3. Calculation of 50 % disruptive discharge voltage V50.
Electrical Discharge Phenomenon
During the test cycles, the contaminant deposition occurs on the surface of the polymer insulator. This causes an increase of leakage current and electric discharge which results in corona discharge and heating of the wet contaminated insulator surface by inequalities due to the mold shown in Fig. 11 and Fig.12. The dielectric loss of the surface layer of silicone rubber under alternating electric field is the main cause of local temperature rise of the composite insulator.
Fig.11. Electrical discharge phenomenon at 30,000 cycles
During the application of the test voltage the leakage current causes the evaporation of water on part of the surface. This causes dry band arcing on the surface of the polymer insulators. Frequent occurrence of such electrical discharge causes erosion and tracking of composite insulators. The results showed that the composite insulator would appear abnormal heating under the ageing condition of high temperature, high humidity and salt fog[6],[7].
Fig.12. Thermal image of composite insulator at 30,000 cycles
Electrical Performance Testing
At 30,000 cycles Test, in order to check up the specimens electric character, the dry power flashover, the wet power flashover and the impulse power test are carried out to them shown in Fig.13-15 respectively. The results shown in Tab. 5-7, the surfaces of the samples have no obvious crack and dilapidation. Though after 30,000 cycles test, all samples still rather higher electromechanical properties.
Fig.13. Power frequency Dry flashover voltage test
The dry power flashover and wet power flashover test results are shown in the Tab. 5 and Tab. 6. After 30,000 cycles test , the dry flashover is close to that’s the former, hut the wet flashover decrease about 17.8% on the average, which is still higher than the 22 kV the voltage of which were put on the samples during the cycles test shown in Tab. 6.
The wet flashover voltage decreased linearly under the improved multi-stress ageing condition, while the hydrophobicity of the shed showed a nonlinear ageing characteristics, whose change rate increased gradually. The hydrophobicity loss caused by moisture absorption of silicone rubber causes the static contact angle cannot reflect the wet flashover characteristics of the composite insulator directly.
Fig.14. Power frequency Wet flashover voltage test
Fig.15. Lightning Impulse Wet flashover voltage test
Lightning Impulse Flashover Voltage Test
Typical lightning impulse discharge processes of composite shown in Fig. 15. The flashover channel of the composite insulator is a convex arc and outward slightly in the air around the insulator and the discharge path of the composite insulator is in the air gap. All the samples passed through the impulse power test, which were put on the impulse power with positive polarity and negative polarity five times respectively shown in Tab.7.
Conclusion
In this paper to study electrical performance of HV composite insulator for tracking indoor and outdoor applications and erosion by testing wheels at 30,000 cycles later testing. The conclusions are given as follows:
1. Insulation resistance surface testing of Composite Insulator is reduced more than 68.2%. These pollutants such as calcium, aluminum and iron, in the presence of moisture, contribute greatly to the increase in the conductivity of the insulator surface, hence increasing frequency of corona discharges. Deterioration in insulation properties and increase in surface conductivity of the insulator cause increasing corona discharge intensity and frequency. Such increase in conductivity is mainly due to accumulated contaminants such as salts, earth materials and other pollutants. The dielectric loss of silicone rubber after moisture absorption can effectively reflect the moisture absorption characteristics and the dielectric properties of the material after moisture absorption.
2. Hydrophobicity of a material can be described using SEM technique to evaluate the performance and degradation of the material. The surface of the sample become very rough, and defects such as minute holes and cracks appeared, and large amount of minute particles adhered. Because surface conductivity of the insulator cause increasing corona discharge intensity and frequency.
3. Leakage current is directly proportional to hydrophobicity loss. The more is the hydrophobicity loss, the more the leakage current become, see e.g.[1],[2],[6],[7]. The dielectric loss of the surface layer of silicone rubber under alternating electric field is the main cause of local temperature rise of the composite insulator.
4. Power frequency dry and wet flashover voltage test. The dry flashover is close to that’s the former, but the wet flashover decrease about 17.8% on the average. The wet flashover voltage decreased linearly under the improved multi-stress ageing condition, while the hydrophobicity of the shed showed a non-linear ageing characteristics, whose change rate increased gradually.
5. Lightning impulse flashover voltage test, all the samples passed through the impulse power test.
Acknowledgements – This research was supported and funded by faculty of engineering, Rajamangala university of technology Lanna Chiang Rai, Chiang Rai, Thailand.
REFERENCES
[1] Rahul C, Studies on Silicone Rubber Insulators used for High Voltage Transmission (Master’s Thesis, Department of Electrical Engineering, Indian Institute of Scienc, 2017), 4-5. [2] Kuffel E, Zaengl W.S, and Kuffel J, High Voltage Engineering: Fundamentals” 2nd Ed., Newnes, (2000), 522-528. [3] “IEC/TR 62730” HV polymeric insulators for indoor and outdoor use tracking and erosion testing by wheel test and 5000 h test, (2012). [4]. “IEC 62217” Polymeric insulators for indoor and outdoor use with a nominal voltage greater than 1000V – general definitions, test methods and acceptance criteria, 2012. [5] Thong-Om S, Payakcho W, Grasaesom J, Oonsivilaiand A and Marungsri B, Comparison Ageing Deterioration of Silicone Rubber Outdoor Polymer Insulators in Artificial Accelerated Salt Fog Ageing Test, World Academy of Science, Engineering and Technology International Journal of Chemical, Molecular, Nuclear, Materials and Metallurgical Engineering, 5(2011). [6] Zhang Z, Liang T, Jiang X, Li C, Yang S, and Zhang Y, Characterization of Silicone Rubber Degradation Under Salt-Fog Environment With AC Test, IEEE Trans., 7(2019), 66714 -66724. [7] Chengrong L, Xiaoming H and Linjie Z. Image, Analysis on the Surface Hydrophobicity of Polluted Silicone Rubber Insulators. International Conference on Condition Monitoring and Diagnosis, Beijing, China (2008), 1-4.
Authors: Asst.Prof.Wichet THIPPRASERT, Department of Electrical Engineering, Faculty of Engineering, Rajamangala University of Technology Lanna Chaing Rai, Chiang Rai, Thailand. Annop RUPDEE, Working toward M.Eng. in Electrical Engineering, Department of Electrical Engineering, Faculty of Engineering, Rajamangala University of Technology Lanna Chiang Rai, Chiang Rai, Thailand.
Source & Publisher Item Identifier: PRZEGLĄD ELEKTROTECHNICZNY, ISSN 0033-2097, R. 98 NR 2/2022. doi:10.15199/48.2022.02.08
Published by M.S. ALI1,2, Mahidur R SARKER3, Mohamad Hanif Md SAAD3, Ramizi MOHAMED1, 1Department of Electrical, Electronic and Systems Engineering, Faculty of Engineering and Built Environment, Universiti Kebangsaan Malaysia, Bangi 43600, Malaysia; 2Electrical Engineering Department, German-Malaysian Institute , Jalan Ilmiah, Taman Universiti,43000, Kajang, Selangor, Malaysia; 3Institute of IR 4.0, Universiti Kebangsaan Malaysia, 43600 UKM Bangi, Selangor, Malaysia. ORCID. 1. 0000-0001-7142-7755, 2. 0000-0002-5363-6219, 3. 0000-0002-1587-964X, 4. 0000-0003-1534-6760
Abstract. Flywheel energy storage system (FESS) technologies play an important role in power quality improvement. The demand for FESS will increase as FESS can provide numerous benefits as an energy storage solution, including a long cycle life, high power density, high round-trip efficiency, and environment friendly. A high-efficiency system is a necessity and a significant element of the overall system in this application. This is because the system determines the size, cost, efficiency, and reliability of the FESS for any application. As a result, choosing an acceptable system topology is a crucial and fundamental part of developing a FESS for portable or residential applications, and it has a big impact on the system’s overall performance. This paper presents an overview of all types of power electronic and controlled system application in FESS, contain numerous topology combinations of DC converters and AC inverters, that are generally employed in FESS for portable or home applications. The switching and controlled system strategies in power conditioning or motor generator synchronisation for FESS are also discussed in this study. Finally, the current problem with FESS is addressed in this study, which comprises a regulated system for system synchronisation with a DC converter and an AC inverter.
Streszczenie. Technologie systemów magazynowania energii w postaci koła zamachowego (FESS) odgrywają ważną rolę w poprawie jakości energii. Zapotrzebowanie na FESS wzrośnie, ponieważ FESS może zapewnić liczne korzyści jako rozwiązanie do przechowywania energii, w tym długi cykl życia, wysoką gęstość mocy, wysoką wydajność w obie strony i przyjazność dla środowiska. W tej aplikacji system o wysokiej sprawności jest koniecznością i istotnym elementem całego systemu. Dzieje się tak, ponieważ system określa rozmiar, koszt, wydajność i niezawodność FESS dla każdego zastosowania. W rezultacie wybór akceptowalnej topologii systemu jest kluczową i fundamentalną częścią opracowywania FESS do zastosowań przenośnych lub domowych i ma duży wpływ na ogólną wydajność systemu. W artykule przedstawiono przegląd wszystkich rodzajów aplikacji energoelektronicznych i systemów sterowanych w FESS, zawierających liczne kombinacje topologii przekształtników DC i falowników AC, które są powszechnie stosowane w FESS do zastosowań przenośnych lub domowych. W niniejszym opracowaniu omówiono również strategie przełączania i sterowania systemowego w kondycjonowaniu mocy lub synchronizacji generatora silnika dla FESS. Na koniec w niniejszym opracowaniu poruszono aktualny problem z FESS, który obejmuje regulowany system synchronizacji systemu z przetwornicą DC i falownikiem AC. (Przegląd topologii systemu sterowania systemu magazynowania energii w postaci koła zamachowego w zastosowaniach energii odnawialnej dla alternatywnych elektrowni)
Keywords: Flywheel energy storage system, DC converter, AC inverter, Control system. Słowa kluczowe: magazynowanie energii, koło zamachowe, przekształtnik DC
Introduction
In recent years, energy storage systems have become increasingly essential, and the flywheel is one of the oldest storage devices with numerous advantages [1]. Flywheel energy storage systems (FESS) offer environmental and economic advantages in power quality improvement which can be utilized to stability electrical energy supply and demand compared with other energy storage system. Energy storage can be in the form of mechanical, thermal, chemical, or magnetic. FESS stores mechanical energy in a rotating flywheel, which is transformed into electrical energy by a generator and an electrical machine, which drives the flywheel to transfer electrical energy to mechanical energy. Among all types of energy storage system, FESS is the most popular because they can offer many advantages such as a long cycle life, a long operational life, a high round-trip efficiency, a high power density, a low environmental effect, and the ability to store data high level of energy without limitation. In additional of FESS in power system can improve the logistic and dynamic operation of the power quality [2][3][4]. Besides that, FESS can fulfil the requirement of the microgrid operation by providing supplementary services such as frequency and voltage management and smoothing the intermittency of renewable resources [5]. However, the existing system used either in EV or power quality system still facing with many issues and challenges in storing energy. The issues consist of charging/discharging period, protection, consistency, life cycle, size, cost, and power management. FESS become high demand power stability solution because of its ability to store energy during off-peak hours and supply energy during peak hours [6].
There are two types of FESS normally refer to their physical structure and application which is operated in low-speed and high-speed. High speed FESS consists of magnetic bearings, vacuum enclose, and composite disk. Whereby low-speed only usage mechanical bearing and steel flywheel. FESS is an electromechanical energy storage system that comprises of an electrical machine, a back-to-back converter, a DC link capacitor, and a large disc that can interchange electrical power with the electric network. FESS provides an ecologically friendly short or medium-term energy storage system that may be used for a variety of applications in the power system, including power quality enhancement, power smoothing, renewable energy integration support, and system stability enhancement [7].
The study in [8] shows the basic FESS structures commonly used in EVs and power application which is combination between two-machine system or one-machine system with bidirectional power converter. The concept of flywheel energy storage is to store the electrical energy in the form of kinetic energy by rotating a flywheel which is connected mechanically between motor and generator. The electrical power is applied to the motor causing the flywheel spinning high speed, and this spinning mass has kinetic energy is converted back to electrical energy by driven the generator when electrical energy no more applied to the motor [9]. Here, flywheel as a storage of mechanical energy react as a mechanical battery in the system. Normal design of flywheel used in energy storage system is shaped as solid cylinder [2][10]. In [11], the author applied multi criteria decision making approach to choose and validate the material for a flywheel design with appropriate weight selection. This method of optimization is used for nonclassical design algorithm and the result of the design followed the specified set of constraints. There are three main functions of FESS. First, it able to reduce price of electricity. Seconds, it prevents power fluctuation to improve power quality. Third, it helps to achieve the balance between the proper amounts of the generated power with varying demand of load power [12][13].
Due to its limited capability and potency in terms of lifespan, cost, energy and power density, and dynamics response, implementing a hybrid energy storage system that combines two or more energy storage systems is a solution to achieve the desired performance of the power resources and fulfil the desired operation [5]. The flywheels’ strong characteristics make them ideal for limiting the depth of discharge during short-duration discharges and providing fast reaction with a high daily cycle [14]. In [15], the authors analysed a hybrid energy performance using solar (PV) and diesel systems as energy sources, with a flywheel to store excess PV energy. The study looked at the influence of using flywheel energy on power generation, energy costs, and net present cost for a specific hybrid system design. HOMER is a piece of software that allows you to create. Due to its low environmental impact and great efficiency, flywheel energy storage is a nearly mature technology that is being implemented in a variety of sectors and with a variety of innovative systems [16].
Current technology behind the main topology of hybrid flywheel motor generator system Electrical machines
Electrical machinery such as an induction machine, a permanent magnet machine, and a variable reluctant machine are commonly employed in FESS. An induction motor such a squirrel cage type is used due to low cost, its ruggedness, higher torque and can be used for high power application. On the other side, the variable reluctant machine offered a wide speed range with simple control mechanism with low idling losses and very robust, but it has low power density and power factor with high torque ripple. The permanent magnet machine, on the other hand, has a high power efficiency, high power density, and low rotor losses, but it is expensive, has low tensile strength, and has idling losses due to stator eddy current losses [17]. Table 1 shows that the comparison of electrical machine proper utilize in FESS [18][2].
Table 1. The comparison of electrical machine proper utilize in FESS.
.
.
In [19], the authors investigated the nonlinear dynamics of a turbine generator with a squeeze film damper under the action of rub-impact in the oil film rupture. When the rotor speed ratio is minimal, the system performs period-one motion, but the periodic motion abruptly transforms into aperiodic motion with no transition. The squeeze film damper, on the other hand, fails to support the rotor within a given speed range.
In [20], the authors indicated the performance and control strategy of synchronous and induction machines that are employed in FESS. The performance of FESS is heavily dependent on the type of motor/generator (MG) combination, which is the primary component for generating or absorbing power from the grid and is made up of three categories of electrical machines: synchronous, induction, and switching reluctant machines. Induction machines are typically utilized for high-power applications, synchronous machines are used for high-speed applications, and switched reluctant machines are used less frequently because to large current ripples.
Magnetic FESS development
The study in [21] designed an unique flywheel energy storage device that relied on hybrid mechanical-magnetic bearings for assistance. The suggested design uses active magnetic bearings and an axial flux permanent magnet synchronous machine to allow the rotor-flywheel to spin while remaining in magnetic levitation in a vertical configuration. The axial-flux permanent magnet motor has a rotor and stator, with the rotor positioned between two disc-type stators and able to move along the sliding bar. However, its movement is limited to half of the air-gap length, with a 0.5mm departure from the middle point between the two stators. From experimental result show that the flywheel velocity increase from 0 to the rated speed in the charging stage and keep constant in energy maintenance stage to store energy. The speed decrease 10% in discharge stage to release energy. As a result, the proposed conceptual FESS with a compact flywheel energy storage system supported by an axial flux partially self-bearing permanent magnet machine has been proven as possible in experimental implementation.
In [22], the authors demonstrated that a fully integrated flywheel energy storage system with a high-temperature superconducting magnet suspension allows for stable flywheel levitation. The thrust bearing forces are regulated by permanent magnets, and the initial centre of the flywheel is located in a vacuum chamber, which improves system efficiency and reduces losses. To meet the need of spacecraft altitude control accuracy, the authors presented an instantaneous torque control of a magnetically hung reaction flywheel in [23]. To increase the torque-output precision of the magnetically hung reaction flywheel, a new torque control approach is proposed. To minimise diode freewheeling of the inactive phase in the conduction zone and modulate the switching-in phase during the high-speed region, a novel PWM pattern is used. To eliminate microscopic vibration, Qiang et al. [24] built a novel repeatable launch locking/unlocking device for a magnetically suspended momentum flywheel. In [25], the authors suggested an active vibration control unit with a flywheel inertial actuator for reducing distributed structural flexural vibration. To operate this actuator, the moving components of the actuator work together with a traditional coil-magnet transducer and flywheel element to generate the rotating inertia effect. This proposed actuator able to implement feedback control units which robust to shock, improve stability and vibration control effects.
In [26], the authors analysed a superconducting levitation of the flywheel system based on the H-formulation to provide a guideline for electromagnetic behaviours in the flywheel system design. Levitation forces are created by independent interactions between axial and radial bearings. The proposed design, which uses a single ring-shaped superconductor and more permanent magnets, will provide a higher stiffness characteristic. This concept comprised the multi-surface levitation by instrumentation up to 125.6% axial force and provided high force density in improvement of the flywheel system. In [27], the authors designed a stabilised flywheel unit for efficient energy storage by developing a unit with revolving flywheel for storing energy and therefore decreasing the supply-demand gap. This design aims to extract the least amount of energy from the flywheel while maintaining all five degrees of freedom.
Energy storage flywheel supported with active magnetic bearing become popular in academic or industry due to their offer many advantages such as short charging time, high specific energy, long life span and no pollution. The study in [28] constructed a rotor-AMB test rig to emulate the operation of such flywheel. In [29], the author developed REBCO high temperature superconducting magnet bearing for large capacity FESS which consist of a high temperature superconducting bulk and double-pancake coils used second generation REBCO wires. The study in [30] developed of superconducting magnetic bearing for FESS that consist of high temperature superconducting coil and bulks. This proposed design has capability of 300kW and storage capability of 100kWh by implement high inertia flywheel with diameter 2m and 4000kg weight. In [31], the authors designed an active magnetic bearing system with off-board power supply system to keep the suspension stable of the flywheel rotor at the equilibrium point. The onboard power supply cannot operate when equilibrium point cause the magnetically suspended FESS suffers fatal damage. The dynamic displacement of the flywheel rotor at equilibrium status always occurs when the dynamic braking of flywheel rotor is realized by discharge of the magnetically suspended FESS. The results show that by discharging magnetically suspended FESS and increasing the energy storage of magnetically suspended FESS with constant flywheel rotor speed, the off-board power source can maintain the mechanism of an active magnetic bearing. This mechanism also can avoid collision between unstable rotors at high rotation speed with stator.
Hybrid topologies
Sebastian et al. proposed a model of low-cost low-speed FESS (LS-FESS) to increase the power quality of the hybrid diesel and wind generator for isolated micro grid. An asynchronous machine used to drive a steel flywheel as LSFESS to provide low cost and simple maintenance which is important for remote location of the wind diesel power system. An asynchronous machine is chosen because its offer cheaper, high torque, suitable for many application, and robust. The power quality improvement proposed in this micro grid shown as a simulation model. In [32], the authors designed control strategy to manage between FESS and wind turbines by using frequency control to maintain the level of power reserves adjusted by network operator according to the wind turbines operation. This work focusing to design control strategy for wind turbine to fulfil the requirement of power reserves and to manage the system between this hybrid power sources by regulating the frequency controller. This controlling method by adjusting rating of variable-speed wind turbine make improvement of power margin of all wind speed range either below or above rated of wind speed. This frequency control can provide kinetic energy due to the variation of rotation speed of turbine exchanged with the network. Application of the flywheel in this system can reduce the need of wind turbine power generation by reloading extra power to the network.
The study in [33], presented a power converting system hybrid energy storage and wind turbine by introducing two techniques of directions which are torque control and power control. This system links each other between flywheel, induction machine and power converters to the wind power generator via provided DC network. These direct controls which give faster response by eliminate the loop of variable regulation controlled and block of pulse width modulation. The implementation of this direct torque controlled to the double fed induction generator hybrid with FESS will increase the accuracy of the system. Fig 1 shows the overall system under study that proposed by the authors [33].
Fig.1. System under study.
In [34], the authors applied flywheel to support the hybrid system of renewable energy with power management system. This power management system presents a control technique to manage the hybrid system between FESS and stand-alone wind-diesel generator. In this topology, application of FESS make improvement to the dynamic performance of the overall system in various situations such as load increasing, low operation of wind turbine and diesel engine. In this system, flywheel and induction motor controlled by machine power controller which is FES will deliver to the load during low power generated by other power sources. In [35], the study proposed a flywheel hybridization in energy storage system in renewable energy sources to improve battery life. This work purposely to verified the advantages of hybrid energy storage system between solar and FESS used for residential micro-grid. It is proved that the flywheel applied in the system make large improvement of the battery duration almost triple. Fig 2 shows the micro-grid layout for this proposed system, which is consists of solar panel, PV converter, battery converter, battery, flywheel converter, FESS, bidirectional inverter, user load and grid [35].
Fig.2. Micro-grid layout.
In [36], the authors presented a study of hybrid flywheel with reversible Solid Oxide Cell in micro-grid to improve capabilities of the peak-shaving and fast-ramping in power quality for renewable power sources. The limitation of the reversible Solid Oxide Cell which poor load-following capability that required hybridization to provide regulation in short time interval. This power management topology introduces two types of storages which are short-term and long-term storage to handle the power peaks and to extend storage capacity. The investigation shows that this hybridization make improvement in increasing of self-consumption efficiency up to 58.04%. Fig 3 shows the overall system architecture, which included of solar panel, PV converter, battery converter, reversible Solid Oxide Cell, Hydrogen storage, flywheel converter, FESS, bidirectional inverter, load, and grid [36].
Fig.3. Hybrid Energy Storage System architecture scheme.
The testing circuit diagram as shown in Fig 3 is used to analysis the system. From this testing circuit, the effect of the flywheel with different sizes and weights can be analyzed [37]. From this testing circuit also, the synchronization of the motor and generator can be measure. All the data measurements of the motor and generator such as stator current, torque, speed, input, and output voltage are being measured as shown in this figure. All measurements consist of a multi-meter to display the root mean square (RMS) value and the scope to plot the graph. The voltage supply also can be set according to the motor specification by changing the parameter of the supply relay three-phase.
Application of FESS
In [38], the authors applied flywheel energy storage to maintain current and efficiency in the modern resistance spot welding system. This system approach gives better result with high efficiency more than 80% compare with capacitor storage system. The motor-generator combination in this system purposely to boost the voltage and reduce electrical frequency. Fig 4 shows the proposed system topology that consist of 3-phases inverter, motor, generator, flywheel, and welding power supply [38].
Fig.4. Proposed system topology.
The study in [39] designed geared transmission for hybrid vehicles to optimise the flywheel energy storage by coupling a FESS to the gear system which can recover the energy when braking and boost more energy for acceleration. Rupp et al. [36] analysed a FESS for light rail transit train to reduce operating cost by reducing energy used in the system. The result of the analysis show that cost saving up to 11% can be obtained with 1.2kWh and 360kW. In [40], the suthors resolved the limitation of the fuel cell by integrating the magnetic flywheel as a hybrid system control. This system hired two type of control method which known as particle swarm optimization and multiple adaptive neuro-fuzzy interface [41]. Fig 5 shows the magnetic flywheel system architecture proposed by the author [40]. In [42], the authors developed Kinetic Driven Flywheel by coupling the flywheel to the crankshaft to reduce mechanical vibration in this part. A new design of gearbox with double-crank which can adjustable the length and cycloidal shape. In [43], the authors found the optimize number and the best capability of the flywheel rotor that can be used to minimize the used of power in light metro trains by introducing a new design of multi-ring flywheel rotor. The result shows that this design can be handled about 1620- 3420kW of the power needed in the system.
Fig.5. Magnetic flywheel system architecture.
In [44], the authors studied how to reduce load fluctuations in ship electrical system by adding hybrid energy storages between battery and flywheel. In the ship development either for commercial or military recently are focusing on ship electrification but there are challenges for electric-ship propulsion system which facing with large propulsion-load fluctuations. The power sources from the battery and flywheel become a buffer to separate load fluctuations from the all-electric ship system.
In [45], the authors studied how to maintain the rate of energy stored in the form of moment inertia and angular frequency connected directly the grid. This approach not required power electronic as interface and capable to connect directly to grid. A prototype developed in this study able to generate high power for charging and discharging ability in several second in one period. However, the efficiency of this system controller need improvement to obtain a feasible fixed-speed FESS in regulating moment of inertia.
A satellite power system required solar panel to provide energy and orientation but in the dark region in orbital path required FESS. The study in [46] implemented a FESS for the space application. Fig 6 shows the current reference method (CRM) and FESS in the proposed system that consist of solar pane, inverter to converter DC to AC 3- phases, LC filter to stabilize the voltage, brushless DC motor and flywheel [46]. In [47], the authors designed a model of flywheel micro vibration isolation system to isolate the micro vibrations generated by high speed operating flywheel induce to unstable spacecraft payload and network bus. In [48], the authors studied about the effect of supercapacitors to the satellite power system by using torque flywheel whereby the traditional satellite power system has limitation on the battery capacity and space to meet the requirement of the high torque flywheel. The study in [49] tested the flywheel micro vibration with six component test benches to study the impact of flywheel micro vibration that produce high-resolution optical satellite with space-borne integrated. This impact of this vibration can be resolve by applying flywheel vibration isolator on the camera. The study in [50] designed vibration reduction for the flywheel system to study about nonlinear energy sink. This system should be able to meet requirement of structural strength, amplification of resonance peak and other performance needed in aerospace engineering. In [51], studied about the advancement flywheel motor powered by human has been applied at rural area. The investigation on the various research proved that the flywheel motor powered by human can produce until 5hp that can be utilized in rural area for different types of motorized machines application.
Fig.6. CRM and flywheel energy storage system.
Limitations of FESS
Flywheel can be dangerous element in machine system, caused catastrophic and explosion when any failure happened to their body structure due to the stored kinetic energy can be released in the fast respond. Any failure occurs in the FESS required high level of expertise when the traditional approach by using human engineered features applied to detect a fault. In [52], the authors proposed a solution to detect fault in the FESS by using vibration-based fault detection method to monitor the flywheel condition. This experiment proved that the vibration signal can be detected by using data-driven method to observe faulty operation at the end of flywheel life with high accuracy.
Induction machines (IM), permanent magnet machines (PM), and variable reluctance machines (VRM) are common electrical machinery used in FESS [53][54]. Because of its ruggedness, increased torque, and low cost, an IM is employed in high-power applications [55]. The main issues with IMs are speed restrictions, difficult control, and increased maintenance requirements [56]. Because of its better efficiency, high power density, and reduced rotor losses, the PM is the most widely utilised machine for FESS [57]. Due to the speed restrictions of IMs and the torque ripple, vibration, and noise of VRMs, it is commonly utilised in high-speed applications. The issue with a PM is its high price, limited tensile strength, and idling losses due to stator eddy current losses [17]. Hybrid PM reluctance machines have been developed to alleviate these drawbacks.
Recent development in FESS
In study in [58] presented a new digital technique of pulse width modulation (PWM) to control six pulse three-phase inverter for brushless direct current (BLDC) motor drive controlled by using Spartan 3AN field programmable gate array (FPGA). The advantage of this control technique is low cost and able for high speed performance. Fig 7 shows the system topology of the control technique proposed by the author [58].
Fig.7. System topology of digital PWM control technique for BLDC motor.
The study in [59] presented a novel of Input-Output Linearization AC voltage controlled for Dynamics Voltage Restores with proportional integral (PI) controller. The flywheel in the shape of cylinder with vertical axis from seamless steel hollow is driven by AC-AC matrix converter presented higher response speeds [60][61].
In [62], the authors designed an integrated system between flywheel and triboelectric nanogenerator with spiral spring to store energy in the form of a continues rotational energy of a flywheel and the potential energy of a spiral spring that can improve energy harvesting of intermittent excitations. In [63], the study proposed a magnet coil power supply for a small tokamak by using a self-excited induction generator couple with flywheel which is tokamak devices required large amount of pulse power consumption when the power grid is not robust enough. This proposes system succeed to achieve a peak power at 117kW and 55kW rated induction motor/generator in 0.25s flattop period. Fig 8 shows the main topology of the proposed system of self-excited induction generator [63].
In [64], the authors designed FESS to improve quality of electrical energy by using three-phase induction machine to drive high inertial loads of flywheel applied to synchronized grid generator system. This proposed system shows how to connect a high inertial cylindrical flywheel to the induction machine to improve stability in the grid. The result of this experiment shows that application of the cylindrical flywheel into the grid make improvement in power quality by increasing energy conservation efficiency.
Fig.8. Main circuit diagram of the flywheel energy storage system.
In [65], the authors solved the limitation of the wind power due to the intermittent nature of power generation depending to the weather by adding flywheel energy storage technology to the system. This application of FES in the system can improve the power stability supply to the load at constant value. However, the output power to grid still unstable when FESS reaches at its limit and the power of wind turbine fluctuate.
The study in [66] proposed a control system that consist of fuzzy controller to create regulating speed of wind generator that used permanent magnetic synchronous generator and coupling to the FESS. The FESS in this proposed system purposely used to vary the power supply connected to DC bus stage. The extra power stored in the FESS and will use when needed. The FESS in this system consists of squirrel-cage induction motor and flywheel.
In [67], the authors used synchronous reluctance motor supported with permanent magnet in the FESS with vector digital controller which consist of offset and dead zone measurement error ability. This control system able to handle unstable speed of the motor. In [68] make improvement to the power frequency stability with hierarchical control for DC micro-grid in Electrical vehicle (EV) charging station with hybrid power source between FESS, solar and battery. Fig 9 shows the micro-grid topology EV charging station with hybrid power source proposed by the author [68].
The study in [69] applied flywheel to the robot motion by supporting two point rough plane with regulating internal friction and mass. This proposed design of flywheel with an eccentric mass and control algorithm is purposely to solve the problem of the planar motion caused by friction in the robot mechanism.
Fig.9. Micro-grid topology for EV charging station with hybrid energy storage.
Issues and Challenges
The first issue is to increase the duration of electrical power generation from the existing flywheel energy storage system by increasing the efficiency of the system [70][71]. Due to bearing friction and air resistance causes the flywheel to stop rotating. In order to increase the generation period to occur without interruption then the energy loss caused by friction and air resistance must be reduced or eliminated. With a view to obtaining a longer period of electricity generation while improving the efficiency of existing systems, various efforts have been undertaken. Typically, magnetic bearings and vacuum housings have been used to solve this problem. Normally, steel flywheels commonly used in energy storage systems are dependent on mechanical energy caused by inertia [72]. The presence of friction and air resistance on the mechanical system causes the mechanical energy stored in the flywheel to be reduced and depleted.
The second issue is to overcome the problem of starting the rotation of the flywheel at the beginning of operation which requires high torque as well as low power consumption to improve the efficiency of the system [73]. For systems that are on the grid, high-powered motors can be used without any problems. The disadvantage of using a high-powered motor is that it will result in high power consumption and maintenance costs. After the system has already achieved synchronous speed at the set point, the torque required to maintain the speed already low then only needs a low-power motor for this purpose. For conventional systems, the operator will use a manual method to assist the motor to rotate the generator and flywheel at the start of operation [74]. This method is not suitable for automated systems used for emergency operations or backup power supplies. High torque is required for starting of operation to gain resistance forces resulting from the weight of the flywheel, bearing friction, and air resistance. For off-grid systems applications, the use of high-powered motors becomes a challenge that needs to be overcome. The energy produced from solar, or wind energy is noncontinuous energy. So, a motor that uses low power is more suitable to be used to drive the flywheel at the start of operation. Typically, electrical power generated from solar, or wind energy is direct current [75]. Direct current energy will be stored in the battery for further use. Here a single-phase inverter will be used to convert direct current to alternating current. The use of high-powered motors also will increase the cost of system development and maintenance.
This flywheel energy storage system also requires motor speed control at the nominal speed level required by the generator to produce the optimal output voltage [76][77]. A high-efficiency control system is required to ensure that the motor can drive the generator at the required speed. However, the speed of a motor that is changed by using a frequency inverter requires a control system that can keep the system moving at the desired speed constantly. The motor speed cannot be automatically determined to be at the desired speed level if no closed-loop control system is applied in the system.
Non-stop electrical power generation is becoming a new challenge in the world of flywheel power generation system technology research [63][78]. Ongoing research has been conducted so that a non-stop continuous energy generation system becomes a reality. The importance of producing something new for this study provides a new idea and discovery that benefits the industry and even the world of research. To date, an electric power generation system with a non-stop continuous flywheel energy storage system is still unrealistic, but it has not become impossible to find.
Studies are still ongoing to achieve this dream and this system is also known as a free energy generator [79].
Conclusions and Recommendations
The FESS with various topologies gives many benefits in renewable energy application for alternative power plant, especially for micro-grid. A review on FESS application shows that they can be used in various field of technology from vehicle until to space. Application of FESS with automated system and power electronic make the power plant or micro-grid produce more efficient energy conversion of the power from renewable energy to the load. Using of FESS equipped with converters and inverters can address the limitation of Flywheel system drive, which include high starting torque, low voltage supply, unregulated voltage, and unstable power. A hybrid flywheel with solar panel, wind turbine or battery or other source can stabilize the power conditioning to balance and fulfil the excess and insufficient power condition in the micro-grid. This review also shows that the development of magnetic technology with various technique use for FESS improvement. Application of permanent magnet motor, hybrid mechanical and magnetic bearing in FESS introduces improvements in terms of increased efficiency of the system. The topology of the hybrid micro-grid technology can be divided into three stage which are renewable energy power source such solar or wind generator, storage energy system such battery charging system or flywheel storage system, and power electronic such a converter or inverter to control the power to the load.
In conclusion, the design of control systems and power electronic topologies is considered important in FESS to increase the reliability of the system can be used anywhere and anytime. Therefore, more research on the development of new topologies for FESS with new switching technique control for power electronic or improve the existing technology in the flywheel system drive to create a more robust application. Currently, there are many improvements focused on mechanical friction and air resistance due to the power loss in the system but not in control and power electronics. FESS with improved power electronic technologies and intelligent control systems can be considered as promising alternative energy storage for the micro-grid application.
• For future recommendations, the approach taken are with the addition of hybrid flywheels to the flywheel energy storage system has been made. With the addition of hybrid flywheels consisting of steel flywheels and magnetic flywheels, this storage system no longer relies on inertia alone. With these improvements, the friction and resistance that reduce the energy stored in the flywheel can be overcome. Therefore, the duration of electric power generation will increase, and the efficiency of the system will be higher.
• Here, the frequency inverter is the best choice to control the speed of the squirrel cage motor. This is because the frequency inverter controls the motor speed by simply changing the frequency of the three-phase power supply resulting from the three-phase full-bridge inverter method with six IGBT as the switch without using the resistance control method which will cause high power loss and energy waste.
• Pulse width modulation used to control the frequency of the inverter does not cause power loss when a power change occurs. In addition, a frequency inverter can be used only connecting to a single-phase power supply to run a three-phase motor. This is because a frequency inverter will produce a three-phase power supply as its output voltage. Just by changing the frequency of the inverter. The motor speed will change without changing the supply voltage. By increasing the frequency of the inverter, the motor will rotate faster.
• The star and delta connection method with a combination of low-power motors can provide improvements to the system by providing sufficient torque for the high-inertia flywheel drive motor at the start of operation. This hybrid method of double star and delta connection can produce high torque and driving force at highly efficient speeds. The double delta connection can be used to drive the flywheel at the beginning of the operation and after reaching the desired speed synchronously with the motor, flywheel, and generator are at the same speed, and then the system can change the double star connection to continue operation. The use of a lower current will increase the efficiency of the system and reduce power consumption.
Acknowledgment – Universiti Kebangsaan Malaysia for funding the research under Grant Code GGPM-2021-050.
REFERENCES
1. Mousavi G, S.M.; Faraji, F.; Majazi, A.; Al-Haddad, K. A comprehensive review of Flywheel Energy Storage System technology. Renew. Sustain. Energy Rev. 2017, 67, 477–490, doi:10.1016/J.RSER.2016.09.060. 2. Amiryar, M.E.; Pullen, K.R. A Review of Flywheel Energy Storage System Technologies and Their Applications. Appl. Sci. 2017, Vol. 7, Page 286 2017, 7, 286, doi:10.3390/APP7030286. 3. Sebastián, R.; Peña-Alzola, R. Control and simulation of a flywheel energy storage for a wind diesel power system. Int. J. Electr. Power Energy Syst. 2015, 64, 1049–1056, doi:10.1016/J.IJEPES.2014.08.017. 4. Sarker, M.R.; Mohamed, A.; Mohamed, R. Performance evaluation modeling a Microelectromechanical system based Finite Element piezoelectric shear actuated beam. Prz. Elektrotechniczny 2015, 91. 5. Hajiaghasi, S.; Salemnia, A.; Hamzeh, M. Hybrid energy storage system for microgrids applications: A review. J. Energy Storage 2019, 21, 543–570, doi:10.1016/J.EST.2018.12.017. 6. Faisal, M.; Hannan, M.A.; Ker, P.J.; Hussain, A.; Mansor, M. Bin; Blaabjerg, F. Review of energy storage system technologies in microgrid applications: Issues and challenges. IEEE Access 2018, 6, 35143–35164, doi:10.1109/ACCESS.2018.2841407. 7. Arani, A.A.K.; Karami, H.; Gharehpetian, G.B.; Hejazi, M.S.A. Review of Flywheel Energy Storage Systems structures and applications in power systems and microgrids. Renew. Sustain. Energy Rev. 2017, 69, 9–18, doi:10.1016/J.RSER.2016.11.166. 8. Hannan, M.A.; Hoque, M.M.; Mohamed, A.; Ayob, A. Review of energy storage systems for electric vehicle applications: Issues and challenges. Renew. Sustain. Energy Rev. 2017, 69, 771–789. 9. ALI, M.S.; SARKER, M.R.; IBRAHIM, A.A.; MOHAMED, R. A High Gain Variable Boost DC-DC Converter for Low-Voltage Hybrid Direct Methanol Fuel Cell Batteries. Prz. Elektrotechniczny 2021, 97, 1–10, doi:10.15199/48.2021.11.01. 10. Sarker, M.R.; Mohamed, R. A Batteryless low input voltage micro-scale thermoelectric based energy harvesting interface circuit with 100mV start-up voltage. Prz. Elektrotechniczny 2014, 90. 11. Okokpujie, I.P.; Okonkwo, U.C.; Bolu, C.A.; Ohunakin, O.S.; Agboola, M.G.; Atayero, A.A. Implementation of multi-criteria decision method for selection of suitable material for development of horizontal wind turbine blade for sustainable energy generation. Heliyon 2020, 6, e03142, doi:10.1016/J.HELIYON.2019.E03142. 12. Wu, Y.; Bingham, C.M.; Peel, D.J.; Howe, D. Active magnetic bearings for a flywheel peak power buffer for electric vehicles. Int. J. Appl. Electromagn. Mech. 2001, 15, 201–206. 13. Jin, Z.; Sun, X.; Yang, Z.; Wang, S.; Chen, L.; Li, K. A novel four degree-of-freedoms bearingless permanent magnet machine using modified cross feedback control scheme for flywheel energy storage systems. Int. J. Appl. Electromagn. Mech. 2019, 60, 379–392. 14. Pullen, K.R. The Status and Future of Flywheel Energy Storage. Joule 2019, 3, 1394–1399, doi:10.1016/J.JOULE.2019.04.006. 15. Ramli, M.A.M.; Hiendro, A.; Twaha, S. Economic analysis of PV/diesel hybrid system with flywheel energy storage. Renew. Energy 2015, 78, 398–405, doi:10.1016/J.RENENE.2015.01.026. 16. Wicki, S.; Hansen, E.G. Clean energy storage technology in the making: An innovation systems perspective on flywheel energy storage. J. Clean. Prod. 2017, 162, 1118–1134, doi:10.1016/J.JCLEPRO.2017.05.132. 17. Hedlund, M.; Abrahamsson, J.; Pérez-Loya, J.J.; Lundin, J.; Bernhoff, H. Eddy currents in a passive magnetic axial thrust bearing for a flywheel energy storage system. Int. J. Appl. Electromagn. Mech. 2017, 54, 389–404. 18. Sarker, M.R.; Mohamed, R.; Saad, M.H.M.; Tahir, M.; Hussain, A. Vibration based energy harvesting system for mobile device charging. Int. J. Appl. Electromagn. Mech. 2020, 65, 149–169. 19. Hsu, W.-C.; Wang, C.-R.; Shiau, T.-N.; Liu, D.-S.; Young, T.-H. Nonlinear Dynamic Study on Effects of Flywheel Eccentricity in a Turbine Generator with a Squeeze Film Damper. Procedia Eng. 2014, Complete, 397–406, doi:10.1016/J.PROENG.2014.06.360. 20. Soomro, A.; Amiryar, M.E.; Pullen, K.R.; Nankoo, D. Comparison of Performance and Controlling Schemes of Synchronous and Induction Machines Used in Flywheel Energy Storage Systems. Energy Procedia 2018, 151, 100–110. 21. Zhang, C.; Tseng, K.J. Design and control of a novel flywheel energy storage system assisted by hybrid mechanical-magnetic bearings. Mechatronics 2013, 23, 297–309, doi:10.1016/J.MECHATRONICS.2013.01.008. 22. Dergachev, P.; Kosterin, A.; Kurbatova, E.; Kurbatov, P. Flywheel energy storage system with magnetic hts suspension and embedded in the flywheel motor-generator. In Proceedings of the Proceedings – 2016 IEEE International Power Electronics and Motion Control Conference, PEMC 2016; Institute of Electrical and Electronics Engineers Inc., 2016; pp. 574–579. 23. Jian, F.; Kun, L.; Jingbo, W. Instantaneous Torque Control of Magnetically Suspended Reaction Flywheel. Energy Procedia 2016, 100, 297–306, doi:10.1016/J.EGYPRO.2016.10.181. 24. Qiang, L.; Kun, W.; Yuan, R.; Peilan, P.; Limei, M.; Zhaojing, Y. Novel repeatable launch locking/unlocking device for magnetically suspended momentum flywheel. Mechatronics 2018, 54, 16–25, doi:10.1016/J.MECHATRONICS.2018.07.002. 25. Kras, A.; Gardonio, P. Active vibration control unit with a flywheel inertial actuator. J. Sound Vib. 2020, 464, 114987, doi:10.1016/J.JSV.2019.114987. 26. Quéval, L.; Liu, K.; Yang, W.; Zermeño, V.M.R.; Ma, G. Superconducting magnetic bearings simulation using an Hformulation finite element model. Supercond. Sci. Technol. 2018, 31, 084001, doi:10.1088/1361-6668/AAC55D. 27. Šonský, J.; Tesař, V. Design of a stabilised flywheel unit for efficient energy storage. J. Energy Storage 2019, 24, 100765, doi:10.1016/J.EST.2019.100765. 28. Lyu, X.; Di, L.; Yoon, S.Y.; Lin, Z.; Hu, Y. A platform for analysis and control design: Emulation of energy storage flywheels on a rotor-AMB test rig. Mechatronics 2016, 33, 146– 160, doi:10.1016/J.MECHATRONICS.2015.12.007. 29. Mukoyama, S.; Matsuoka, T.; Furukawa, M.; Nakao, K.; Nagashima, K.; Ogata, M.; Yamashita, T.; Hasegawa, H.; Yoshizawa, K.; Arai, Y.; et al. Development of REBCO HTS Magnet of Magnetic Bearing for Large Capacity Flywheel Energy Storage System. Phys. Procedia 2015, 65, 253–256, doi:10.1016/J.PHPRO.2015.05.139. 30. Miyazaki, Y.; Mizuno, K.; Yamashita, T.; Ogata, M.; Hasegawa, H.; Nagashima, K.; Mukoyama, S.; Matsuoka, T.; Nakao, K.; Horiuch, S.; et al. Development of superconducting magnetic bearing for flywheel energy storage system. Cryogenics (Guildf). 2016, 80, 234–237, doi:10.1016/J.CRYOGENICS.2016.05.011. 31. Xiang, B.; Wong, W. Power compensation mechanism for AMB system in magnetically suspended flywheel energy storage system. Measurement 2021, 173, 108646, doi:10.1016/J.MEASUREMENT.2020.108646. 32. Díaz-González, F.; Hau, M.; Sumper, A.; Gomis-Bellmunt, O. Coordinated operation of wind turbines and flywheel storage for primary frequency control support. Int. J. Electr. Power Energy Syst. 2015, 68, 313–326, doi:10.1016/J.IJEPES.2014.12.062. 33. Hamzaoui, I.; Bouchafaa, F.; Talha, A. Advanced control for wind energy conversion systems with flywheel storage dedicated to improving the quality of energy. Int. J. Hydrogen Energy 2016, 41, 20832–20846, doi:10.1016/J.IJHYDENE.2016.06.249. 34. Pathomchaiwat, P.; Neammanee, B. Control of power management in the renewable energy system by using Flywheel Energy Storage. ECTI-CON 2017 – 2017 14th Int. Conf. Electr. Eng. Comput. Telecommun. Inf. Technol. 2017, 513–516, doi:10.1109/ECTICON.2017.8096287. 35. Barelli, L.; Bidini, G.; Bonucci, F.; Castellini, L.; Fratini, A.; Gallorini, F.; Zuccari, A. Flywheel hybridization to improve battery life in energy storage systems coupled to RES plants. Energy 2019, 173, 937–950, doi:10.1016/J.ENERGY.2019.02.143. 36. Baldinelli, A.; Barelli, L.; Bidini, G. Progress in renewable power exploitation: reversible solid oxide cells-flywheel hybrid storage systems to enhance flexibility in micro-grids management. J. Energy Storage 2019, 23, 202–219, doi:10.1016/J.EST.2019.03.018. 37. Caruso, J.F.; Coday, M.A.; Davidson, M.E.; Riner, R.D.; Borgsmiller, J.A.; Olson, N.M.; Taylor, S.T.; McLagan, J.R. The effect of flywheel-based resistive exercise workouts on testosterone/cortisol ratios. Isokinet. Exerc. Sci. 2012, 20, 51–60. 38. Hagemeyer, M.; Frohleke, N.; Krishna, D.V.M.M.; Bocker, J. Development of a flywheel energy storage-based welding system. 2016 IEEE 2nd Annu. South. Power Electron. Conf. SPEC 2016 2016, doi:10.1109/SPEC.2016.7846049. 39. Read, M.G.; Smith, R.A.; Pullen, K.R. Optimisation of flywheel energy storage systems with geared transmission for hybrid vehicles. Mech. Mach. Theory 2015, 87, 191–209, doi:10.1016/J.MECHMACHTHEORY.2014.11.001. 40. Huang, C.N.; Chen, Y.S. Design of magnetic flywheel control for performance improvement of fuel cells used in vehicles. Energy 2017, 118, 840–852, doi:10.1016/J.ENERGY.2016.10.112. 41. Ali, M.S.; Sarker, M.R.; Ibrahim, A.A.; Mohamed, R. High efficiency flywheel motor generator model with frequency converter controlled. Prz. Elektrotechniczny 2021, 97, 184–189, doi:10.15199/48.2021.11.34. 42. Pfabe, M.; Woernle, C. Reducing torsional vibrations by means of a kinematically driven flywheel — Theory and experiment. Mech. Mach. Theory 2016, 102, 217–228, doi:10.1016/J.MECHMACHTHEORY.2016.03.011. 43. Rastegarzadeh, S.; Mahzoon, M.; Mohammadi, H. A novel modular designing for multi-ring flywheel rotor to optimize energy consumption in light metro trains. Energy 2020, 206, doi:10.1016/J.ENERGY.2020.118092. 44. Hou, J.; Sun, J.; Hofmann, H. Control development and performance evaluation for battery/flywheel hybrid energy storage solutions to mitigate load fluctuations in all-electric ship propulsion systems. Appl. Energy 2018, 212, 919–930, doi:10.1016/J.APENERGY.2017.12.098. 45. Kondoh, J.; Funamoto, T.; Nakanishi, T.; Arai, R. Energy characteristics of a fixed-speed flywheel energy storage system with direct grid-connection. Energy 2018, 165, 701–708. 46. Çelikel, R.; Özdemir, M.; Aydoǧmuş, Ö. Implementation of a flywheel energy storage system for space applications. Turkish J. Electr. Eng. Comput. Sci. 2017, 25, 1197–1210. 47. Wei, Z.; Li, D.; Luo, Q.; Jiang, J. Modeling and analysis of a flywheel microvibration isolation system for spacecrafts. Adv. Sp. Res. 2015, 55, 761–777, doi:10.1016/J.ASR.2014.10.036. 48. Wu, Q.; Zhu, M.; Li, F.; Chi, X.; Lin, W.; Luo, Y.; Ma, L. Effect of Supercapacitors Supply on the High Torque Flywheel for Satellite Power System. IFAC-PapersOnLine 2017, 50, 9419– 9425, doi:10.1016/J.IFACOL.2017.08.1458. 49. Li, L.; Tan, L.; Kong, L.; Wang, D.; Yang, H. The influence of flywheel micro vibration on space camera and vibration suppression. Mech. Syst. Signal Process. 2018, 100, 360–370, doi:10.1016/J.YMSSP.2017.07.029. 50. Sun, Y.H.; Zhang, Y.W.; Ding, H.; Chen, L.Q. Nonlinear energy sink for a flywheel system vibration reduction. J. Sound Vib. 2018, 429, 305–324, doi:10.1016/J.JSV.2018.05.025. 51. Kumar Dubey, H.; Singh, M.P.; Modak, J.P.; Makade, R. A review on the advancement of human powered flywheel motor (HPFM) in India and its application for rural empowerment. Mater. Today Proc. 2020, 28, 2223–2235, doi:10.1016/J.MATPR.2020.04.533. 52. Hasegawa, T.; Saeki, M.; Ogawa, T.; Nakano, T. Vibrationbased fault detection for flywheel condition monitoring. Procedia Struct. Integr. 2019, 17, 487–494, doi:10.1016/J.PROSTR.2019.08.064. 53. Zhang, C.; Tseng, K.J.; Nguyen, T.D.; Zhao, G. Stiffness analysis and levitation force control of active magnetic bearing for a partially-self-bearing flywheel system. Int. J. Appl. Electromagn. Mech. 2011, 36, 229–242. 54. Wu, Y.; Bingham, C.M.; Peel, D.J.; Howe, D. Active magnetic bearings for a flywheel peak power buffer for electric vehicles. Int. J. Appl. Electromagn. Mech. 2002, 15, 201–206, doi:10.3233/JAE-2002-506. 55. Nagaya, K.; Saito, M.; Kobayashi, K.; Murakami, I. Vibration suppression for high temperature superconducting levitation flywheel system using coil dampers. Int. J. Appl. Electromagn. Mech. 2007, 25, 559–564, doi:10.3233/JAE-2007-896. 56. Gao, H.; Yu, X.; Cao, J. Linear electromagnetic force and beat phenomenon for maglev flywheel battery. Int. J. Appl. Electromagn. Mech. 2019, 60, 409–421, doi:10.3233/JAE-170154. 57. Nagaya, K.; Kanno, K.; Hayashi, N. Control of flywheel system with high-Tc superconducting bearings. Int. J. Appl. Electromagn. Mech. 1999, 10, 237–247. 58. Pindoriya, R.M.; Mishra, A.K.; Rajpurohit, B.S.; Kumar, R. FPGA Based Digital Control Technique for BLDC Motor Drive. IEEE Power Energy Soc. Gen. Meet. 2018, 2018-August, doi:10.1109/PESGM.2018.8586472. 59. Gambôa, P.; Silva, J.F.; Pinto, S.F.; Margato, E. Input–Output Linearization and PI controllers for AC–AC matrix converter based Dynamic Voltage Restorers with Flywheel Energy Storage: a comparison. Electr. Power Syst. Res. 2019, 169, 214–228, doi:10.1016/J.EPSR.2018.12.023. 60. Sarker, M.R.; Mohamed, A.; Mohamed, R. Implementation of non-controlled rectifier circuit based on vibration utilizing piezoelectric bending generator. Int. J. Appl. Electromagn. Mech. 2017, 54. 61. Mohamed, R.; Sarker, M.R.; Mohamed, A. An optimization of rectangular shape piezoelectric energy harvesting cantilever beam for micro devices. Int. J. Appl. Electromagn. Mech. 2016, 50. 62. Yang, W.; Wang, Y.; Li, Y.; Wang, J.; Cheng, T.; Wang, Z.L. Integrated flywheel and spiral spring triboelectric nanogenerator for improving energy harvesting of intermittent excitations/triggering. Nano Energy 2019, 66, 63. Murayama, M.; Kato, S.; Tsutsui, H.; Tsuji-Iio, S. Magnet coil power supply by a self-excited induction generator with a flywheel for a small tokamak, PHiX. Fusion Eng. Des. 2019, 148, 111270, doi:10.1016/J.FUSENGDES.2019.111270. 64. Miyamoto, R.K.; Goedtel, A.; Castoldi, M.F. A proposal for the improvement of electrical energy quality by energy storage in flywheels applied to synchronized grid generator systems. Int. J. Electr. Power Energy Syst. 2020, 118, 105797, doi:10.1016/J.IJEPES.2019.105797. 65. Hutchinson, A.; Gladwin, D.T. Optimisation of a wind power site through utilisation of flywheel energy storage technology. Energy Reports 2020, 6, 259–265, doi:10.1016/J.EGYR.2020.03.032. 66. Mansour, M.; Mansouri, M.N.; Bendoukha, S.; Mimouni, M.F. A grid-connected variable-speed wind generator driving a fuzzycontrolled PMSG and associated to a flywheel energy storage system. Electr. Power Syst. Res. 2020, 180, 106137, doi:10.1016/j.epsr.2019.106137. 67. Shadnam Zarbil, M.; Vahedi, A.; Azizi Moghaddam, H.; Saeidi, M. Design and implementation of flywheel energy storage system control with the ability to withstand measurement error. J. Energy Storage 2021, 33, 102047, doi:10.1016/J.EST.2020.102047. 68. Shen, L.; Cheng, Q.; Cheng, Y.; Wei, L.; Wang, Y. Hierarchical control of DC micro-grid for photovoltaic EV charging station based on flywheel and battery energy storage system. Electr. Power Syst. Res. 2020, 179, 106079, doi:10.1016/J.EPSR.2019.106079. 69. Dosaev, M.; Samsonov, V.; Hwang, S.S. Construction of control algorithm in the problem of the planar motion of a friction-powered robot with a flywheel and an eccentric weight. Appl. Math. Model. 2021, 89, 1517–1527, doi:10.1016/J.APM.2020.08.022. 70. Li, X.; Palazzolo, A. A review of flywheel energy storage systems: state of the art and opportunities. J.Energy Storage 2022, 46, 103576, doi:10.1016/J.EST.2021.103576. 71. Li, J.; Zhao, J. Energy recovery for hybrid hydraulic excavators: flywheel-based solutions. Autom. Constr. 2021, 125, 103648, doi:10.1016/J.AUTCON.2021.103648. 72. Rouse, J.P.; Garvey, S.D.; Cárdenas, B.; Hoskin, A.; Swinfen-Styles, L.; Xu, W. A case study investigation into the risk of fatigue in synchronous flywheel energy stores and ramifications for the design of inertia replacement systems. J. Energy Storage 2021, 39, 102651, doi:10.1016/J.EST.2021.102651. 73. Cronk, P.; Van de Ven, J.; Strohmaier, K. Design optimization, construction, and testing of a hydraulic flywheel accumulator. J. Energy Storage 2021, 44, 103281, doi:10.1016/J.EST.2021.103281. 74. Luo, S.; Li, J.; Li, S.; Hu, J. Dynamical analysis of the fractional order centrifugal flywheel governor system and its accelerated adaptive stabilization with the optimality. Int. J. Electr. Power Energy Syst. 2020, 118, 105792, doi:10.1016/J.IJEPES.2019.105792. 75. Erdemir, D.; Dincer, I. Assessment of Renewable Energy- Driven and Flywheel Integrated Fast-Charging Station for Electric Buses: A Case Study. J. Energy Storage 2020, 30, 101576, doi:10.1016/J.EST.2020.101576. 76. Gao, J.; Zhao, S.; Liu, J.; Du, W.; Zheng, Z.; Jiang, F. A novel flywheel energy storage system: Based on the barrel type with dual hubs combined flywheel driven by switched flux permanent magnet motor. J. Energy Storage 2021, 103604, doi:10.1016/J.EST.2021.103604. 77. Erhan, K.; Özdemir, E. Prototype production and comparative analysis of high-speed flywheel energy storage systems during regenerative braking in hybrid and electric vehicles. J. Energy Storage 2021, 43, 103237, 78. Abdel-Khalik, A.; Elserougi, A.; Massoud, A.; Ahmed, S. A power control strategy for flywheel doubly-fed induction machine storage system using artificial neural network. Electr. Power Syst. Res. 2013, 96, 267–276, 79. Yang, Y.; Chen, P.; Liu, Q. A wave energy harvester based on coaxial mechanical motion rectifier and variable inertia flywheel. Appl. Energy 2021, 302, 117528.
Authors: M.S. ALI is a PhD student at the Department of Electrical, Electronic and Systems Engineering, Universiti Kebangsaan Malaysia (UKM), E-mail: mohdshamsul@gmi.edu.my Dr. Mahidur R. Sarker is currently working as Research Fellow to the Institute of IR 4.0, Universiti Kebangsaan Malaysia (UKM). Email: mahidursarker@ukm.edu.my. Dr. Mohamad Hanif Md Saad is currently working as Associate Professor to the Institute of IR 4.0, Universiti Kebangsaan Malaysia (UKM), E-mail: hanifsaad@ukm.edu.my. Dr. Ramizi Mohamed is an Associate Professor of Department of Electrical, Electronic and Systems Engineering, Universiti Kebangsaan Malaysia (UKM), E-mail: ramizi@ukm.my.
Source & Publisher Item Identifier: PRZEGLĄD ELEKTROTECHNICZNY, ISSN 0033-2097, R. 98 NR 7/2022. doi:10.15199/48.2022.07.24
Published by 1. Tomasz PERZYŃSKI1, 2. Vitaliy LEVONIUK2, 3. Radosław FIGURA1, Faculty of Transport, Electrical Engineering and Computer Science, University of Technology and Humanities in Radom (1) Department of Electrical Systems, Lviv National Agrarian University (2) ORCID: 1. 0000-0001-5105-5034; 2. 0000-0003-2113-107X; 3. 0000-0001-8048-5623
Abstract. The mathematical model of a fragment of ultrahigh voltage electric network is developed in this paper. The network consists of a long power line with distributed parameters and equivalent three-phase active-inductive load. Transient electromagnetic processes are analysed in present work. The results of transient electromagnetic processes simulation in the form of analysed figures are shown. All the results presented in this paper were obtained exclusively using numerical methods.
Streszczenie. W pracy zaprezentowano model matematyczny fragmentu sieci elektroenergetycznej wysokiego napięcia. Sieć składa się z długiej linii elektroenergetycznej o rozłożonych parametrach i równoważnym trójfazowym obciążeniu czynno-indukcyjnym. W niniejszej pracy analizowane są przejściowe procesy elektromagnetyczne. Przedstawiono wyniki symulacji nieustalonych procesów elektromagnetycznych w postaci wykresów. Wszystkie wyniki przedstawione w niniejszej pracy uzyskano wyłącznie metodami numerycznymi. (Analiza przejściowych procesów elektromagnetycznych w linii przesyłowej wysokiego napięcia podczas zwarć dwufazowych).
Słowa kluczowe: elektromagnetyczne procesy przejściowe, warunki brzegowe, zwarcie dwufazowe, sieć elektroenergetyczna. Keywords: transient electromagnetic processes, boundary conditions, short circuit, electrical network.
Introduction
It is necessary to take into consideration the occurrence of emergency modes when designing electrical networks. It is important to do as they usually are accompanied by damage to the elements of electrical networks. The most dangerous and common emergency mode is a short circuit mode. After all, there are significant short-circuit currents in the elements of electrical networks. They cause thermal and electrodynamic action and are accompanied by a sharp voltage decrease in the electrical network. Short-circuit currents can overheat conductive parts or even melt wires (temperatures can reach up to 20000 °K). So there comes a partial or complete termination of electricity supply to consumers. Also, this damage leads to damage caused by an electric arc that occurs at the point of short circuit and can affect adjacent objects.
Short circuits decrease the voltage at the network nodes which affects the technological processes disruption and the stability of the power system as well. Analysis of recent research A mathematical models for the calculation of electromagnetic transient processes are included in the [1- 5]. The model in three-phase lines has been developed in [6]. But the model can be used at two-phase short circuits as well.
Analysis of recent research
Paper [7,8] presents a mathematical model of the transmission line, which is based on the methods of “lost elements” and “space state of the line”. The proposed method is a simple and practical procedure for modeling the three-phase transmission line directly in the time domain without explicitly using inverse transforms. Satisfactory verification of the obtained results with the performance of the EMTP-RV software suite has been presented.
In [9–11], a mathematical model of a power transmission line with distributed parameters was created, which is based on the equations of a long line of the first order with given boundary conditions of voltage and current along the edges of the line.
In [12], the application of first-order long-line equations for the study of transients processes in the ground wire is considered. The simulation is performed in the frequency domain with the subsequent transition to time.
The article [13] presents a mathematical model of a perfectly transposed three-phase power line. The model allows you to calculate phase currents and voltages along the line as a function of time coordinate. An analysis of the results of a computer simulation that turns on the power line in non-working stroke mode is presented in the paper.
A model of three-phase power lines with distributed parameters has been created in [14] using the software package PSCAD. This model can be used to simulate transient electromagnetic processes during switching, short circuits and other modes of line operation.
In [15] the study of overvoltages in the line of ultrahigh voltage was carried out. The power line here is represented by a series connection of alternate circuit circuits. The computer simulation was performed in the ATP software package.
In [16], with the help of the PSCAD software package, surge simulations in the 500 kV line during a lightning strike were simulated. The coronation phenomenon of wires was neglected during the simulation, ie the running phase and interphase active conductivities were not taken into account.
For the analysis of transient processes in a three-phase power line with arbitrary voltage and current distributions in the line, it is proposed to use the numerical inverse Laplace transform algorithm in [17]. Here the Laplace transform methodology is also used to find voltages and currents along the line edges. Phase voltages and currents are obtained as rational functions of their frequency. It is shown how the numerical inverse Laplace transform can be applied to obtain the distribution of electromagnetic waves in a power line.
The transient electromagnetic processes in symmetric and asymmetric short circuits in different places of the high-voltage power line connected to the generating unit busbars. They are analysed in [18]. The equations of voltages and currents of the transmission line and substation buses are written in phase coordinates. It gives a possibility to model easily different asymmetric states. Here, a model for the transient electromagnetic processes analysis has been developed in the MatLab/Simulink software package.
Analysis of the available literature has shown that most studies of transient electromagnetic processes in power lines are carried out by replacing the equation of the long line (telegraph equation) with a circular equivalent [13-16], which is not always effective. Also, we can say that to the mathematical modelling of these processes in long power lines at the field level is given insufficient attention. It is a fact, that work in this direction has been underway for a long time. Commonly used approaches require well-defined boundary conditions to the long line equation [6, 9, 12, 17], or they are burdened by analytical integration [7,8]. With regard to the MatLab/Simulink software package, the distributed parameter line model built into the Simulink library is simplified. This model doesn’t take into account the running resistance, phase and interfacial conductivity, in order to simplify the calculations by the method of D’Alembert [18-20]. The same approaches are used in other software tools [21]. But this may affect the adequacy of the results.
Thus, the aim of the work is to develop methods of mathematical modelling and analysis of transient electromagnetic processes in long three-phase power lines in emergency modes.
Presentation of basic material
To obtain equations of the electromagnetic state of the studied objects, researchers usually use two main approaches. The first is a classical approach based on the law of conservation of energy. The second is a variational approach based on minimizing the functionality of the studied object. Each of these approaches has its drawbacks and advantages, but when used correctly, they both lead to the right results [22].
We propose to use a modified Hamilton–Ostrogradsky principle (variational approach) for the analysis of transient electromagnetic processes in the elements of electrical networks [23]. This approach avoids the decomposition of a single dynamic system. The initial equations of the electromagnetic state of the object under study can be obtained solely on the basis of a single energy approach by constructing an extended Lagrange function [23]. This approach is especially relevant for systems with distributed parameters, in particular for long power lines.
The theory of transient electromagnetic processes analysis in long power lines based on variational approaches in a single-line version was developed in [23] and further developed in [24]. To reproduce fully these processes in long power lines, which often operate in asymmetric modes, they are necessary to be modelled in multiphase execution. Therefore, we will build a mathematical model of the line in three-phase execution.
Fig. 1 presents the calculation scheme of the electrical network fragment we study. The key element is a long power line. It is presented in three-phase design as a line with distributed parameters (here are shown only the first and last discrete nodes of the line). A voltage is applied to the beginning of the line. At the end an equivalent three-phase active-inductive load is connected to it.
There are elements both with the concentrated and with the distributed parameters in the fragment of an electric network we investigated.
Fig.1. Calculation scheme of the studied fragment of the electrical network (for the first and last discrete section of the line)
Hamilton-Ostrogradsky principle
Therefore, the Hamilton-Ostrogradsky action functional looks like this [23]:
.
where S – action according to Hamilton–Ostrogradsky; I – energy functional; L* – extended Lagrange function, Ll– linear density of the modified Lagrange function [23]:
.
where T~* – kinetic coenergy, P* – potential energy, Φ* – energy dissipation, D* – energy of outside nonpotential forces, with index l the corresponding linear densities of energies.
It is possible to get acquainted with a technique of receiving similar equations of an electromagnetic state. For example, in our works [25-27]. Therefore, in order to reduce the volume of material, we propose ready-made equations for the studied fragment of the electrical network (Fig. 1).
Mathematical model of a fragment of the electric network
We present the final equations of the electromagnetic state of the studied fragment of the electrical network in matrix-vector form:
.
.
In (3) and (4) L0, R0, C0, G0 – inductance, resistance, capacitance and conductivity matrix.
The problem of solving (3) is to determine the boundary conditions. In our case we know the voltage at the beginning of the line (u1 = u│х = 0), but not at the end of it. Therefore, it is necessary to find only the boundary condition at the end of the line. Note that the line is loaded with an equivalent three-phase active-inductive load.
In [24] symmetrical modes were considered for homogeneous long power lines. That is why the line was modelled in a single-phase (single-line) design. We propose to use the boundary conditions of the second and third genera (boundary Neumann and Robin–Poincare conditions). Also the equation that can be obtained by Kirchhoff’s second law for electric circuits with distributed parameters. We propose to use this approach for three-phase systems. Let’s write the mentioned equation in matrix-vector form:
.
By discretizing (1) by the method of lines, using the notion of the central de-rivative, we obtain:
.
Write (6) and (7) for the last discrete node of the line (j = N):
.
Analysing (8) and (9), we see that they have an unknown voltage in the fictitious node uN+1. This makes it impossible to find the voltage at the last discrete node of the lineuN (8). Also we cannot find the current in the last discrete branch of the line іN (9). The voltage uN+1 does not exist in nature and it has no physical meaning. It is a purely fictitious-mathematical quantity.
The value of the current in the first discrete branch of the line or, if necessary, in all discrete line branches, can be calculated by discretizing (5) by the lines method, but now using the concept of the right derivative:
.
Computer simulation results
We wrote program code in the algorithmic programming language Visual Fortran to perform a computer simulation, based on the developed mathematical model. The code allows you to reproduce transient electromagnetic processes in the studied fragment of the electrical network (Fig. 1).
Description of the order and parameters of the simulation
The simulation was performed as follows in the first experiment. The power line was switched on at time t = 0s with asymmetric equivalent three-phase active-inductive load on the normal mode of operation. A two-phase short circuit to ground was simulated after entering the steady state, at time t = 0,11s, at the end of the power line (phases A and B, see Fig. 1).
The power line in the second experiment was switched on for a two-phase short circuit at the end of the power line at time t = 0s (as in the previous experiment, the short circuit to ground was simulated in phases A and B).
Experiment
Fig. 2 show the spatial distributions of phase voltages at time t = 0,001s and phase currents at time t = 0,007 s, respectively. These figures reflect very well the course of wave electromagnetic processes in the power line, so let’s analyse them.
We can see from Fig. 2 that during the start of the transmission line to normal operation at time t = 0,001s, the voltage of phase A at the beginning of the line has a value of 200 kV. At a distance of 350 km from the beginning of the line, the voltage is still zero.
Fig.2. Spatial distributions of phase voltages in the line at time t = 0,001s
Figure 3 show the temporal-space voltage and current distributions of phase B. These figures are made in 3D format, they combine both time and space distributions of voltage and current in a line.
Fig.3. Temporal-spatial voltage distribution of phase B in line at the time t ∈ (0; 0,03) s
The analyse of the mentioned figures show that when the line is switched on for an equivalent asymmetric active-inductive load. The phase B voltage has the largest fluctuations at the end of the power line (Fig. 3).
It is advisable to analyze Fig. 3 together with Fig. 2.
Conclusion
The application of Neumann and Robin–Poincare boundary conditions to identify boundary conditions to the differential equation of a long line of the second order makes it possible to effectively solve problems related to the analysis of transient electromagnetic processes in ultrahigh voltage lines, where they must be considered as distributed parameters.
Introduction to the mathematical model of the line, which is based on a discretized equation of a long line. To solve it the boundary conditions of the second and third genera are applied, the parameter “output voltage” (voltage at the end of line u2) allows making the line model more autonomous and universal on the one hand. On the other – opens wider possibilities for reproduction of emergency states of operation of the line.
Presented in 3D format temporal-spatial distributions of voltages and currents maximally illuminate information about wave processes in the line. They also confirm the physical principles of electrodynamics regarding the flow of wave electromagnetic processes in long power lines. They indicate the high adequacy of the developed mathematical model.
The materials of this work will be used in further research on the joint operation of turbogenerators, unit transformers, switching facilities and ultra-high voltage long transmission lines.
LITERATURE
[1] Szafraniec, A., Halko, S., Miroshnyk, O., Zharkov, A., Vershkov, O., Magnetic field parameters mathematical modelling of windelectric heater, Przeglad Elektrotechniczny, 97(8) (2021) [2] Czaban, A., Levoniuk, V., Figura, R., The mathematical model of high voltage switch as an element of a power system, Przeglad Elektrotechniczny, 97(7), 94-97, (2021) [3] Lis M., Chaban A., Szafraniec A., Levoniuk V., Figura R., Mathematical modelling of transient electromagnetic processes in a power grid, Przegląd Elektrotechniczny, nr 12/2019, 160-163 [4] Chaban, A., Perzyński, T., Popenda, A., Figura, R., Levoniuk, V., Mathematical Modeling of Transient Processes in the Susceptible Motion Transmission in a Ship Propulsion System Containing a Shaft Synchronous Generator, Energies, 15(9), (2022), 3266 [5] Popenda A., Szafraniec A., Chaban A., Dynamics of Electromechanical Systems Containing Long Elastic Couplings and Safety of Their Operation, Energies, 14 (2021), 7882 [6] Lobodzinsky V., Chibelis V., Mathematical model of a threephase line with distributed parameters in electromagnetic transients, BULLETIN OF KNUTD, (2018), No. 4, 96-102 [7] Costa E.C.M., Kurokawa S., Pissolato J., Prado A.J., Efficient procedure to evaluate electromagnetic transients on threephase transmission lines, IET Generation Transmission & Distribution, (2010), No. 4, 1069-1081 [8] Colqui J.S.L., de Ara´ujo A.R.J., Kurokawa S., Performance of the modified lumped parameter model in the electromagnetic transient analysis, Proc. the 13th latini-american congress on electricity generation and transmission, (2019) [9] Andrade L., Leite H., Leao M., Time-domain distributed parameters transmission line model for transient analysis, Progress In Electromagnetics Research B., 53 (2013), 25-46 [10] Chaban A., Lis M., Szafraniec A., Chrzan M., Levoniuk V., Interdisciplinary modelling of transient processes in local electric power systems including long supply lines of distributed parameters, IEEE Xplore, 2018 Applications of Electromagnetics in Modern Techniques and Medicine (PTZE), 17–20 [11] Czaban A., Lis M., Szafraniec A., Chrzan M., Levoniuk V., Analysis of transient processes in a power supply system of concentrated and distributed parameters based on variational approaches, Przegląd Elektrotechniczny, 94 (2018), nr 12, 154-157 [12] Shi Z., Liu L., Xiao P., Geng Z., Fang G., Applying transmission line theory to study the transmitting turn-off current in a long grounded wire, IEEE Transactions on Antennas and Propagation, 65 (2017), No. 10, 5112-5122 [13] Kizilcay M., Teichmann K., Papenheim S., Malicki P., Analysis of switching transients of an EHV transmission line consisting of mixed power cable and overhead line sections, Proc. International Conference on Power Systems Transients, (2017) [14] Smolarczyk A., Chmielak W., PSCAD / EMTDC as a convenient tool for modeling overhead lines, Works of the electrotechnical institute, (2016), No. 272, 31-48 [15] Nuricumbo-Guillén R., Espino Cortés F.P., Gómez P.,. Martínez C.T, Computation of transient profiles along nonuniform transmission lines including time-varying and nonlinear elements using the numerical Laplace transform, Energies, (2019), No. 12, 3227 [16] Chen C., Han Y., Liu J., Mo W., Yuan Z., Huang J., Su H., Zhang X., Wu K., Research on the lightning intruding overvoltage and protection measures of 500 kV AC fault current limiter, Energies, (2019), No. 12, 3845 [17] Jung-Chien Li, Transient analysis of three-phase transmission lines with initial voltage and current distributions, Electric power systems research, 35 (1995), No. 3, 177-186 [18] Pruski P., Paszek S., Analysis of transient waveforms in a power system at asymmetrical short-circuits, Przeglad elektrotechniczny, (2020), No. 2, 26-29 [19] Vijaya T.С., Nandhini M., Sundar R., Nithiyanantha K., MATLAB based simulations model for three phases power system network, International Journal for Research in Applied Science & Engineering Technology, 4 (2016), No. 11, 502-509 [20] Shcherba A., Podoltsev A., Kucheryavaya I., Electromagnetic processes in a cable line with polyethylene insulation at a voltage of 30 kV, Technical electrodynamics, (2013), No. 1, 9-15 [21] Rout B., Pati B.B., MFO Ptimized Fractional Order Based Controller on Power System Stability, Proceedings of Engineering and Technology Innovation, 8 (2018), 46-59 [22] White D.C., Woodson H.H., Electromagnetic energy conversion, New York: John Wiley & Sons Inc., (1958) [23] Chaban A., Principle Gamіltona-Ostrogradskogo in elektromechanіcal systems, Lviv: T. Soroky, (2015) [24] Levoniuk V.R., Methods and means of analysis of switching transients processes in ultra high voltage transmission lines on the basis of variational approaches, Ph.D. dissertation, Department of Electrical Systems, Lviv Nat. Agrarian Univ., Lviv, Ukraine, (2019) [25] Czaban A., Szafraniec A., Levoniuk V., Mathematical modelling of transient processes in power systems considering effect of high-voltage circuit breakers, Przeglad Elektrotechniczny, (2019), No. 1, 49-52 [26] Chaban A., Levoniuk V., Drobot I., Herman A., Mathematical model of electromagnetic processes in Lehera line at opencircuit operation, Electrical engineering & electromechanics, (2016), No. 3, 30-35 [27] Chaban A., Lis M., Szafraniec A., Levoniuk V., Mathematical Modelling of Transient Processes in a Three Phase Electric Power System for a Single Phase Short-Circuit, Energies (2022), No, 15, 1126
Autorzy: dr hab. inż. Tomasz Perzyński, prof. UTH Rad., University of Technology and Humanities in Radom, Faculty of Transport and Electrical Engineering, ul. Malczewskiego 29, 26-600 Radom, Email: t.perzynski@uthrad.pl; Ph.D. Vitaliy Levoniyk, Lviv National Agrarian University, Department of Electrical Systems, 1, V. Velykogo str., 80381 Dubliany, Lviv region, Ukraine, E-mail: Bacha1991@ukr.net; dr inż. Radosław Figura, University of Technology and Humanities in Radom, Faculty of Transport and Electrical Engineering, ul. Malczewskiego 29, 26-600 Radom, Email: r.figura@uthrad.pl.
Source & Publisher Item Identifier: PRZEGLĄD ELEKTROTECHNICZNY, ISSN 0033-2097, R. 98 NR 12/2022. doi:10.15199/48.2022.12.67
Published by Olena RUBANENKO1, Sree Lakshmi GUNDEBOMMU2, Iryna HUNKO3, Zdenek PEROUTKA1, Regional Innovational Center at the Faculty of Electrical Engineering University of West Bohemia (1), Plzen, Czech Republic CVR College of Engineering Mangalpalli (2), Hyderabad, India Vinnytsia National Technical University (3), Vinnytsia, Ukraine
Abstract. In this paper the analysis of online diagnostics of synchronous generations (SG) are presented. The main focus is done on different fault identification methods. The main causes for the failure of synchronous generators and the development of fault tree for different elements of synchronous generators are presented. Also presented the determination of the index of residual lifetime, for hydrogen cooled turbo generator of capacity 165 MW.
Streszczenie. W artykule przedstawiono stan wiedzy na temat różnych metod diagnostyki generatorów synchronicznych (SG). Szczególną uwagę zwraca się na metodologie identyfikacji awarii Przedstawiono główne awarie SG. W artykule stworzono drzewo błędów dla głównych elementów SG. Przedstawiono wyznaczenie wskaźnika resztkowej żywotności turbogeneratorów chłodzonych wodorem o mocy 165 MW. (Metody diagnostyki online generatorów synchronicznych)
Synchronous Generators (SGs) are the fundamental components of most types of power plants. Their proper function is crucial for power delivery [1]. For example, in the report on the results of the activity of the National Commission for State Regulation of Energy and Utilities in Ukraine [2], in 2018, the technical condition of the energy sector infrastructure is approaching critical due to the high degree of equipment wear and tear, technology obsolescence, lack of sufficient investment, namely at most power plants, the design resource for the equipment has already been exhausted and is being used beyond the lifetime of the plant. For example, out of 75 generating units of thermal power plant companies, 68 units (16962 MW or 78.7%) are operated over the park lifetime, 2 units (600 MW or 2.8%) are operated over the term of operation and 5 units (4 000 MW, or 18.6%) is in excess of the design lifetime. Fig. 1 shows a diagram of the technical state of power units by the resource of work as of 01.01.2019, and, accordingly, the powerful synchronous generators of TPP (thermal power plants) [2, 3].
The early detection of SGs defects is essential. Timely diagnostics of SGs operating condition reduces the damage to power plants due to their extended failures. The forced outages and corresponding repairs are accompanied by economic damage, leading to fines, and reduced profits from the sale of electricity. For instance, in Texas, broken strands of stator bars on the end-winding could lead to massive faults for SGs, a problem that happened on a similar 750 MW SG unit one year ago. In the UK, the cooling water blockage of the SGs stator might cause a 500 MW SGs completed rewinding. In Belgium, errant shipping baffles led to overheating, which could result in fatal damages within a 500 MW SGs commissioning. These SGs all had experienced a similar phenomenon; they have been alerted of potentially serious failure by an SG’s condition monitoring system [4]. Accordingly, diagnostic tests and condition monitoring features of rotating machines, particularly synchronous generators, play a crucial role in power system and modern industries [5]. The predictive maintenance needs diagnostic solutions to identify when significant defects and non-desired conditions have happened, and when the maintenance is essential to prevent an in-service failure.
Fig.1.Technical state of power units of heat power plants by the resource of work as of 01.01.2019 in Ukraine [2]
In the last decades, several off-line diagnostic testing methods and on-line monitoring approaches have been presented. These off-line and on-line methods have been implemented, particularly on important electrical machines. Different off-line diagnostic tests and on-line monitoring solutions, e.g. magnetic flux, partial discharge, temperature monitoring, and end winding vibration, have been improved effectively. However, some more modernized tests such as polarization/depolarization current, dielectric spectroscopy, and on-line leakage current monitoring have been developed. As explained, the off-line diagnostic tests and on-line monitoring systems of electrical machines, particularly SGs, have received a great deal of attention.
In Fig. 2 (b), the components of SGs that might fail and cause forced outages are shown [3]. The SGs failure modes are also presented in Fig. 3.
Fig.2. SG’s statistical analysis of (a) cause of failures; (b) failures of components [3]
As revealed by Fig. 2 (b), the diagnostic tests and condition monitoring’s are useful for SG’s designers, manufacturers, operators, maintenance groups, and owners.
The first result that claims attention from Fig. 3 is that the stator and rotor windings (electrical parts) are the most important parts, which could experience failures and lead to a forced outage of SGs. In [6] shown of the stator windings fault can be 21-40 %.
But all faults depend on type synchronous generators and place, where are operated. Investigated different types of four turbogenerators TPP and HPP (hydroelectric power plants): generator (SG) of HPP 117 MW, manufacturers, operators, maintenance groups, and owners.
Hydrogen-cooled synchronous turbogenerator (HCST) 300 MW; Hydrogen-water-cooled synchronous turbogenerator (HWCST) 165 MW; Hydrogen-cooled synchronous turbogenerator (HCST) 100 MW; Synchronous The first result that claims attention from Fig. 3 is that the stator and rotor windings (electrical parts) are the most important parts, which could experience failures and lead to a forced outage of SGs. In [6] shown of the stator windings fault can be 21-40 %. But all faults depend on type synchronous generators and place, where are operated. Investigated different types of four turbogenerators TPP and HPP (hydroelectric power plants):
The interesting solutions for online SG diagnostics have been presented by e.g. ABB [7], Siemens, Fortum, Kinectrics, EthosEnergy, Entegro, Elektromotors. Fortum offers, PD monitoring of the stator winding; rotor flux monitoring; monitoring stator winding and cooling air temperatures; monitoring bearing vibration; operating parameter trends; generator protection relays and oth. But have some problem, because online diagnostics can: identify 5% failure modes and detect an additional 35% [3]. Siemens has a fine solution: GenAdvisor monitoring and diagnosis system, that allows PD, inter-turn short circuits in the rotor, vibrations in the stator end windings, voltages in the rotor forging as well as currents via the shaft grounding brushes [8] (Fig. 4).
Fig.3. SG’s failure modes [3]
Different diagnostic tests and measurements have been introduced for SGs. The most important methods, which have been practically used in industrial plants, are as follows: Fig. 3. SG’s failure modes [3] Different diagnostic tests and measurements have been introduced for SGs. The most important methods, which have been practically used in industrial plants, are as follows:
– temperature monitoring system; – end winding vibration monitoring [9]; – partial discharge measurements [10]; – rotor inter-turn short circuit measurement [11, 12]; – shaft voltage and shaft grounding current monitoring [13]; – digital torsion monitoring [14]; – frequency response analysis (FRA) [15, 16].
Several technical barriers adversely affect the diagnostic tests and condition monitoring systems, as follows [17, 18]:
– Uncertainty of the complete set of measures for assessing the SG’s condition; – it is not possible to define an integral criterion for all failures; – different factors affect the decision-making about the SG’s defects and failures; – some factors just have a quantitative expression; – the complex relationship among influencing factors; – the difficulty of mathematical modeling for crucial factors and their interconnections; – lack of information about the parameters and the influencing factors; – the dependency of the diagnosis and decision-making system on the experiences, qualifications, and intuition of staff.
Fig.4. Main measurements for SG diagnostics
These features limit the capabilities of conventional diagnostics and condition monitoring systems. Hence, the expert systems (ESs) are deployed for developing an efficient condition monitoring system. The heuristic algorithms using historical data, technical measurements, and questioner-based data collection of academic and industrial experts facilitate the well-organized condition monitoring solutions [19-21].
Firstly, it is necessary to create a database of SG’s faults and abnormal conditions and their main reasons. Although different models have been introduced about SG’s faults and defects, a comprehensive model that categorized all failures and corresponding reasons have not been developed. In the second step, we use Fuzzy-AHP (analytic hierarchy process) technique to set a database of SG’s failures and their reasons.
Fig.5. Fault tree of stator failures’ reasons
Moreover, to assess the validation of our identified failures, failures’ reasons, and diagnostic tests, carried out several laboratory experimental tests, site visits, and frequently communicated with the industrial experts and academic specialists. It should be noted that the AHP methods have been deployed in other technical studies and knowledge management projects, while in the field of SGs have not been utilized effectively. This study benefits from Fuzzy-AHP techniques’ advantages. The Fuzzy-AHP technique has been employed, which is more efficient in comparison to its conventional non-fuzzy version. Because it could better handle the uncertainties as well as obscure judgments in multi-criteria decision making (MCDM) problems. Afterward, based on the developed Fuzzy-AHP model, the fault tree of each sub-system is produced. For instance, the typical fault tree for the stator of SGs is shown in Table 1 and Fig. 5. The main contribution here can be the creation of a universal database about faults and FTA that can adapt for the operational conditions. The main approach for creating FTA is well described in the International standard IEC 61025.
Determination of the residual lifetime of the synchronous generator
External inspection (the first level of assessment of the technical condition of the SG) provides a simplified assessment. It allows to detect: noise, vibration, high temperature and other defects.
Table 1. List of reasons for stator failures of a typical SG
.
At the second level, the technical condition of not only the external elements of the SG, but also the internal elements (for example, the amplitude frequency response of the stator windings), as well as by determining the technical condition of the SG in the scope of maintenance tests. At this level, the main goal is a determination more accurately technical condition than at the first level. Also assess the physical wear of SG to justify the possibility of further operation, as well as repairing of internal defects, at the initial stage of their development, prediction of an emergency situation. To increase the efficiency of the operation of the diagnostic system is proposed usage ANN (artificial neural networks) and expert system. Expert systems, based on the structured knowledge-rules recorded in the database, provide the necessary information support, based on the experience of highly qualified experts and the necessary data from the database.
Currently existing SG diagnostic systems use well-known mathematical SG models in their calculations, but these models have a significant drawback – they cannot identify and account for functional relationships between many of the monitored diagnostic parameters simultaneously in a single mathematical model in real-time. The task is complicated by the incompleteness of the initial data, when some of the parameters are not known at the time of calculation, for example, due to the need for additional research on disconnected SG, and SG at this time it is desirable not to disable. ANN is a very constructive technology for establishing such connections. For example, showed assess technical condition for hydrogen-cooled turbo generator capacity 165 MW. This SG is used on a thermal electric station. Firstly, created a table 1 with collected all data – the main reason for failure in this SG and probability occurrence. This data is statistic data for all time operation by taking into account expert minds and normative documents.
In Table 2, under the controlled diagnostic parameter is the parameter, the deviation of which from the normative value contributed to the removal of SG for repair, or was taken into account when removing SG for repair. As diagnostic parameters in Table 2 are: parameters that characterize the condition of the elements SG.
In Table 2 and in Fig. 6 shows: k1-k6 – residual lifetime indexes: bearings, excitation systems, brushes, stator, rotor, cooling system; R1-R6 – resistance of insulation grounding, contact winding, T1-T9 – the temperature of the magnetic circuit, contacts, arrester, stator steel; V1-V7– vibration.
After analyzing the data in Table 1 and literature sources, a diagram is created that shows the dependent or independent influence of diagnostic parameters on the coefficient of the total residual TG lifetime (Fig. 6).
Fig.6. Block scheme of the SG residual lifetime ratio model
Table 2. Reasons to removal for repair SG and probability occurrence
.
In Fig. 3 shows the percentage of detected failed elements, which is given as a percentage of the total amount of failed elements. In Fig. 6 marked the blocks of elements of SG, for that deviation their parameters from normative value to be reasons to removal for repair SG. In order to obtain a total index of the residual lifetime, which is determined by taking into account the values of all diagnostic parameters and their impacts, it is proposed to move from the known values of diagnostic parameters of main elements od SG to the corresponding values of a index of residual lifetime for each diagnostic parameter. These indexes are determined in nondimensional units and characterize the total operating time of the SG from the moment of control of its technical condition to the transition to the limit condition, when the diagnostic parameter reaches the limit value of residual technical lifetime.
The coefficient of residual resource ki on the i-th diagnostic parameters:
.
where xi1,lim is the limit normative value of the i1th diagnostic parameter; хі1,cur is the value of the i1th diagnostic parameter at the time of control; хі1,initial is the initial value of the i1th diagnostic parameter (at the time of commissioning of new equipment or after repair ); i1 is diagnostic parameter.
Thus, for hydrogen-cooled turbo generator capacity 165 MW, the insulation resistance of the stator winding R3 – after repair was 150 MΩ, and at the time of diagnosis was 60 MΩ, the limit value of this parameter is 0.5 MΩ. Therefore, the index of residual lifetime kR3 for the diagnostic parameter R3 is determined by expression (1):
.
For the serial part of the block diagram, the coefficient of the total residual lifetime is defined:
.
where kτ is the coefficient of the residual SG lifetime for the i-th diagnostic parameter, τ is the τth diagnostic parameter, v is the number of blocks in the serial part of the block diagram, pτ is the probability of deviations of the controlled parameter from the maximum allowable normative value of this parameter:
.
where yτ is the number of deviations of the controlled parameter from the maximum allowable normative value of this parameter, which were detected by controlling the τth diagnostic parameter from the total number of detected deviations of controlled parameters from the maximum allowable normative value, m is the total number of detected deviations of controlled diagnostic parameters maximum allowable normative values. Therefore, the coefficient of the total residual lifetime SG is determined by the expression:
.
where kk1, kk2, kk3, kk4, kk5, kk6 – known at the time of calculation of the values of the indexes of the residual lifetime, respectively, on the parameters k1, k2, k3, k4, k5, k6; рk1, рk2, рk3, рk4, рk5, рk6 – probabilities of deviations of values of diagnostic parameters from maximum admissible normative values taking into account the total number of deviations of all diagnostic parameters, according to Table1: pk1 = 0.4; pk2 = 0.05; pk3 = 0.03; pk4 = 0.15; pk5 = 0.32; pk6 = 0.05.
Then, for a case when k1 = k2 = k3 = k4 = k5 = k6 = 1, ktot.res = 1, at k1 = k2 = k3 = k4 = k5 = k6 = 0.5; ktot.res = 0.5 and at k1 = k2 = k3 = k4 = k5 = k6 = 0, ktot.res = 0.
To create a mathematical model of the index of the residual lifetime SG was used parameters, that can be concluded about the condition of SG. But none of these parameters fully characterizes the technical condition of the SG, it only indicates certain changes in the technical condition of the SG. If one of these technical parameters goes beyond the normative limits, it does not mean that the SG has completely lost its efficiency. Therefore, the task is to find not always known, fuzzy interactions of different technical parameters on the general technical condition of SG and the most accurate prediction of the dynamics of damage and their impact on the general technical condition.
ANN allows us to take into account the values of different diagnostic parameters when diagnosing SG and create a basis for the rules of their interaction. Created a mathematical model of the residual resource index, which can obtain the analytical dependence of the residual SG lifetime index on diagnostic parameters in the form of a polynomial.
The formation of initial training data was carried out as follows. For the six input parameters of the model, which changed from 0 to 1, the index of the total residual lifetime was determined. For the convenience of data application and simplification of current calculations in the MATLAB the input parameters of the model were reduced to relative units of their deviation from the norm.
The six input parameters of the model are the coefficients of the residual SG lifetime, which correspond to the six diagnostic parameters. The number of parameters can be larger.
Table 3. The parameters of the sensor List of reasons for stator failures of a typical SG
.
Table 4. The fragment of values of residual lifetime SG index corrected by experts
.
A fragment of the calculation results is given in table III. The complete table contains 1212 considered variants of combinations of diagnostic parameters and the corresponding values of the total residual SG lifetime. Next, in 63 rows of this table, the value of the residual SG resource index was adjusted by interviewing experts: qualified representatives of the SG repair shop of the TPP and usage statistic information about the failure in this type SG. The corrected data were used as training data in modeling in the computer mathematics system MATLAB The Fuzzy Logic Toolbox was used for this purpose. Using the ANFIS Editor (Edit, Adaptive Network of Fuzzy Inference of the System) using a hybrid learning algorithm and using the Sugeno fuzzy inference algorithm, a neuro-fuzzy model of the residual lifetime index was obtained.
For each input variable of the neuro-model, four linguistic terms with Gaussian membership functions were used, expression (4):
.
where σ2i1 are numerical parameters, in probability theory it is called the dispersion, ci1 is the mathematical expectation, i1 is the input parameter of the model, which corresponds to the diagnostic parameter, and xi1 is the value of i1 input parameter of the model: x1 = k1, x2 = k2, x3 = k3, x4 = k4, x5 = k5, x6 = k6. These are such terms as “normal” values of the diagnostic parameter, “minor deviations” of the value of the diagnostic parameter, “pre-emergency” values of the diagnostic parameter, “emergency” values of the diagnostic parameter. To find the value of the coefficient of the total residual resource we use a fuzzy nonlinear autoregressive model of the coefficient of the total residual resource SG. This model establishes a fuzzy nonlinear transformation between the values of the residual lifetime index for diagnostic parameters and the total index of the residual lifetime: ktot.res = F(k1, k2, k3, k4, k5, k6), where F is a fuzzy functional transformation. The output of the model ktot.res is found as a balanced sum of conclusions of the base of rules written in the form of a system of logical equations.
.
where 0 ≤wj ≤ 1 – the degree of implementation (weight) of the j rule, which is determined by the correspondence of the actual changes in the diagnostic parameters of SG, which are reflected in the j rule. The setting of the model is to determine the parameters of membership functions and output equations. The terms of the values of linguistic variables are given in the form of Gaussian membership functions. It is necessary to determine the standard deviation and mathematical expectation of Gaussian membership functions, the parameters of the equations of inference (a11 – a44, c1 –c4). Results of calculation presented in exspression (6).
.
Conclusion
This paper introduces an approach of a life-time estimation of synchronous generators considering corrective actions. The proposed technique consists of the following stages: creating a database of SG’s faults; building FTA, determination of the residual lifetime of the synchronous generator with the use of ANN. This method was used for the determination of expression for calculation of residual resource hydrogen-cooled turbo generator capacity 165 MW.
There is a research gap about providing a comprehensive scheme for condition monitoring of SGs. In practice, the existing on-line methods could only identify 5% of defects, while 45% of potential failures could not be detected. Therefore need to find new techniques and theories that are searched for the cooperation of different kinds of SGs’ diagnostic models. Need to fill such a knowledge gap by developing a comprehensive method that can detect more potential failures and abnormal behaviors. The proposed approach and diagnostic solutions can decide on this task.
REFERENCES
[1] C. P. Salomon et al., A Study of Fault Diagnosis Based on Electrical Signature Analysis for Synchronous Generators Predictive Maintenance in Bulk Electric Systems, Energies, 12 (2019), nr 58, 1-16 [2] Report on the results of the activities of the National Commission for State Regulation in Energy and Utilities in 2018.NERCEP Resolution No. 440, 29.03.2019.26 [3] G. Csaba, Generator diagnostics from failure modes to risk for forced outage [Online]. Available: https://irispower.com/wpcontent/uploads/2018/06/ [4] Available: https://eone.com/hydrogen-systems/technicalreprints/condition-monitoring-turbine [5] T. Wang, G. Lu, and P. Yan, A Novel Statistical Time-Frequency Analysis for Rotating Machine Condition Monitoring, IEEE Transactions on Industrial lectronics, 67 (2020), no. 1, pp.531-541. [6] L. Frosini, Monitoring and Diagnostics of Electrical Machines and Drives: a State of the Art in 2019 IEEE Workshop on Electrical Machines Design, Control and Diagnosis (WEMDCD), 1 (2019),169-176. [7] REG 670 – Generator protection. Available: https://new.abb.com/substation-utomation/products/protectioncontrol/generator-protection/reg670 [8] GenAdvisor monitoring and diagnosis system for turbogenerators. Available: https://assets.new.siemens.co [9] Y. Shan, J. Zhou, W. Jiang, J. Liu, Y. Xu, and Y. Zhao, Vibration Tendency Prediction of Hydroelectric Generator Unit Based on Fast Ensemble Empirical Mode Decomposition and Kernel Extreme Learning Machine with Parameters Optimization, 11th International Symposium on Computational Intelligence and Design (ISCID), 2 (2018), 287-290. [10] K. Tanaka, H. Kojima, M. Onoda, and K. Suzuki, “Prediction of residual breakdown electrical field strength of epoxy-mica paper insulation systems for the stator winding of large generators,” IEEE Transactions on Dielectrics and Electrical Insulation, vol. 22 (2015), no. 2, 1118-1123 [11] J. Li, W. Shi, and Q. Li, Research on interturn short circuit fault location of rotor winding in synchronous electric machines, 20th International Conference on Electrical Machines and Systems (ICEMS), 2017, . 1-4. [12] W. Shuting, L. Yonggang, L. Heming, and T. Guiji, A Compositive Diagnosis Method on Turbine-Generator Rotor Winding Inter-turn Short Circuit Fault, IEEE International Symposium on Industrial Electronics, 3 (2006), 1662-1666. [13] P. I. Nippes, “Early warning of developing problems in rotating Machinery as provided by monitoring shaft Voltages and grounding currents,” IEEE Transactions on Energy Conversion, 19 (2004), no. 2, pp. 340-345. [14] Y. Zhihe, H. Xuhuai, and C. Guang, Research of torsional vibration monitoring platform for turbine generator, IEEE International Conference on Computer Science and Automation Engineering (CSAE), 3 (2012), 577-580. [15] S. Uhrig, F. Öttl, N. Augeneder, and R. Hinterholzer, “Reliable Diagnostics on Rotating Machines Using FRA,” in Proceedings of the 21st International Symposium on High Voltage Engineering, Cham, (2020), 738-751. [16] O. Rubanenko, M. Grishchuk, and O. Rubanenko, “Planning of the experiment for the defining of the technical state of the transformer by using amplitude-frequency characteristic,” Przeglad Elektrotechniczny, 96 (2020), nr 3, 119-124. [17] Z. Gao, C. Cecati, and S. X. Ding, A Survey of Fault Diagnosis and Fault-Tolerant Techniques – Part I: Fault Diagnosis With Model-Based and Signal-Based Approaches, IEEE Transactions on Industrial Electronics, vol. 62 (2015), no. 6, 3757-3767. [18] Z. Gao, C. Cecati, and S. X. Ding, A Survey of Fault Diagnosis and Fault-Tolerant Techniques – Part II: Fault Diagnosis With Knowledge-Based and Hybrid/Active Approaches, IEEE Transactions on Industrial Electronics, 62 (2015), no. 6, 3768-3774. [19] R. Gogulaanand, T. Balasubramaniyavijayan, R. Arunsivaram, S. Aishwarya, P. V. S. Nag, and C. S. Kumar, Intelligent monitoring of Synchronous Generators in Smart Grids using Deep Neural Network, 3rd International Conference on Trends in Electronics and Informatics (ICOEI), (2019), 1376-1379. [20] R. Gopinath, C. Santhosh Kumar, K. I. Ramachandran, V. Upendranath, and P. V. R. Sai Kiran, Intelligent fault diagnosis of synchronous generators, Expert Systems with Applications, 45 (2006), 142-149, [21] J. Zhang, W. Ma, J. Lin, L. Ma, and X. Jia, “Fault diagnosis approach for rotating machinery based on dynamic model and computational intelligence,” Measurement, 59 (2015), pp. 73-87. [22]O. Rubanenko, O. Kazmiruk, V. Bandura, V. Matvijchuk, and O. Rubanenko, “Determination of optimal transformation ratios of power system transformers in conditions of incomplete information regarding the values of diagnostic parameters,” Eastern-European Journal of Enterprise Technologies, Article vol. 4, (2017) no. 3-88, 66-79. [23]P. D. Lezhniuk, O. V. Nikitorovich, and O. E. Rubanenko, “The operative diagnosticating of high-voltage equipment is in the tasks of optimum management the modes of the electroenergy systems,” Technical Electrodynamics, (2012) no. 3, 35-36.
Authors: Olena Rubanenko, Doc., PhD., Regional Innovational Center at the Faculty of Electrical Engineering University of West Bohemia, Plzen, Czech Republic, rubanenk@rice.zcu.cz; olenarubanenko@ukr.net Sree Lakshmi Gundebommu, Prof., PhD., CVR College of Engineering Mangalpalli, Hyderabad, India, s_sreelakshmi@yahoo.com Iryna Hunko, PhD. Department of Electric Stations and Systems, Vinnytsia National Technical University, Khmelnytsky highway 95, 21021, Vinnytsya, Ukraine iryna_hunko@ukr.net; Zdenek Peroutka, Prof., PhD., Dean with the Faculty of Electrical Engineering, Head of the team of Regional Innovational Center University of West Bohemia, pero@kev.zcu.cz
Source & Publisher Item Identifier: PRZEGLĄD ELEKTROTECHNICZNY, ISSN 0033-2097, R. 97 NR 4/2021. doi:10.15199/48.2021.04.04
Published by Felix KALUNTA1, Tolulope AKINBULIRE2, Frank OKAFOR3, Federal Institute of Industrial Research, Lagos (1), University of Lagos (2,3)
Abstract. A hybrid technique for the analysis of series resonance in power network with aggregate harmonic sources is hereby presented. It involves the identification of resonant modes using admittance scan and computation of network currents at the generated harmonic frequencies with cable capacitance included by the creation of dummy loops. The computed cable currents when compared with the corresponding current capacity indicate the amplification of current during resonance.
Streszczenie. Przedstawiono hybrydową technikę analizy rezonansów szeregowych w sieci elektroenergetycznej z zagregowanymi źródłami harmonicznych. Polega ona na identyfikacji modów rezonansowych za pomocą skanowania admitancji i obliczania prądów sieci przy generowanych częstotliwościach harmonicznych z uwzględnieniem pojemności kabla poprzez tworzenie pętli pozornych. Obliczone prądy kabla w porównaniu z odpowiednią pojemnością prądową wskazują na wzmocnienie prądu podczas rezonansu. (Analiza rezonansu szeregowego w sieciach dystrybucyjnych z zagregowanymi źródłami harmonicznych)
Keywords: kron reduction; loop admittance scan; loop current analysis; series resonance. Słowakluczowe: rezonans szeregowy, analiza prądu, harmoniczne.
Introduction
In a radial network involving capacitor banks and nonlinear loads, there is the possibility of series resonance at some frequencies generated by the harmonic producing load leading to current amplification and overloading of power installation [1]. Harmonic filters which are deployed to block the injection of harmonics have proved to be insufficient in curbing the menace of series resonance. Hence, additional precautionary measure like de-rating of all the equipment exposed to resonance threat has been recommended by researchers as a way of accommodating the residual harmonic currents left behind after harmonic filtering [2, 3]. Wrong choice of tuning frequencies is a major cause of deficiency in the deployment of filters because research is still ongoing to develop suitable corrective measures for series resonance [4]. Available techniques such as impedance scan, modal analysis and modal sensitivity method have proved efficacious only for parallel resonance analysis. Some research results on the adaptation of modal analysis to series resonance computations are available in literature [5,6]. However, such method is complicated, and focused only on the determination of network resonant modes without investigating the impact of dominant harmonic frequencies generated by the non-linear loads. The challenge now is to determine the actual frequencies at which series resonance may occur and the level of amplification attained when aggregate harmonic sources are involved.
This paper adopts a combination of admittance scan [7] and mesh current analysis in harmonic domain to determine the indices that characterize series resonance. The method is based on the idea that the occurrence of series resonance depends on the magnitude of harmonic currents generated by the non-linear loads as well as the frequency response characteristics of the network elements. The loop admittance scan is modified by creating dummy loops to represent the inclusion of cable capacitance, in order to capture the dominant frequencies with greater accuracy. The resonant modes whose frequencies coincide with the dominant harmonics generated by the non-linear load are selected as the desired tuning frequencies of the filter. Subsequently, the cable currents are evaluated at each of these dominant frequencies to determine the effective root mean square current as well as the amplification factor. This is necessary for the de-rating of network equipment exposed to series resonance threat.
Procedure for the series resonance analysis
The radial power network in Fig.1 belonging to the Federal Institute of Industrial research Oshodi, Lagos, Nigeria is used as the case study for the demonstration of the proposed method [8]. The equivalent circuit is shown in Fig.2 for more illustration.
Fig.1. 11kV Radial distribution network in the premises of Federal Institute of Industrial Research, Lagos Nigeria
The characteristic parameters of the network elements required for the resonance analysis are listed as follows.
Public Utility Supply Ratings: 11kV, 1MVA, 50Hz, Internal connection: Yg, Source resistance=0.893Ω, Source inductance= 16.58 x 10⁻⁶H.
Cable Parameters: Current rating = 170A, Insulation thickness = 5.6 mm, CSA=70 mm2, Resistance/ph/km= 0.54Ω, Inductance/ph/km=8.02 x 10-3H, Capacitance/ph/km = 5.6 x 10⁻⁶ F
Load Parameters: The power utilization at each load centre are presented in Table1, while Table 2 shows the harmonic spectrum of electroplating equipment emanating from the Fourier Transform of the three phase full wave rectifier current performed in a Matlab Simulink environment.
The procedure is hereby outlined. (i) An isolated circuit of the aggregate non-linear load (the electroplating unit) connected directly to the power supply is simulated to determine the instantaneous current vector.
This vector is subjected to Discrete Fourier Transform, and subsequently the harmonic magnitudes are expressed in percentage of the fundamental (see Table 2).
Table 1. Total Power consumption at each load centre
.
Table 2. Harmonic table for the three phase 6-pulse rectifier used in the Electroplating unit
.
(ii) The aggregate non-linear load is represented by a harmonic voltage source in series with its load impedance. The voltage magnitudes are calculated at the dominant frequencies in Table 2 using equation (1).
.
Z – impedance of non-linear Load at h-th frequency; Irating– Current rating of non‐linear load; Ih-spectrum – harmonic Current at h‐th frequency; I1 –spectrum – fundamental current of the non‐linear load, h – harmonic order
(iii) The detailed procedure for conducting admittance scan is described in [7]. The network is partitioned along the point of common coupling between the consumer distribution network and public utility supply. The consumer side of the network is modeled at each resonant frequency h, and the system supply side is reduced to its Thevenin equivalent also at each resonant frequency. The driving point impedance at the supply section of the network is used as the source impedance of the supply voltage.
Fig.2. The equivalent circuit model of the network used as case study
(iv) The loop impedance matrix is assembled in the absence of cable capacitances and capacitor banks to obtain Zold. Skin effect is accounted for by using (7) in computation of the resistance R of the cable at various discrete frequencies [5].
.
R1 – resistance of the cable at the fundamental frequency (v) The cable capacitances are subsequently added to the network using the π – equivalent model of a cable section. Dummy loops are created at each node where the shunt capacitances exist and assigned mesh numbers n+1, n+2,… n+m as indicated in Fig. 2. Extra rows and columns corresponding to the position of each dummy loop is added to the old impedance matrix to form a partitioned matrix as in (8).
.
n – number of network loops, m – number of dummy loops [A] – (n × m) matrix of branch impedances shared by each dummy loop and the actual loops adjacent to them [Q] – diagonal matrix of loop impedances of the respective dummy loops.
For a p-th dummy loop formed by parallel connection of the shunt capacitance Cp across a branch impedance Zp preceeding the actual loop k,
.
where p =1, 2, … , m and p=k
The entries are zero elsewhere in the matrices A and Q. ω – the fundamental frequency in radian/s
(vi) The dummy loops are eliminated from the network individual. For each dummy loop, the matrix old Z is expanded to include an (n+1)th row and (n+1)th column whose entries are obtained from the p-th column of matrix [A] as shown in (12). The p-th dummy loop is subsequently eliminated by a modified kron-reduction process described in (13) – (17) to obtain the updated matrix ZLoop .
.
.
where: b=p-1
(vii) The ZLoop obtained from (12) – (17) is then considered as the current Zold in another cycle of expansion and subsequent kron-reduction to reflect the inclusion of the next dummy loop as described in steps (v) and (vi) above. The iterative process continues until all dummy loops are considered. The dummy loops connected across the voltage sources are avoided in this paper. The margin of error caused by this action is insignificant when dealing with aggregate sources.
The inverse matrix of ZLoop forms the loop admittance matrix whose diagonal elements are selected as self admittances needed for the frequency plot (admittance scan).
(viii) The admittance scan is the plot of self-admittances of all meshes against the harmonic orders. The peak frequencies in the curves constitute the series resonant modes of the network. They indicate the frequencies at which the amplification of mesh currents by resonance is possible. In the case study, the admittance scan was repeated for two different conditions namely: firstly by considering the effect of cable capacitance, and secondly by considering the effect of cable capacitance and skin effect.
(ix) The mesh analysis in harmonic frequency domain are also carried out using equation (18). The mesh current vector are calculated at the power frequency and repeated at each harmonic generated frequency, h (per unit)
.
The root-mean-square value of mesh currents, Total Harmonic Distortion (THD) and the corresponding amplification factor at each mesh, k, are computed using (19), (20) and (21) respectively
.
Current amplification or amplification factor at k-th mesh is
.
Current amplification or amplification factor at k-th mesh is
.
The exact sequence of the described algorithm is represented in Fig. 3. The process was applied to the sample network and implemented with a Matlab Script. The de-rating factors to be applied on the current rating of the network elements in order to withstand the impact of resonance is the same as the amplification factor at the corresponding meshes.
Fig.3. Algorithm for series resonance analysis of a power network
Model Verification
The efficacy of the proposed method was verified using the Matlab Simulink as simulation software. The Simulink model of the equivalent circuit used for the simulation is shown in Fig. 4 with the harmonic generating load represented as a current source in parallel with a resistive load. The harmonic Simulation was carried out for five seconds to capture only the steady state values of the fundamental and harmonic components of the branch current and bus voltages. The simulations were iterated for each harmonic order generated by that load as they appear in Table 2. The amplified current, THD and amplification factors were the computed using (19) and (21).
Fig.4. Simulink model diagram used in the simulation of the sample network.
Results and Discussions
The analysis of the sample network has revealed the desired tuning frequencies of the harmonic filter as well as the most suitable location of the filter in the network. The peaks of the curves in Fig. 5 and Fig.6 indicate the network resonant modes: representing the frequencies at which the mesh currents are subject to amplification. The results of the admittance scan on the sample network indicate the occurrence of resonant peaks at the various meshes M1 – M6. For instance the series resonant peaks for M1 occurred at h =13, 32 and 44 per unit with loop admittances 0.18, 0.54 and 0.19 respectively. The resonant peaks for M2 occurred at h =13 and 60 per unit while that of M3 is at h =13, 80 and 90 per unit. All these cannot amount to anything unless there are harmonic voltages generated at such frequencies. It is the peak frequencies which coincide with the dominant harmonic frequencies generated from the non-linear load that constitute the desired tuning frequencies of the harmonic filter to be deployed in the resonance mitigation. The curves in Fig. 6 portray the damping tendency of the skin effect in cables. These results affirm the position that only the cable capacitance contributes immensely to the shifting of resonant frequencies while the skin effect only reduces the magnitude of loop admittance but widens the frequency curve. Hence, in the evaluation of the resonance peaks, the contribution of skin effect can be neglected.
Comparing these results with the generated frequencies presented in Table 2 indicates that only two harmonics actually require some mitigation – these are h=11, and 13. They serve as the tuning frequencies of the harmonic filter. Hence, the deployment of a harmonic filter tuned to the frequencies 11p.u. (550Hz) and 13 p.u. (650Hz) is enough to mitigate any series resonance. The most appropriate location for this filter is between M1 and M2 which is also affirmed by the THD values in Table 3. The best choice is therefore M2. This decision is also affirmed by the magnitude of harmonic currents in Tables 3. Another alternative in the choice of the tuning frequencies of the harmonic filter is by selecting the frequencies of the harmonic mesh currents that are of significant magnitude. However, the application of the harmonic filter to achieve the attenuation of the dominant resonant frequencies is outside the scope of this study.
The purpose of this study is also to determine the derating factors which could be applied to the current rating of the cables in order to complement the effort of the harmonic filter in withstanding the impact of the residual harmonics. The rms value of the amplified current in the cable sections M1 – M6 were computed for this purpose as shown in Table 3. The rms value of the mesh currents and their respective amplification factors are shown in Table 3.
Fig.5. Admittance scan results considering the cable capacitance
Fig.6. Admittance scan results considering the cable capacitance and skin effect
It is clearly indicated that all the meshes susceptible to series resonance could be sighted judging from the value of the Total Harmonic Distortion in the mesh currents. Although the consideration of skin effect in the calculations could mean a reduction in the resonant currents, but the increased bandwidth of resonance curves implies the greater chance of current amplification occurring within the neighbourhood of the resonant peaks. This necessitates its consideration when evaluating the harmonic mesh currents and the associated parameters. This idea is affirmed by the increased values of mesh currents and total harmonic distortions in Table 3. The amplification factors presented is a guide on locating the sections of the network that require de-rating of equipment.
The results reveal that the transformers supplying the Foundry W/Shop and Electroplating unit and the distribution cables within their vicinity are seriously under threat and therefore require adequate correction in the desired amperage ratings. Computation of branch and mesh currents enables determination of de-rating factor for these cables, transformers and their insulators in order to withstand the effect of resonance. The amplification of cable currents are mostly higher in the vicinity of the harmonic generating source. The information displayed in Table 3 is also sufficient in affirming the efficacy the proposed technique. Comparing the cable currents and their corresponding THD values with the values obtained from Simulink simulation, it was observed that the two set of values are closely matched.
Table 3. Comparison between simulation results and that of the proposed method in respect of the amplification effect of series resonance on mesh currents, while considering cable capacitance and skin effect of power cables.
.
Conclusion
This paper has described the process of conducting admittance scan and mesh current analysis in harmonic domain as appropriate tools for the determination of indices for series resonance solution in distribution networks containing aggregate harmonic sources. It has also verified these tools using a typical case study by comparing the results obtained from the proposed method with those of the simulation in Simulink environment. The unique achievement in this study is the determination of series resonant frequencies of the network by a modified loop admittance scan, where dummy loops are created to treat independently the connection of shunt capacitors of power cables. The modified admittance scan captures all the dominant frequencies involved in series resonance with greater accuracy. This study will enable professional engineers involved in the design of the harmonic filter to determine the required tuning frequencies by selecting the resonant frequencies that coincide with any of the harmonic frequencies generated by the non-linear load, or the frequencies of the harmonic mesh currents that are of significant magnitude.
Notably, the study was restricted to radial networks. Another limitation is that the power supply network was reduced to its Thevenin equivalent with the internal impedance approximated at all harmonic frequencies. For small consumer networks the analysis can adequately produce the desired results to acceptable degree of accuracy. For large consumer premises the error margin may increase. Furthermore, the neglect of dummy loops created across voltage sources in mesh analysis is inconsequential in the case of aggregate sources under consideration. Further research shall explore ways of including such dummy loops when dealing with distributed harmonic sources.
REFERENCES
[1] K. Md Hasan, K. Rauma, A. Luna, J. Candela, and P. Rodriguez, “Harmonic Resonance Study for Wind Power Plant”, International Conference on Renewable Energies and Power Quality, ICREPQ (2012), Santiago de Compostela, Spain, 8th to 30th March 2012. [2] K. Nisak, I. Candela, K. Rauma, J. R. Hermoso and A. Luna, “An Overview of Harmonic Analysis and Resonances of a Large Wind Power Plant”, Annual Conference of the IEEE IndustrialNHK Electronics Society,IECON (2011), 7–10 November 2011. [3] C. Yang, K. Liu and D. Wang, “Harmonic resonance circuit’s modeling and simulation”, Power and Energy Engineering Conference, APPEEC 2009, ISBN: 978-1-4244-2486-3, Wuhan, China, 27–31 March (2009), pp. 1–5. [4] Z. Huang, Y. Cui and W. Xu, “Application of Modal Sensitivity for Power System Harmonic Resonance Analysis”, IEEE Trans. on Power Systems, Vol: 22, No.1, Feb. (2007), pp. 222 – 231. [5] C. Yang, K. Liu and Q. Zhang, “An Improved Modal Analysis Method for Harmonic Resonance Analysis”, IEEE International Conference on Industrial Technology,ICIT (2008), ISBN: 978-1- 4244-1705-6, Chengdu, China, pp.1–5. [6] H. ZHOU, Y. WU, S. LOU and X. XIONG, “Power System Series Harmonic Resonance Assessment based on Improved Modal Analysis”, Journal Of Electrical & Electronics Engineering, Istanbul University, vol.7, No2, (2007), pp. 423 – 430. [7] F. O. Kalunta and F. N. Okafor, “Power System Series Resonance Studies by Modified Admittance Scan”, Proceedings of the Joint IEEE International Symposium on Electromagnetic Compatibility and EMC Europe, Dresden Germany, August 16 – 22, 2015. [8] F. O. Kalunta and F. N. Okafor, “ Harmonic Analysis of Power Networks Supplying Nonlinear Loads”, International Conference on Innovations in Engineering and Technology, IET (2011), Faculty of Engineering, University of Lagos, Nigeria, 8th – 10th August 2011, pp. 568 – 577.
Authors: Dr. Felix Okwudiri Kalunta, Project Development and Design Department, Federal Institute of Industrial Research, Oshodi, Lagos, Nigeria, E-mail:felka3@yahoo.co.uk; Dr. Tolulope Akinbulire, Electrical/Electronic Engineering Department, University of Lagos, Nigeria. Prof. Frank Nwoye Okafor;Electrical/Electronic Engineering Department, University of Lagos, Nigeria; E-mail:cfrankok@yahoo.com
Source & Publisher Item Identifier: PRZEGLĄD ELEKTROTECHNICZNY, ISSN 0033-2097, R. 98 NR 5/2022. doi:10.15199/48.2022.05.17
Published by Civian Kiki Massa and Jay Taneja STIMA Lab, University of Massachusetts, Amherst, USA July 2023
Summary: Access to electricity continues to expand worldwide, but even where people are connected to the power grid, they often face challenges including frequent power outages and, less visibly, intermittent periods where electricity is available but only with poor power quality.
Poor power quality — characterized by fluctuations and/or persistently low or high voltages — has far-reaching consequences and should receive much more attention. Like lack of access, poor power quality holds back economic growth. But it is much harder to track and its prevalence is unknown because systems to measure it are not in place. We installed sensors across Nigeria to assess power quality and its impacts on people and economic activity.
Why power quality matters:
● Current investment is short-sighted: The primary metric of global energy poverty targets like Sustainable Development Goal 7 (SDG7) is the electricity access rate. This has led to increased investment and research focused on expanding the number of on-grid and off-grid connections (see the U.S. Power Africa program as an example). However, billions of electricity customers, many of them newly connected, face challenges in effectively using their connections due to frequent and unpredictable power outages and intermittent and sustained periods of unsafe or unusable electricity, ultimately stifling consumption and economic growth.
● The extent of the problem is underestimated: While power outages are well understood to be a significant problem for electricity users in developing regions, poor power quality may be even more widespread. The scale and depth of poor power quality are often underestimated by utilities, policymakers, researchers, and key stakeholders in the electricity sector, which hinders effective measures to address it.
● Unseen quality issues can seriously undermine development efforts: Poor power quality results in a range of problems from demand suppression and appliance damage to decreased productivity and safety hazards or health risks. These issues are widespread in developing economies such as those across sub-Saharan Africa, where the aging grid infrastructure is capacity constrained. These power quality issues impact multiple industries, stifling economic and social development.
● There is no coherent effort to address this issue: Utilities and policymakers do not have the appropriate tools or policies to identify and improve power quality issues. An essential first step is to ensure consistent and universal power quality measurements to assess the scale and extent of the problem. Even with better sensing, the extent towhich poor power quality suppresses demand (for example, if it discourages people from investing in electric appliances and consuming electricity) remains unseen, and may be even more challenging to effectively measure, calling for surveys and historical case studies. Persistently poor quality prevents widespread use of electricity for productive purposes and serves as a drag on economic growth and equitable development.
Case study:
Nigeria Nigeria is the largest economy in Africa and on track to becoming the third most populated country in the world by 2047. Yet, as in many other developing economies, inadequate power supply is a significant barrier to economic progress. e-GUIDE carried out an energy audit in 74 commercial markets across the six regions of Nigeria where we installed nline’s PowerWatch sensors to monitor power quality and grid reliability. We found:
● Power quality and reliability: Across the 74 markets, only 1 out of every 4 voltage readings were in an “acceptable” range (within 10% of the standard grid voltage). While outages were present in 1 out of every 3 samples, extremely low voltages were more prevalent (roughly 2 out of 5 samples — see Figure 1).
● Impact of poor quality on appliances: Appliances in these markets operate on extremely low voltages most of the time. This leads to damage, reduced lifespans, and unreliable performance – and forces businesses to either deal with the subpar operation or buy replacements, reducing profits in either case.
● Demand suppression: Businesses are not operating to their full potential due to suppressed demand. For example, a saloon owner had to return a second A/C unit because the voltage worsened when multiple appliances were in use. Another business owner highlighted that customers on a shared line often can’t run appliances like heaters, refrigerators, or fans without knocking out the power. These restrictions hamper growth and are difficult to account for in grid planning processes.
● Effect on Behavior: As a result of poor quality and unreliable power supply, businesses resort to incurring extra costs by relying on other sources of energy. For example, 23% of grid-connected businesses also had personal/shared generators, which not only add additional costs but also present enormous environmental concerns. 1 In addition, businesses are compelled to invest in protective systems like surge guards and voltage stabilizers.
Figure 1: Percent of measured voltage by hour of day
Bottom Line: Power Quality Challenges Have Broad Effects on Developing Regions
These findings from Nigeria are consistent with measurements taken in informal settlements of Uganda, rural communities in Kenya, and cities across India, among others. As the world strives to meet SDG7 and achieve universal access to affordable, reliable, sustainable, and modern energy, it is crucial that we take a longer-term view and think beyond electricity access. Utilities need investments to ensure more widespread and frequent measurements, policymakers and regulators need to ask questions about electricity customer experience, and governments, donors, and investors need to recognize that poor power quality is a priority issue that endangers the societal impact and financial value of their investments in electricity infrastructure. In short: poor power quality is a crucial impediment to sustainable economic development — and we need to pay it more attention.
Endnotes
1. “Sustainability implications of electricity outages in sub-Saharan Africa.” Farquharson, D., Jaramillo, P., and Samaras, C. Nature Sustainability. 2018. https://www.nature.com/articles/s41893-018-0151-8 2. Fobi et al. (2018) A longitudinal study of electricity consumption growth in Kenya, Energy Policy: https://www.sciencedirect.com/science/article/abs/pii/S0301421518305949 3. nLine reports and publications on power quality and reliability measurements https://nline.io/publications.html 4. e-GUIDE is leading energy audit and power quality monitoring in Nigeria with support from REA and the Energizing Economies Initiative (EEI) 5. Power quality in Nigeria: https://www.sinalda.com/world-voltages/africa/voltage-nigeria/ 6. An academic consortium led by the University of California, Berkeley, includes Arizona State University, University of Massachusetts Amherst, University College London, and Makerere University, with NGO partners ACTogether Uganda 7. World population review: Nigeria population 2023 8. The fraction of time spent in outage vs voltage states are preliminary results. The brief, rotating deployments used in this project pose particular data analysis challenges due to sampling rate jitter and reporting gaps which can slightly impact the calculated proportion of time in each state but are unlikely to alter the overall scale and trends of power quality issues shared here. In follow-up work, we will nevertheless develop techniques to mitigate these impacts to further refine our results.
Published by 1. M.S. ALI 1,2, 2. Mahidur R SARKER 3, 3. Ahmad ASRUL IBRAHIM 1, 4. Ramizi MOHAMED1, 1Faculty of Engineering and Built Environment, Universiti Kebangsaan Malaysia, Bangi 43600, Malaysia; 2Electrical Engineering Department, German-Malaysian Institute , Jalan Ilmiah, Taman Universiti,43000, Kajang, Selangor, Malaysia; 3Institute of IR 4.0, Universiti Kebangsaan Malaysia, 43600 UKM Bangi, Selangor, Malaysia. ORCID. 1. 0000-0001-7142-7755, 2. 0000-0002-5363-6219, 3. 0000-0003-4997-3578, 4. 0000-0003-1534-6760
Abstract. Flywheel motor generator (FMG) system or normally called a flywheel energy storage system (FESS) becomes the main consideration in power stability of micro-grid, transportation, portable power supply, and renewable energy power station such a solar or wind. Its contribution in stabilizing power production and reducing power consumption is undeniable. High power consumption in the small-scale industry especially sprays dryer factory become a major issue due to high-cost production. Load such a heating element needs more power consumption to operate and achieve the desired temperature. High-efficiency FMG can be an alternative power backup to reduce power consumption by serving a separate supply to the load (heater). This paper is focused on modeling and simulation of the FMG system. The simulation result shows that the system proposed can provide very high efficiency with stable output power and also can reduce the cost of production due to power consumption reduction.
Streszczenie. System silnika generatora z kołem zamachowym (FMG) lub zwykle nazywany systemem magazynowania energii koła zamachowego (FESS) staje się głównym czynnikiem stabilności energetycznej mikrosieci, transportu, przenośnego źródła zasilania i elektrowni energii odnawialnej, takiej jak energia słoneczna lub wiatrowa. Jego wkład w stabilizację produkcji energii i zmniejszenie zużycia energii jest niezaprzeczalny. Wysokie zużycie energii w przemyśle na małą skalę, zwłaszcza w fabryce suszarek rozpyłowych, staje się poważnym problemem ze względu na wysokie koszty produkcji. Obciążenie takiego elementu grzejnego wymaga większego zużycia energii do działania i osiągnięcia pożądanej temperatury. Wysokowydajny FMG może być alternatywnym zasilaniem awaryjnym w celu zmniejszenia zużycia energii poprzez dostarczanie oddzielnego zasilania do obciążenia (grzałki). Artykuł koncentruje się na modelowaniu i symulacji systemu FMG. Wyniki symulacji pokazują, że proponowany system może zapewnić bardzo wysoką sprawność przy stabilnej mocy wyjściowej, a także może obniżyć koszty produkcji dzięki zmniejszeniu zużycia energii. (Wysokowydajny model generatora silnika z kołem zamachowym ze sterowaniem przemiennikiem częstotliwości)
Keywords: Simulation, modelling, flywheel, motor generator, power consumption, voltage stability, frequency stability. Słowa kluczowe: silnik z kołem zamachowym,.zasobnik energii
Introduction
The increase in the use of electric power has led to high monthly electricity bill rates which is a major issue for domestic and small-scale industry [1][2]. Typically, this occurs when a heater or air conditioning load is used for a long period of time. Especially in the food industry that converted liquid to powder which uses high temperature [3][4]. The high cost of electricity causes the profit to be very low. Extremely hot weather conditions in public buildings such as mosques or others invite high electricity consumption. This is due to the use of air conditioners in proportion to the attendance of many guests. This has caused public houses to have difficulty paying their monthly electricity bills. Therefore, this problem needs to be resolved immediately to reduce the rate of electricity consumption at the rate that consumers can afford.
This study aims to produce an electricity generation system that can reduce electricity bills. This means that with the use of a separate electricity generating system, the electricity consumption can be reduced [5]. Basically, the motor will drive the generator, and the generator will generate electricity. The addition of flywheels to the generating system will cause the mechanical energy generated from the motor and generator rounds to be stored and converted to electrical power [6][7]. The inertia effect of the motor flywheel and generator will be delayed even when the power supply to the motor is disconnected. Here, electricity can be saved apart from the use of low-speed generators that generate electricity with a low- speed motor.
In [8], the author obtained that more electrical output can be produced by using a flywheel. This system of FMG can give extra electrical power without the use of any extra equipment and offer environmentally friendly and nonhazardous. The system FMG can be used in various applications especially household, industrial and it increases the efficiency of traditional electrical systems [9]. In [10], the author studied flywheel energy storage system powered by wind turbine and diesel generator in isolated micro-grid to improve the power quality of the system. The topology of the hybrid system consists of a simulated winddiesel power system and flywheel energy storage system [11][12]. In this study, an asynchronous machine is used to drive the flywheel in order to attain robustness and offered low cost. The bidirectional power converter is used to control the speed of the electrical machine when acting as a motor, then controlled the output voltage when in generator mode. The bidirectional power converter is also known as back to back converter [13]. DC link in the circuit is purposely to stabilize the voltage. This bidirectional power converter is controlled by pulse width modulation (PWM) in the voltage source inverter (VSI) [14][15]. The flywheel coupling is direct to the electrical machine store mechanical energy when an electrical machine in motor mode, then convert to electrical energy when electrical energy in generator mode [16]. As result, by actuation of the flywheel in the system make improvement in power quality.
In [17], the author stated that the flywheel system stores energy at 5kWh within a speed range of 10,000-20,000 rpm and an accelerating torque of 6.7Nm. The passive magnetic bearing has been used to reduce the run-down losses of the system. By enclosing the flywheel in a vacuum chamber can be mitigated the rotor drag losses. This study analysed that the fluctuation of the DC-bus voltage due to load instabilities is limited to 3% and recovered within 40-45 ms. In [18], the author addressed that an asymmetrical six-phase induction motor that has been used to drive a flywheel can improve system reliability while supporting critical loads. Under the disconnection phase, the machine can function properly proved by simulation and experiment results. The rating of the switching device has been reduced compared to applying a normal three-phase motor. This system is suitable for medium voltage applications.
In [19], the author studied losses in flywheel energy storage systems. The system consists of the flywheel, an electrical machine, and a bidirectional converter/controller. The losses in this system were recognised as mechanical losses (drag, bearing friction), electrical losses (hysteresis, eddy current, copper) and power converter losses (switching, conduction) which is the magnitude of each loss depends on the operating conditions such as motor speed, dc bus voltage, switching frequency and load current. This study proved that the bearing friction loss in the flywheel and hysteresis loss in the machine is proportional to speed. Meanwhile, the drag loss in the flywheel and eddy current loss in the machine are proportional to the square of the speed. All these losses can be reduced by improving the efficiency of the system by the usage of a two-pole machine apply vacuum enclosure for rotating part and usage of ZVT/ZCT technique to reduce switching losses in power converter.
In [20], the author designed the flywheel energy storage system for space application. There are two regions in the orbital path of the satellite which are the dark and bright regions. The bright region can use a solar panel to provide energy but the dark region needs a flywheel energy storage system to maintain the power. In this study, brushless DC (BLDC) was used to drive flywheel due to high efficiency, high reliability, low weight, high power density, and high speed. However, there is a dramatic increased of current due to mechanical resonance will cause damage to the power system. Therefore, PI control was used to control the speed of BLDC with an effective current reference method to prevent the current spike occurred during mechanical resonance which BLDC runs at 20krpm in the vacuum condition. This experiment proved that the PI control can protect the power system from damage due to a short time current spike.
In [21], the author indicated that the combination of high temperature superconducting magnetic suspension with the integrated design of flywheel energy storage system can provide high efficiency and no additional losses. High temperature superconducting magnetic suspension is consists of a YBaCuO cylinder with axial anisotropy (external diameter – 31 mm, internal diameter – 25 mm, height 30 mm) as stator and disk-shaped nonmagnetic hull with three fixed rings FeNdB permanent magnet with axial magnetization as a rotor. This proposed design can be used on wind power stations, in the power supply systems for industry and transportation. Integration development of this system provides a stable levitation of the flywheel, allows to non-contact regulate the force of magnetic thrust bearing in a vacuum chamber, to perform an initial centering of the flywheel, and to put into operation a safety bearing in case of accidents. The main objective of this design is to create no additional losses due to magnetic hysteresis, no reactive moments, small winding inductance, and high specific power indicators due to the large value of the magnetic induction in the gap. The result of this experiment shows that there are no additional energy losses in storage mode and an electromagnetic time constant is low.
System configuration and mathematical model
The general system configuration of the FMG System studied in this paper is as shown in Fig. 1. The flywheel is coupling directly with an asynchronous motor and synchronous generator. This coupling makes the flywheel, motor, and generator run synchronously at the same speed. A frequency inverter controls the speed of the flywheel, motor, and generator. A frequency inverter is to maintain the speed of the flywheel, motor and generator at the optimum value needed to maintain the generator voltage. Data acquisition used to get data from the generator and motor. An asynchronous motor is a Squirrel Cage motor type which is three phases induction motor that can provide high speed and torque. The synchronous generator is a high-efficiency generator that can give constant voltage with different torque. Here, the flywheel integrated with the motor and generator to support the electrical energy conversion. The flywheel still continues to rotate even the motor already swift off.
Fig.1. System configuration for flywheel motor generator with speed controlled.
A simplified topology of the FMG connected to an electrical supply shown in Fig. 2. This studied topology is lab scale specification. The three phases supply 450V/50Hz is a power supply connected to breaker and transformer 240V/50Hz. The transformer secondary is in star connection. The frequency inverter connected to the life and neutral of a transformer. The frequency inverter 0.3kW used to control the speed of squirrel cage motor o.5hp/400V/50Hz with the nominal speed at 2800rpm. The flywheel parameter is setting together with the motor parameter which is 60cm for radius and 2kg/8kg for mass at 0.178kgm2/0.356kgm2. The frequency inverter can provide ramp mode and control the speed of a motor by changing frequency. This frequency inverter circuit consists of a full-wave rectifier and three phases full-bridge inverter. So, the incoming the frequency inverter is a single phase and the output is three-phase.
Fig.2. Simulink model asynchronous motor, synchronous generator and flywheel synchronization controlled by Frequency Inverter.
Table 1 shows the simulation parameter of an asynchronous induction three-phase motor and synchronous generator. An asynchronous motor used for this study can operate at 0.373kW and nominal speed at 2800rpm. An asynchronous motor selected for this experiment because cheaper compare with a permanent magnet motor which is very expensive. Therefore, the frequency inverter used to serve this motor must be higher than 300W. Whereby the synchronous generator used can generate a high voltage at low rpm with nominal power at 299kW and 0.8 power factor. Two different weights of flywheel user in this study are 2kg and 8kg with the same diameter. The inertia of the flywheel calculated by using the formula:
.
where I is Inertia, ½ is constant for solid cylinder flywheel, m is the mass of flywheel, r is the radius of flywheel.
Table 1. Parameter of asynchronous motor, synchronous generator and flywheel
.
The testing circuit diagram as shown in Fig 3 is used to analysis the system. From this testing circuit, the effect of the flywheel with different sizes and weights can be analyzed [22]. From this testing circuit also, the synchronization of the motor and generator can be measure. All the data measurements of the motor and generator such as stator current, torque, speed, input, and output voltage are being measured as shown in this figure. All measurements consist of a multi-meter to display the root mean square (RMS) value and the scope to plot the graph. The voltage supply also can be set according to the motor specification by changing the parameter of the supply relay three-phase.
Fig.3. Testing circuit diagram.
The detailed Simulink model for a synchronous generator as shown in Fig 4 used to generate voltage. This model is referring to mathematical model formula:
.
where R is a diagonal matrix ( nState, nState) of winding resistances in d q axis, L is the matrix ( nState, nState) of winding self, and mutual inductances in d q axis.
•W is matrix (nState, nState) depending on rotor speed wr, all zero except W (1, 2) = wr,W (2, 1) = –wr •v is voltage vector = [ vq vd vfd vkd vkq (vkq2) ], •phi is flux linkage vector = [ phiq phid phifd phikd phikq1 (phikq2) ], (state variable) •i is current vector = [ iq id ifd ikd ikq1 (ikq2) ], if RotorType = Salient-Pole, nState = 5 if RotorType = Round, nState = 6
Fig.4. Detail Simulink model for synchronous generator.
Fig.5. Detail Simulink model for asynchronous motor (Squirrel Cage).
The detailed Simulink model for Asynchronous Motor as shown in Fig 5 used to drive the generator and flywheel. This model is referring to the mathematical model formula:
.
where: R is diagonal matrix ( nState, nState) of winding resistances in d q axis
•L is matrix ( nState, nState ) of winding self and mutual inductances in d q axis •W is matrix (nState, nState) depending on rotor speed wr, all zero except W (1, 2) = wr,W (2, 1) = -wr •v is voltage vector = [ vq vd vfd vkd vkq1 (vkq2) ], •phi is flux linkage vector = [ phiq phid phifd phikd phikq1 (phikq2) ], (state variable) •i is current vector = [ iq id ifd ikd ikq1 (ikq2) ], if RotorType = Salient-Pole, nState = 5 if RotorType = Round, nState = 6
Results and discussion
The graphs in Fig 6(a) and Fig 6(b) are showing the relationship between the weights of the flywheel with time. The green and red lines in the graph show that an asynchronous motor and synchronous generator run at synchronous speed. This is because motor, generator, and flywheel are coupling directly without any pulley or belting. The frequency converter controlled the speed of motor.
Fig 6(a) shows the graph with 60cm diameter and 2kg flywheel. After 3 seconds, the speed of the motor and generator is at a stable state. After 8 seconds, the power supply of the motor cut off to OFF mode. At OFF mode, the generator was running with support by the flywheel. With 60cm diameter and 2kg flywheel at 0.178kgm2 inertia will take about 8 seconds to stop the generator. By increasing the weight of the flywheel, the times took for the generator to stop running also increase. With 60cm diameter and 8kg flywheel at inertia 0.356 kgm2, the speed of the motor will stable at 5s and take about 15 seconds to stop the generator after cutting off the power supply.
Fig.6(a). Graph speed vs time with 2kg flywheel.
Fig 6(b) shows the graph for flywheel with 60cm diameter and 8kg. The diameter of the flywheel also affects the time of generator stop delay. Since the diameter of the flywheel affects the torque. Increasing in radius will increase the torque. Low mass, higher diameter flywheel is preferred to higher mass low diameter flywheel. This gives better efficiency of the system for given energy storage.
Fig.6(b). Graph speed vs time with 8kg flywheel.
The waveform of output voltage generated by a synchronous generator in Fig 7 shows that the generator still running after the motor OFF mode at time 2s. If the motor and generator were coupling with a 2kg flywheel, the voltage of the generator will decrease slowly in 5 seconds. Initially, the generator takes about 1 second to become stable. When the motor OFF mode at time 2s, the flywheel will make the generator continuously run from time 2s to 7s.
Fig. 7. Output voltage waveform of synchronous generator with 2kg flywheel.
The waveform in Fig 8(a) and Fig 8(b) shows the pattern of generator voltage waveform when the motor is under ON/OFF controlled. The voltage of the generator is in ranges from 1000V to 230V. This range of voltage can fulfill the required voltage of the load. With ON/OFF control in Fig 8(a) with inertia 0.178kgm2, we can see that the output voltage of this synchronous generator still under the voltage range at 240V after two seconds of motor OFF mode. ON/OFF control was applied to the system by active the breaker every two seconds. During OFF mode, the generator was driven by the flywheel. The duration of the generator voltage can sustain was depend on the inertia of the flywheel. Meanwhile, with inertia 0.356 kgm2 can prolong the duration of the generator to stop and the voltage generator at 240V after three seconds motor OFF mode. Fig 8(b) shows the waveform of generator voltage with the inertia of the flywheel at 0.356 kgm2.
Fig.8(a). Waveform output generator with ON/OFF control for inertia 0.178kgm2.
Fig.8(b). Waveform output generator with ON/OFF control for inertia 0.356 kgm.
Table 2 shows that the efficiency of the system is very high above 100%. This is because the output power of the system is greater than the input power. Vin is the line voltage of the three-phase supply regulated from 100V to 400V. From this simulation, the highest efficiency of the system is at line voltage 200V achieved at 261% of power efficiency. When increasing the input voltage, the efficiency of the system decreasing from 261% to 108%. This is because the nominal voltage of the generator and motor is the only 400V. If the line voltage is 300V, then the supply voltage of the motor is bigger than 400V. The system becomes unstable when the supply voltage greater than the nominal voltage. The efficiency of the system calculated by using formula:
.
Table 2. Efficiency of the system
.
Fig 9 shows that the current of the output generator was stable after half seconds of operation. The output current is about 20A. There is no current spike that occurs at any time of system operation. This is because the asynchronous motor derived the synchronous generator without any jerk or unstable speed. Not like permanent magnet motor, always has jerked during operation will cause a current spike.
Fig.9. Waveform output current of generator.
Fig 10 shows that the frequency output voltage of the generator is at a stable state after three seconds of system operation. The frequency is maintained at almost 50Hz. This graph proves that the synchronous generator can provide constant frequency at any load of the system.
Fig.10. Graph frequency output voltage of generator vs time.
Conclusions
The effects of a flywheel on the motor-generator system were investigated. The flywheel in this system makes a reduction in power consumption with an act as energy storage to convert mechanical energy to electrical energy after the power supply off. With ON/OFF control by the frequency inverter, the power consumption will reduce. The load such a heater still can function to maintain the temperature. Besides that, a synchronous generator also provides high efficiency to the system. With 1600rpm, the efficiency of the system achieves 200% with supply voltage 200V. This is possible because this modelling used a low-speed high voltage synchronous generator then give more output power compare with input power. This calculation of power can be referred to the formula 6. Therefore, from this investigation can conclude that the flywheel motor generator system proposed in this study offer higher efficiency which can solve the problem in power consumption issue. In the future, this study will continue with additional element to improve the system with a hybrid flywheel.
Acknowledgment: Universiti Kebangsaan Malaysia for funding the research under Grant Code GGPM-2019-031.
REFERENCES
1. Islam, S.; Ponnambalam, S.G.; Lam, H.L. Energy management strategy for industries integrating small scale waste-to-energy and energy storage system under variable electricity pricing. J. Clean. Prod. 127(2016), 352–362. 2. Sarker, M.R., Mohamed, A., Mohamed, R. Performance evaluation modeling a Microelectromechanical system based Finite Element piezoelectric shear actuated beam. Prz. Elektrotechniczny 2015, 91. 3. Nadaleti, W.C. Utilization of residues from rice parboiling industries in southern Brazil for biogas and hydrogen-syngas generation: Heat, electricity and energy planning. Renew. Energy. 131(2019), 55–72. 4. Sarker, M.R., Mohamed, R. A Batteryless low input voltage micro-scale thermoelectric based energy harvesting interface circuit with 100mV start-up voltage. Prz. Elektrotechniczny 2014, 90. 5. Gilbert, B., Graff Zivin, J. Dynamic salience with intermittent billing: Evidence from smart electricity meters. J. Econ. Behav. Organ. 107(2014), 176–190. 6. Wu, Y.; Bingham, C.M.; Peel, D.J.; Howe, D. Active magnetic bearings for a flywheel peak power buffer for electric vehicles. Int. J. Appl. Electromagn. Mech. 2001, 15, 201–206. 7. Mohamed, R., Sarker, M.R., Mohamed, A. An optimization of rectangular shape piezoelectric energy harvesting cantilever beam for micro devices. Int. J. Appl. Electromagn. Mech. 50(2016), 537–548. 8. Sebastián, R., Peña-Alzola, R. Control and simulation of a flywheel energy storage for a wind diesel power system. Int. J. Electr. Power Energy Syst. 64(2015), 1049–1056. 9. Brühl, J., Smith, G., Visser, M. Simple is good: Redesigning utility bills to reduce complexity and increase understanding. Util. Policy. 60(2019), 100934. 10. Thakre, S.B., Zode, S.H., Singh, A.S., Ingole, S.R. Self Generator Free Energy Flywheel. Int. Res. J. Eng. Technol. 2018, 1062–1065. 11. Zhang, C., Tseng, K.J., Nguyen, T.D., Zhao, G. Stiffness analysis and levitation force control of active magnetic bearing for a partially-self-bearing flywheel system. Int. J. Appl. Electromagn. Mech. 36(2011), 229–242. 12. Hedlund, M., Abrahamsson, J., Pérez-Loya, J.J., Lundin, J., Bernhoff, H. Eddy currents in a passive magnetic axial thrust bearing for a flywheel energy storage system. Int. J. Appl. Electromagn. Mech. 54(2017), 389–404. 13. Nagaya, K., Kanno, K., Hayashi, N. Control of flywheel system with high-Tc superconducting bearings. Int. J. Appl. Electromagn. Mech. 10(1999), 237–247. 14. Jin, Z., Sun, X., Yang, Z., Wang, S., Chen, L., Li, K. A novel four degree-of-freedoms bearingless permanent magnet machine using modified cross feedback control scheme for flywheel energy storage systems. Int. J. Appl. Electromagn. Mech. 60(2019), 379–392. 15. Sarker, M.R., Mohamed, A., Mohamed, R. Implementation of non-controlled rectifier circuit based on vibration utilizing piezoelectric bending generator. Int. J. Appl. Electromagn. Mech. 2017, 54. 16. Soomro, A., Amiryar, M.E., Pullen, K.R., Nankoo, D. Comparison of Performance and Controlling Schemes of Synchronous and Induction Machines Used in Flywheel Energy Storage Systems. Energy Procedia. 151(2018), 100–110. 17. Amiryar, M., Pullen, K., Nankoo, D. Development of a HighFidelity Model for an Electrically Driven Energy Storage Flywheel Suitable for Small Scale Residential Applications. Appl. Sci. 8(2018), 453. 18. Daoud, M.I., Abdel-Khalik, A.S., Massoud, A., Ahmed, S. An asymmetrical six phase induction machine for flywheel energy storage drive systems. In Proceedings of the Proceedings – 2014 International Conference on Electrical Machines, ICEM 2014; Institute of Electrical and Electronics Engineers Inc., 2014; 692–698. 19. Gurumurthy, S.R., Sharma, A., Sarkar, S., Agarwal, V. Apportioning and mitigation of losses in a Flywheel Energy Storage system. In Proceedings of the 2013 4th IEEE International Symposium on Power Electronics for Distributed Generation Systems, PEDG 2013 – Conference Proceedings; IEEE Computer Society, 2013. 20. Çelikel, R., Özdemir, M., Aydoǧmuş, Ö. Implementation of a flywheel energy storage system for space applications. Turkish J. Electr. Eng. Comput. Sci. 25(2017), 1197–1210. 21. Dergachev, P.; Kosterin, A.; Kurbatova, E.; Kurbatov, P. Flywheel energy storage system with magnetic hts suspension and embedded in the flywheel motor-generator. In Proceedings of the Proceedings – 2016 IEEE International Power Electronics and Motion Control Conference, PEMC 2016; Institute of Electrical and Electronics Engineers Inc., 2016; 574–579. 22. Caruso, J.F.; Coday, M.A.; Davidson, M.E.; Riner, R.D.; Borgsmiller, J.A.; Olson, N.M.; Taylor, S.T.; McLagan, J.R. The effect of flywheel-based resistive exercise workouts on testosterone/cortisol ratios. Isokinet. Exerc. Sci. 20(2012), 51–60.
Authors: M.S. ALI is a PhD student at the Department of Electrical, Electronic and Systems Engineering, Universiti Kebangsaan Malaysia (UKM), E-mail: mohdshamsul@gmi.edu.my Dr. Mahidur R. Sarker is currently working as Research Fellow to the Institute of IR 4.0, Universiti Kebangsaan Malaysia (UKM). Email:mahidursarker@ukm.edu.my. Dr. Ahmad Asrul Ibrahim is currently working as Senior Lecturer of Department of Electrical, Electronic and Systems Engineering, Universiti Kebangsaan Malaysia (UKM), E-mail: ahmadasrul@ukm.edu.my. Dr. Ramizi Mohamed is an associate professor of Department of Electrical, Electronic and Systems Engineering, Universiti Kebangsaan Malaysia (UKM), E-mail: ramizi@ukm.my.
Source & Publisher Item Identifier: PRZEGLĄD ELEKTROTECHNICZNY, ISSN 0033-2097, R. 97 NR 11/2021. doi:10.15199/48.2021.11.34