Published by Bashir Mahdi EBRAHIMI1, Jawad FAIZ1, Mohammad ETEMADREZAIE2, Mojtaba BABAIE3, Center of Excellence on Applied Electromagnetic Systems, School of Electrical and Computer Engineering, University of Tehran, Tehran, Iran(1), Department of electrical and computer engineering, Delft, Zuid-holland, Netherlands(2), Faculty of Engineering, Science and Research Campus, Islamic Azad University, Tehran, Iran(3)
Abstract. Impacts of load variation have not been so far investigated on the eccentricity fault diagnosis in synchronous motors. In this paper, a synchronous motor under static and dynamic eccentricities with different load levels is modeled using winding function method (WFM) and finite element method (FEM). Self and mutual inductances of the stator windings, stator currents and torque are calculated and analyzed. Spectrum of the stator currents is utilized for eccentricity fault detection, its type recognition and its degree determination. Variation of eccentricity degrees and load levels on the selected indices is scrutinized separately and simultaneously. The accuracy of the obtained simulation results is verified by FEM and experimental results.
Streszczenie. Zbadano wpływ obciążenia na błąd diagnozowania ekscentryczności w silniku synchronicznym. Modelowano silnik używając metody WFM (Winding function method) i metodę elementu skończonego. Analizowano indukcyjności własna i wzajemną stojana oraz moment. Analizę widmową prądu stojana użyto do oceny ekscentryczności. Oceniono dokładność diagnozowania. (Błąd oceny ekscentryczności w silniku synchronicznym o różnym obciążeniu)
Keywords: synchronous motor, WFM, FEM, fault diagnosis.
Słowa kluczowe: silnik synchroniczny, ekscentryczność.
Introduction
Synchronous machines are essential and valuable parts of power systems. These machines are generally well constructed and robust. However, they are subjected to a wide variety of abnormal operations due to stress involved in electromechanical energy conversion process. Operation of synchronous machines under fault conditions disturbs their performances and declares their life spans. Also, persistent faults damages these machines and consequences outage time for repairing is costly. Thus, fault detection and condition monitoring of the synchronous machines allow more flexibility in operation by knowing the performance and extend machine life by adjusting the operation to avoid known operating regimes or ranges and cost effectiveness. Consequence of many electrical and mechanical faults occurring during the operation of electrical machines is the eccentricity between the rotor and stator [1]. Eccentricity is categorized into three general groups: static eccentricity (SE), dynamic eccentricity (DE) and mixed eccentricity (ME).
In [2], two air gap search coils method applied to diagnose the static and dynamic eccentricity faults in the synchronous generators. It has been shown that the odd multiple harmonics of the fundamental frequency present at the EMF of search coils in the presence of the SE fault. It is noticeable that the stator currents and the shaft signals of the synchronous generators are two essential parameters that so far have been used to analyze synchronous machines under eccentricity fault. Unbalanced flux-linkages on the shaft caused by the asymmetrical condition can generate shaft signals. Variations of magnetic properties, tolerances in physical dimensions and any asymmetrical induced currents in the winding or stray paths may cause unbalanced flow of fluxes around the shaft [3, 4]. Also, sectional frames and segmental punching are the major cause of asymmetries of synchronous machine [5]. The rotor eccentricity is one of the prominent causes of magnetic asymmetries and shaft voltage. It has been shown that the shaft signals reduce in tilted rotor condition due to the opposite shaft flux- linkage at both ends. Also, the amplitude of the shaft signal is proportional with the eccentricities. Shaft signals of large turbo generator have been used to detect the faults [6, 7]. The shaft signals and other related methods have been frequently used for the eccentricities diagnosis of asynchronous machine [8, 9].
The measured stator currents are utilized for signature analysis in condition monitoring [10]. So far static and mixed eccentricity faults in synchronous machines have not been diagnosed using the analysis of the stator current signature. However, analysis and diagnosis of dynamic eccentricity faults using stator current signature analysis has been reported in [10, 11]. The amplitude of the 17th and 19th harmonic components as an index was utilized for eccentricity fault recognition in synchronous generators. Stator and rotor windings distribution and air-gap permeance have been taken into account in [12] while this was not considered in [10, 11]. In [13], effects of different degrees of static eccentricity (SE) and dynamic eccentricity (DE) on the synchronous generator inductances have been investigated. However, influence of load variation on the fault detection procedure has not been investigated in [13].
Eccentricity fault diagnosis in synchronous machines is subject to consider faulty generators under different conditions. These conditions are variation of load levels, and variation of static and dynamic eccentricities degrees. Impacts of these states on the nominated indices should be analyzed to evaluate indices efficiency for incisive fault detection. According to [1]-[13], albeit eccentricity fault identification has been illustrated, the eccentricity severity has not been determined in faulty synchronous machines. Furthermore, effects of load variation on the nominated indices (17th and 19th harmonic components) have not been studied.
In this paper, a synchronous motor under different degrees of SE and DE is modeled by winding function method (WFM) and finite element method (FEM). Stator currents are calculated using these approaches for processing and feature extracting. Then, spectrum of the simulated currents is evaluated to estimate the degree of eccentricity. After that, competency of the aforementioned indices is evaluated in different load levels. Finally, simulated results are validated by experimental results.
Modeling of Synchronous Motors using WFM
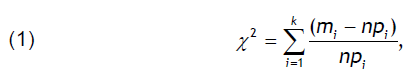
Winding function theory facilitates the performance analysis of electrical machines under different internal faults such as eccentricity between stator and rotor. The major part of this theory is calculation of machine inductances considering time and spatial harmonics; the first step in the evaluation of the machine inductances is determination of the magnetic permeance distribution of the air gap in the eccentricity fault condition. This distribution has an inverse relationship with the air gap length and a direct relationship with the radius. The air gap length and radius are precisely calculated in this paper. The next step is the use of Ampere’s law on a closed-path, the result defines a turn function of the motor circuits and calculates the field intensity in the air gap. The resulting field intensity depends on the air gap magnetic permeance distribution and magnetic field intensity at the origin. Application of Ampere and Gauss’s laws lead to an expression for the magnetic field intensity of the winding, which is proportional to the magnetic permeance distribution. The proportionality factor is called the winding function of the specific winding. Having the magnetic field intensity from any winding and applying the electromagnetic laws, an integral form equation is obtained for different inductances of the motor. By applying the Ampere’s law and considering the turn function [10, 11], the following equation for winding is obtained as follows:

Since the iron permeability, µfe , is considerably larger than 1, the mmf drop within the iron can be ignored, compared to that of the air gap. Also, because the air gap length is small, it is assumed that the magnetic field intensity within angle φ is independent of the radius and its value is equal to that at the middle of the air gap. The inductance between two arbitrary windings is:
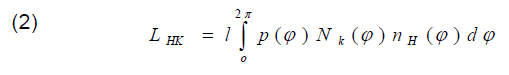
where p(φ) is the air gap magnetic permeance distribution, nH(φ) is the turn function of winding H, and NK(φ) is the winding function of winding K. The last step entails computation of the motor inductances. The calculated inductance matrices lead to a quick solution of the differential equations. If such analytical expressions are not used, all inductances profiles of the motor must be calculated at several rotor angular positions and stored in the inductances matrices. For solving it, an interpolation is then carried out for all inductances. This results in a longer computation time and lower computations accuracy. The method presented here is based on a manual computation of all inductances and deriving their closed-form analytical equations. Computerizing this method leads to the development of a software function that calculates the inductance matrix of the motor by receiving the mechanical position of the rotor and geometry of the eccentricity condition. After calculation of self- and mutual-inductances of the healthy and faulty motor for several rotor angular positions and storing data in the inductances matrices, computation of stator currents, torque and speed are necessary for processing and feature extracting. Hence the electromagnetic coupling model of the synchronous motor is solved using 4th- and 5th- order Runge-Kutta approach. Fig.1 depicts the per phase self-inductance of the stator winding of a synchronous motor in healthy, 10% DE and 40% DE cases. It is seen the dynamic eccentricity increases the magnitude of the self-inductance of the stator winding. As shown in Fig. 1, the high level DE distorts the self-inductance of the stator winding. The reason is that in the dynamic eccentricity case, the air gap permeance depends on the rotor angular position and this angle varies continuously.


Modeling Synchronous Motors by TSFEM
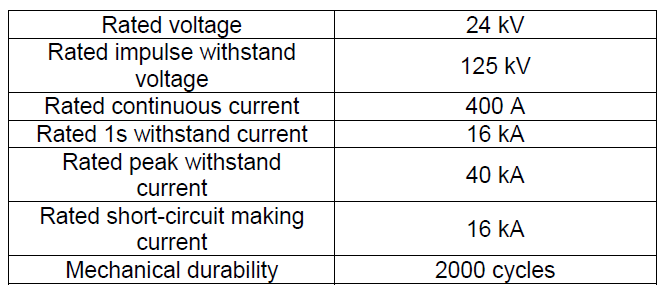
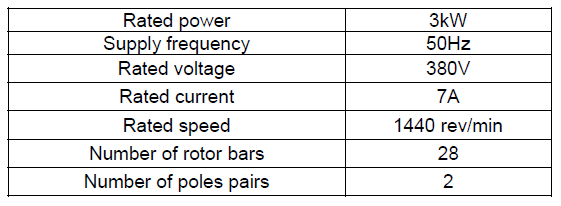
According to [14, 15], the model of the faulty motors is the first stage of any reliable fault recognition algorithm. Thus, practical conditions of the faulty motor should be considered for accurate modeling. The modeling methods which are based on the magnetic field determination and also they consider different aspects of faulty machines can be selected as an efficacious approach to calculate required signals and parameters for processing. In this paper, the healthy and faulty synchronous motors under SE and DE are modeled using TSFEM. In this modeling, geometry of the motor elements including stator, rotor and shaft are taken in to account. Moreover, spatial distribution of the stator windings, non-uniform air-gap, physical conditions of the stator conductors, rotor, shaft and air-gap, and nonlinearity of the core materials are taken into account. Three-phase sinusoidal voltage applied to the terminals of the motor is the input of the simulation procedure. Specifications of the proposed synchronous motor have been given in Table I.
In this simulation, transient analysis of rotating machines is employed for modeling and analyzing the synchronous motor with mechanical coupling. The electrical equations due to the external circuits which exhibit supply and electrical circuits are combined with magnetic field equation in FEM and motion equations of the mechanical coupling.
Fig. 2 illustrates flux distribution in the simulated synchronous motor. As shown in Fig. 2 the eccentricity clearly affects the flux distribution within the round-rotor motor and the magnetic flux distributions are not identical on both sides of the motor in faulty condition. The reason is that the flux path reluctance in this type of motor is mainly determined by the length of the air gap. When the rotor is displaced to the stator, the length of gap between rotor poles and stator core in one ha lf of the rotor surrounding air is reduced, while rising in the other half. This leads to the creation of unbalanced magnetic reluctance paths for the flux and consequence asymmetry in flux distribution within motor. The eccentricity is too capable to more clearly affect to the total reluctance of the motors in low excitation current, in which the motors magnetic circuit are linear and saturation not occurred. Therefore, the full reluctance paths of the motors dominantly are determined by the air gap reluctance.
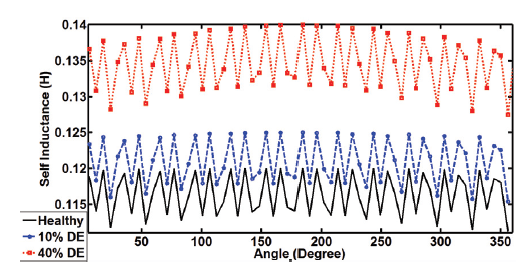
Table I. Salient Pole Synchronous Generator Parameters Used in the Simulation

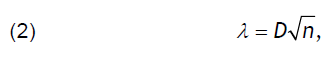
Calculation of winding inductances is a prominent approach to analyze the electrical machine under different fault conditions. In order to predict performance of the motors under dynamic eccentricity, inductances of the stator circuits should be estimated precisely. Due to the symmetrical distribution of the windings in the motors slots, the inductance profile of stator windings will have identical variation with a phase shift in the presence of the eccentricity. Consequently, one phase of stator (phase A) is considered in this paper. Self inductance of phase A (Laa) is calculated from the flux-linkage seen by the phase (λaa), when a dc current passes through it, and other windings are open-circuited, as follows:

Fig. 3 demonstrates the self-inductance of phase A in the healthy and in case of different DE degrees in round-rotor synchronous motor. They have been obtained for different rotor angular positions from 0° to 360° with step-angle of 3°. According to Fig. 3, it is clear that the minimum and maximum amplitude of the self-inductance of the phase A rises with the increase of DE. It is seen 10% DE and 40% DE increase the self-inductance mean 4% and 12%, respectively.
Modeling Synchronous Motors by TSFEM
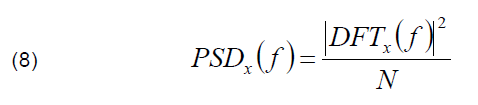
Following the calculation of the stator current using WFM and TSFEM, determination of the stator current spectrum is necessary to introduce a criterion for fault detection. The maximum required frequency is around 1000 Hz (21th harmonic component) and according to the Nyquist law, sampling frequency is set equal to 2000 Hz. However, in order to have an acceptable resolution, sampling frequency has been set to 6400 Hz (128 sample per cycle).
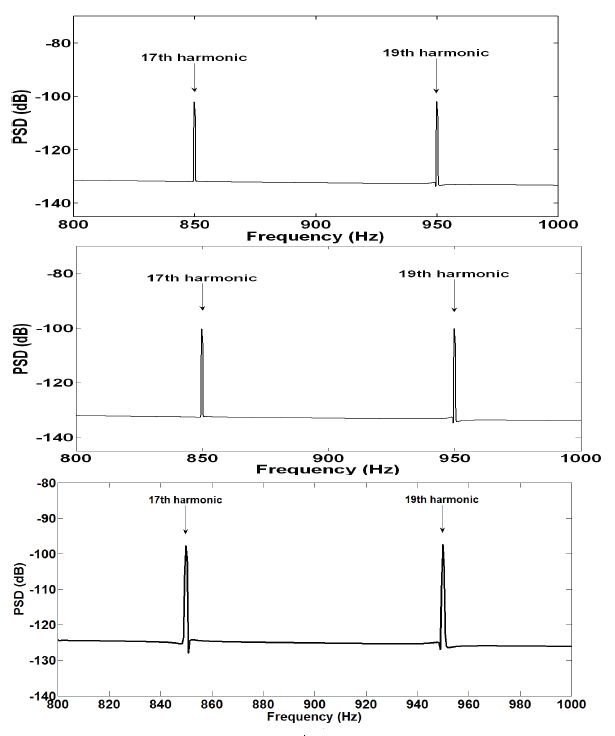

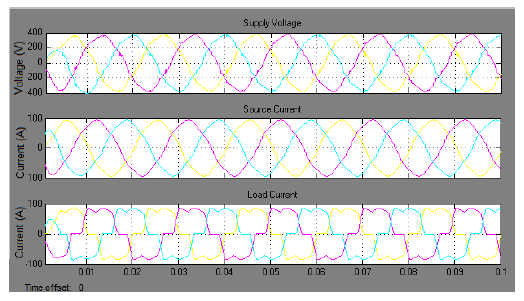
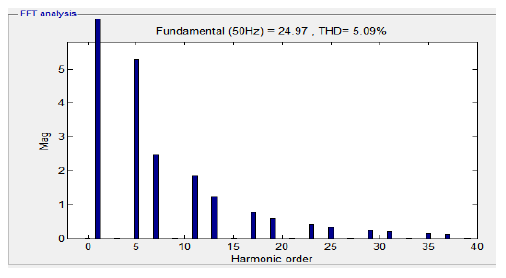
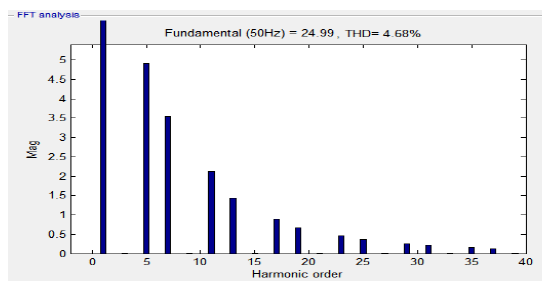
Furthermore, the stator current signal is simulated over 4 seconds which allows analyzing the signals with a frequency resolution of 0.25 Hz. As shown in Fig. 4, 30% SE increases the amplitude of the 17th and 19th harmonic components about -2.05dB and -2.21dB, respectively. Furthermore, fault expansion to 50% SE raises the amplitude of the 17th and 19th harmonic components about 6 dB and -6.1dB, respectively. Comparison between amplitude of the 17th and 19th harmonic components in the stator current spectra due to SE reveals that incremental rate of the SE and DE degrees. Fig. 5 shows that the slope of AB is as same as BC. Indeed, incremental rate of the amplitude of the 17th harmonic component due to different SE degrees is as equal as DE cases. Therefore, it may be concluded that influence of the SE and DE fault on the stator currents harmonics is equal. It is related to the unbalanced magnetic pull (UMP) due to eccentricity which is larger for the SE cases. Fig. 6 exhibits the spectrum of the stator current which has been calculated by FEM.
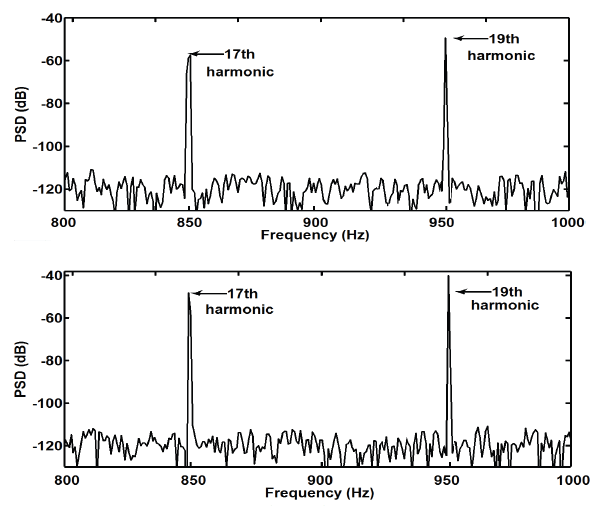
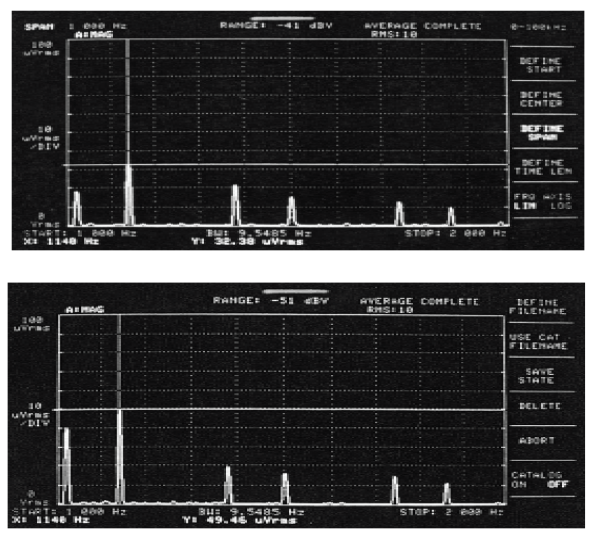
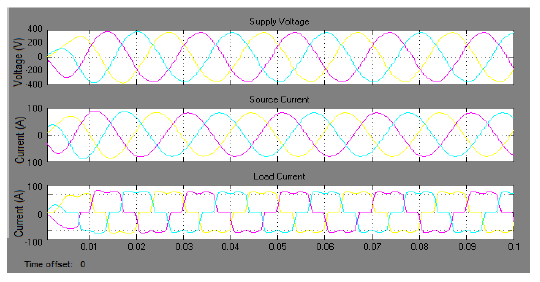
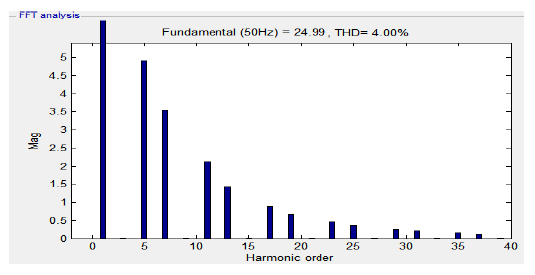
Comparison between Fig. 4, Fig. 6, and experimental results in Fig. 7 demonstrates that the obtained results by FEM is more precise than obtained results by WFM. The reason is the utilized approximation in the WFM in which non-linearity characteristics of the ferromagnetic materials, spatial distribution of the stator windings and stator slots effects are ignored.
Impacts of Load Variation on Fault Recognition
A. Stator Currents
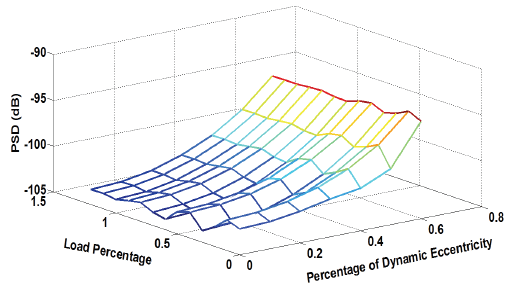
Fig. 8 shows the variation of the amplitude of the 19th harmonic components versus different load levels. According to Fig. 8, amplitude of the aforementioned harmonics rises due to the increase of the eccentricity degree and it is fairly constant for load variation between 0% and 120% rated load. It is seen, that the load variation has no influence on the magnitude of the aforementioned harmonics. This may be justified based on the speed profile of the healthy and faulty synchronous motors. Since the synchronous motors rotate with a constant synchronous speed, load variation has no noticeable impacts on the amplitude of harmonic components at the same eccentricity degrees. Indeed, these criteria are robust against the load variation and it is not necessary to specify motor load for accurate fault detection. Therefore, these criteria are much efficient than the global indices which are utilized for the eccentricity fault diagnosis in induction motors. Amplitude of the aforementioned harmonic components has been summarized in Table II.

B. Developed Torque
Fig. 9 depicts the time variation of the developed torque of the healthy and faulty motor for 50% and 100% rated load cases. As shown in Fig. 9, eccentricity raises the variation rate of the motor torque. This is due to the increase of magnitude of harmonic components in the stator currents and distortion of the airgap flux density. In addition, it is seen that load increase causes to decrease of the overshoot of the motor torque.
Modeling Synchronous Motors by TSFEM
In this paper, WFM and FEM were used to simulate the healthy and faulty synchronous motors under different SE and DE degrees. It was illustrated that SE and DE have the identical impacts on the inductances and stator currents spectra of the synchronous motors. In addition, it was demonstrated that load variation has no influence on the 17th and 19th harmonic components of the stator currents spectra. Indeed, these criteria are robust against load variation which is the noticeable feature for accurate fault recognition in different conditions of the motor.
Table II. Amplitude of the 17th Harmonic Components for different SE degrees and different Loads

REFERENCES
[1] B. M. Ebrahimi and J. Faiz, “Diagnosis and performance analysis of three-phase permanent magnet synchronous motors with static, dynamic and mixed eccentricity,” IET Electric Power Applications, vol. 4, no. 1, Feb. 2010, pp. 53- 66.
[2] Stoll, R. L., Hennache, A., “Method of detecting and modeling presence of shorted turns in DC field winding of cylindrical rotor synchronous machines using two airgap search coil,” IEE Proceeding Vol. 135, No. 6, pp. 281-294, November 1988.
[3] Hsu, J. S., and Stein, J., “Effect of eccentricities on shaft signals studied through windingless rotors,” IEEE Transaction on Energy Conversion, Vol. 9, No. 3, pp. 564:571, September 1994.
[4] Hsu, J. S., and Stein, J., “Shaft signal of salient-pole synchronous machines for eccentricity and shorted-field-coil detections,” IEEE Transaction on Energy Conversion, Vol. 9, No. 3, pp. 572-578, September 1994.
[5] Alger, P. L., and Samson, H. W., “Shaft currents in electric machines,” AIEE Transaction pp. 235-245, February 1924.
[6] Verma, S. P., and Girgis, R. S., Shaft potentials and currents in large turbo generators. Report for the Canadian Electrical Association, Research & Development, Suite 580, One Westmount Square, Monteral, Quebec, H3Z 2P9, May 1981.
[7] 61. Meyer, A., Joho, R., Posedal, Z., Reichert, K., and Ammann, C., “Shaft voltage in turbosets: Recent development of a new grounding design to improve the reliability of the bearings,” Int. Conference on large high voltage electric systems, paris, August 1988.
[8] Cameron, J. R., Thomson, W. T., and Dow, A. B., “Vibration and current monitoring for detecting airgap eccentricity in large induction motor,” IEEE Proceeding, Vol. 133, No. 3, pp. 155- 163, May 1986.
[9] Pollock, G. B., and Lyles, J. F., “Vertical hydraulic genertors experience with dynamic airgap monitoring,” IEEE Transaction on Energy Conversion, Vol. 7, No. 4, pp. 660-667, December 1992.
[10] Toliyat, H. A., and Al-Nuaim, N. A., “Simulation and detection of dynamic airgap eccentricity in salient-pole synchronous machines,” IEEE Transaction on Industry Application, Vol. 35, No. 1, pp. 86-93, January/February 1999.
[11] Al-Nuaim, N. A., and Toliyat, H. A., “A novel method for modeling dynamic air-gap eccentricity in synchronous machines based on modified winding function theory,” IEEE Transaction on Energy Conversion, Vol. 13, No. 2, pp.156- 162, June 1998.
[12] Tabatabaei, I., Faiz, J., Lesani, H., and Nabavi-Razavi, M. T., “Modeling and simulation of a salient–pole synchronous generator with dynamic eccentricity using modified winding function theory,” IEEE Transaction on Magnetics, Vol. 40, No. 3, pp.1550-1555, May 2004.
[13] J. Faiz, Bashir Mahdi Ebrahimi, M. Valavi and H. A. Toliyat “Mixed eccentricity fault diagnosis in salient-pole synchronous generator using modified winding function method,” Journal of Progress In Electromagnetics Research B, vol. 11, 2009, pp. 155–172.
[14] J. Faiz, Bashir Mahdi Ebrahimi, B. Akin, and B. Asaie, “Criterion function for broken-bar fault diagnosis in induction motor under load variation using wavelet transform,” Journal of Electromagnetics, Taylor & Francis, vol. 29, May 2009, pp. 220-234.
[15] J. Faiz and Bashir Mahdi Ebrahimi, “Determination of number of broken rotor bars and static eccentricity degree in induction motor under mixed fault,” Journal of Electromagnetics, Taylor & Francis, vol. 28, Aug 2008. pp. 433 – 449.
Source & Publisher Item Identifier: PRZEGLĄD ELEKTROTECHNICZNY (Electrical Review), ISSN 0033-2097, R. 87 NR 5/2011