Published by Doug Dorr, Electric Power Research Institute Manager, Advanced Monitoring Applications Group.


Published by Doug Dorr, Electric Power Research Institute Manager, Advanced Monitoring Applications Group.
Published by Doug Dorr, Electric Power Research Institute Manager, Advanced Monitoring Applications Group.


Published by Bill Howe, PE, CEM Program Manager, EPRI Power Quality Manager, EPRI Industrial Center of Excellence.


Published by Laurent Maillefer, ABB, DM, Power Protection, May 2014.


Published by SmartGrid.gov
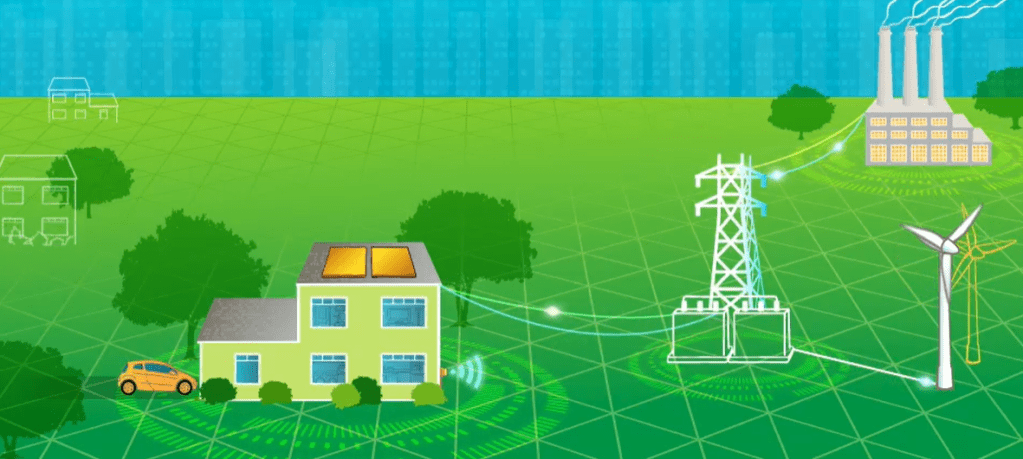
Maybe you have heard of the Smart Grid on the news or from your energy provider. But not everyone knows what the grid is, let alone the Smart Grid. “The grid,” refers to the electric grid, a network of transmission lines, substations, transformers and more that deliver electricity from the power plant to your home or business. It’s what you plug into when you flip on your light switch or power up your computer. Our current electric grid was built in the 1890s and improved upon as technology advanced through each decade. Today, it consists of more than 9,200 electric generating units with more than 1 million megawatts of generating capacity connected to more than 300,000 miles of transmission lines. Although the electric grid is considered an engineering marvel, we are stretching its patchwork nature to its capacity. To move forward, we need a new kind of electric grid, one that is built from the bottom up to handle the groundswell of digital and computerized equipment and technology dependent on it—and one that can automate and manage the increasing complexity and needs of electricity in the 21st Century.
In short, the digital technology that allows for two-way communication between the utility and its customers, and the sensing along the transmission lines is what makes the grid smart. Like the Internet, the Smart Grid will consist of controls, computers, automation, and new technologies and equipment working together, but in this case, these technologies will work with the electrical grid to respond digitally to our quickly changing electric demand.
The Smart Grid represents an unprecedented opportunity to move the energy industry into a new era of reliability, availability, and efficiency that will contribute to our economic and environmental health. During the transition period, it will be critical to carry out testing, technology improvements, consumer education, development of standards and regulations, and information sharing between projects to ensure that the benefits we envision from the Smart Grid become a reality. The benefits associated with the Smart Grid include:
Today, an electricity disruption such as a blackout can have a domino effect—a series of failures that can affect banking, communications, traffic, and security. This is a particular threat in the winter, when homeowners can be left without heat. A smarter grid will add resiliency to our electric power System and make it better prepared to address emergencies such as severe storms, earthquakes, large solar flares, and terrorist attacks. Because of its two-way interactive capacity, the Smart Grid will allow for automatic rerouting when equipment fails or outages occur. This will minimize outages and minimize the effects when they do happen. When a power outage occurs, Smart Grid technologies will detect and isolate the outages, containing them before they become large-scale blackouts. The new technologies will also help ensure that electricity recovery resumes quickly and strategically after an emergency—routing electricity to emergency services first, for example. In addition, the Smart Grid will take greater advantage of customer-owned power generators to produce power when it is not available from utilities. By combining these “distributed generation” resources, a community could keep its health center, police department, traffic lights, phone System, and grocery store operating during emergencies. In addition, the Smart Grid is a way to address an aging energy infrastructure that needs to be upgraded or replaced. It’s a way to address energy efficiency, to bring increased awareness to consumers about the connection between electricity use and the environment. And it’s a way to bring increased national security to our energy System—drawing on greater amounts of home-grown electricity that is more resistant to natural disasters and attack.

The Smart Grid is not just about utilities and technologies; it is about giving you the information and tools you need to make choices about your energy use. If you already manage activities such as personal banking from your home computer, imagine managing your electricity in a similar way. A smarter grid will enable an unprecedented level of consumer participation. For example, you will no longer have to wait for your monthly statement to know how much electricity you use. With a smarter grid, you can have a clear and timely picture of it. “Smart meters,” and other mechanisms, will allow you to see how much electricity you use, when you use it, and its cost. Combined with real-time pricing, this will allow you to save money by using less power when electricity is most expensive. While the potential benefits of the Smart Grid are usually discussed in terms of economics, national security, and renewable energy goals, the Smart Grid has the potential to help you save money by helping you to manage your electricity use and choose the best times to purchase electricity. And you can save even more by generating your own power.
The Smart Grid will consist of millions of pieces and parts—controls, computers, power lines, and new technologies and equipment. It will take some time for all the technologies to be perfected, equipment installed, and systems tested before it comes fully on line. And it won’t happen all at once—the Smart Grid is evolving, piece by piece, over the next decade or so. Once mature, the Smart Grid will likely bring the same kind of transformation that the Internet has already brought to the way we live, work, play, and learn.
Reference
SmartGrid.gov n.d., The Smart Grid, U.S. Department of Energy, accessed 5 January 2021
<https://www.smartgrid.gov/the_smart_grid/smart_grid.html >
Published by Tom Shaughnessy, Shaughnessy Consulting Services
208 Jasper Way, San Marcos, CA 92078
408-666-4009
Background
Phase rotation is something that contractors and electricians routinely check during construction and installation of motors and UPS systems. In facilities with only one service, seldom does a rotation change require utility involvement. However, complications can and do arise when a facility has more than one utility service if steps were not taken to ensure the same primary phase rotation exists for each service. This is especially critical if each utility service supplies power to delta/wye transformers and if there are plans to connect the services together at some point.
Typically, the use of fast switching automatic transfer switches inside the facility will bring the primary rotation problems to light. Figure 1 shows waveforms associated with primary rotation problems. The blue and red traces reflect phase A – to-neutral voltages for two different services – 277 volts measured from phase to neutral. There is a 60 degree phase difference between the waveforms. The 60 degree phase difference develops because the primary rotation for one utility transformer leads by 30 degrees and the other lags by 30 degrees. The result is a 60 degree phase difference between the services. It is important to note that both services have the same secondary rotation.

Figure 1: Resulting out of phase voltage waveforms
Not only is the phase difference an issue, but when one measures from Phase A of one service to Phase A of the second service, where there should be little to no voltage differential when the primary rotation angles are correct, there is now significant voltage difference – 482 volts (black trace).
At this point there are no happy answers:
The moral of the story is that prior to construction detailed instructions must exist advising that the primary rotation for each planned service has to match. The same applies if an additional service is added.
Please feel free to leave a question in the comments section.
Published by Terry Chandler, Director of Engineering, Power Quality Thailand LTD/Power Quality Inc., USA.
E-mail: terryc@powerquality.org, terryc@powerquality.co.th

Please feel free to leave a question in the comments section or contact Terry Chandler, terryc@powerquality.org, terryc@powerquality.co.th
Published by Terry Chandler, Director of Engineering, Power Quality Thailand LTD/Power Quality Inc., USA.
E-mail: terryc@powerquality.org, terryc@powerquality.co.th
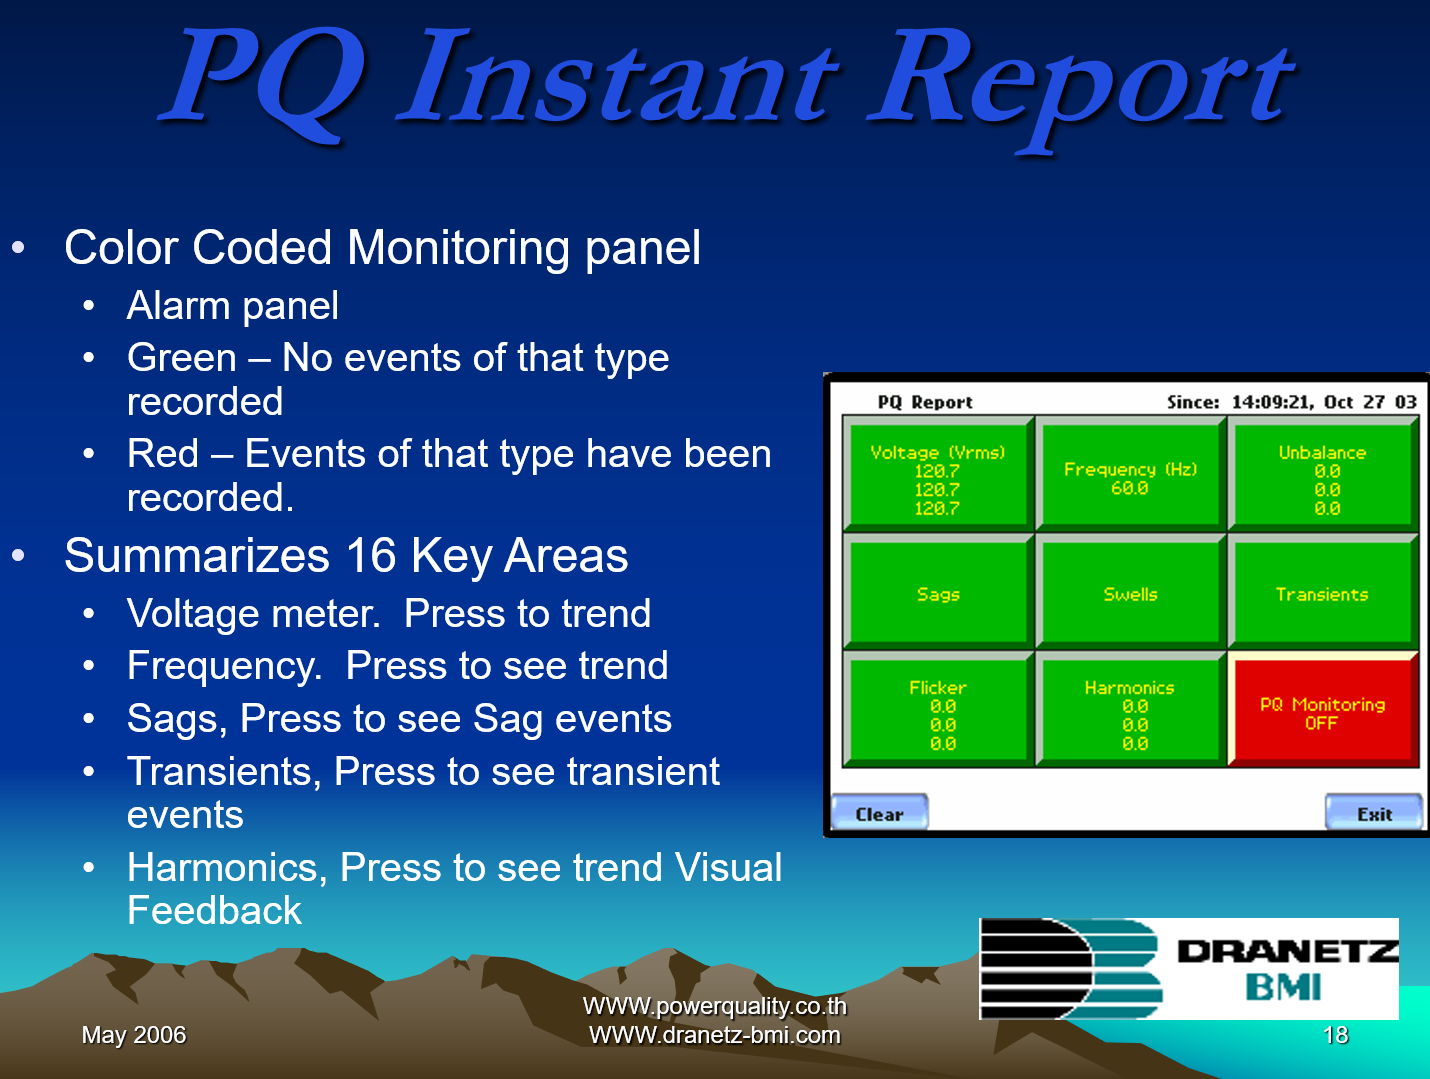
PQIncidentsTM
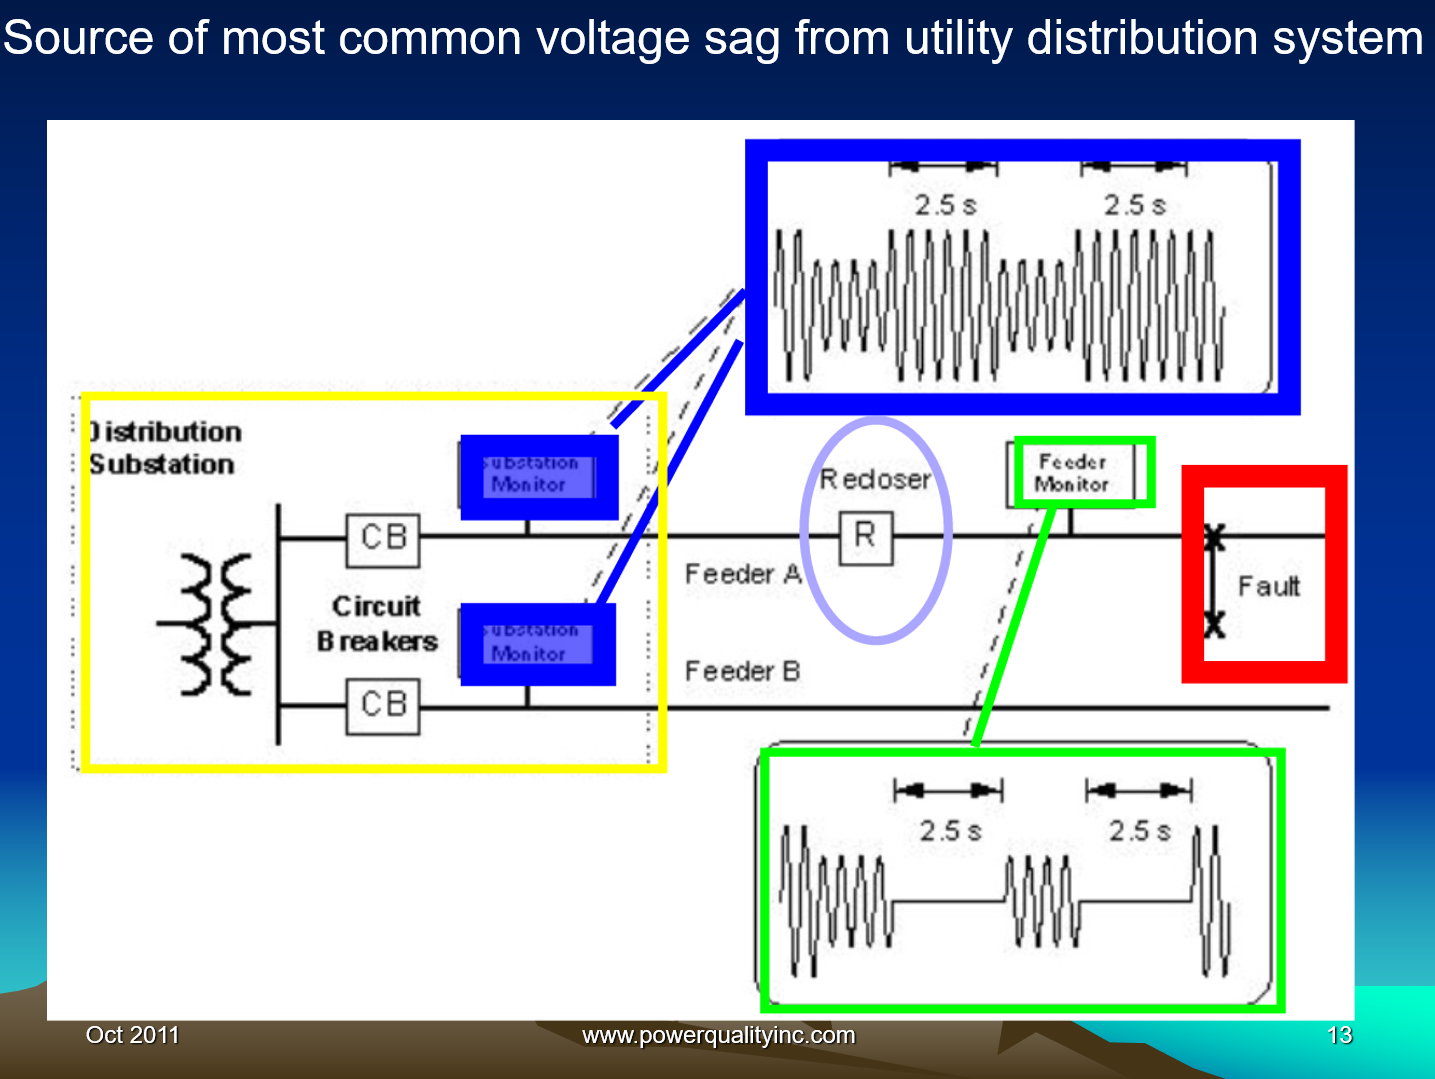
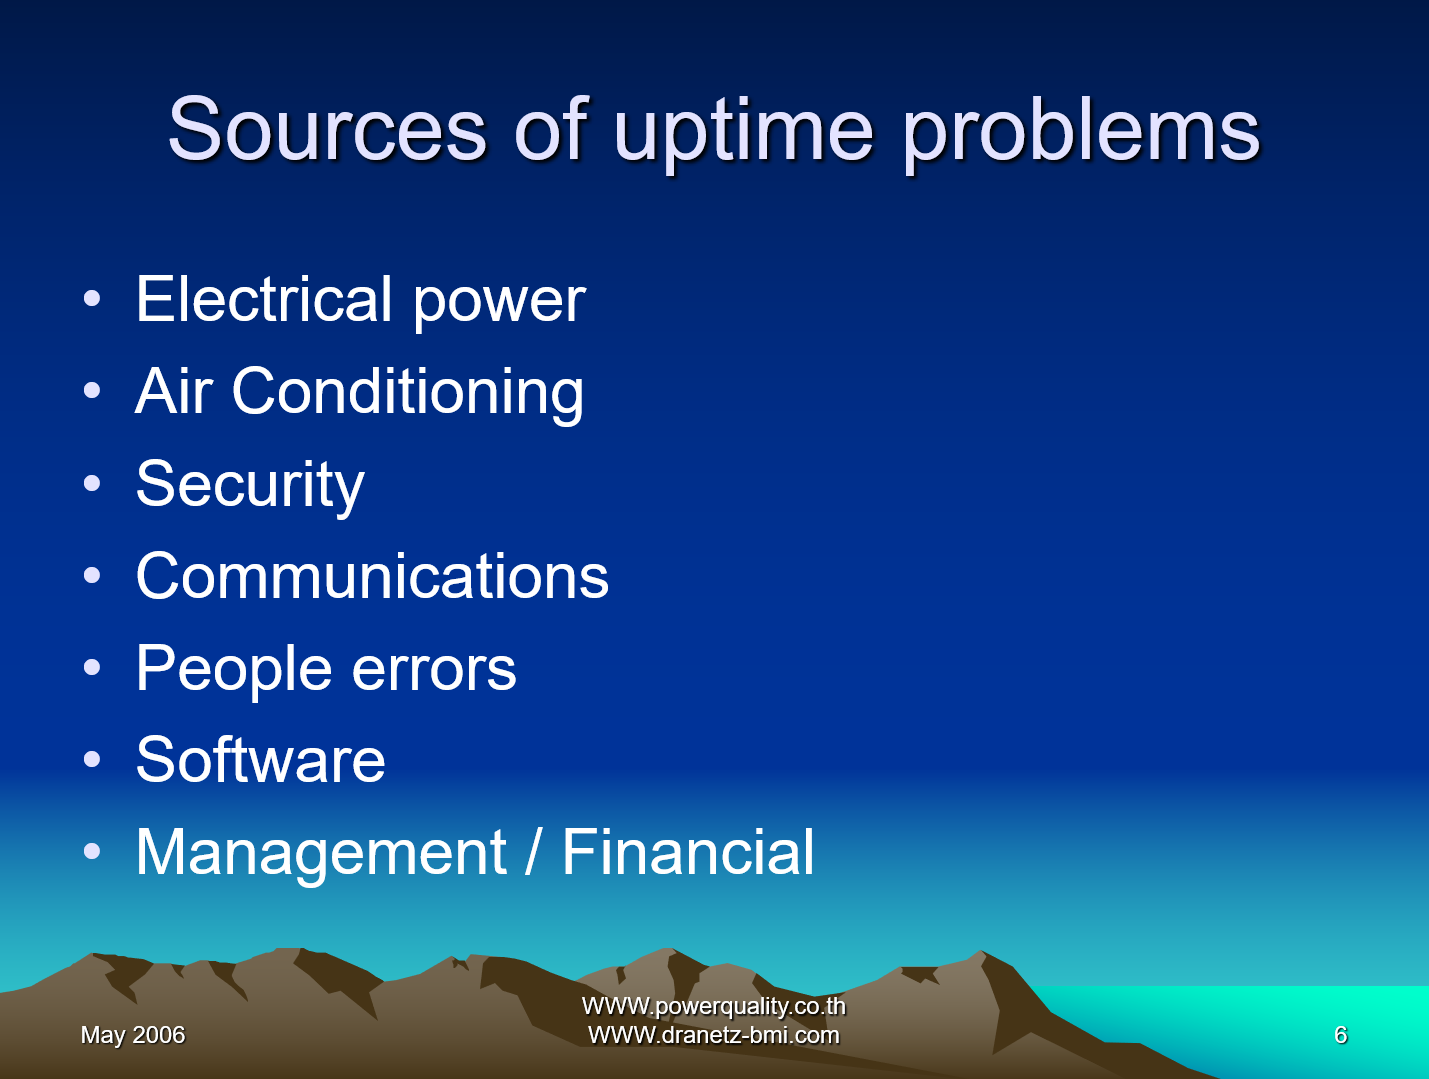
Sources of PQIncidentsTM
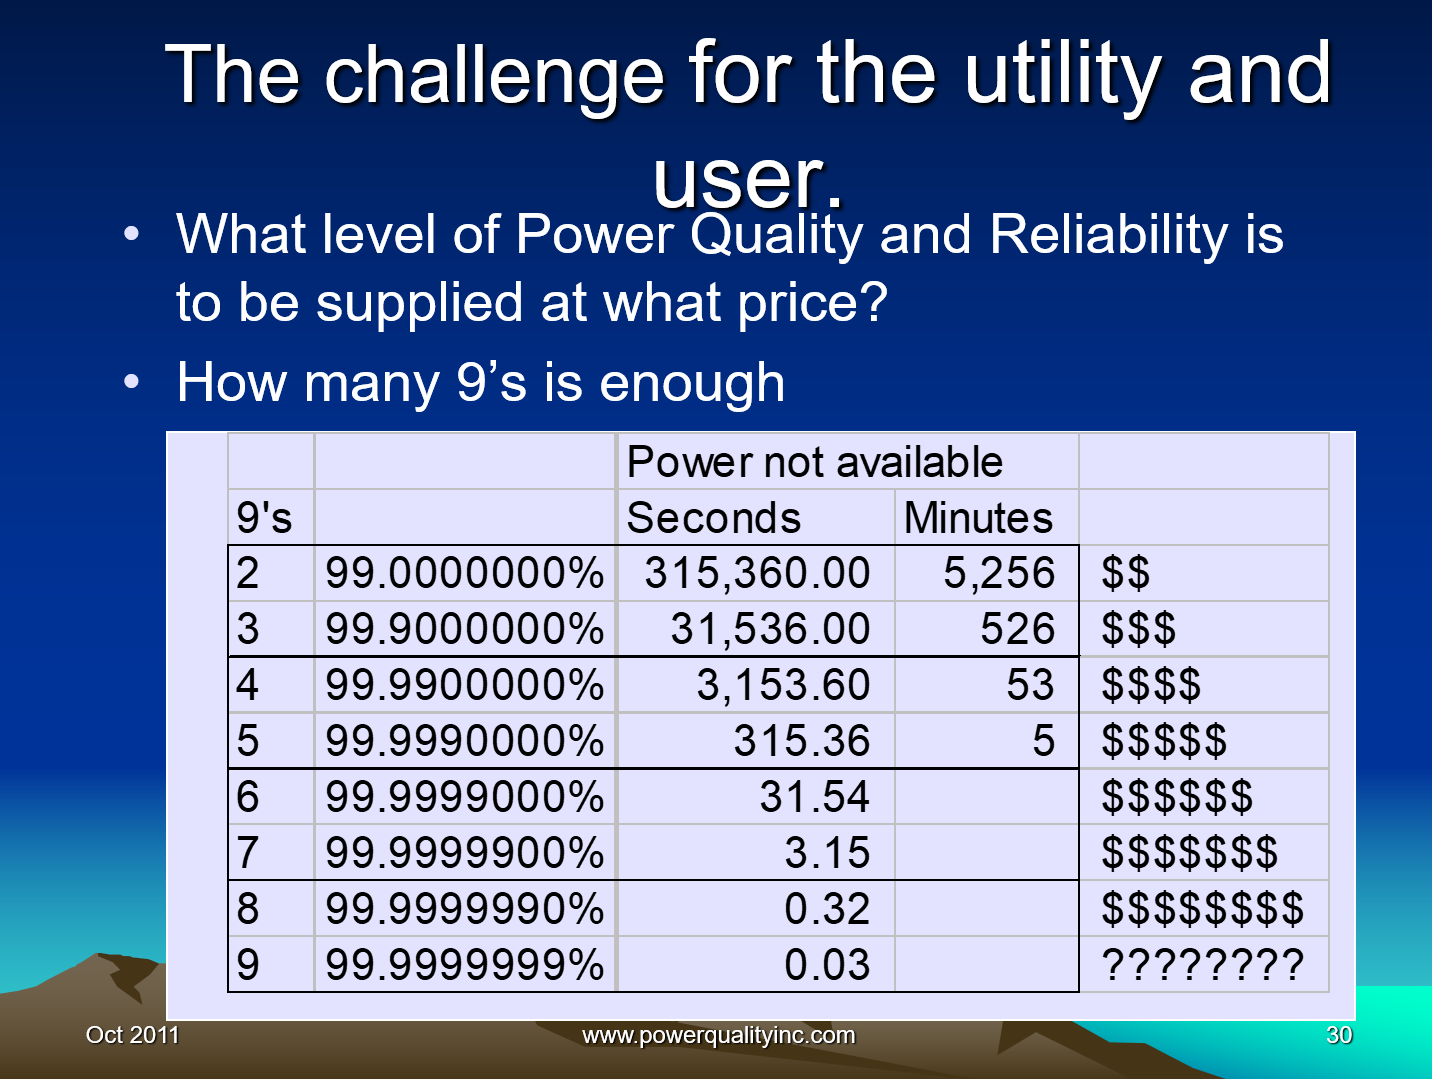
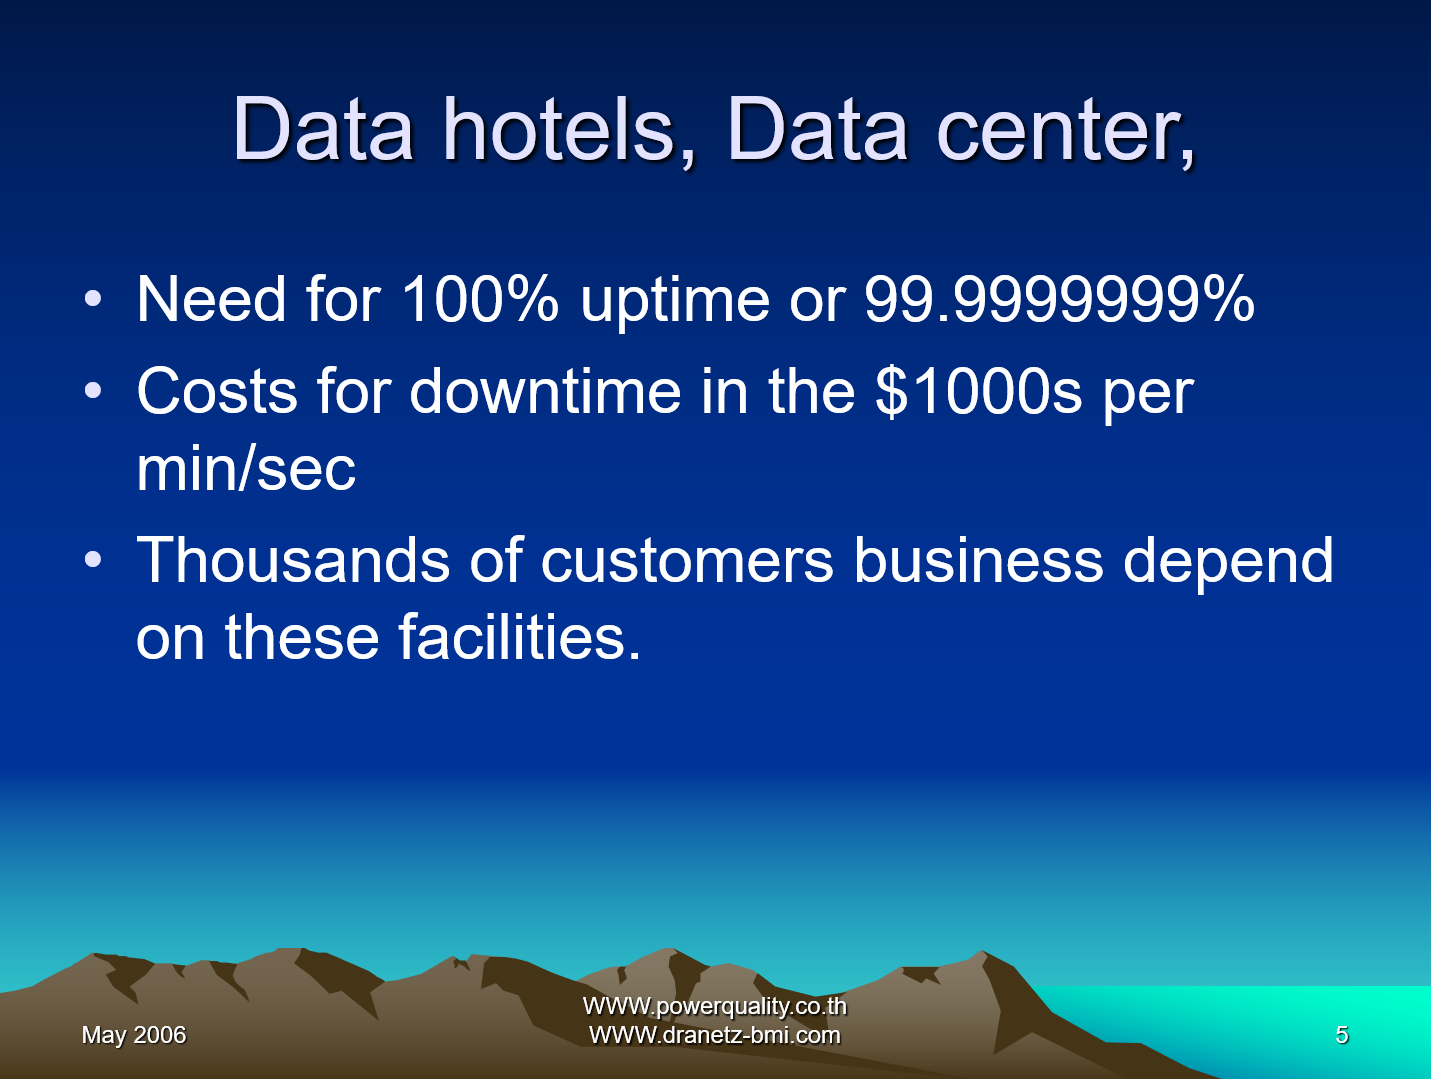
Power Reliability
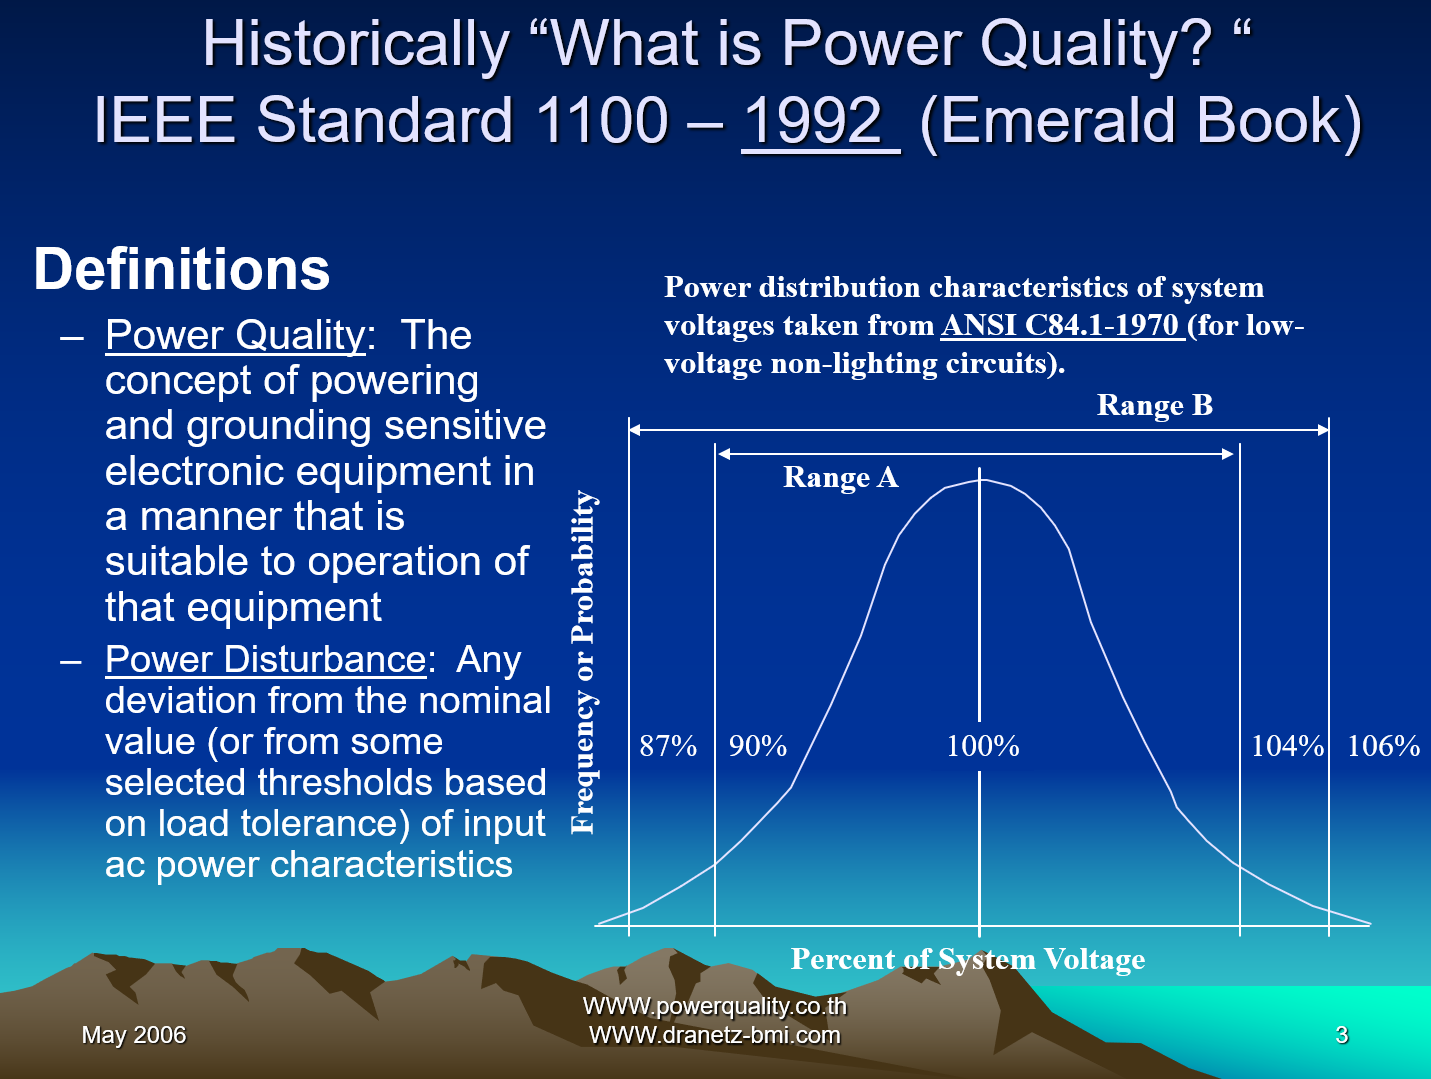
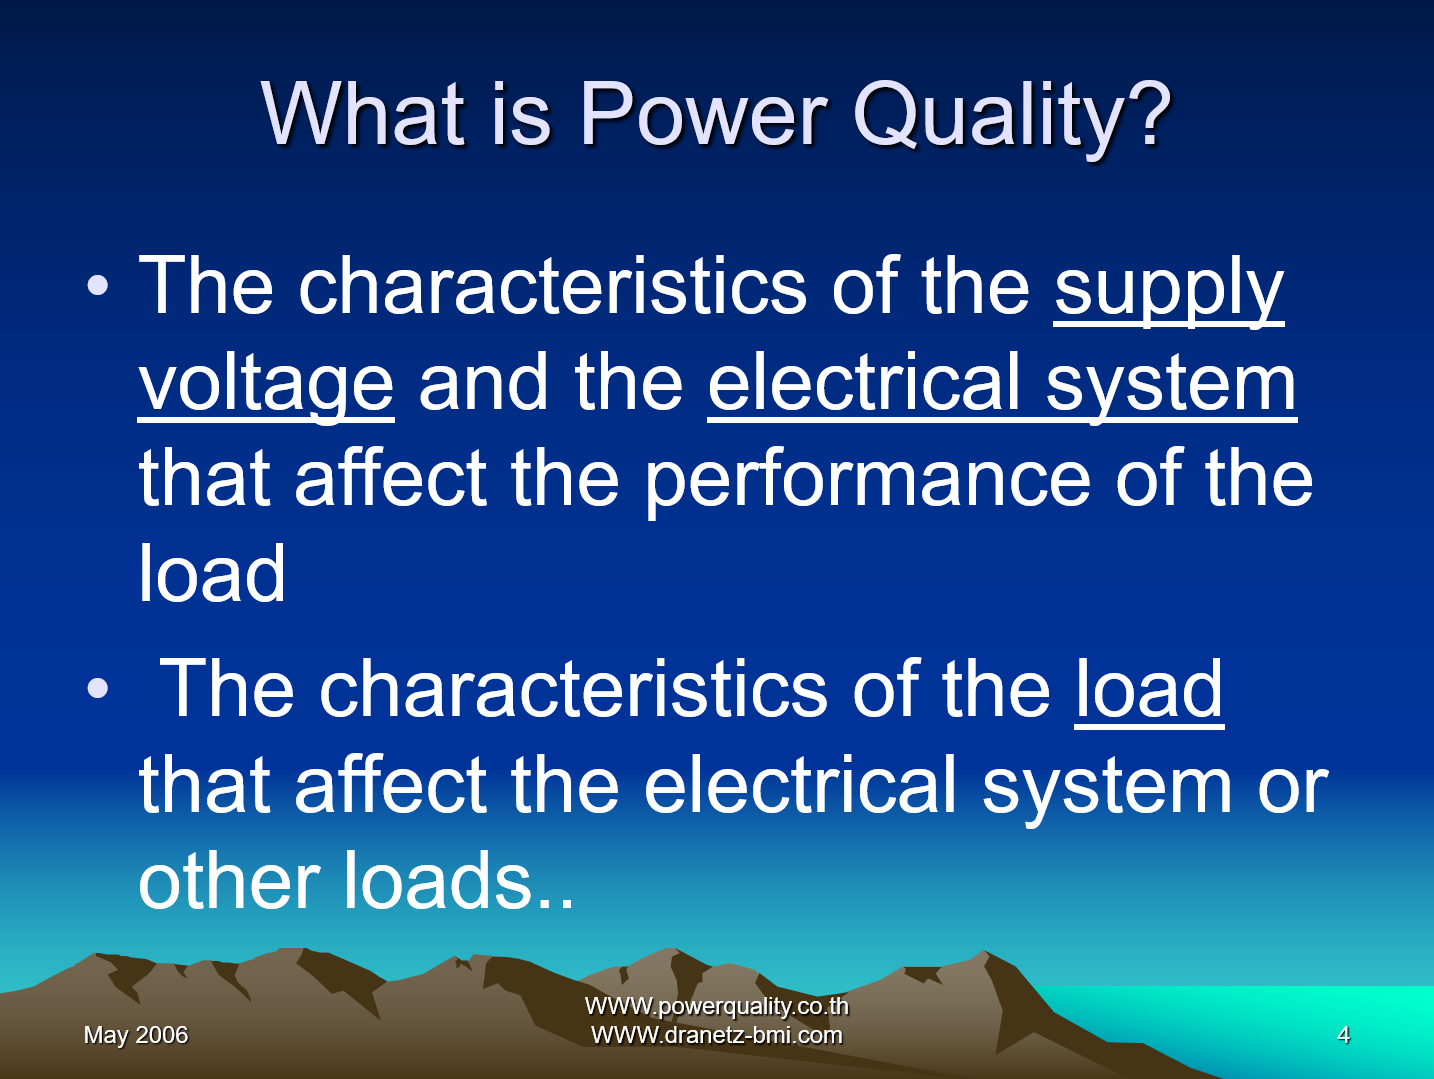
Power Quality
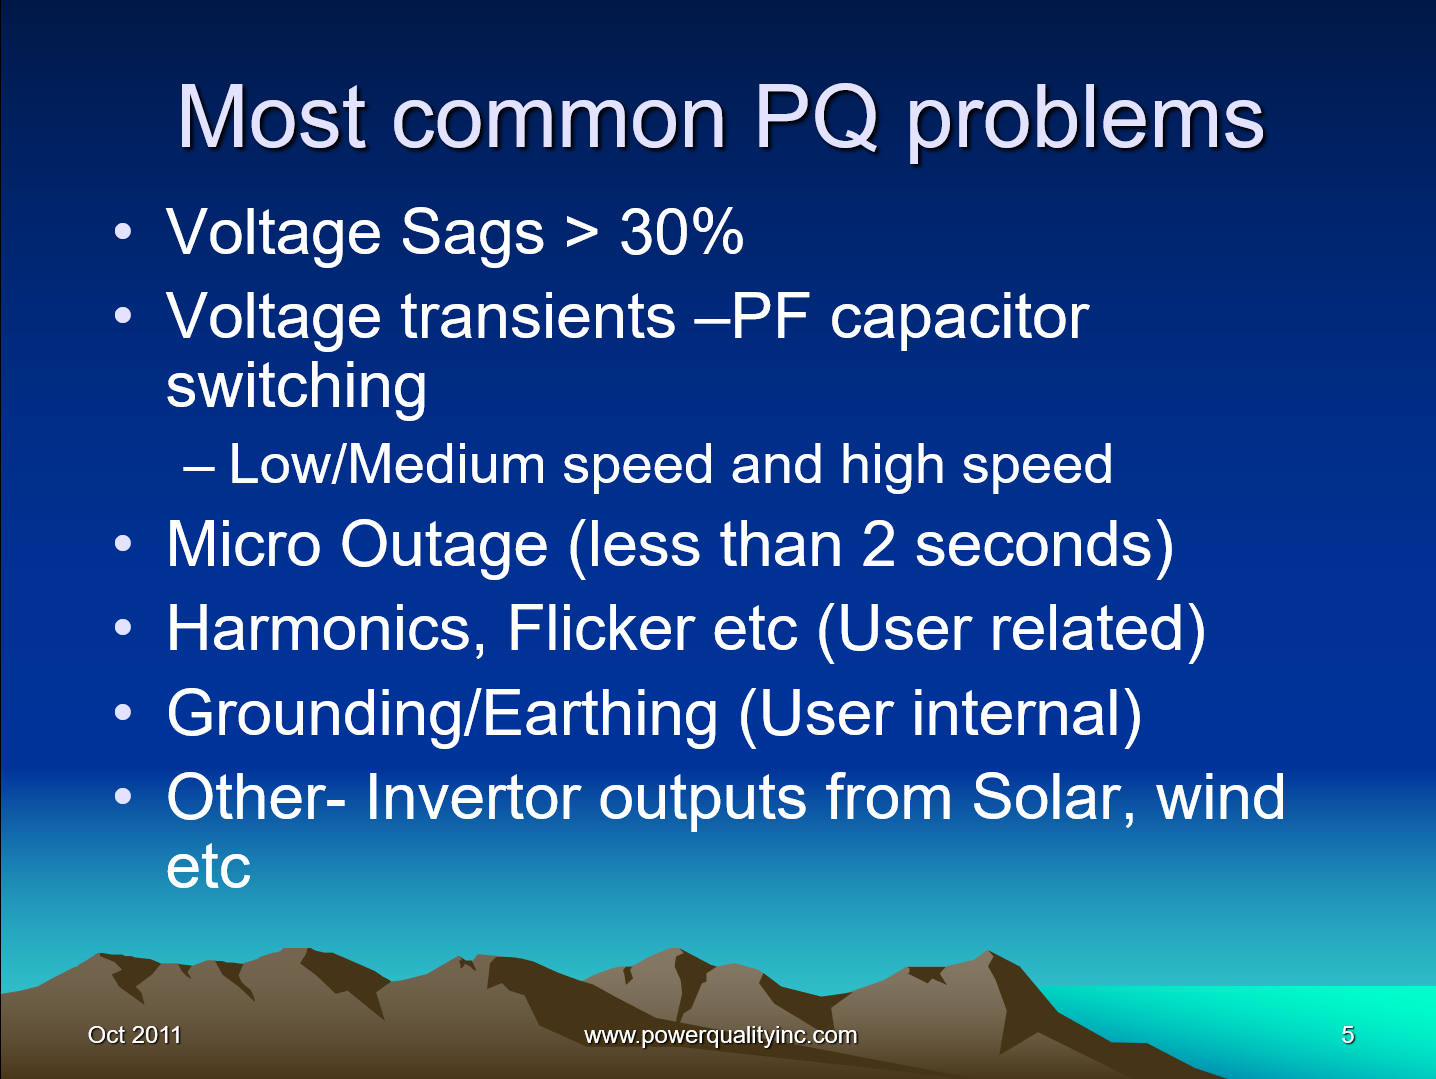
What are the various PQ parameters?
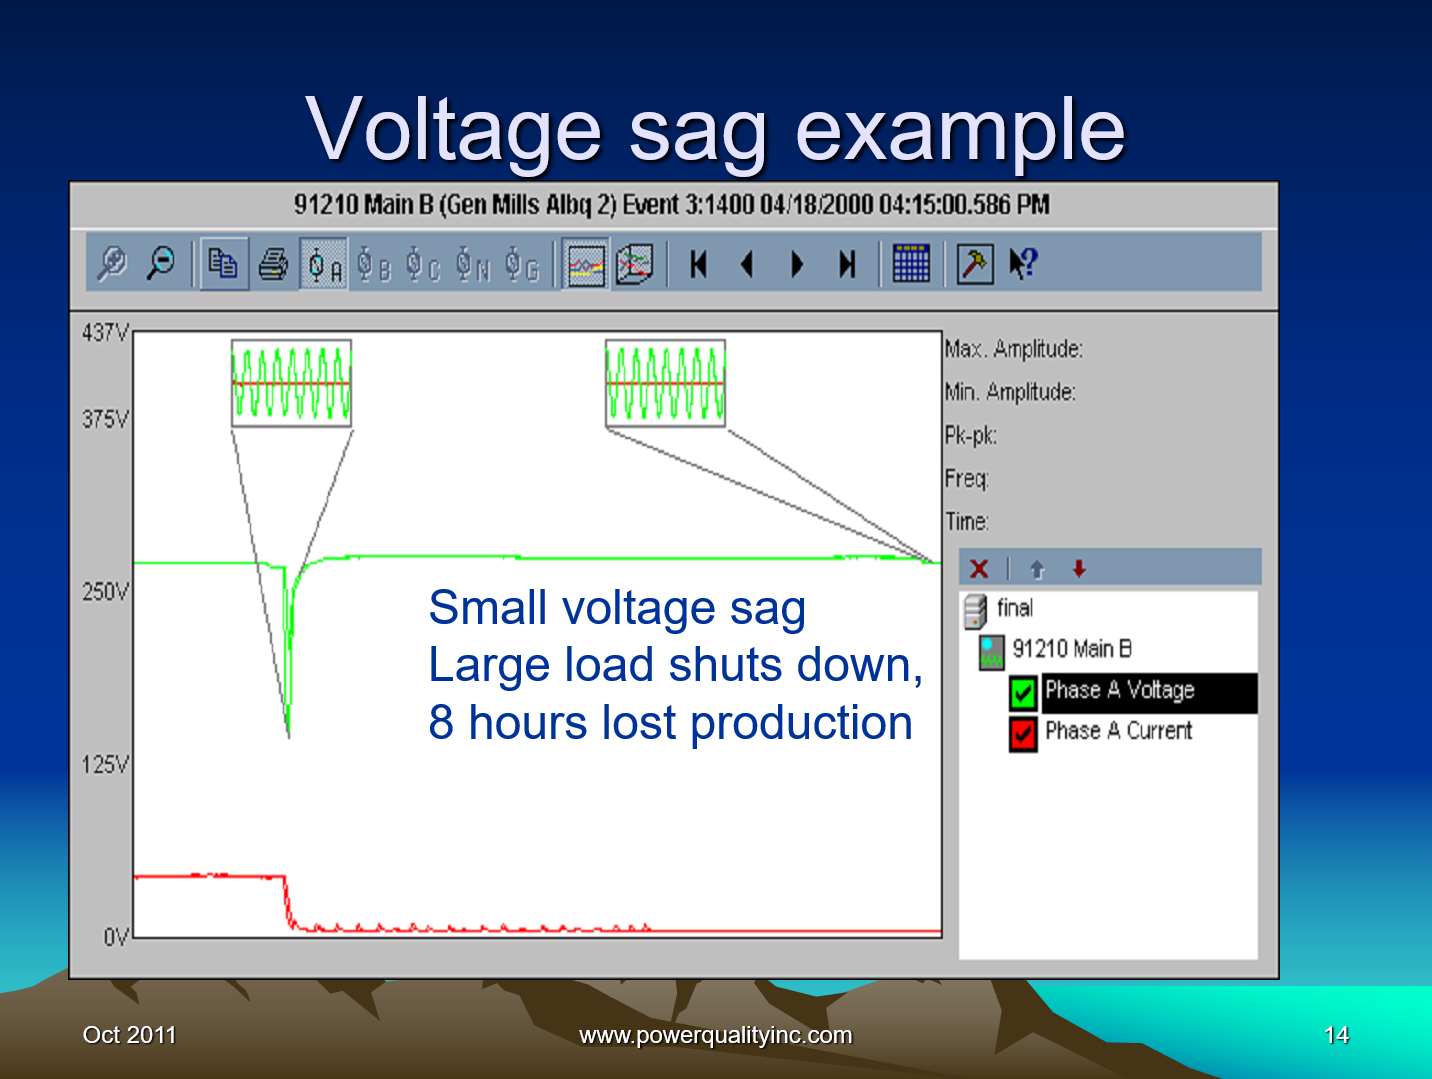
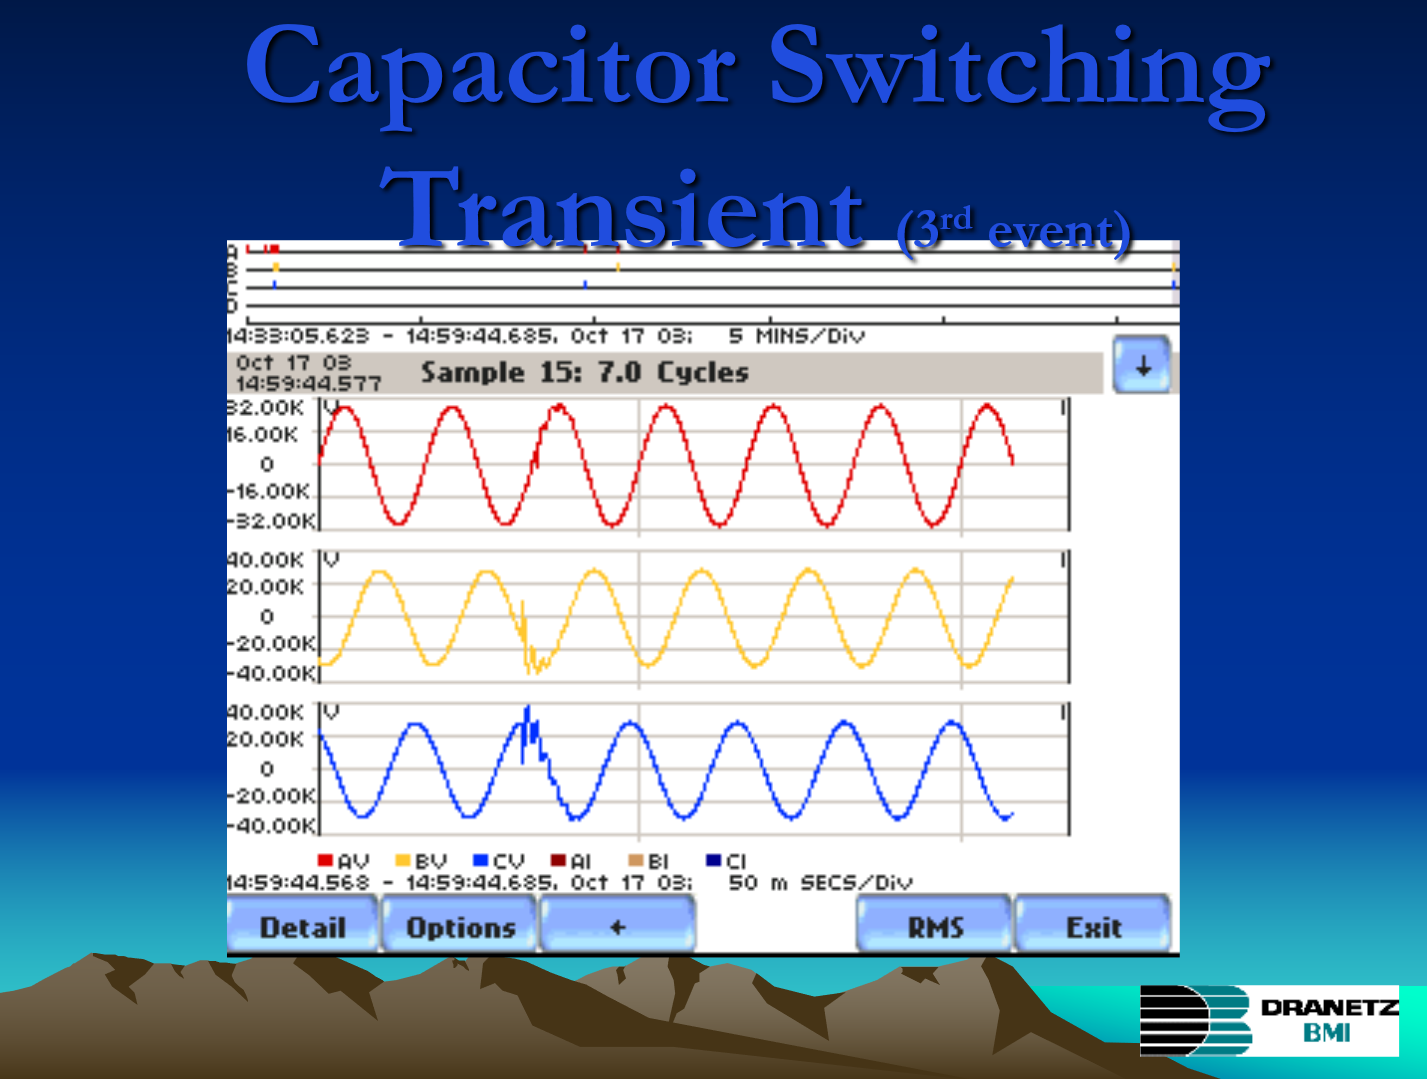
Identify PQIncidentsTM
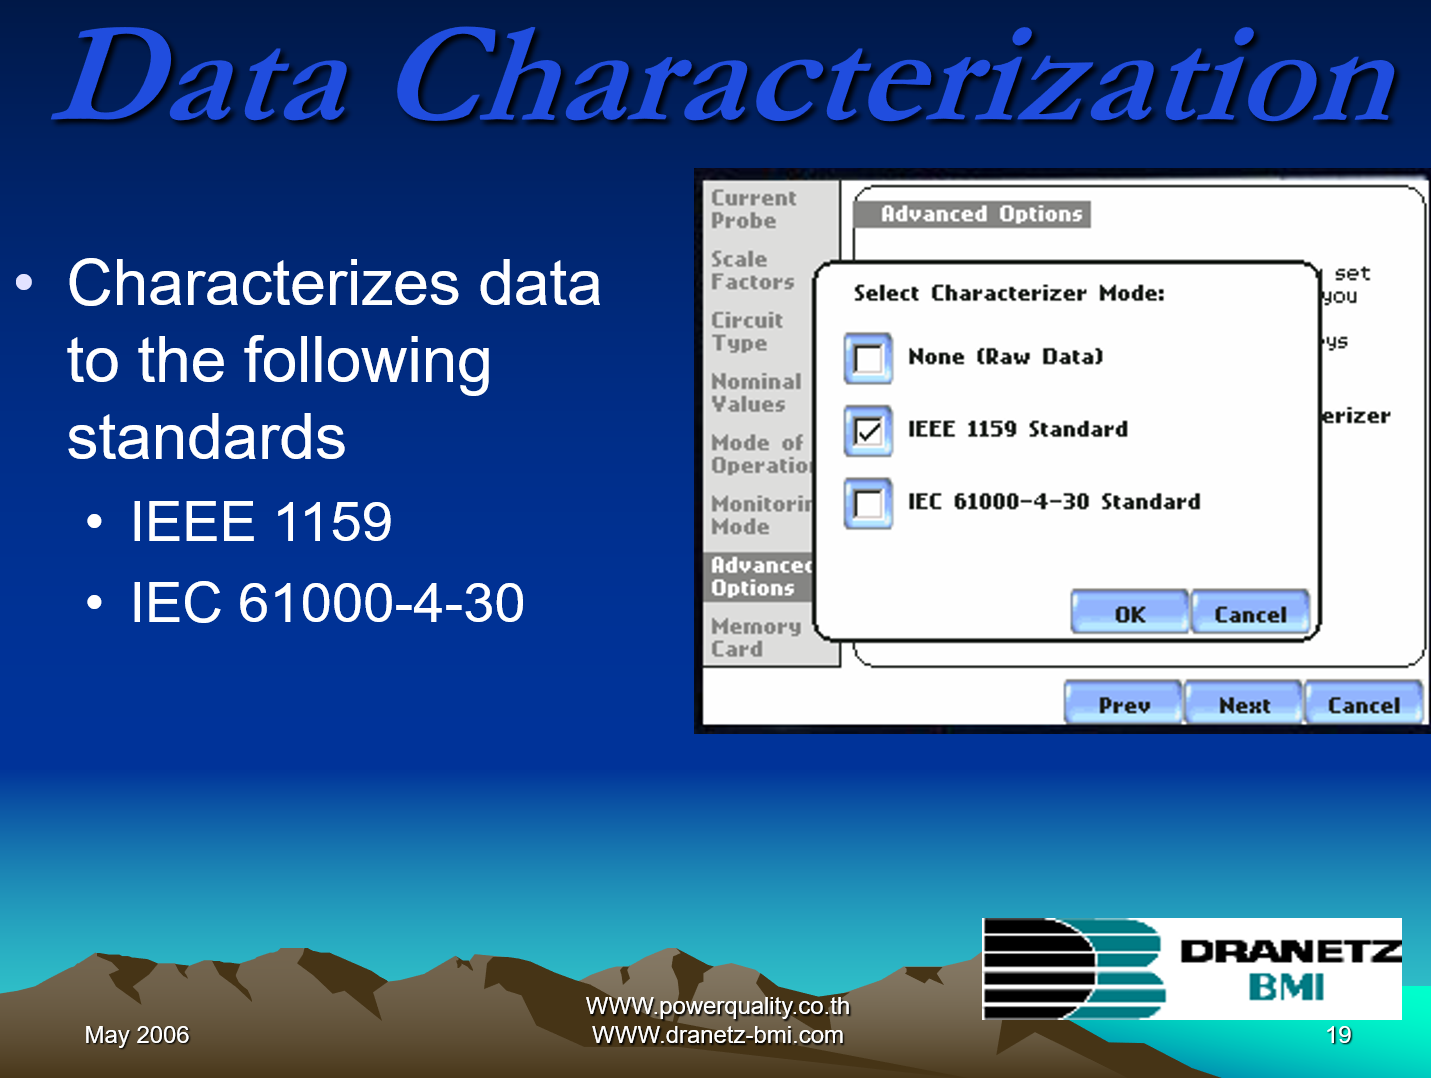
Characterize the PQIncidentsTM
Why use PQIncidentsTM?
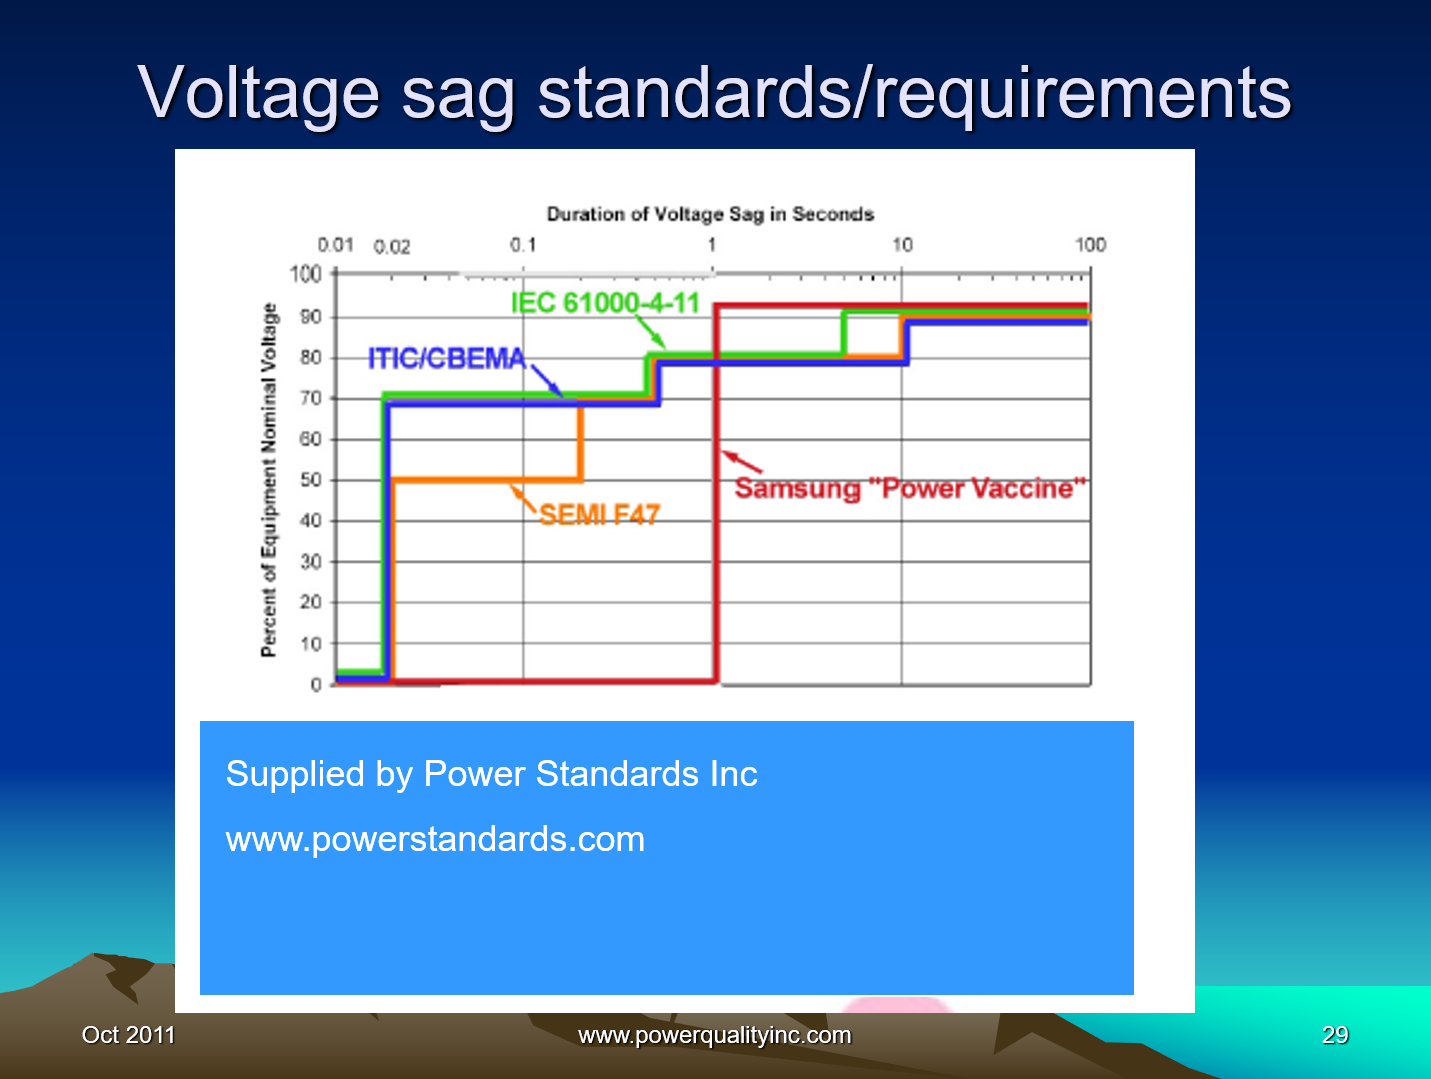
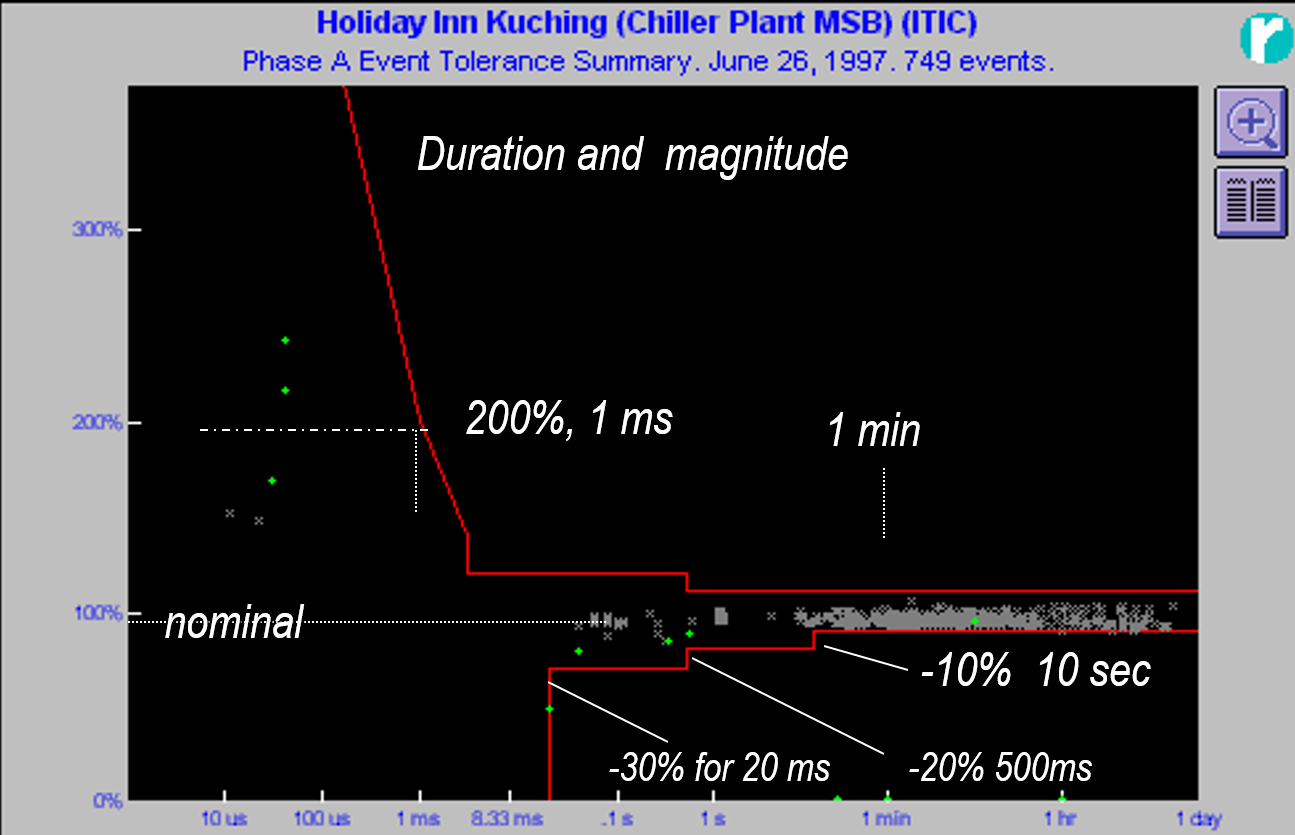
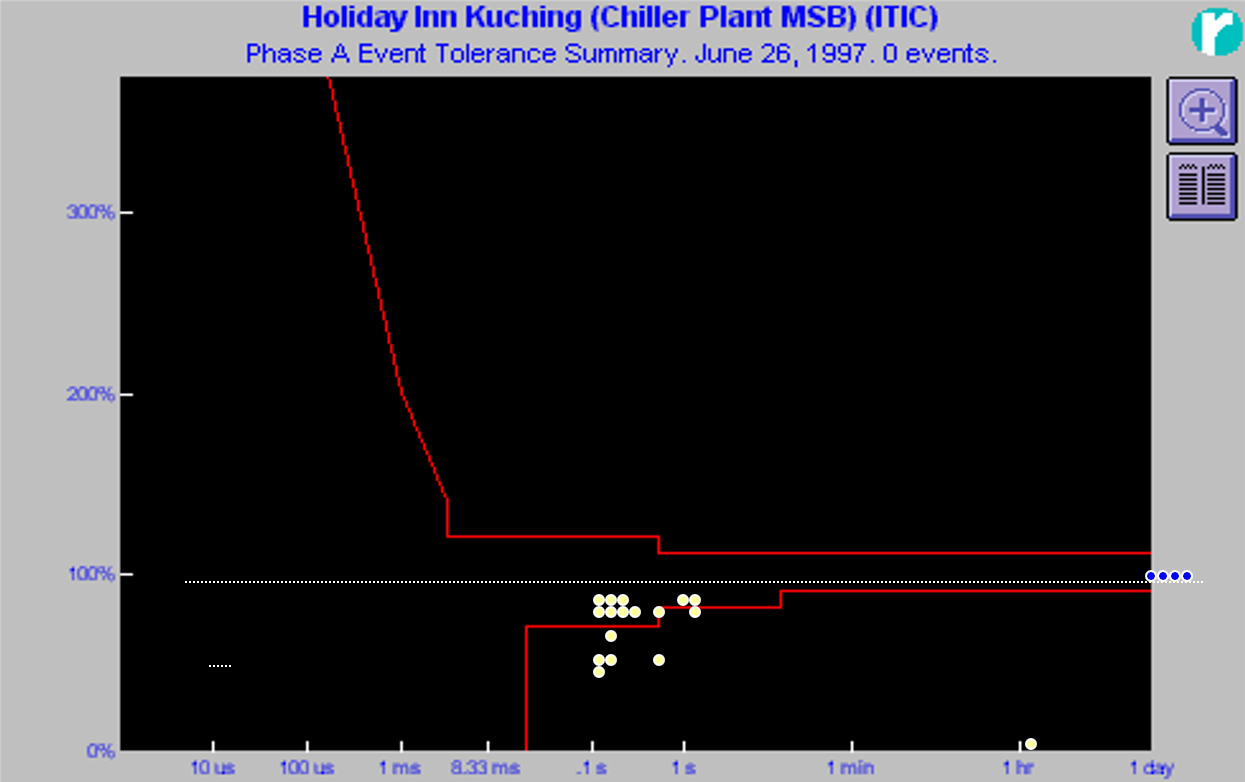
General ITIC curve (1997)
11 kVA CBEMA PQIncidentsTM
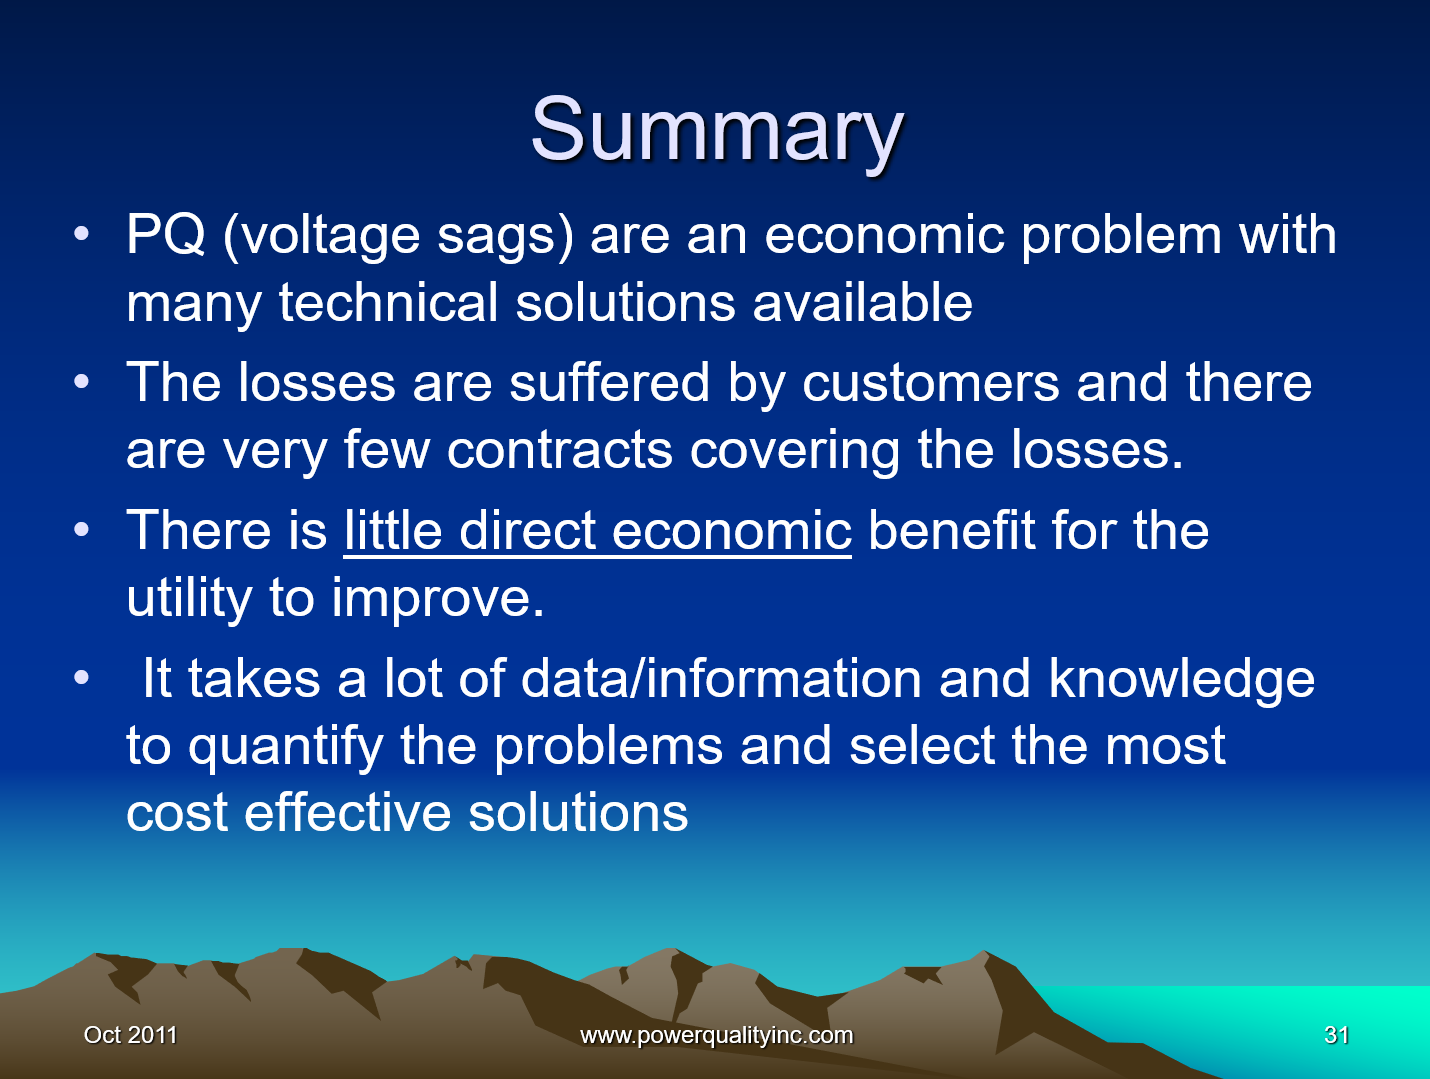
Summary
Please feel free to leave a question in the comments section or contact Terry Chandler, terryc@powerquality.org, terryc@powerquality.co.th
Published by Terry Chandler, Director of Engineering, Power Quality Thailand LTD/Power Quality Inc., USA.
E-mail: terryc@powerquality.org, terryc@powerquality.co.th


Please feel free to leave a question in the comments section or contact Terry Chandler, terryc@powerquality.org, terryc@powerquality.co.th

New Portable Power Logger + PQ Detector!
Introducing DranXperT – a new portable, low cost, power logger and PQ detector from Dranetz.
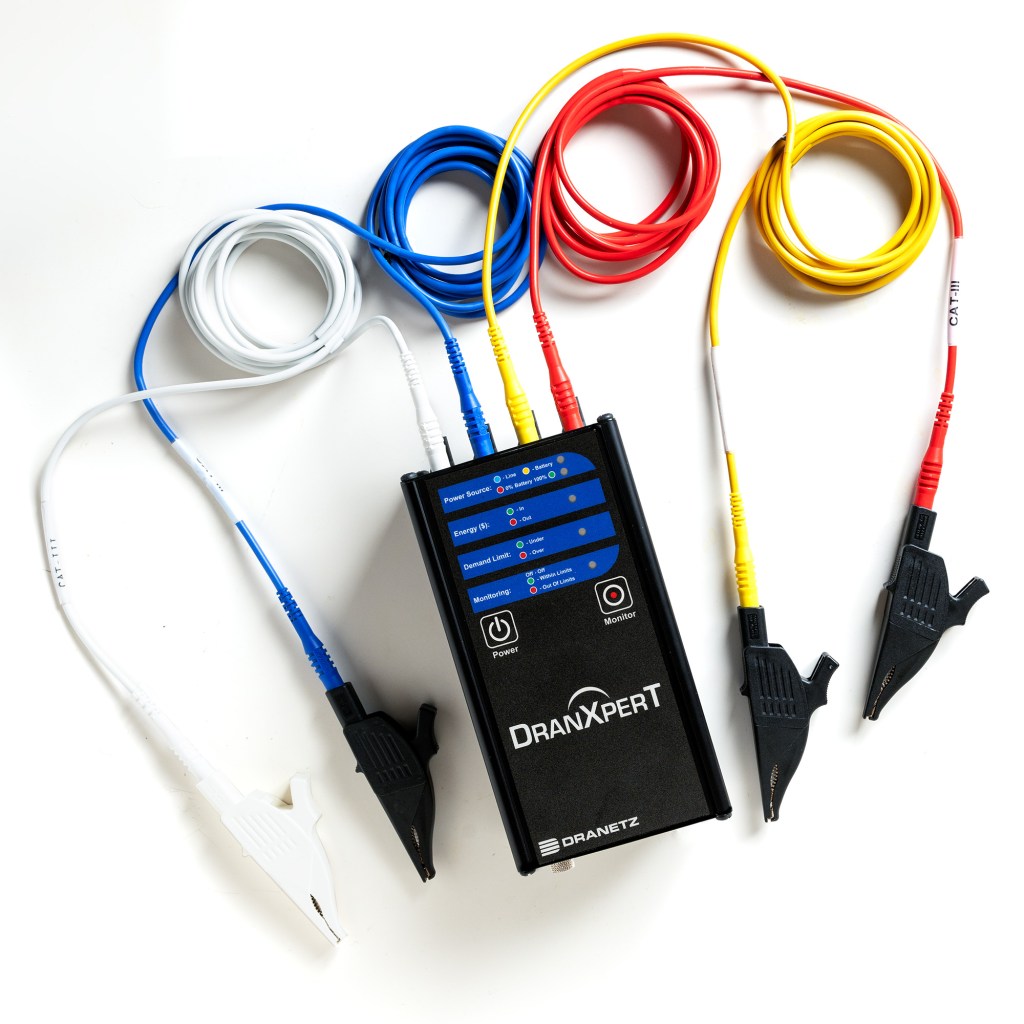
DranXperT is two products in one:
DranXperT measures all of the power parameters that you expect, such as W, VA, VAR, PF, Demand and Energy. Being a bidirectional power meter, direction of power flow is also measured for use in DER/alternative energy applications. Being a Dranetz, DranXperT’s measurements are second to none and also include PQ monitoring capabilities. PQ problems, such as sags/dips, swells, interruptions can be detected with IEC 61000-4-30 1/2 cycle resolution and harmonics are computed using the techniques of IEEE 519-2014/IEC 61000-4-7.
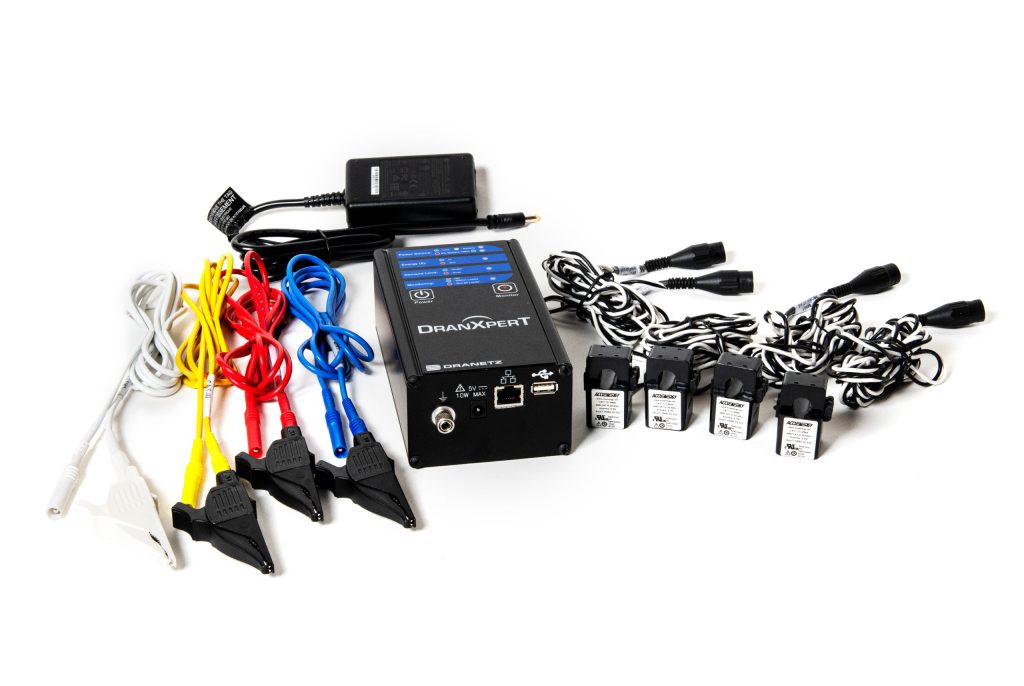
DranXperT includes free, unlicensed Dran-View XP software, a web browser user interface, and strong remote communications for use in virtually any portable, or temporary power monitoring application. Connect your computer directly to DranXperT using the supplied Ethernet cable, or to any local/private/corporate network, and even the Internet for remote communications. All that you need is a web browser on any PC, tablet or Smartphone to configure the meter for recording and for real time data review. Data is easily transferred for analysis to your PC via a USB drive or by downloading using your web browser.
No other product at this price point can achieve this high level of capability – a complete bi-directional energy/power meter AND the PQ monitoring capabilities that you expect from a Dranetz.
FEATURES
SPECIFICATIONS
General
Measurement Inputs
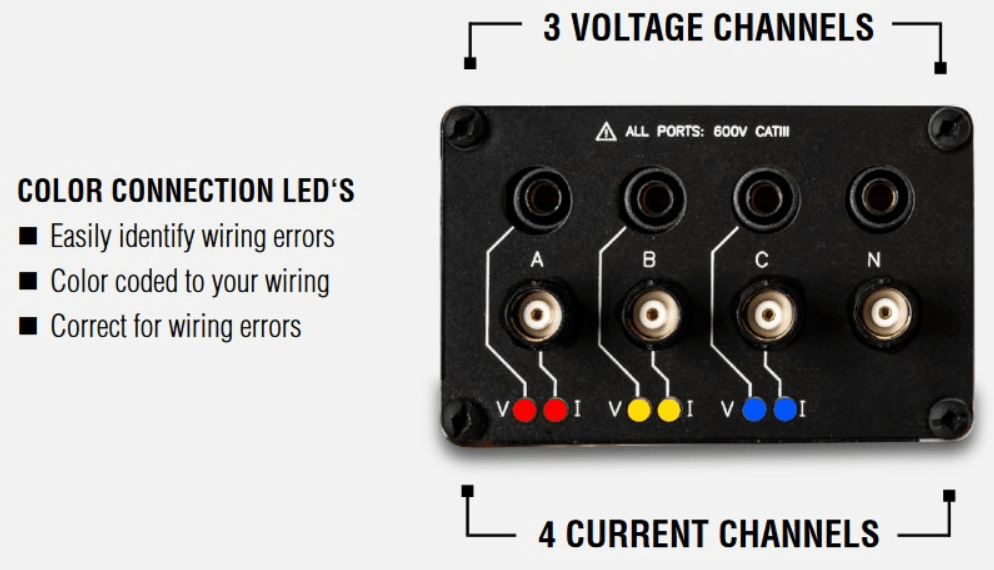
| Voltage | Range: 90 to 600Vrms CATIII Accuracy: 90 Vrms to 600Vrms = ±0.1%, <90 Vrms = 0.5% Connections: 4 safety banana voltage inputs – 3 phase voltage and 1 neutral/reference |
| Current | Input: 0.333 Vrms full scale Accuracy: ±0.1% + probe Connections: BNC |
| Frequency | Range: 50Hz = 45Hz to 55Hz, 60Hz = 55Hz to 65Hz Accuracy: 50/60Hz: ±0.001Hz |
Energy Parameters (probe dependent)
Power Parameters (probe dependent)
Power Quality
Types of Connections
Instrument Power
| Line Power Supply | Range: 90 to 264 VAC, 47 to 63Hz Consumption: 15W max Line cords/plugs: Localized – country dependent. US, EU, UK, Australia available |
| Internal Battery | Rechargeable lithium Ion battery pack (UL recognized) Run time: 7 hours (typical) Charge time: 15 hours (typical) |
Communication Interfaces
Enclosure & Mechanical
| Mechanical | Weight: 1.4 lb. (0.64Kg) Dimensions: 3.5” Width x 2.2” Height x 7.4” Length (6.4 cm x 8.9 cm x 18.8cm) Material: Aluminum Ingress protection rating: IP50 (vertical position) |
| Environmental | Storage Temperature: 5 to 131 °F (-15 to +55 °C) Operating Temperature: 32 to 113 °F (0 to +45 °C) Humidity: 5% to 95% non-condensing Altitude: 6560 ft (2000m) maximum (per EN61010-1 |
Safety
| UL | EN 61010-1 Mains supply: Installation Category II, Pollution Degree 2 Measurement Inputs: Installation Category III, Pollution Degree |
| CE | EN 61326 CISPR 11 EN 61000-4-2, EN 61000-4-3, EN 61000-4-4, EN 61000-4-5, EN 61000-4-6 |
Optional Hinged CT’s – 600V CAT III, Freq range: 50 – 1Khz
CT-H-5A: 5A, 0.5%, hinged split core, 0.4″ window
CT-H-20A: 20A, 0.5%, hinged split core, 0.4″ window
CT-H-50A: 50A, 0.5%, hinged split core, 0.4″ window
CT-H-100A: 100A, 0.5%, hinged split core, 1.0″ window
CT-H-600A: 600A, 0.5%, hinged split core, 1.38″ window
Notes


Applications
| Any local or remote power monitoring | Energy audits Demand side management Basic PQ surveys NEC 220.87 load monitoring Check metering Sub metering Tenant metering Alternative energy production & DER integration Energy cost allocation Load profiling Power factor studies Residential applications including energy usage & PQ detection |
| Industries include, but are not limited | Utility Commercial Industrial Manufacturing Electrical contractors Property management & real estate Petrochemical Hospital & healthcare Rental companies |
If you require any further information, feel free to leave a question in the comments section or contact info@powerquality.co.th
