Published by
- Christopher J. Melhorn, Electrotek Concepts, Inc. Knoxville, Tennessee
- Mark F. McGranaghan, Electrotek Concepts, Inc. Knoxville, Tennessee
ABSTRACT
This paper describes advances in power quality monitoring equipment and software tools for analyzing power quality measurement results. Power quality monitoring has advanced from strictly problem solving to ongoing monitoring of system performance. The increased amount of data being collected requires more advanced analysis tools. Types of power quality variations are described and the methods of characterizing each type with measurements are presented. Finally, methods for summarizing the information and presenting it in useful report format are described.
INTRODUCTION
Power quality has become an important concern for utility, facility, and consulting engineers in recent years. End use equipment is more sensitive to disturbances that arise both on the supplying power system and within the customer facilities. Also, this equipment is more interconnected in networks and industrial processes so that the impacts of a problem with any piece of equipment are much more severe.
The increased concern for power quality has resulted in significant advances in monitoring equipment that can be used to characterize disturbances and power quality variations. This paper discusses the types of information that can be obtained from different kinds of monitoring equipment and methods for analyzing and presenting the information in a useful form.
Important objectives for the paper include the following:
- Describe important types of power quality variations.
- Identify categories of monitoring equipment that can be used to measure power quality variations.
- Offer examples of different methods for presenting the results of power quality measurements.
- Describe tools for analyzing and presenting the power quality measurement results.
Analysis tools for processing measurement data will be described. These tools can present the information as individual events (disturbance waveforms), trends, or statistical summaries. By comparing events with libraries of typical power quality variation characteristics and correlating with system events (e.g. capacitor switching), causes of the variations can be determined. In the same manner, the measured data should be correlated with impacts to help characterize the sensitivity of end use equipment to power quality variations. This will help identify equipment that requires power conditioning and provide specifications for the protection that can be developed based on the power quality variation characteristics.
CATEGORIES OF POWER QUALITY VARIATIONS
It is important to first understand the kinds of power quality variations that can cause problems with sensitive loads. Categories for these variations must be developed with a consistent set of definitions so that measurement equipment can be designed in a consistent manner and so that information can be shared between different groups performing measurements and evaluations. An IEEE Working Group has been developing a consistent set of definitions that can be used for coordination of measurements.[1]
Power quality variations fall into two basic categories:
- Disturbances. Disturbances are measured by triggering on an abnormality in the voltage or the current. Transient voltages may be detected when the peak magnitude exceeds a specified threshold. RMS voltage variations (e.g. sags or interruptions) may be detected when the RMS variation exceeds a specified level.
- Steady State Variations. These include normal RMS voltage variations and harmonic distortion. These variations must be measured by sampling the voltage and/or current over time. The information is best presented as a trend of the quantity (e.g. voltage distortion) over time and then analyzed using statistical methods (e.g. average distortion level, 95% probability of not being exceeded, etc.).
In the past, measurement equipment has been designed to handle either the disturbances (e.g. disturbance analyzers) or steady state variations (e.g. voltage recorders, harmonics monitors). With advances in processing capability, new instruments have become available that can characterize the full range of power quality variations. The new challenge involves characterizing all the data in a convenient form so that it can be used to help identify and solve problems.
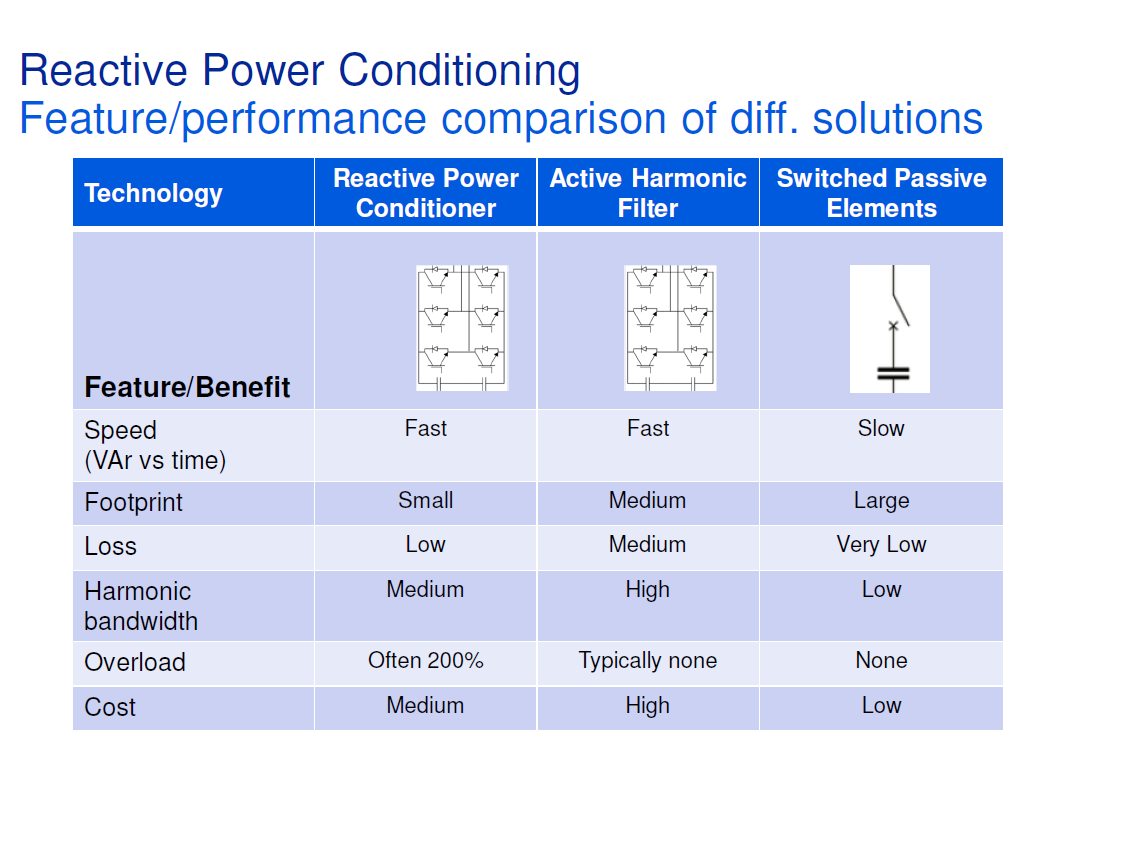
Table 1 summarizes the different categories and lists possible causes and power conditioning equipment solutions for each category.
Table 1. Summary of Power Quality Variation Categories
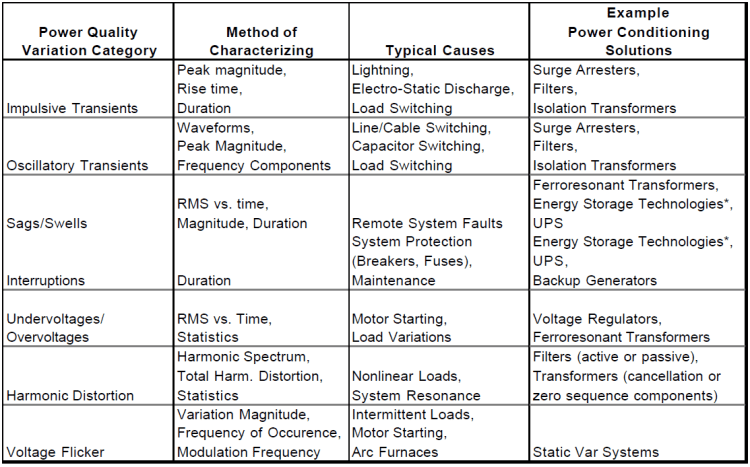
* Note: Energy Storage Technologies refers to a variety of alternative energy storage technologies that can be used for standby supply as part of power conditioning (e.g. superconducting magnetic energy storage, capacitors, flywheels, batteries)
Steady State Voltage Characteristics
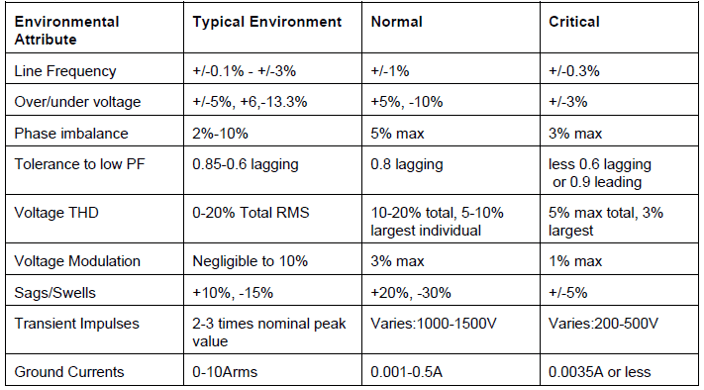
There is no such thing as steady state on the power system. Loads are continually changing and the power system is continually adjusting to these changes. All of these changes and adjustments result in voltage variations that are referred to as long duration voltage variations. These can be undervoltages or overvoltages, depending on the specific circuit conditions. Characteristics of the steady state voltage are best expressed with long duration profiles and statistics. Important characteristics include the voltage magnitude and unbalance. Harmonic distortion is also a characteristic of the steady state voltage, but this characteristic is treated separately because it does not involve variations in the fundamental frequency component of the voltage. Most end use equipment is not very sensitive to these voltage variations, as long as they are within reasonable limits. ANSI C84.1 [7] specifies the steady state voltage tolerances for both magnitudes and unbalance expected on a power system. Long duration variations are considered to be present when the limits are exceeded for greater than 1 minute.
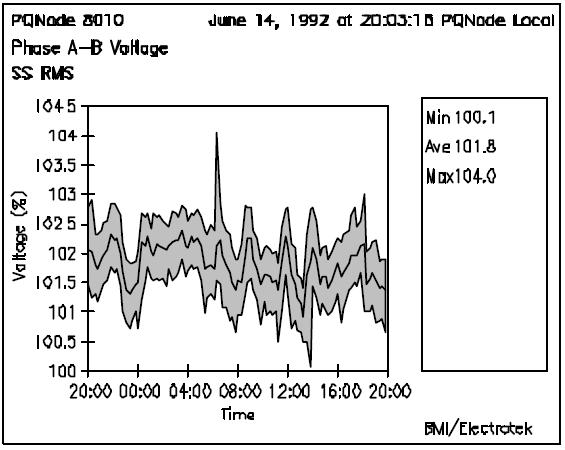
Figure 1. Example 24 hour voltage profile illustrating long duration voltage variations.
Harmonic Distortion
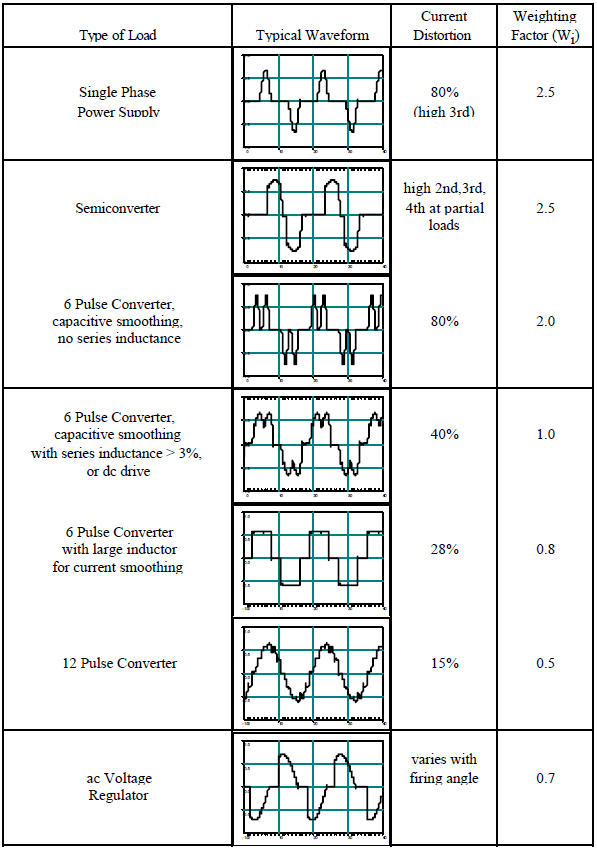
Harmonic distortion of the voltage and current results from the operation of nonlinear loads and devices on the power system. The nonlinear loads that cause harmonics can often be represented as current sources of harmonics. The system voltage appears stiff to individual loads and the loads draw distorted current waveforms. Table 2 illustrates some example current waveforms for different types of nonlinear loads. The weighting factors indicated in the table are being proposed in the Guide for Applying Harmonic Limits on the Power System (Draft 2)[2] for preliminary evaluation of harmonic producing loads in a facility.
Harmonic voltage distortion results from the interaction of these harmonic currents with the system impedance. The harmonic standard, IEEE 519-1992 [2], has proposed two-way responsibility for controlling harmonic levels on the power system.
- End users must limit the harmonic currents injected onto the power system.
- The power supplier will control the harmonic voltage distortion by making sure system resonant conditions do not cause excessive magnification of the harmonic levels.
Harmonic distortion levels can be characterized by the complete harmonic spectrum with magnitudes and phase angles of each individual harmonic component. It is also common to use a single quantity, the Total Harmonic Distortion, as a measure of the magnitude of harmonic distortion. For currents, the distortion values must be referred to a constant base (e.g. the rated load current or demand current) rather than the fundamental component. This provides a constant reference while the fundamental can vary over a wide range.
Table 2. Example current waveforms for various nonlinear loads.
Harmonic distortion is a characteristic of the steady state voltage and current. It is not a disturbance. Therefore, characterizing harmonic distortion levels is accomplished with profiles of the harmonic distortion over time (e.g. 24 hours) and statistics. Figure 2 illustrates a typical profile of harmonic voltage distortion on a feeder circuit over a one month period.
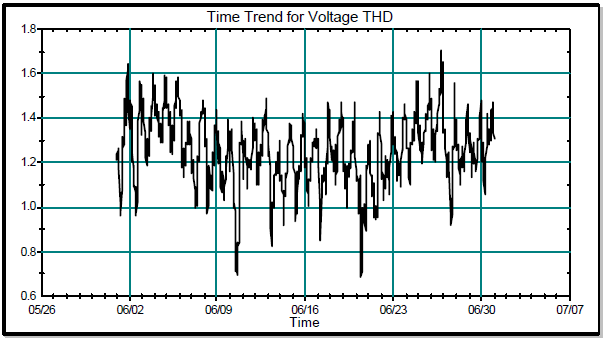
Figure 2. Example Profile of Harmonic Voltage Distortion on a Distribution Feeder Circuit.
Transients
The term transients is normally used to refer to fast changes in the system voltage or current. Transients are disturbances, rather than steady state variations such as harmonic distortion or voltage unbalance. Disturbances can be measured by triggering on the abnormality involved. For transients, this could be the peak magnitude, the rate of rise, or just the change in the waveform from one cycle to the next. Transients can be divided into two sub-categories, impulsive transients and oscillatory transients, depending on the characteristics.
Transients are normally characterized by the actual waveform, although summary descriptors can also be developed (peak magnitude, primary frequency, rate-ofrise, etc.). Figure 3 gives a capacitor switching transient waveform. This is one of the most important transients that is initiated on the utility supply system and can affect the operation of end user equipment.
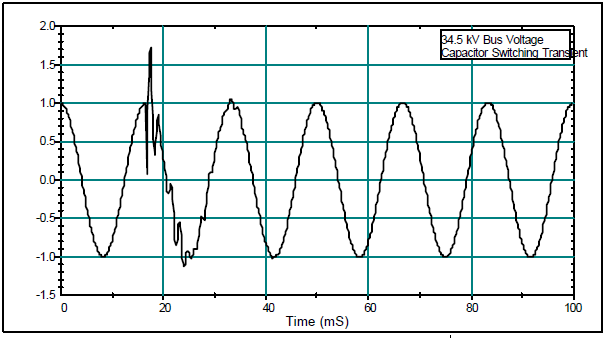
Figure 3. Capacitor Switching Transient.
Transient problems are solved by controlling the transient at the source, changing the characteristics of the system affecting the transient or by protecting equipment so that it is not impacted. For instance, capacitor switching transients can be controlled at the source by closing the breaker contacts close to a voltage zero crossing. Magnification of the transient can be avoided by not using low voltage capacitors within the end user facilities. The actual equipment can be protected with filters or surge arresters.
Short Duration Voltage Variations
Short duration voltage variations include variations in the fundamental frequency voltage that last less than one minute. These variations are best characterized by plots of the RMS voltage vs. time but it is often sufficient to describe them by a voltage magnitude and a duration that the voltage is outside of specified thresholds. It is usually not necessary to have detailed waveform plots since the RMS voltage magnitude is of primary interest.
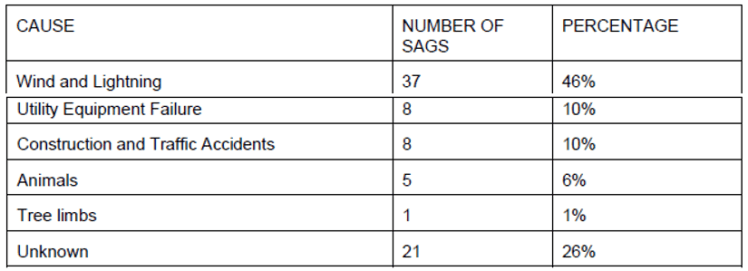
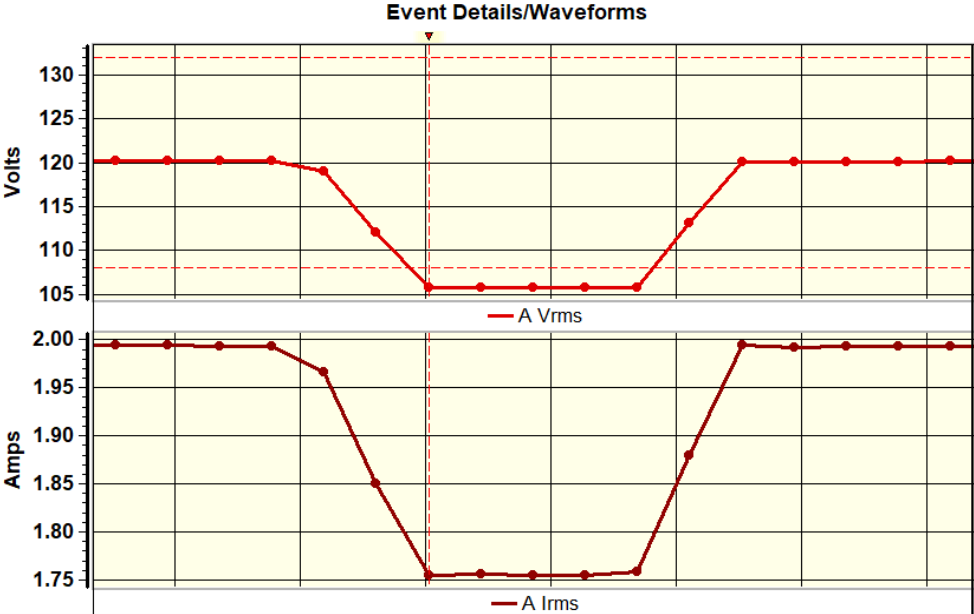
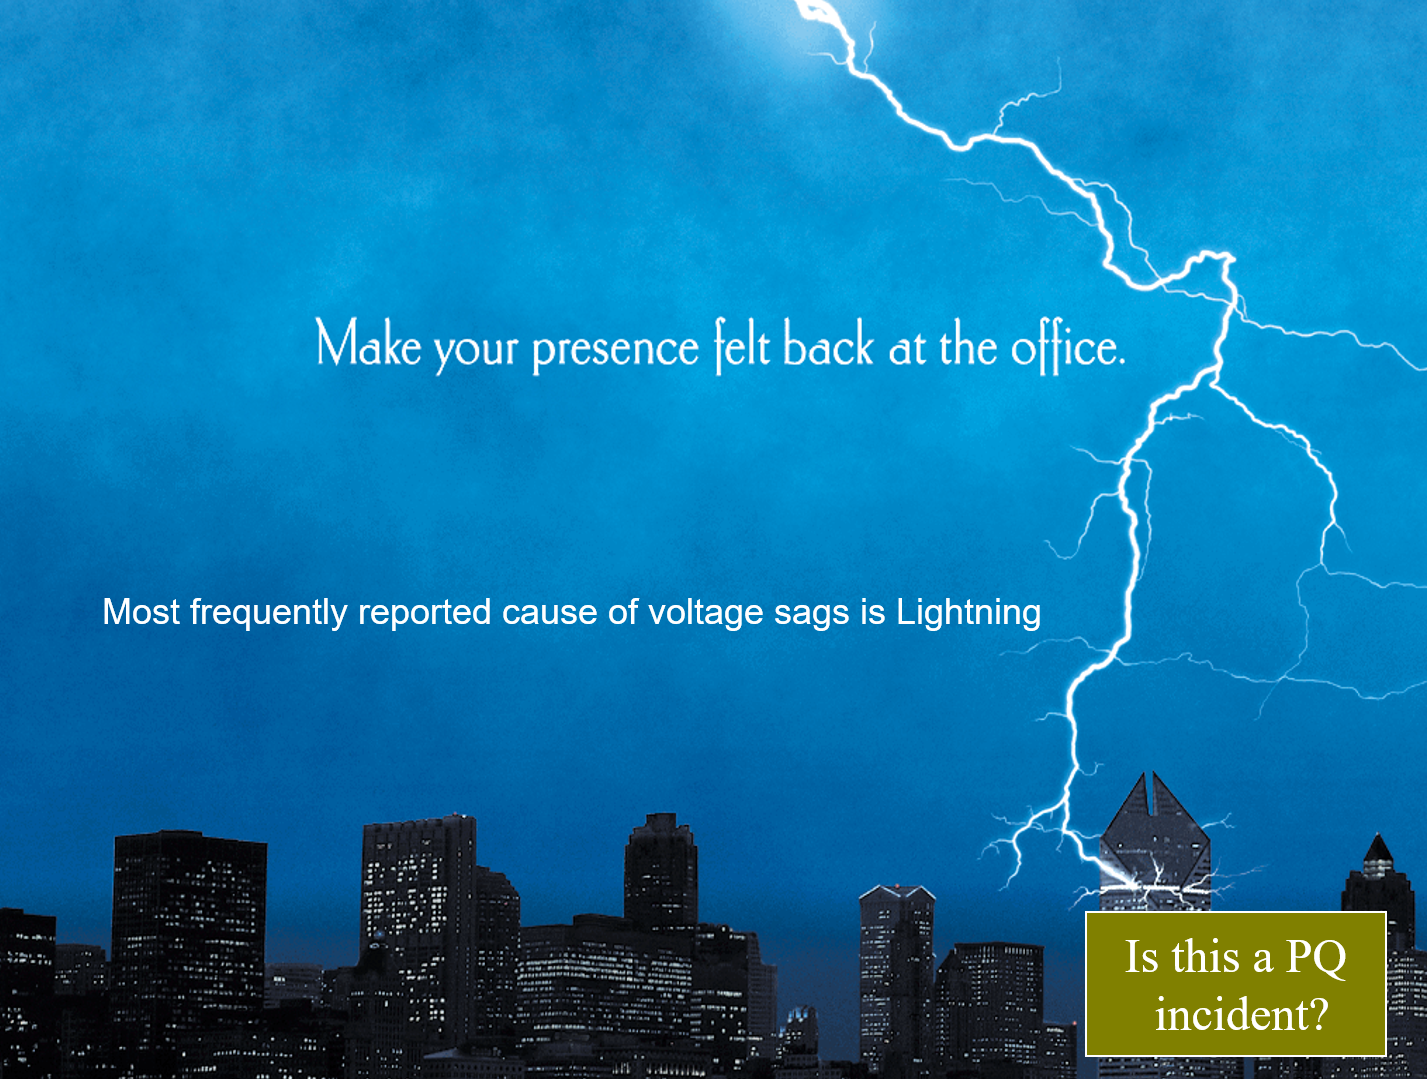
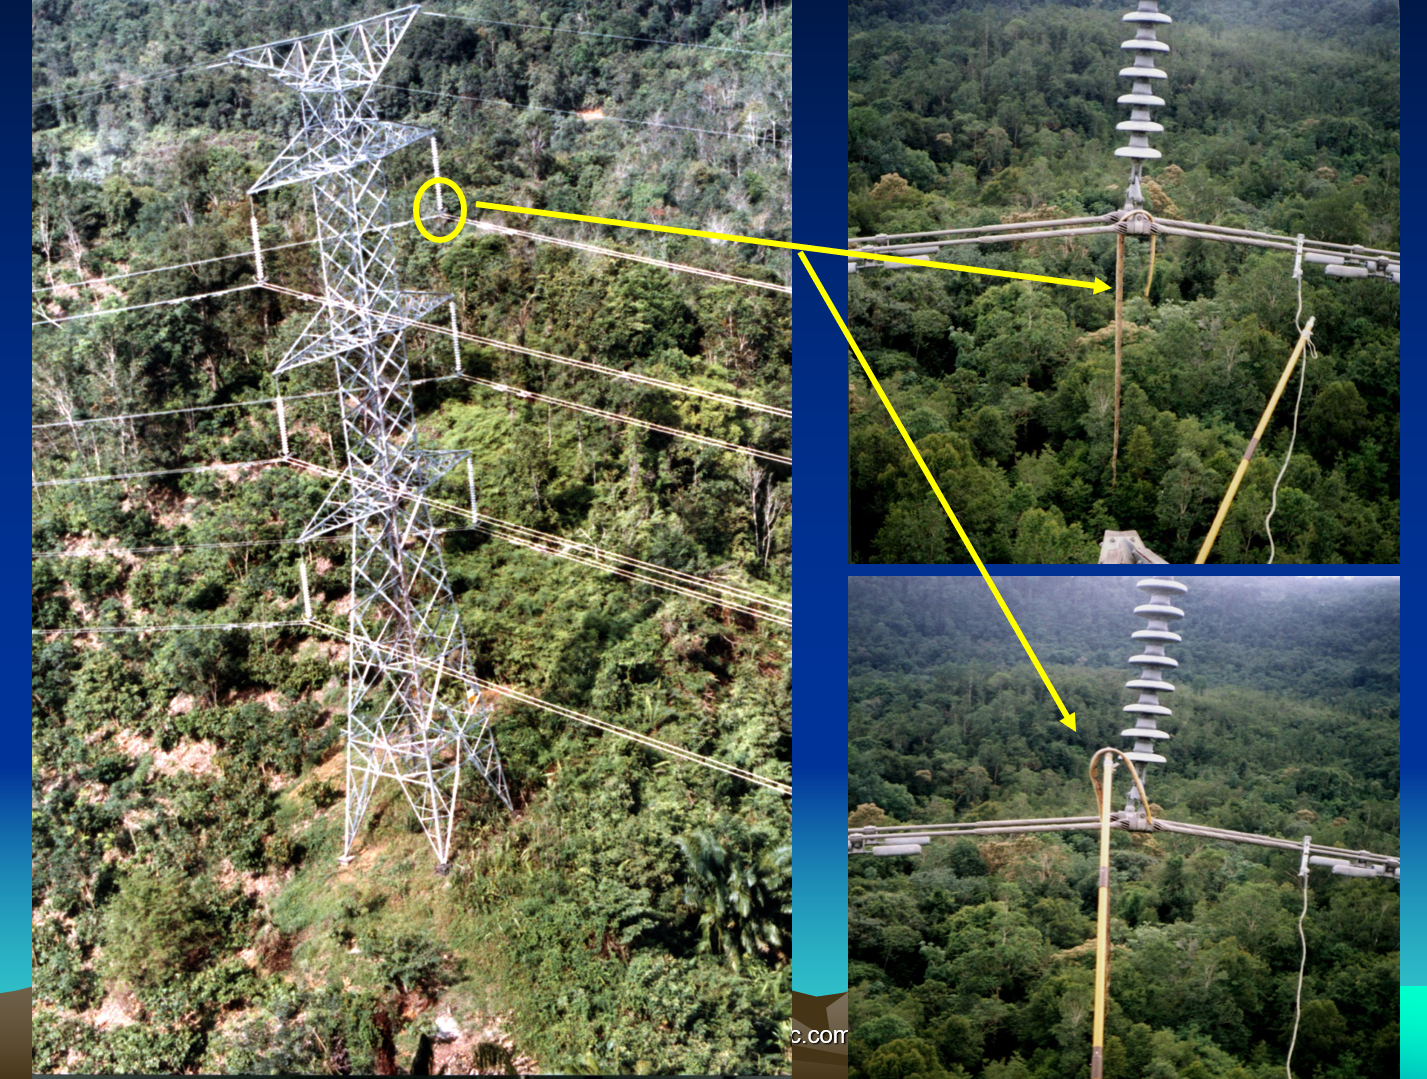
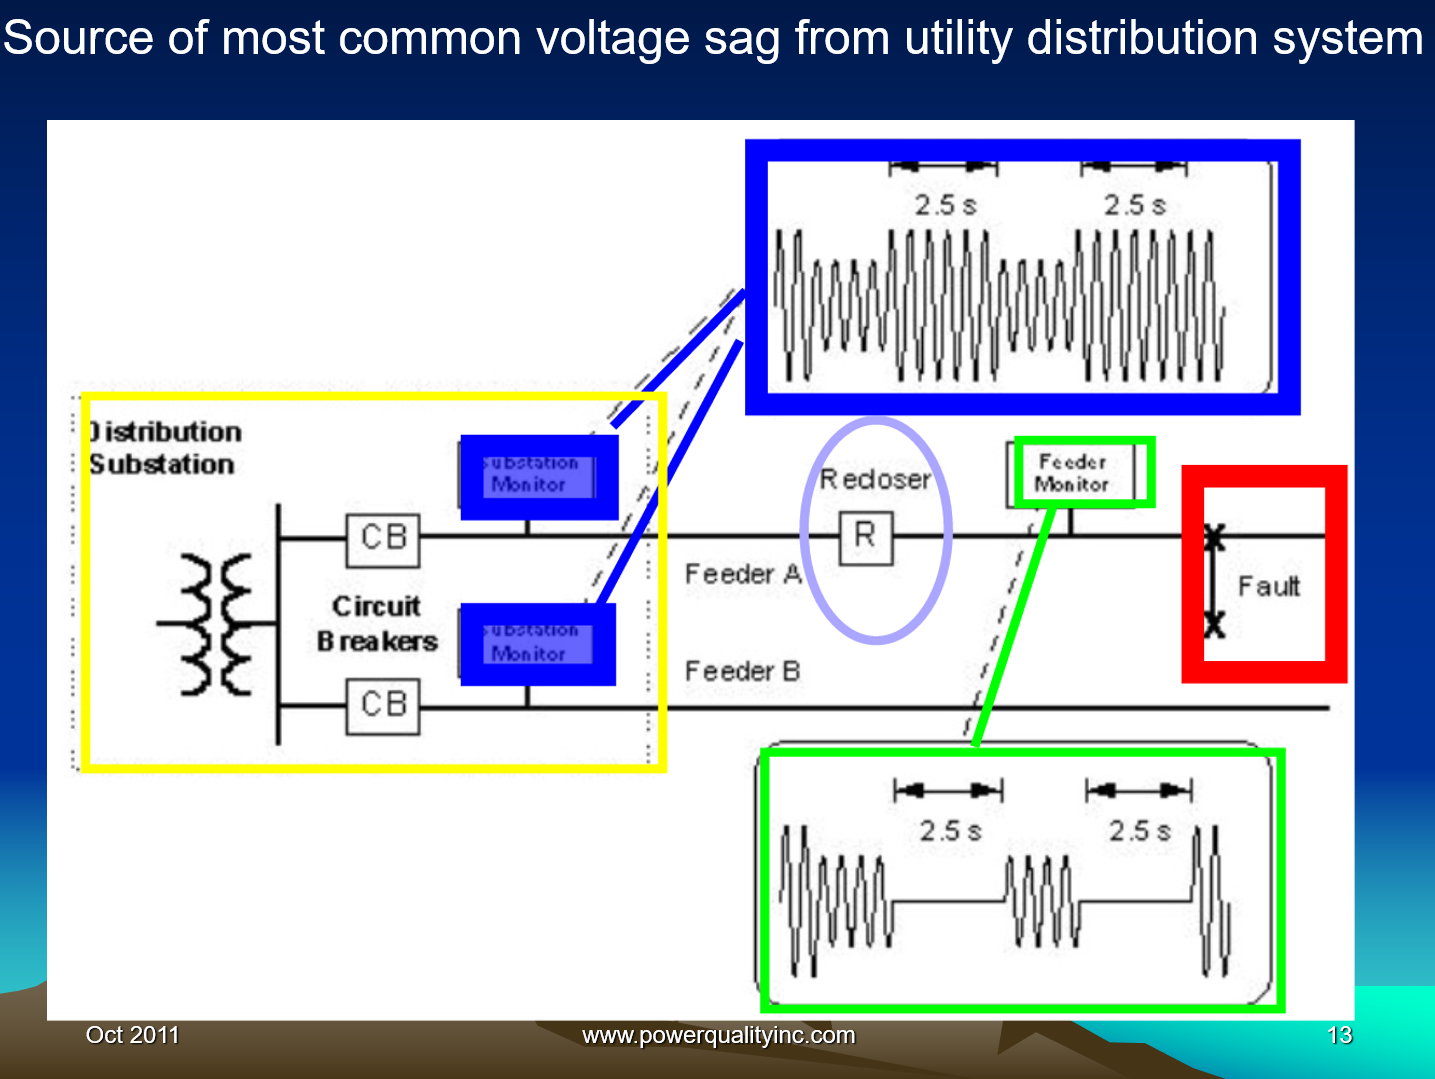
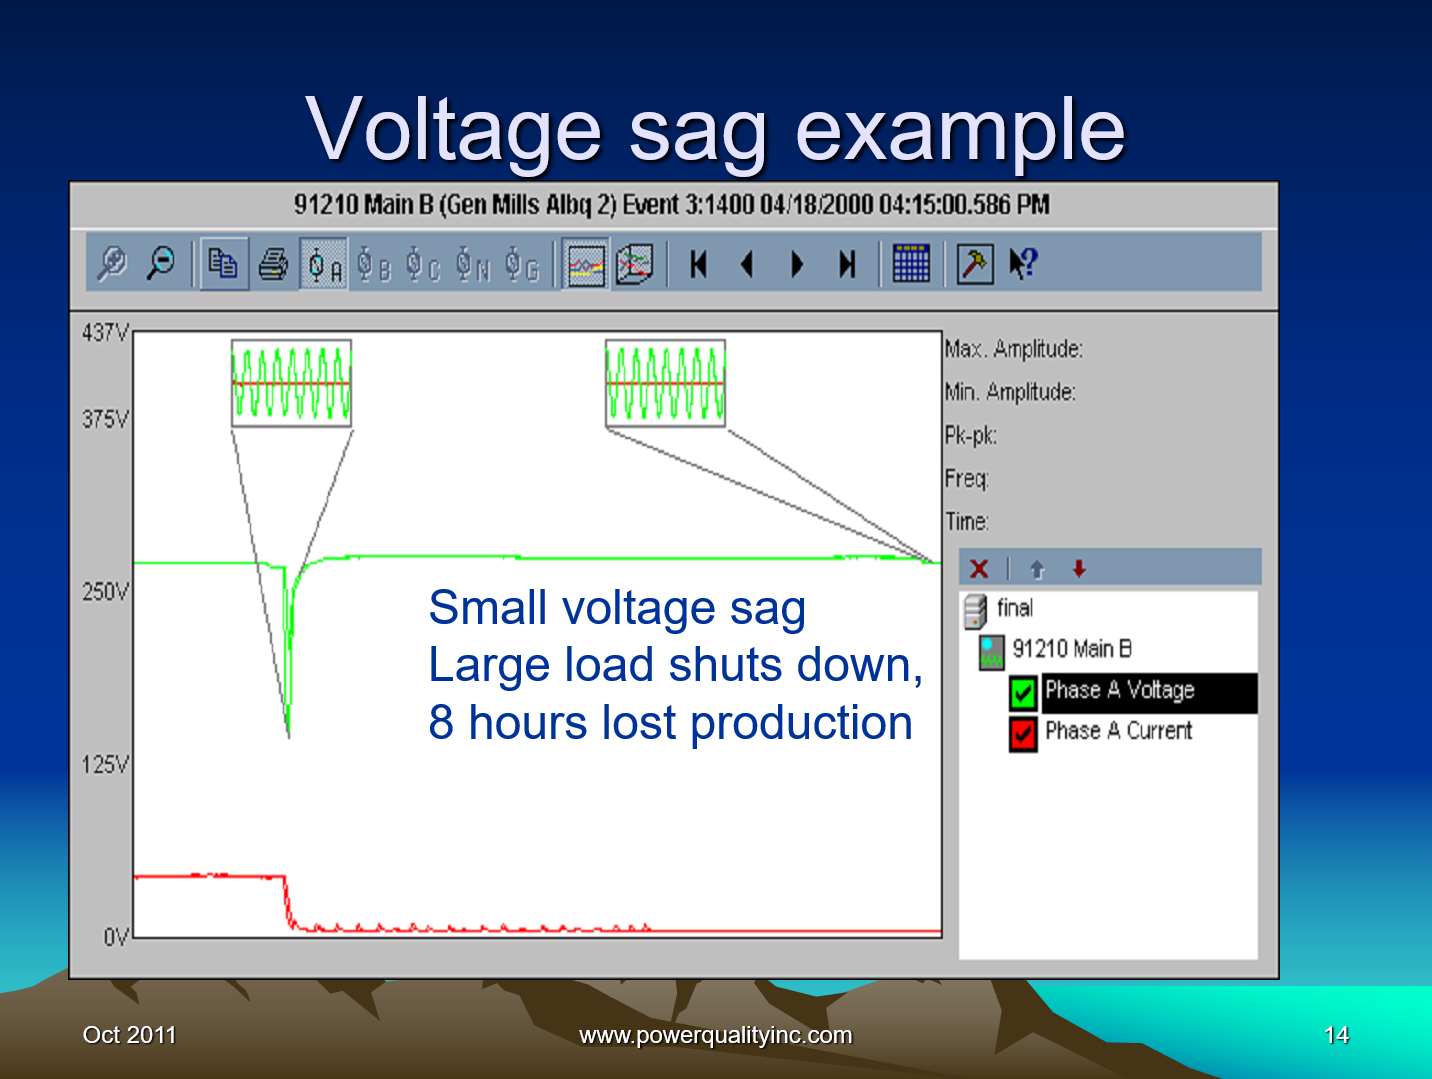
The voltage variations can be a momentary low voltage (voltage sag), high voltage (voltage swell), or loss of voltage (interruption). Interruptions are the most severe in terms of their impacts on end users but voltage sags can be more important because they may occur much more frequently. A fault condition can cause a momentary voltage sag over a wide portion of the system even though no end users may experience an interruption. This is true for most transmission faults. Figure 4 is an example of this kind of event. Many end users have equipment that may be sensitive to these kinds of variations. Solving this problem on the utility system may be very expensive so manufacturers are developing ride through technologies with energy storage to handle these voltage variations on the end user side.
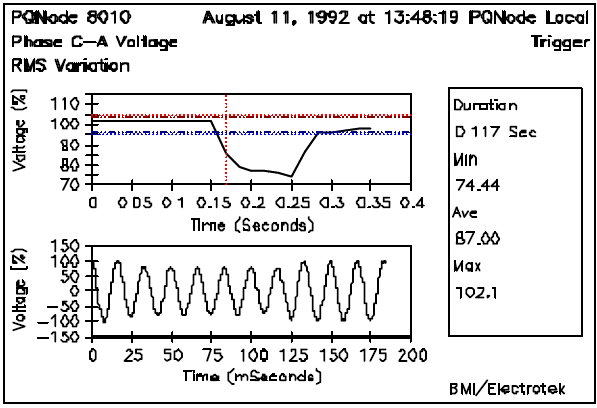
Figure 4. Voltage Sag Caused by a Remote Fault Condition.
TYPES OF EQUIPMENT FOR MONITORING POWER QUALITY Multimeters or DMMs
After initial tests of wiring integrity, it may also be necessary to make quick checks of the voltage and/or current levels within a facility. Overloading of circuits, under- and over-voltage problems, and unbalances between circuits can be detected in this manner. These measurements just require a simple multimeter. Signals to check include:
- phase-to-ground voltages
- phase-to-neutral voltages
- neutral-to-ground voltages
- phase-to-phase voltages (three phase system)
- phase currents
- neutral currents
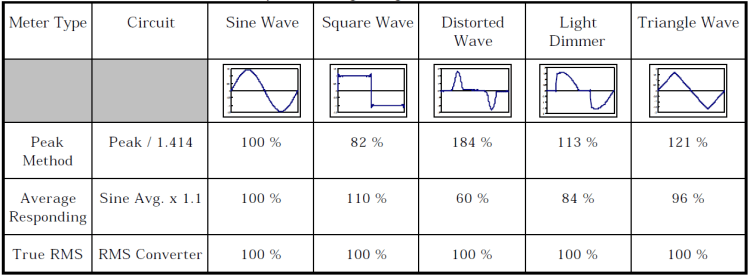
The most important factor to consider when selecting and using a multimeter is the method of calculation used in the meter. All of the commonly used meters are calibrated to give an RMS indication for the measured signal. However, a number of different methods are used to calculate the RMS value. The three most common methods are:
- Peak Method. The meter reads the peak of the signal and divides the result by 1.414 (square root of 2) to obtain the RMS.
- Averaging Method. The meter determines the average value of a rectified signal. For a clean sinusoidal signal, this average value is related to the RMS value by the constant, k=1.1. This value k is used to scale all waveforms measured.
- True RMS. The RMS value of a signal is a measure of the heating which will result if the voltage is impressed across a resistive load. One method of detecting the true RMS value is to actually use a thermal detector to measure a heating value. More modern digital meters use a digital calculation of the RMS value by squaring the signal on a sample by sample basis, averaging over a period, and then taking the square root of the result.
These different methods all give the same result for a clean, sinusoidal signal but can give significantly different answers for distorted signals. This is very important because significant distortion levels are quite common, especially for the phase and neutral currents within the facility. Table 3 can be used to better illustrate this point. Each waveform in Table 3 has an RMS value of 1.0 pu (100.0%). The corresponding measured value for each type of meter is displayed under the associated waveforms, per-unitized to the 1.0 pu RMS value.
Table 3. Methods for Measuring Voltages and Currents with Multi-Meters.
Oscilloscopes
An oscilloscope is valuable when performing real time tests. Looking at the voltage and current waveforms can tell a lot about what is going on, even without performing detailed harmonic analysis on the waveforms. You can get the magnitudes of the voltages and currents, look for obvious distortion, and detect any major variations in the signals.
There are numerous makes and models of oscilloscopes to choose from. A digital oscilloscope with data storage is valuable because the waveform can be saved and analyzed. Oscilloscopes in this category often have waveform analysis capability (energy calculation, spectrum analysis) also. In addition, the digital oscilloscopes can usually be obtained with communications so that waveform data can be uploaded to a PC for additional analysis with a software package.
Disturbance Analyzers
Disturbance analyzers and disturbance monitors form a category of instruments which have been developed specifically for power quality measurements. They typically can measure a wide variety of system disturbances from very short duration transient voltages to long duration outages or under-voltages. Thresholds can be set and the instruments left unattended to record disturbances over a period of time. The information is most commonly recorded on a paper tape but many devices have attachments so that it can be recorded on disk as well.
There are basically two categories of these devices:
Conventional analyzers that summarize events with specific information such as over/under voltage magnitudes, sags/surge magnitude and duration, transient magnitude, and duration, etc.
Graphics-Based analyzers that save and print the actual waveform along with the descriptive information which would be generated by one of the conventional analyzers.
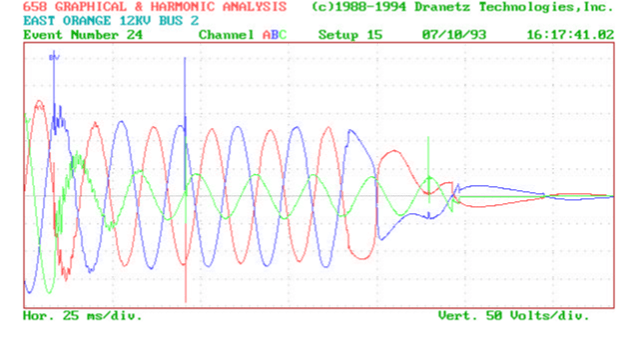
It is often difficult to determine the characteristics of a disturbance or a transient from the summary information available from conventional disturbance analyzers. For instance, an oscillatory transient cannot be effectively described by a peak and a duration. Therefore, it is almost imperative to have the waveform capture capability in a disturbance analyzer for detailed analysis of a power quality problem (Figure 5). However, a simple conventional disturbance monitor can be valuable for initial checks at a problem location.
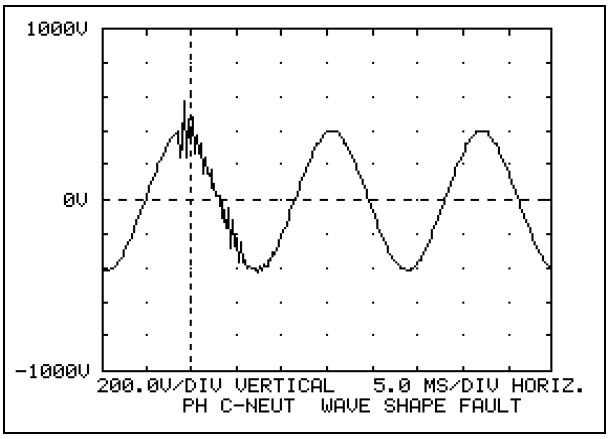
Figure 5. Graphics Based Analyzer Output
Spectrum Analyzers and Harmonic Analyzers
Many instruments and on line monitoring equipment now include the capability to sample waveforms and perform FFT calculations. The capabilities of these instruments vary widely and the user must be careful that the accuracy and information obtained is adequate for the investigation. The following are some basic requirements for harmonic measurements used to investigate a problem:
- Capability to measure both voltage and current simultaneously so that harmonic power flow information can be obtained.
- Capability to measure both magnitude and phase angle of individual harmonic components (also needed for power flow calculations).
- Synchronization and a high enough sampling rate for accurate measurement of harmonic components up to at least the 37th harmonic (this requirement is a combination of a high sampling rate and a sampling interval based on the 60 Hz fundamental).
- Capability to characterize the statistical nature of harmonic distortion levels (harmonics levels change with changing load conditions and changing system conditions).
Harmonic distortion is a continuous phenomena. It can be characterized at a point in time by the frequency spectrums of the voltages and currents. However, for proper representation, measurements over a period of time must be made and the statistical characteristics of the harmonic components and the total distortion determined.
Combination Disturbance and Harmonic Analyzers
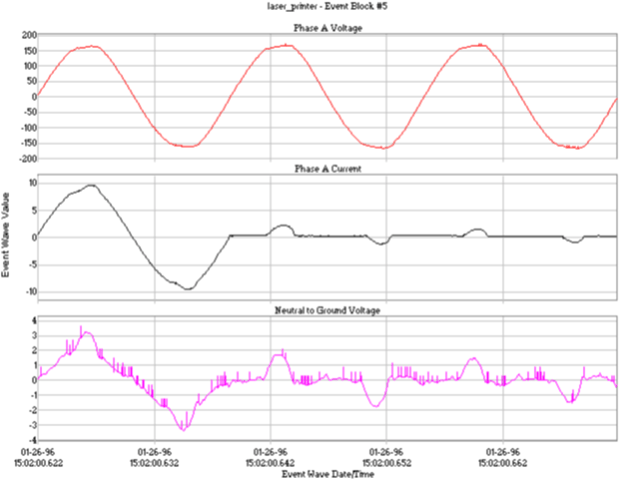
The most recent instruments combine limited harmonic sampling and energy monitoring functions with complete disturbance monitoring functions as well (Figure 6). The output is graphically based, and the data is remotely gathered over phone lines into a central database. Statistical analysis can then be performed on the data. The data is also available for input and manipulation into other programs such as spreadsheets and other graphical output processors.
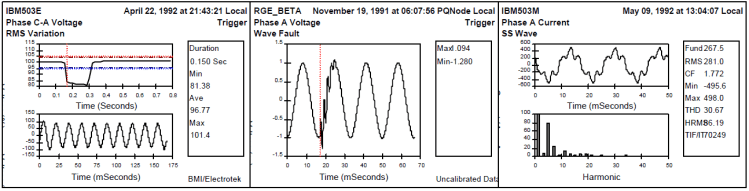
Figure 6. Output from Combination Disturbance and Harmonic Analyzer.
ANALYZING POWER QUALITY MEASUREMENT DATA
Analyzing power quality measurements has become increasingly more sophisticated within the past few years. It is not enough to simply look at RMS quantities of the voltage and current. Disturbances that occur on the power system have durations in the milli-second time frame, equipment is more sensitive to these disturbances, and there is more equipment connected to the power systems that cause disturbances or power quality problems. For these reasons, it is often necessary to continuously monitor system performance and characterize possible impacts of disturbances. The data analysis system must be flexible enough to handle data from a variety of monitoring equipment and maintain a database that can be used by many different applications. The concept is illustrated in Figure 7.
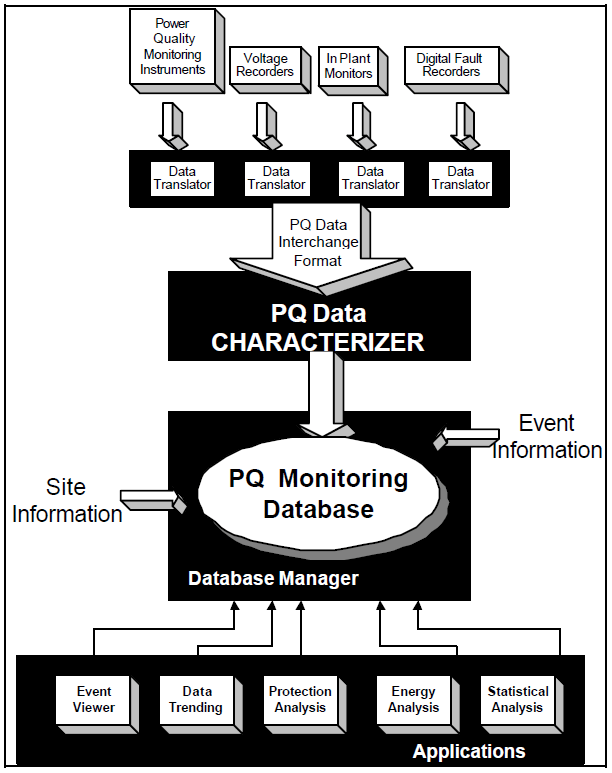
Figure 7. Example Data Analysis System.
Different types of power quality variations require different types of analysis to characterize system performance. Some examples are given in the following sections. With a flexible system, these applications can be customized to individual user needs.
Transients
Transients are normally characterized by the actual waveform, although summary descriptors can also be developed for:
- peak magnitude
- primary frequency
- time of occurrence
- rate of rise
An example of this data in statistical form is presented in Figure 8.
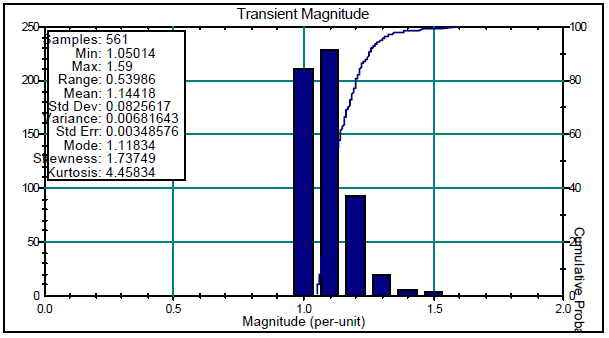
Figure 8. Bar Chart for Transient Peak Voltage.
RMS Variations
RMS variations are generally characterized by the RMS value vs. time or by the minimum magnitude of the voltage during the event vs. the duration of the event. Figure 1 was an illustration of a plot of magnitude vs. Time for a 24 hour period.
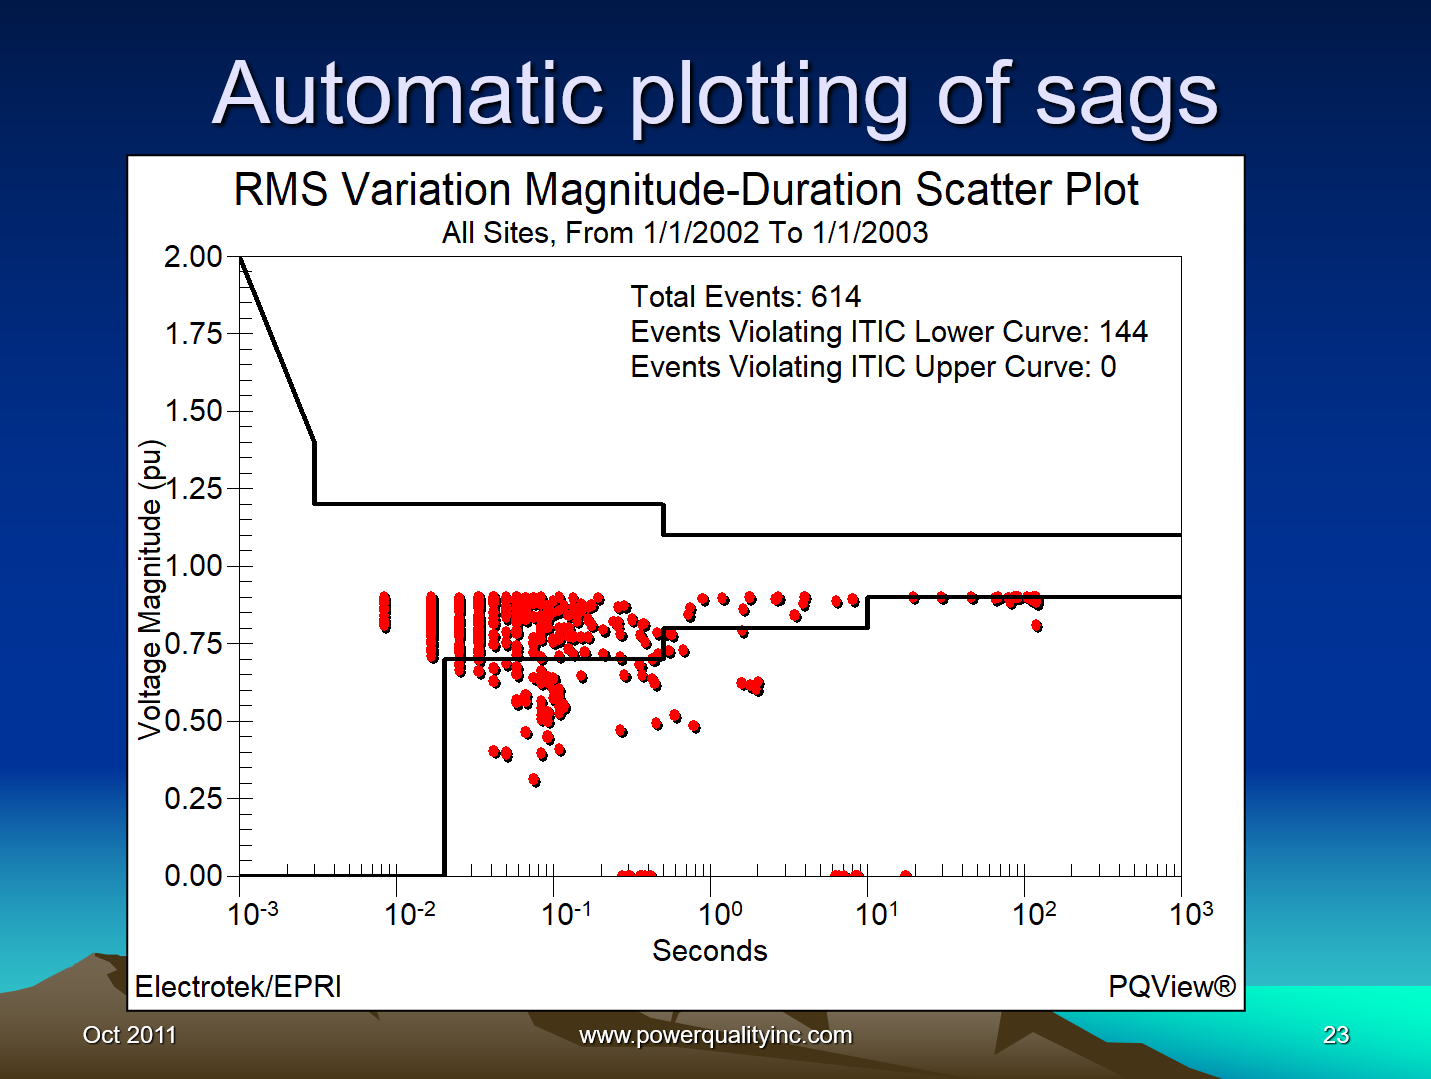
This method is fine for looking at single sites and single events. But when a whole system is involved, either customer or utility, it may be preferable to look at a range of events (e.g. one month, one year, etc.) for multiple sites. This would give an indication as to what type of RMS events are occurring on a given system. The magnitude duration plot in Figure 9 illustrates the minimum voltage (in percent) during the event and the duration of the event (time in cycles that voltage was out of the thresholds).
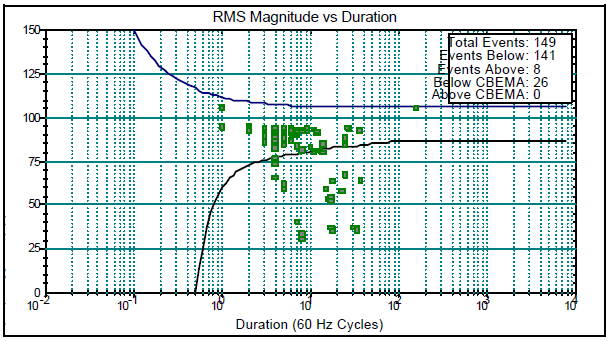
Figure 9. Example Magnitude Duration Plot.
Another method for displaying this type of data is a three-dimensional bar graph where the count, magnitude, and duration is shown. Figure 10 illustrates this type of plot.
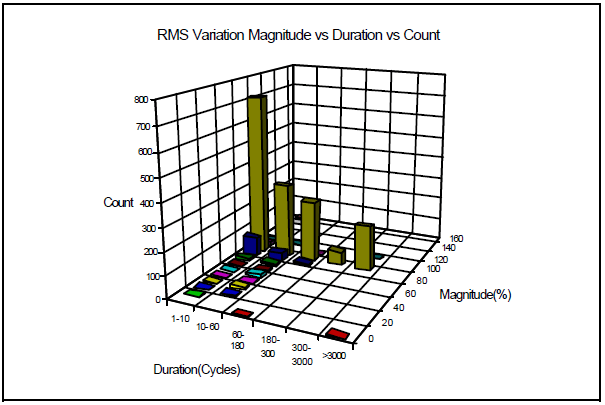
Figure 10. Three-Dimensional RMS Variation Bar Graph.
Harmonics
Harmonics are characterized by individual snapshots of voltage and current with the associated spectrums. It is important to understand that the harmonic distortion levels are always changing and these characteristics cannot be represented with a single snapshot. Therefore, time trends and statistics are needed. An example time trend plot for one month was included in Figure 2. Figure 11 shows the statistics of the harmonic current level. This would be good for comparison with IEEE-519 limits.
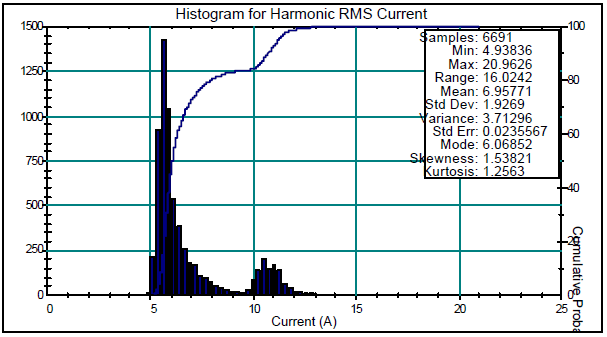
Figure 11. Histogram for Harmonic RMS Current for Approximately Four Months.
SUMMARY
Systematic procedures for evaluating power quality concerns can be developed but they must include all levels of the system, from the transmission system to the end user facilities. Power quality problems show up as impacts within the end user facility but may involve interaction between all levels of the system.
A consistent set of definitions for different types of power quality variations is the starting point for developing evaluation procedures. The definitions permit standardized measurements and evaluations across different systems.
A data analysis system for power quality measurements should be able to process data from a variety of instruments and support a range of applications for processing data. With continuous power quality monitoring, it is very important to be able to summarize variations with time trends and statistics, in addition to characterizing individual events.
Christopher J. Melhorn received an ASE from York College of Pennsylvania in 1986 and a BSEET from the Pennsylvania State University in 1989. Chris has been employed with Electrotek Concepts, Inc. since 1990. His experience at Electrotek includes working with EPRI and utilities on case studies involving power quality issues. He was also extensively involved in the EPRI DPQ project site selection phase. Chris is presently involved in developing new software for the power systems engineering environment and working to increase Electrotek’s industrial based clientele.
Mark F. McGranaghan received a BSEE and an MSEE from the University of Toledo and an MBA from the University of Pittsburgh. Mark serves as Manager of Power Systems Engineering at Electrotek Concepts, Inc., Mark is responsible for a wide range of studies, seminars, and products involving the analysis of power quality concerns. He has worked with electric utilities and end users throughout the country performing case studies to characterize power quality problems and solutions as part of an extensive Electric Power Research Institute (EPRI) project. He has also been involved in the EPRI Distribution Power Quality Monitoring Project which is establishing the baseline power quality characteristics of U.S. distribution systems through a multi-year monitoring effort. Mark was involved in the design and specification of the instrumentation and software for this project.
REFERENCES
- IEEE Working Group P1159, Recommended Practice for Monitoring Electric Power Quality – Draft 7, December, 1994.
- IEEE Std. 519-1992, IEEE Recommended Practices and Requirements for Harmonic Control in Electrical Power Systems, IEEE, New York, 1993.
- “Electrical Power System Compatibility with Industrial Process Equipment – Part 1: Voltage Sags,” Paper by the IEEE Working Group P1346, Proceedings of the Industrial and Commercial Power Systems Conference, 94CH3425-6, May, 1994.
- CENELEC Standard CLC/BTTF 68-6 (Sec) 23, “Voltage Characteristics of Electricity Supplied by Public Distribution Systems,” June, 1993.
- IEC Standard 1000-2-2, “Compatibility Levels for Low Frequency Conducted Disturbances and Signalling in Public Low Voltage Power Supply Systems.”
- IEC Standard 1000-4-7, “General guide on harmonics and interharmonics measurements and instrumentation, for power supply systems and equipment connected thereto.”
- ANSI C84.1-1989, American National Standard for Electric Power Systems and Equipment – Voltage Ratings (60 Hertz).
- M. McGranaghan, D. Mueller, and M. Samotyj, “Voltage Sags in Industrial Plants,” IEEE Transactions on Industry Applications, Vol. 29 No. 2, March/April, 1993.
- L. Conrad, K. Little, and C. Grigg, “Predicting and Preventing Problems Associated with Remote Fault-Clearing Voltage Dips, ” IEEE Transactions
on Industry Applications, vol. 27, pp. 167-172, January, 1991.
- V. Wagner, A. Andreshak, and J. Staniak, “Power Quality and Factory Automation, ” Proceedings of the IAS Annual Meeting, vol. 35, no. 6, pp. 1391-1396.