Published by Dr. Kurt Schipman & Dr. François Delincé , ABB Power Quality Products, Belgium
ABSTRACT
This paper explains the problems that are due to poor Power Quality in electrical systems and shows their possible financial consequences.
Power Quality is characterized by parameters that express harmonic pollution, reactive power, and load unbalance. The best possible solutions to these problems are reviewed and their control systems are elaborated on. Solutions present in the field are explained and field results are presented. It is shown that by using the right technology a variety of Power Quality problems can be solved rendering installations trouble free and more efficient and can render them compliant with even the strictest requirements.
INTRODUCTION
Ideally, the best electrical supply would be a constant magnitude and frequency sinusoidal voltage waveform. However, because of the non-zero impedance of the supply system, of the large variety of loads that may be encountered and of other phenomena such as transients and outages, the reality is often different. The Power Quality of a system expresses to which degree a practical supply system resembles the ideal supply system.
- If the Power Quality of the network is good, then any loads connected to it will run satisfactory and efficiently. Installation running costs and carbon footprint will be minimal.
- If the Power Quality of the network is bad, then loads connected to it will fail or will have a reduced lifetime, and the efficiency of the electrical installation will reduce. Installation running costs and carbon footprint will be high and/or operation may not be possible at all.
In order to characterize the Power Quality, different indices have been defined and will be reviewed later in this article.
COST OF POOR POWER QUALITY
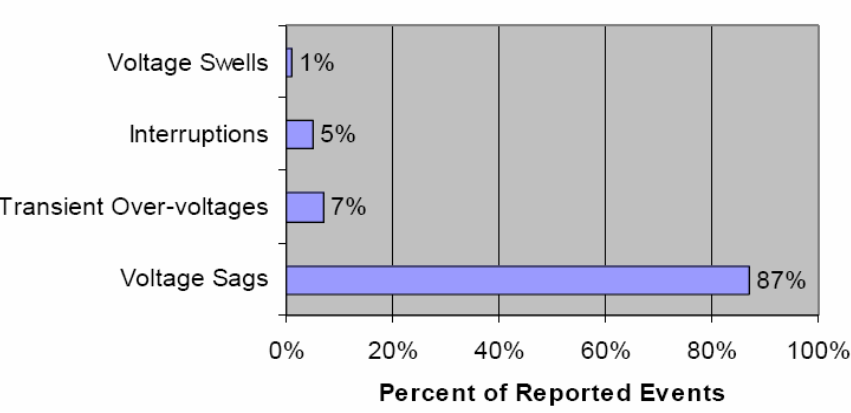
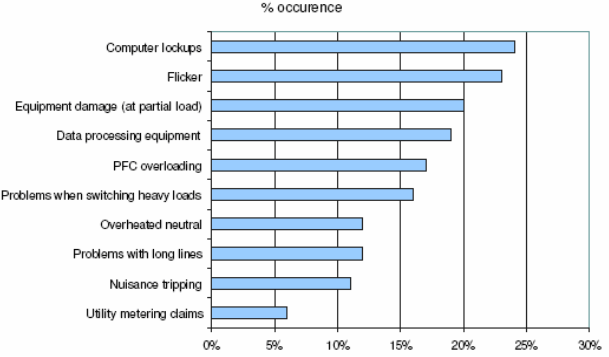
Poor Power Quality can be described as any event related to the electrical network that ultimately results in a financial loss. Possible consequences of poor Power Quality include (Fig. 1):
- Unexpected power supply failures (breakers tripping, fuses blowing).
- Equipment failure or malfunctioning
- Equipment overheating (transformers, motors, …) leading to their lifetime reduction.
- Damage to sensitive equipment (PC‟s, production line control systems, …).
- Electronic communication interferences.
- Increase of system losses.
- Need to oversize installations to cope with additional electrical stress with consequential increase of installation and running costs and associated higher carbon footprint.
- Penalties imposed by utilities because the site pollutes the supply network too much.
- Connection refusal of new sites because the site would pollute the supply network too much.
- Impression of unsteadiness of visual sensation induced by a light stimulus whose luminance or spectral distribution fluctuates with time (flicker)
- Health issues with and reduced efficiency of personnel, …
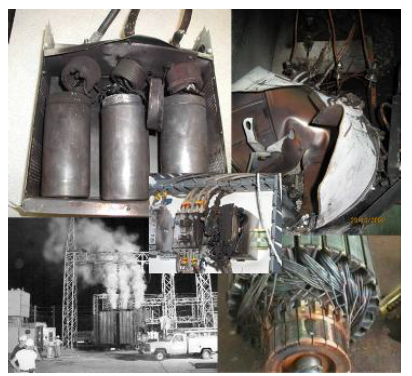
Fig. 1: Possible consequences of poor Power Quality
The following main contributors to Low Voltage poor Power Quality can be defined:
- Reactive power, as it loads up the supply system unnecessary.
- Harmonic pollution, as it causes extra stress on the networks and makes installations run less efficiently.
- Load imbalance, especially in office building applications, as the unbalanced loads may result in excessive voltage imbalance causing stress on other loads connected to the same network, and leading to an increase of neutral current and neutral to earth voltage build-up.
- Fast voltage variations leading to flicker.
All these phenomena potentially lead to inefficient running of installations, system down time and reduced equipment life and consequently high installation running costs.
If due to poor Power Quality the production is stopped, major costs are incurred. This is illustrated in Table 1 which gives an overview of typical financial loss due to a Power Quality incident (stop) in electrical installations for various industries [1]
Table 1: Examples of financial loss due to Power Quality incidents
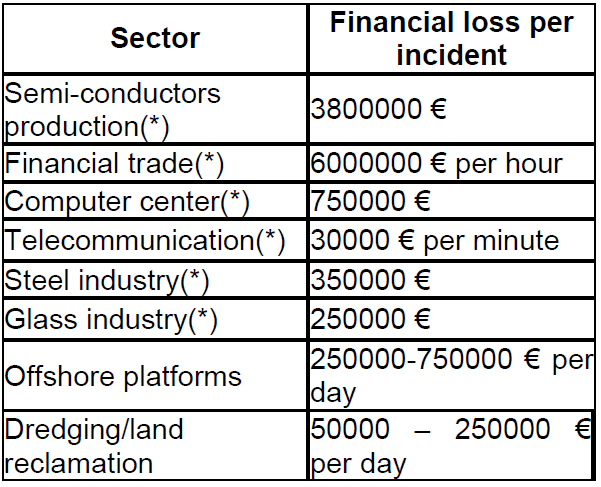
The data labelled (*) in Table 1 have been concluded after a European wide Power Quality survey undertaken by the European Copper Institute in 2002. Other data is ABB experience data.
In addition to financial loss due to “production stops‟, another factor of the cost of poor Power Quality can be identified by analyzing the extra kWh losses that exist due to the presence of harmonic pollution in typical network components such as transformers, cables, and motors. As this loss has to be supplied by the utility power plants, a financial loss and CO2 emissions can be assigned to it. Exact values of this loss depend on the local situation of kWh tariffs and ways that the electrical power is generated (e.g., nuclear power plants have almost no CO2 footprint per kWh generated as opposed to coal power plants for which the footprint is large at around 900-1000 g/kWh produced [2].
One possible method to quantify theoretically the extra losses introduced by harmonics in transformers is to use the IEEE C57.110 standard [3]. The calculated impact will depend on the local situation but figures like a few thousands’ Euro/year are easily reached. This corresponds to a few tens of CO2 emissions/year. Consequently, it may be concluded that in installations where significant harmonic polluting loads are present, the running costs can be significant.
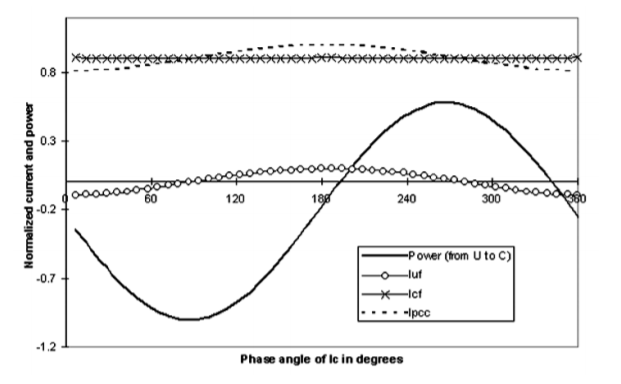
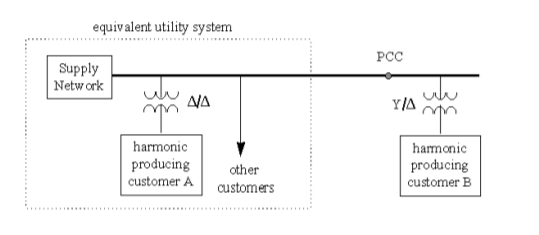
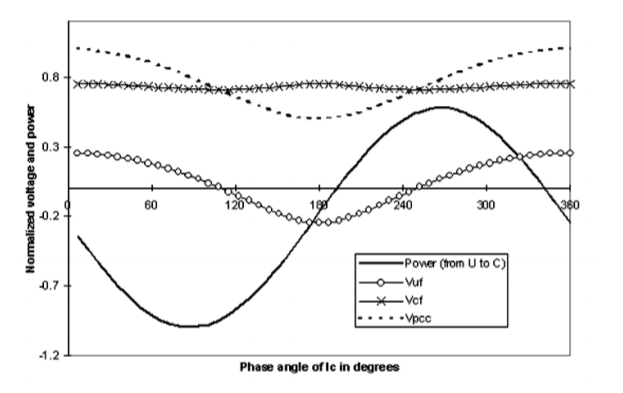
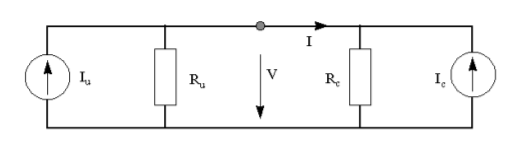
Most harmonic pollution nowadays is created as harmonic current produced by loads in individual installations. This harmonic current, injected into the network impedance transfers into harmonic voltage, (Ohm’s law); which gets applied to all the loads within that user’s installation. As a result, the user employing harmonic loads may suffer from Power Quality problems. In addition, however, the harmonic current produced in one installation if not filtered is also flowing through the feeding transformers into the utility supply and creates harmonic voltage distortion on the public network too. As a result, any utility user connected to the same supply will become affected by the pollution created by another utility customer and could suffer operational consequences in his own installation due to this.
In order to limit this type of problems most utilities have adopted Power Quality standards/regulations that shall be respected by the users of the supply network. In extreme cases, non-compliance with these regulations leads to a connection refusal of a new installation, which in turn can have a significant impact on the production and revenue loss of the company.
POWER QUALITY PARAMETERS (TERMINOLOGY)
Reactive power and power factor (cos φ )
In an AC supply, the current is often phase-shifted from the supply voltage. This leads to different power definitions (Fig. 2):
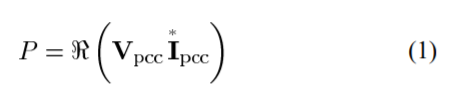
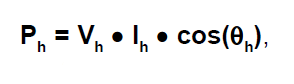
The active power P [kW], which is responsible of the useful work, is associated with the portion of the current which is in phase with the voltage.
The reactive power Q [kvar], which sustains the electromagnetic field used to make e.g. a motor operate is an energy exchange (per unit of time) between reactive components of the electrical system (capacitors and reactors). It is associated with the portion of the current which is phase shifted by 90° with the voltage.
The apparent power S [kVA], which gives a geometrical combination of the active and of the reactive powers, can be seen as the total power drawn from the network.
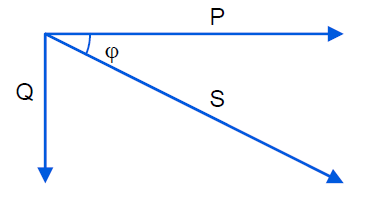
Fig. 2: Basic powers in AC systems
The ratio between the active power and the apparent power if often referred to as the displacement power factor or cos and gives a measure of how efficient the utilization of the electrical energy is. A cos φ that equals to 1 refers to the most efficient transfer of useful energy. A cos φ that equals to 0 refers to the most inefficient way of transferring useful energy.
Harmonic distortion
The harmonic pollution is often characterized by the Total Harmonic Distortion or THD which is by definition equal to the ratio of the RMS harmonic content to the fundamental:
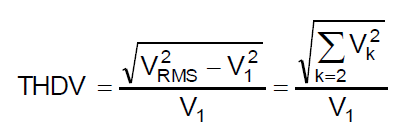
where Vk is the kth harmonic component of the signal V.
This quantity, expressed in %, is very useful when the fundamental value component is implicitly given or known. Consequently, the THD is particularly relevant information for the voltage (as the rated voltage is known). In order to be able to gauge THD of the current, it is imperative that a fundamental frequency current reference be defined.
Voltage unbalance
In the symmetrical components theory Fortescue has shown that any three phase system can be expressed as the sum of three symmetrical sets of balanced phasors: the first set having the same phase sequence as the initial system (positive phase sequence), the second set having the inverse phase sequence (negative phase sequence) and the third one consisting of three phasors in phase (zero phase sequence or homopolar components).
A normal three phase supply has the three phases of same magnitude but with a phase shifted by 120°. Any deviation (magnitude or phase) of one of the three signals will result in a negative phase sequence component and/or a zero phase sequence component.
The definition of voltage unbalance is usually expressed as the ratio between the negative phase sequence component and the positive phase sequence component. This parameter is expressed in %. (Strictly speaking, the homopolar part should also be considered in the definition. However, as it is the negative phase sequence that is the most relevant for causing damage to direct online motors by creating a reverse torque, historically the unbalance definition is often limited to the one expressed in this paragraph).
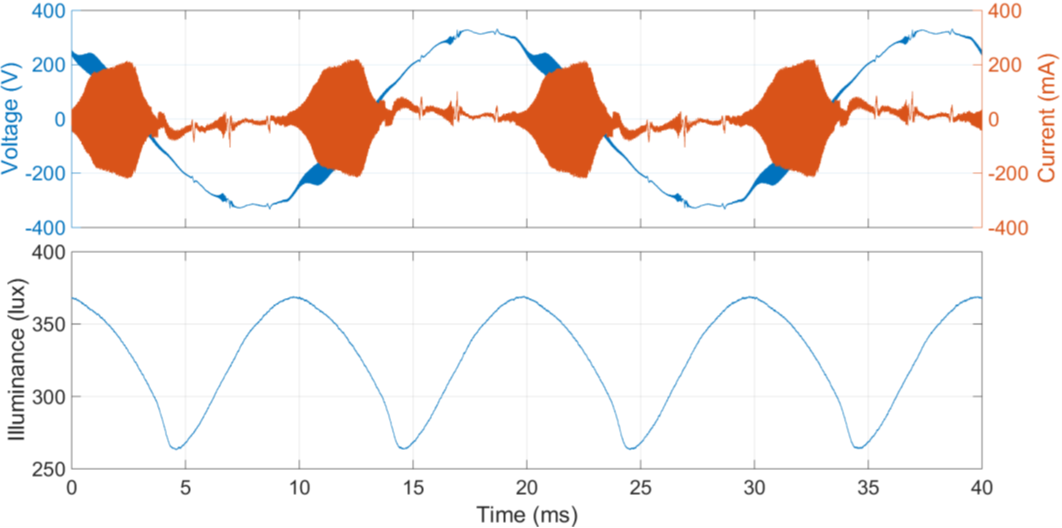
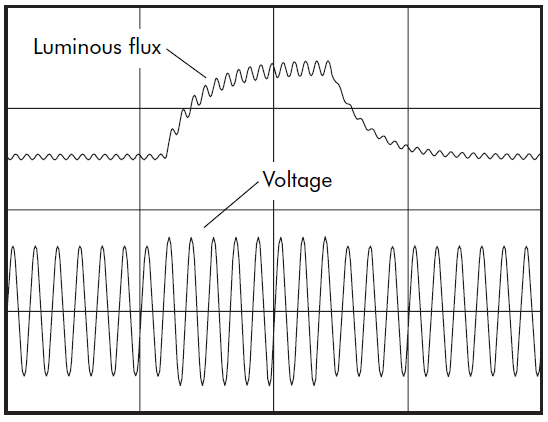
Flicker
According to the International Electrotechnical Vocabulary (IEV) [4] of the International Electrotechnical Committee (IEC), flicker is defined as ‘Impression of unsteadiness of visual sensation induced by a light stimulus whose luminance or spectral distribution fluctuates with time’. From a more practical point of view one can say that voltage fluctuations on the supply network cause change of the luminance of lamps, which in turn can create the visual phenomenon called flicker. While a small flicker level may be acceptable, above a certain threshold it becomes annoying to people present in a room where the flicker exists. The degree of annoyance grows very rapidly with the amplitude of the fluctuation. Further on, at certain repetition rates of the voltage fluctuation, even small fluctuation amplitudes can be annoying.
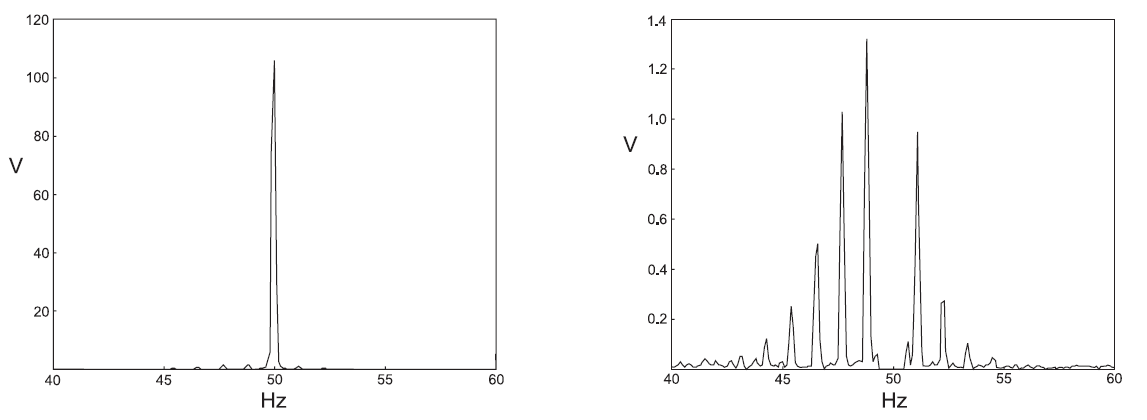
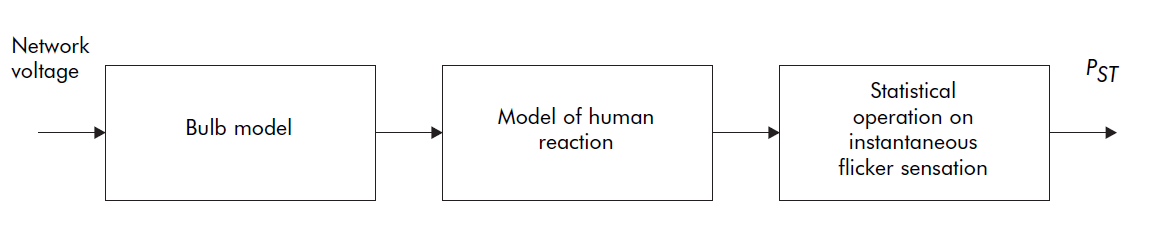
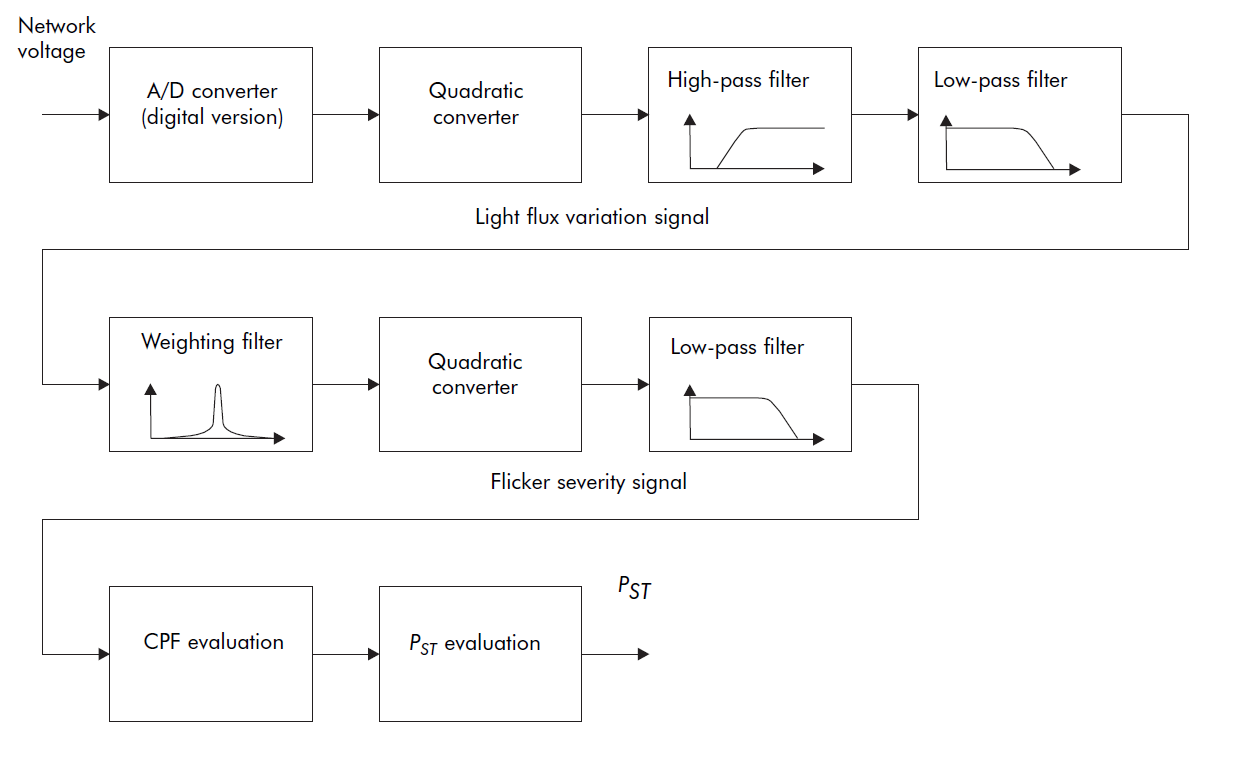
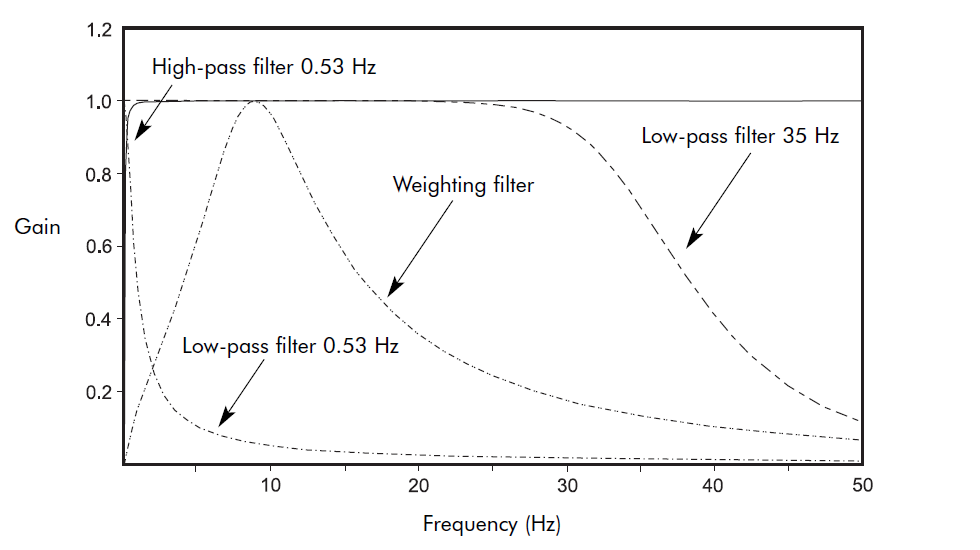
The influence of the flicker phenomenon on people is complex to analyse given that it depends not only on technical aspects like the lamp characteristics to which the fluctuating voltage is applied but also on the appreciation of the phenomenon by the eye/brain of each individual. A lot of research in this field has already been done, e.g. by the International Union for Electroheat (UIE). Two outcomes of the work done were the production of flicker curves and the specification of a flickermeter. The original specification was presented in the IEC 868 [5] which has now been replaced by the IEC 61000-4-15 [6].
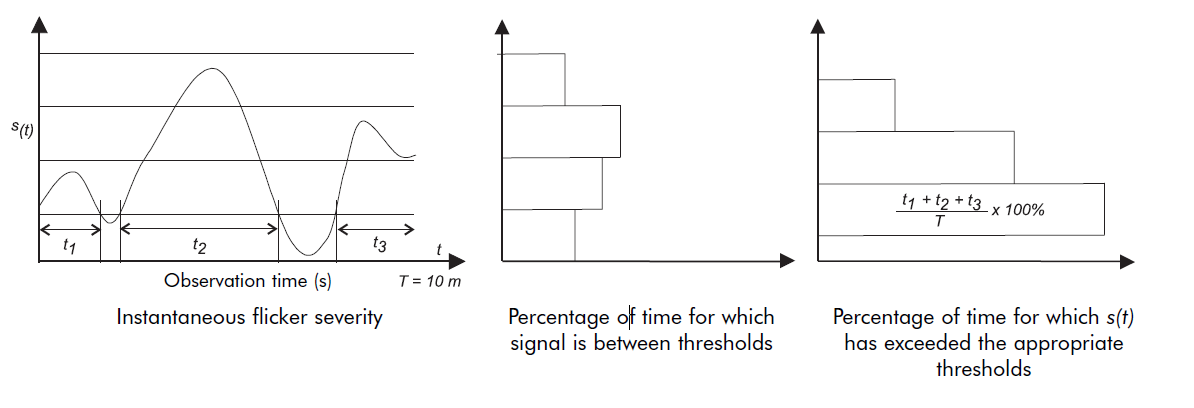
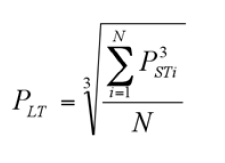
A flicker severity factor P was defined (*1) . P can either be evaluated on a 10 minute basis (Pst where ‘st’ stands for short term) or on a 2 hour basis (Plt where ‘lt’ stands for long term). A flicker severity level of one corresponds to a flicker level that irritates 50 % of the test persons and is defined as the threshold of irritability. The flicker curves generally show the rectangular voltage fluctuation magnitude that produces for a certain fluctuation frequency a flicker severity level of one. Sometimes, the threshold of flicker perception, which is lower than the threshold of irritability, is also shown. As an example of a flicker curve, consider Fig. 3 which shows the Pst = 1 curve for a 220 V system.
(*1) Another flicker severity factor sometimes used is A, which is related to P as A = P^3
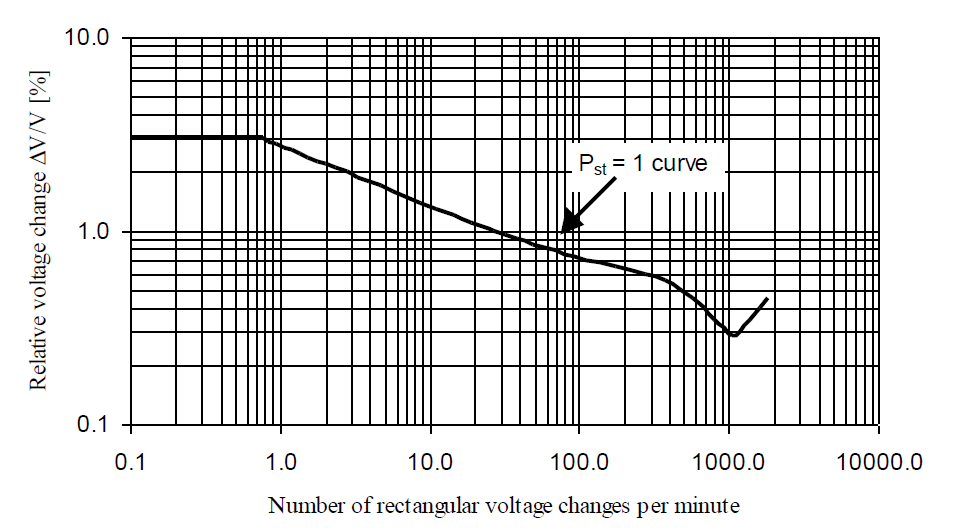
Fig. 3: Flicker curve showing the threshold of irritability (Pst = 1) for an incandescent 60 W bulb connected to a 220 V supply system
REGULATIONS
Utility regulations for harmonic pollution are often based on internationally recognized work undertaken by reputable independent bodies which have defined maximum allowable distortion limits for proper operation of equipment. Commonly quoted examples of such documents targeting harmonic pollution are given in the Refs. [7] – [9].
In general, the principle of the regulations is as follows:
- Limit the total voltage distortion (THDV) contribution that can be created by a customer. In this it is taken into account that if the totally accepted level of voltage distortion is e.g. 5% (of the fundamental voltage), this limit has to be divided over all the users connected. Possibly limits are also imposed for individual harmonic voltage components (e.g., 3% maximum limit for individual harmonic voltages).
- Convert the voltage distortion limits into current limits which are accepted to flow into the supply system. The current limits can then be easily verified through measurement.
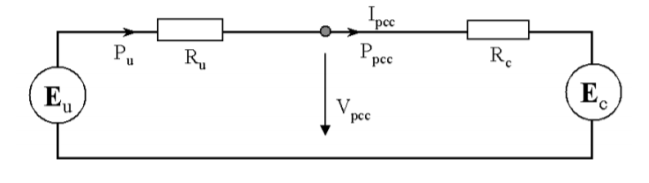
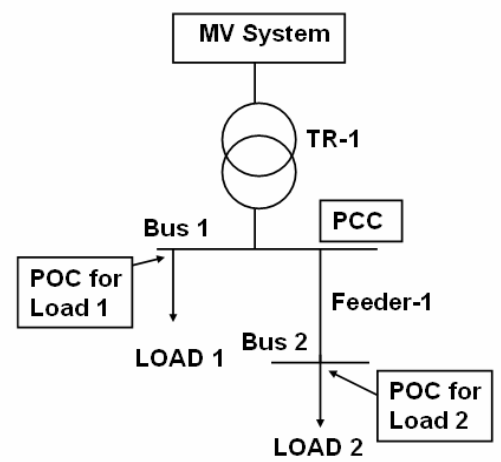
The limits imposed by the utilities always apply at the “point of common coupling‟ (PCC), which is defined as the interconnection point between the utility and the user installation. In most cases this is at MV-level. Often however, project consultants impose that the utility standard limits be applied at the LV bus level as their main concern is to have acceptable distortion levels at that point in the network so that the LV loads will run without problems.
In order to limit the amount of reactive power, many utilities will impose minimum cos φ values for an installation. If the cos φ of the installation is lower than this value, a penalty will be levied. A specific problem in this area is the situation where locally green energy is used (e.g., PV-panels in a factory) to produce active power, this resulting in a decrease of cos value of the power drawn from the supply by the rest of the plant (as the active power consumption is reduced by the PV-panels, but the reactive power is unchanged). Hence, in some countries companies investing in green energy are indirectly penalized by the utility for this approach.
In order to limit problems due to unbalanced voltages and currents, utilities typically limit the maximum voltage unbalance of the network voltage (e.g. up to 2% [10]). In LV installations (e.g., data centers) it is not uncommon to find limits on the neutral to earth voltage (e.g., 2 V max) to ensure the proper operation of the connected equipment.
In order to ensure compliance with harmonic regulations imposed by utilities or consultants, and to render an installation more reliable and more efficient, it may be needed to install compensation equipment. The generic single line diagram (SLD) of such an installation becomes then:
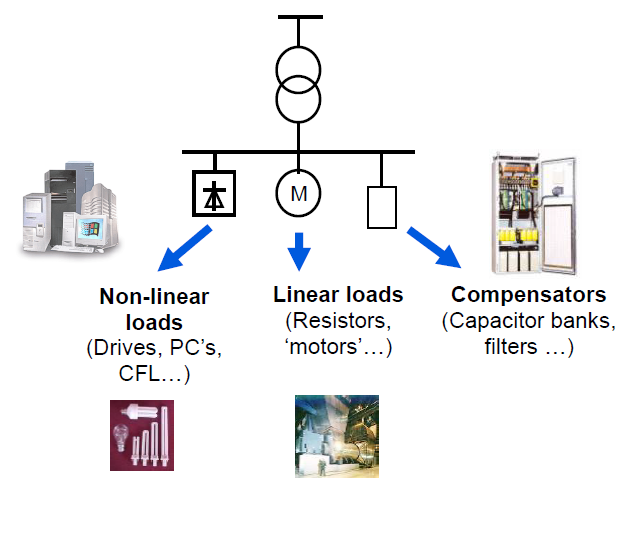
Fig. 4: Generic SLD of an installation
Next sections discuss more in detail the different type of compensators that exists, depending on the problem to be solved.
ADDRESSING STEADY STATE REACTIVE POWER DEMAND
In practice, most conventional not-harmonic producing loads present in an electrical installation (e.g., induction motors, transformers, …) draw a combination of active and inductive reactive power and consequently their cos φ varies between 0 and 1 (inductive).
When the cos φ is low, the power transfer is inefficient. When the cos φ is high (max 1), the power transfer is efficient. Note that for modern loads such as variable speed drives or computer server equipment, the cos φ can equally become capacitive (e.g., 0.9 capacitive) which creates possible problems such as the need to derate UPS systems feeding these loads, or the inability of these loads to operate under certain conditions on a generator supply.
If the load is inductive and is relatively steady state, a common practice is to install contactor switched capacitor banks (Fig. 5).
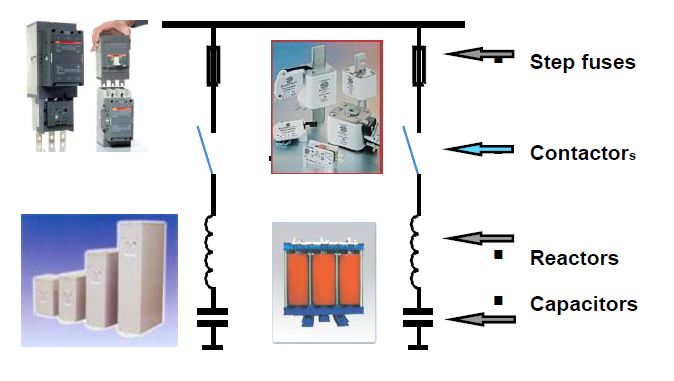
Fig. 5: Contactor switched capacitor bank SLD
A power factor controller compares the reactive power present in the network with the target value (e.g., target cos φ = 0.95) and will switch on capacitor steps to reach this target.
When using this technology, attention has to be paid to the following aspects:
- The power factor controller used has to be capable of proper operation in the presence of harmonic pollution and should be able to handle regenerative loads.
- Capacitor steps switched on by contactors may create a high inrush current and correspondingly may disturb the network voltage to a great extent. An example of such a disturbance is given in Fig. 6 which shows the effect of a 50 kvar capacitor switch-on on a weak network.
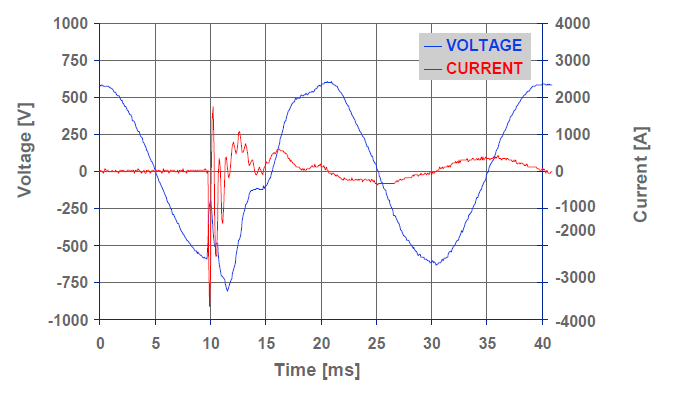
Fig. 6: Current and voltage transient upon capacitor step switch-on
In Fig. 6 it may be seen that the transient current reaches peak values up to 4000 A which causes a significant voltage transient to occur. This voltage transient may be detrimental for sensitive equipment such as can be found in hospitals. As a consequence of this some utilities will not accept to switch on large capacitor steps by contactor.
- When harmonic pollution is present in the network, there is a high chance that this pollution exists at frequencies equal or close to the resonance frequency of the installation. In that case harmonic amplification due to resonance may result and may create a lot of technical problems in the system. As an example, consider the harmonic voltage distortion and the capacitor step stress in an application where a 600 kVA transformer is feeding 200 kW of DC drive load. The DC drive system replaced a motor load which had been successfully compensated by a 125 kvar capacitor bank (5 x 25 kvar steps). Table 2 gives the resulting cos φ value, the Total Harmonic Voltage Distortion value (THDV) and the capacitor bank current stress as the bank switches on its steps to try and achieve the target cos φ of 0.92.
Table 2: cos φ, THDV and capacitor step stress for different configurations of a 125 kvar capacitor bank
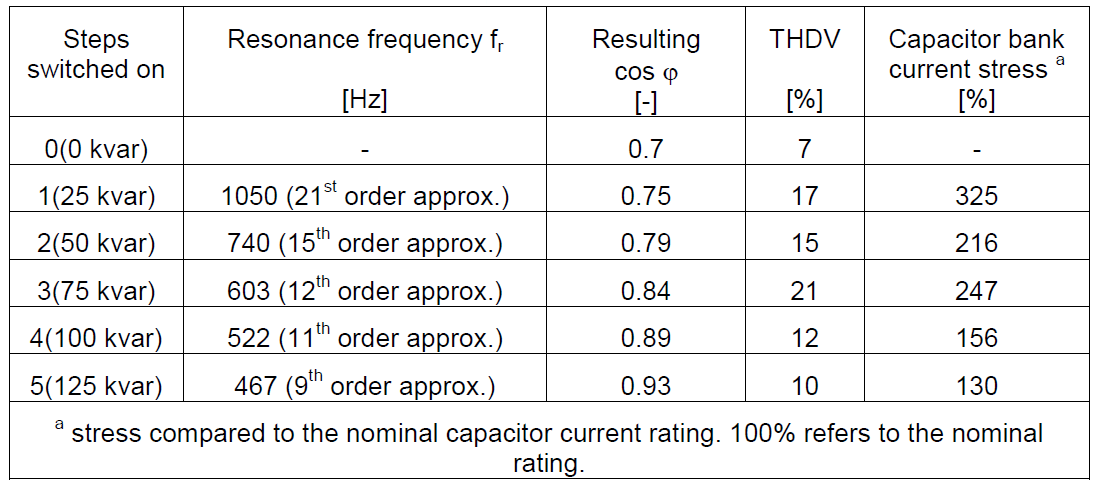
From Table 2 it may be seen that due to the excitation of the different resonance frequencies as more steps switch on, the harmonic voltage distortion in the network increases significantly. This lead to failures in other loads connected to the same network. Further, the capacitor current stress is well above the nominal rating during each switching sequence. This typically leads to premature failing of capacitor elements.
The abovementioned problem can be avoided by equipping the capacitor banks with detuning reactors, i.e., a reactor is connected in series with the capacitor and the tuning frequency of this reactor-capacitor combination is chosen at a frequency sufficiently lower than the first harmonic component present in the network. The practical value of tuning factor “p‟ is 7% for industrial networks and 12.5% or 14% for commercial networks. The ratio between the p-value and the tuning frequency of the branch is given in Eqn. [1].
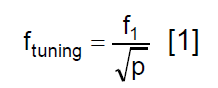
Where:
 : base network frequency in Hz
 : tuning frequency of the LC-branch in Hz
- p: the tuning factor of the LC branch expressed in absolute terms (e.g., 0.07)
Table 3: DPF, THDV and capacitor step stress for different configuration of a 125 kvar detuned capacitor bank
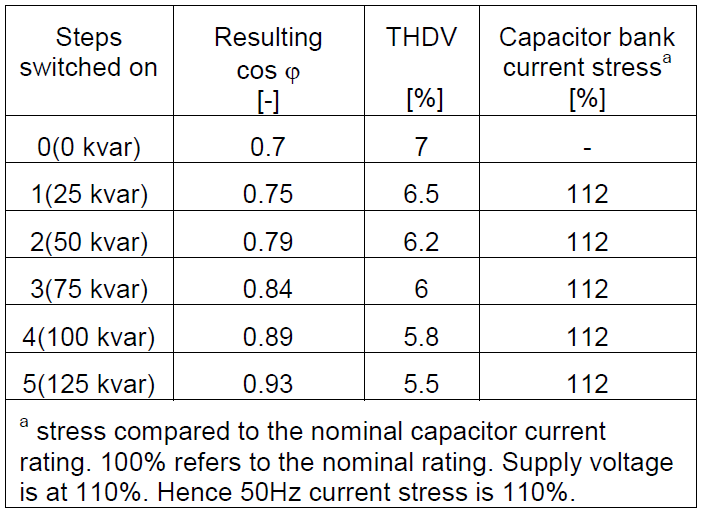
It may be concluded from Table 3 that the use of a suitably defined detuning reactor reduces the stress in the capacitor step to acceptable levels. In addition it can be seen that a properly detuned capacitor bank can reduce the harmonic voltage distortion of the network.
ADDRESSING FAST VARYING REACTIVE POWER DEMAND
If the reactive power requirement is fluctuating fast or is high, contactor switched capacitor banks cannot be used for the reasons mentioned in the previous section. In that case typically Thyristor Switched Capacitor banks are used. Often, in these applications:
- The power transmission efficiency is very low due to the low cos φ of the installation (e.g., 0.3-0.5).
- The current demand is so high that it leads to impermissible voltage drops, e.g., on motor start-up and/or to flicker phenomena.
Fig. 7 shows an example of a reactive load demand pattern of a harbor crane that can typically not be compensated by traditional contactor switched capacitor banks.
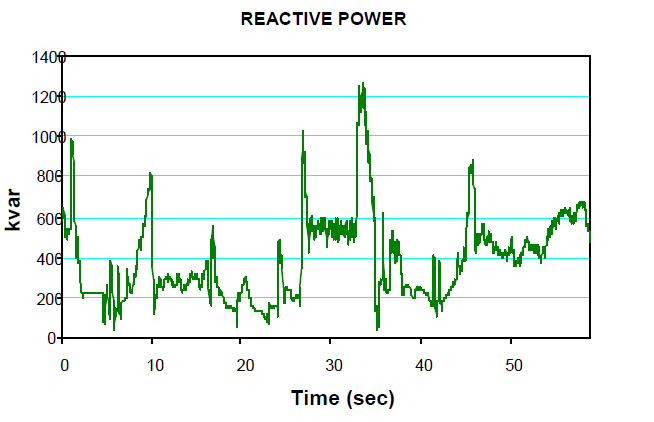
Fig. 7: Reactive load demand pattern of a harbor crane
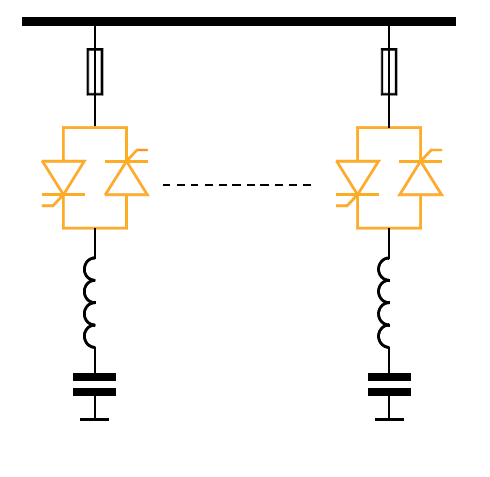
Fig. 8: Simplified SLD of a TSC-bank
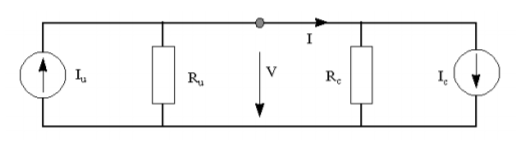
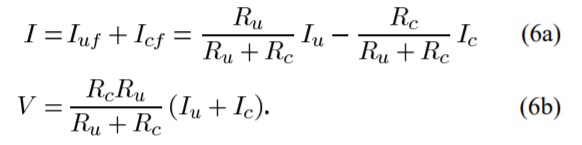
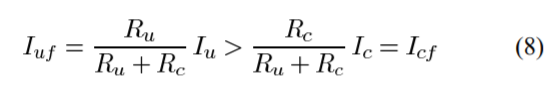
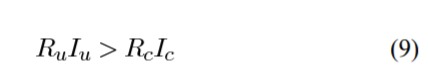
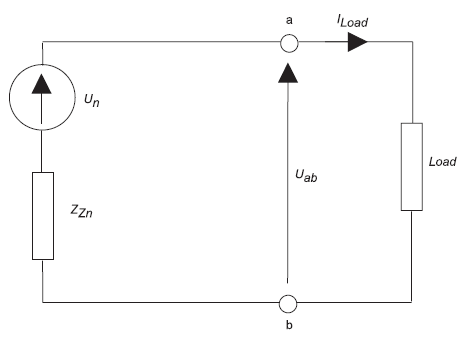
Different types of control system for TSC-banks exist. In some equipment the contactor is simply replaced by a thyristor switch without optimizing the switching instant. In that case the transient behavior of such a TSC-bank is similar to the transient behavior of a contactor switched bank (cf. Fig. 5). This can readily be seen by analyzing the equivalent diagram of the electrical circuit on switch-on.
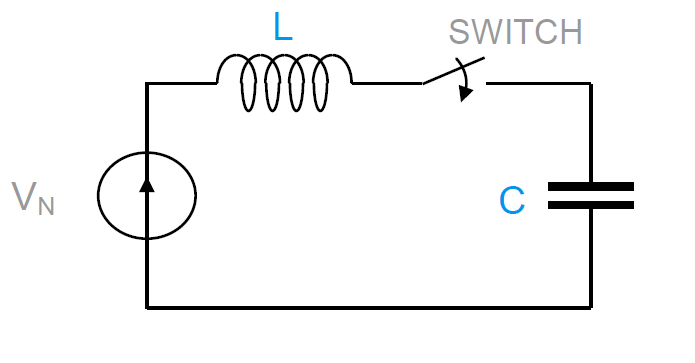
Fig. 9: Equivalent diagram of TSC circuit on switch-on
The transient response of this circuit is given by Eqn. [2].

Where:
- VN: Instantaneous network voltage (V)
- VC: Instantaneous capacitor voltage (V)
- C: Capacitor value in F
- L: Inductance value in H
If the switching instant does not coincide with the moment that VN equals VC, then a transient will occur.
Fig. 10 shows the transient behavior of a properly controlled TSC-step.
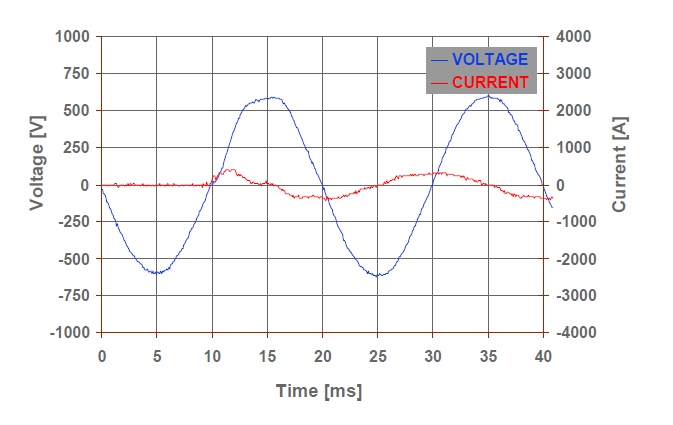
Fig. 10: Current and voltage transient upon TSC capacitor step switch-on
Unlike the example of Fig. 6, there is no significant transient when a properly designed TSC bank is used which validates this solution also for applications where sensitive loads are present, even if the load is not varying to a great extent.
In addition to providing (large amounts of) reactive power in a smooth way, TSC-banks are also used for voltage drop compensation and flicker control.
- For voltage compensation purposes it is worth noting that the voltage drop in a system is due to the reactive current, but also due to the active current. Therefore, the better TSC-banks are equipped with functions that allow compensating for the voltage drop due to both current components. This is especially important in applications where the network is weak and has a low X/R factor, and where the cos φ of the load is relatively high (e.g., stone grinder applications). Under these conditions the voltage fluctuations are often due to the variation of the active power component. Using a TSC-bank which does not have the ability to compensate for the voltage drop due to the active power demand, will typically result in unsatisfactory results.
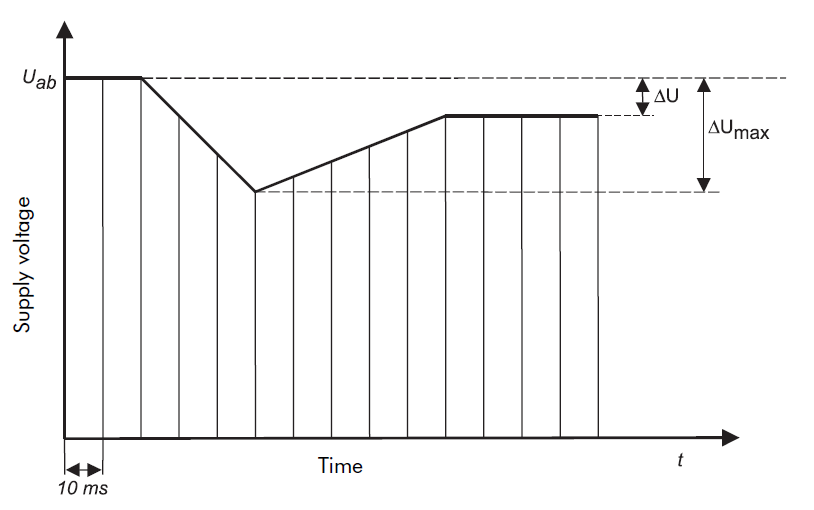
- For flicker compensation purposes, it is critical that the TSC-bank has a sufficiently fast response time, and that the capacitor step size is sufficiently small in order to remain as close as possible to the ideal compensation characteristic. Fig. 11 shows voltage drop compensation characteristic for a TSC-bank assuming that when the compensator switches on, the voltage drop is perfectly reduced to zero. The compensator however has a reaction time at the start and at the end of the cycle. It is assumed that the voltage drop is instantaneous due to an abrupt load demand (e.g., welding load).
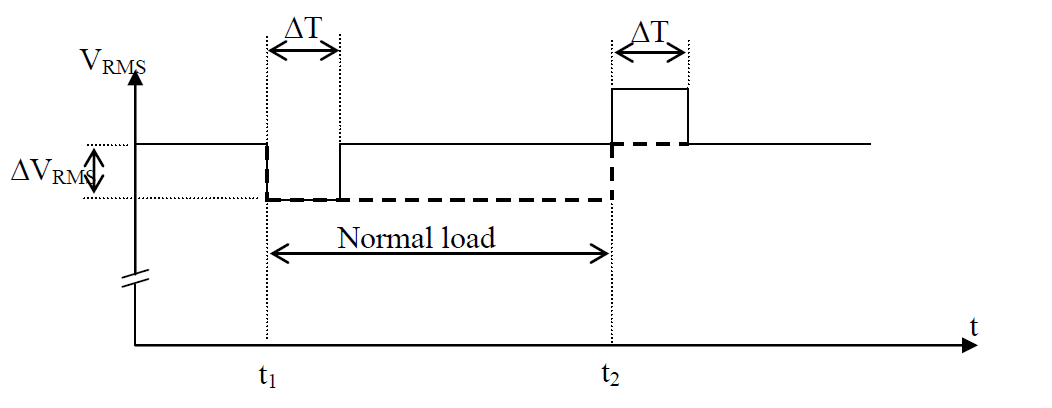
Note: The dotted line represents the voltage drop when no flicker compensator is installed.
Fig. 11: RMS-value of the voltage waveform when a flicker compensator utilizing a ‘rectangular compensation’- approach is used
Table 4 shows the flicker reduction factor that can be obtained with a TSC-bank using the ‘rectangular compensation’- approach (cf. Fig. 11) and where the time delay ΔT = ΔT1 = ΔT2. The results have been obtained for loads which start and stop instantaneously and which introduce voltage fluctuations due to drawing power at the fundamental frequency. The fundamental frequency is assumed to be 50 Hz. The values given are approximate and are for applications where the compensation delay is a fraction of the load cycle. The flicker reduction factor is defined as the ratio of the Pst-values with and without the compensator running.
Table 4: Flicker reduction factor as a function of the compensation delay DT (‘rectangular compensation’- approach)
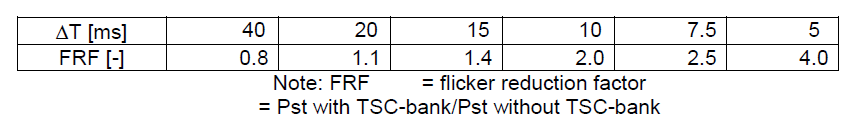
From Table 4 it may be concluded that under the aforementioned conditions, a TSC-bank with a response time longer than 20 ms will increase the flicker level of the installation rather than decreasing it. Best results of flicker reduction can be obtained with TSC-banks that can be switched on “instantaneously‟ after the load arrives.
Another compensation strategy that could be envisaged is a ‘triangular compensation’-approach. In this compensation strategy, the compensator reacts immediately when the load appears. While initially the compensation level is low, after a transient time ΔT the full compensation is reached, and the compensation is perfect. When the load suddenly disappears, the compensator reacts again immediately and after the transient time ΔT the compensation is completely switched off.
The effect of the triangular compensation approach is visualized in Fig. 12 and the achieved results are shown on Table 5.
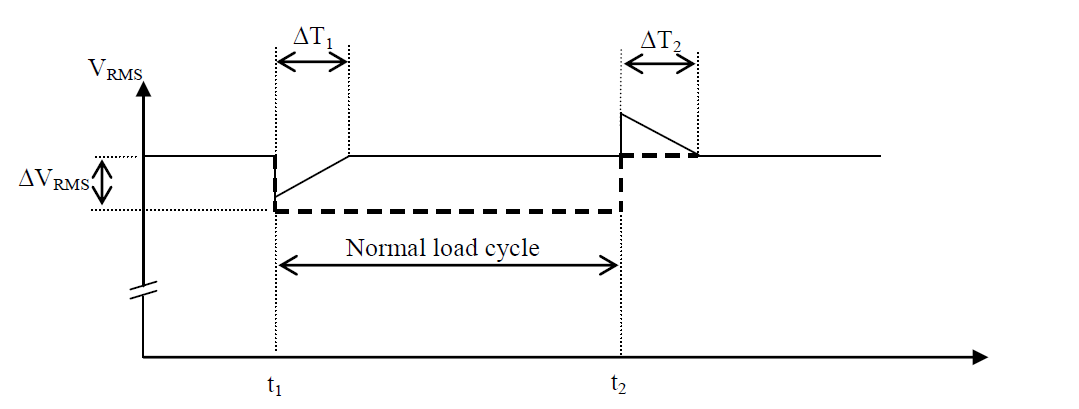
Fig. 12: RMS-value of the voltage waveform when a flicker compensator utilizing a ‘rectangular compensation’- approach is used
Table 5: Flicker reduction factor as a function of the compensation delay ΔT (‘triangular compensation’- approach).

Comparing the flicker reduction results of the ‘triangular compensation’- approach with the conventional ‘rectangular compensation’-approach, the advantages of the former are obvious. For the same compensator time delay, a higher flicker reduction factor can be obtained. Since an instantaneous reaction is required from the compensator, it is clear that it cannot solely be based on thyristor switched equipment, but it can be realized with an IGBT converter.
From this section it may be concluded that in order for a TSC-bank to be efficient for a wide variety of applications, it should have switch transient-free, it should be able to compensate voltage drop due to active power flow and depending on the application it should be able to act fast.
ADDRESSING HARMONIC POLLUTION AND LOAD INBALANCE
Historically passive filters have been and are still being proposed to mitigate harmonic pollution. In LV installations, these solutions become less and less applicable given that:
- LV installations are very dynamic leading over time relatively fast to passive filter overload.
- Modern loads (e.g., VFD‟s, modern lighting systems, …) have a very good cos already (possibly even capacitive) leading to overcompensation when a passive filter is installed. This in combination with limited capability of typical backup generators to run on capacitive cos φ makes that the reliability of an installation may be reduced.
- Passive filters installed in LV installations typically address the lower harmonic orders, whereas nowadays there is tendency to get more problems in installations due to higher frequency harmonics. Hence, the passive filter may not solve the technical problem if present.
- The passive filter filtering efficiency is defined by the impedance ratio of the passive filter impedance and the network impedance and therefore cannot be guaranteed. Hence it is virtually impossible to guarantee compliance with regulations by using passive filters.
For the reasons mentioned above there is a worldwide tendency to move away from passive filtering solutions in favor of active filtering solutions in LV and MV applications.
Most commonly found active filters are power electronics based electrical equipment that are installed in an installation on a parallel feeder to the polluting loads (Fig. 13).
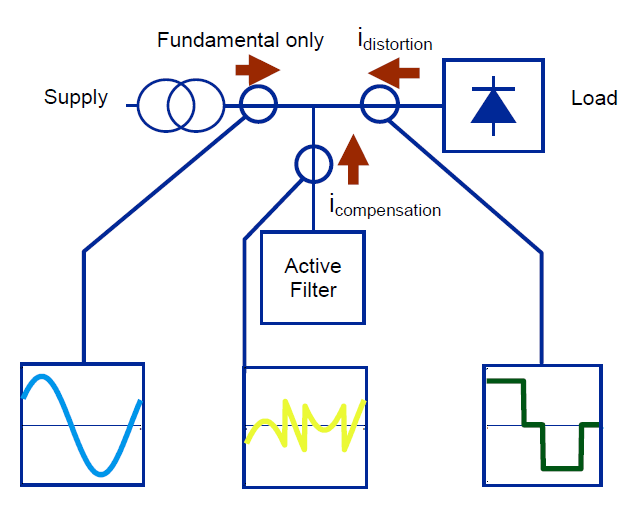
Fig. 13: Connection diagram of most commonly found active filters today.
An active filter consists of a power stage and a control system:
- The power stage typically uses an IGBT-based PWM inverter, coupled to the network through a coupling circuit. The IGBT switches are controlled in such a way to amplify the control signals representing the compensating currents and voltages. The coupling circuit contains an output filter section, which acts as a low-pass filter absorbing the high frequency switching components created by the PWM inverter, leaving the compensating harmonic currents to flow.
- The control system relies on current measurements to obtain information on which harmonics are present in the network. The filter control system then calculates the control signals, which represent the compensating current to be injected into the network. These control signals are finally sent to the PWM inverter, which amplifies and couples them to the supply network.
In the more advanced ABB PQF filters, the controller also analyzes the customer requirements programmed by the user and can then generate for each harmonic frequency a harmonic current (“compensation current‟) in perfect opposite phase to the polluting current that was measured.
Thanks to the active concept, active filters are not-over loadable but will continue to run at nominal rating if the load demand would be higher than their capacity. Also, active units can be extended quite easily opposite to the difficulty often encountered when trying to extend passive filter units.
In order to obtain good performance throughout the filter bandwidth, two control aspects are critical:
- The use of a genuine closed loop control system, and
- The frequency domain approach for the processing and controlling of the polluted current.
These aspects, present in the ABB PQF units, are elaborated on below:
For active filters, the closed loop and open loop aspect can be found in the location where the active filter measurement current transformers (CT‟s) have to be installed (Fig. 14).
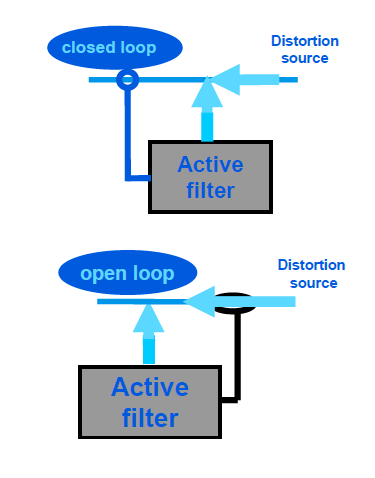
Fig. 14: Closed loop and open loop active filter principle
In closed loop systems, the current upstream of the load and filter connection are measured and corrective action is taken. Any measurement or other inaccuracies can be automatically cancelled out and compensated for thanks to the closed loop concept.
In open loop systems, the load current is measured and processed, and the inverted signal of the measured image is presented to the IGBT-bridge. As no feedback exists, the resulting line current may typically contain error components which are not seen by the control system.
In summary, the following properties can be assigned to a closed loop control system as opposed to an open loop control system [11]:
- Closed loop systems allow canceling out errors in the control loop and in the behavior upon external disturbance. Open loop systems do not have this capability.
- Closed loop control systems can react as fast as open loop control systems providing that the control loop parameters are set for this behavior.
Another aspect of the control system of an active filter is whether to use a time-domain or a frequency-domain approach.
- In the time-domain approach, the fundamental frequency component is removed from the measured current signal. Then the remaining waveform is inverted, and the resulting signal drives the IGBT-bridge of the active filter. In this approach, in this approach it is ignored that the network characteristics are different for different frequencies, as well as the characteristics of the current measuring CT‟s and the characteristics of the electronic hardware and software on board of the active filters. As a result, in practice active filters using this control approach have a deteriorating performance with increasing frequency.
- In the frequency-domain approach each harmonic and its corresponding system characteristics is treated individually, and performance can be optimized for the harmonic components in the filtering bandwidth. As a result, the same (high) filtering performance can be maintained through the filtering bandwidth. Fig. 15 represents schematically the principle of the frequency-domain filtering approach.
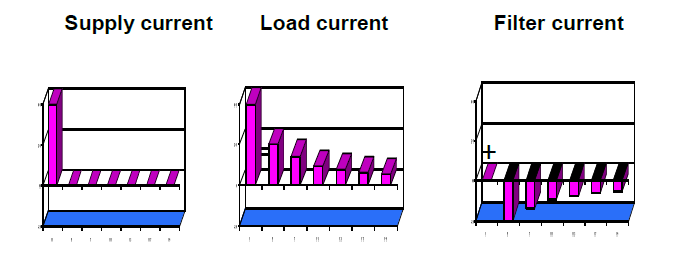
Fig. 15: Principle of the frequency- domain filtering approach
Overall, it can be concluded that the best filtering performance can be obtained with an active filter using a closed loop control system and an individual frequency domain approach. Other advantages of such filters include:
- User requirements can be preset for each harmonic (e.g., standard compliance requirement).
- Individual harmonics can be selected to allow optimal use of the filter resources (e.g., no need to filter the 5th harmonic if this harmonic is already filtered by another existing filtering device).
- Precise targets for cos φ can be set and maintained. This allows such active filters to operate in applications where accurate cos control is required to avoid disturbances in the installation (e.g., tripping of a generator).
- Precise load balancing can be implemented allowing neutral systems to be offloaded and ensuring that neutral to earth voltage is kept to minimal levels. Also, it can be ensured that the load seen by e.g., a UPS is balanced.
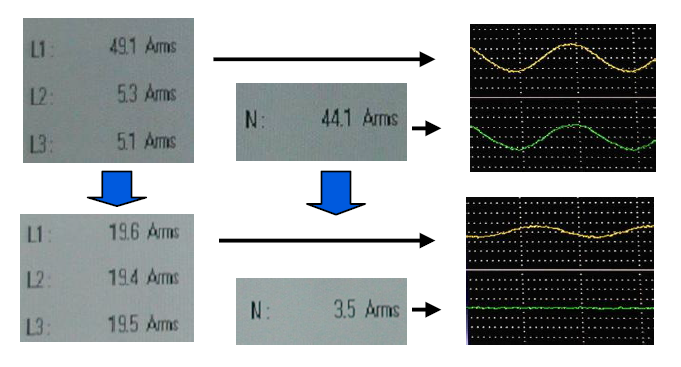
Note: Top data: original unbalanced load, Bottom data: balance compensator running
Fig. 16 gives an example of a balancing application by using a closed loop control ABB PQF active filter.
In addition to the functional aspects, more advanced active filters contain functions that allow minimizing equipment running losses and providing extra reliability to the installation thanks to secondary functions (e.g., automatic temperature de-rating functions etc.).
FIELD RESULTS
Power Quality products are being used in a variety of applications for a variety of reasons. This section presents some field results obtained with ABB high performance Dynacomp TSC banks and ABB PQF active filters.
A first example considers the Power Quality on offshore rigs. Such applications are often characterized by a low cos value, a large reactive power demand and a high harmonic content of voltage and current. This then typically results in an inefficient operation of the rig with possible production stops and associated financial loss, and a non-compliance with certification bureau rules. Fig. 17 shows a typical SLD of such an installation (cf. Table 1).
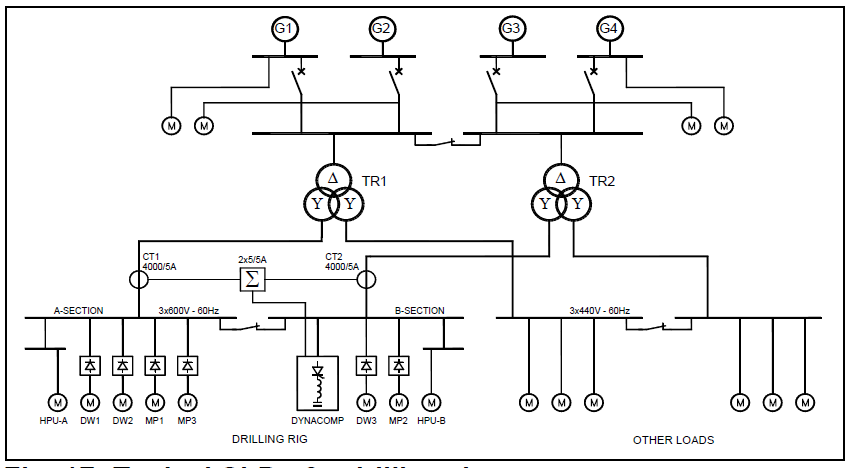
Fig. 17: Typical SLD of a drilling rig
Given the nature of the problems, it was decided to install an ABB TSC-bank (‘Dynacomp’) with 7% detuning reactors which main function was to improve the cos φ drastically and which could also reduce the harmonic pollution to acceptable levels. Table 6 gives the key electrical parameters of the rig with and without the compensator running.
Table 6: Key electrical parameters of the rig with and without compensator

The resulting line current with and without compensator is given in Fig. 18.
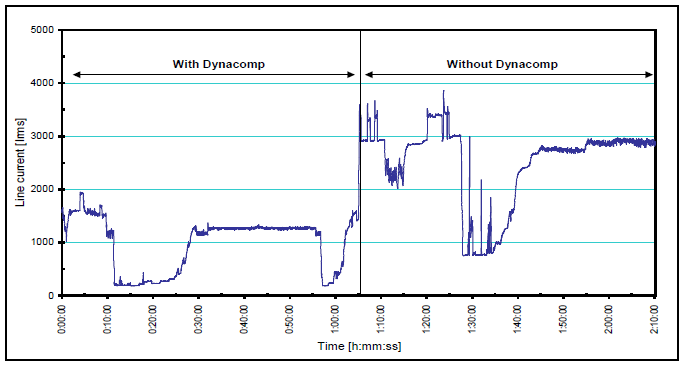
Fig. 18: Installation current with and without compensator
Analysis of Table 6 and Fig. 18 allows concluding that the Power Quality on board of the rig has drastically increased thanks to the compensator installed. The power and current drawn from the power plant has drastically reduced. The harmonic voltage pollution has decreased to acceptable levels. All this resulted in a more efficient and trouble-free operation of the installation with higher production rates than ever before: under normal conditions one generator can be switched off, and operating conditions of 110% can be maintained for several weeks without problems. Similar applications on offshore rigs sometimes also include active filters in case the pollution is too high to be handled by a TSC-bank alone or when specific harmonic regulation requirements need to be complied with.
Another problem typically encountered on offshore platforms is that due to the low cos φ value of the installation, extra required motors cannot be switched on. This is illustrated in Fig. 19 which shows a motor start attempt on an offshore rig. Due to the power limitation of the power plant and the low cos φ of the installation this is not possible however and a potentially dangerous hunting effect is introduced. Therefore, the motor has to be switched off.
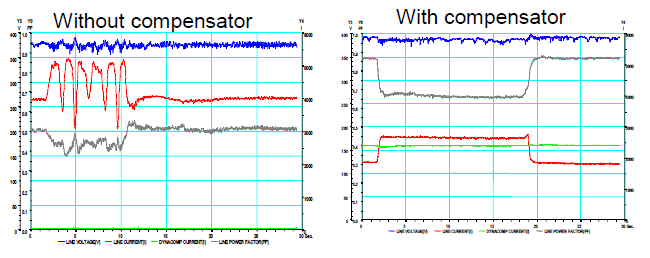
Note: Red curve: line current, Grey curve: cos φ, Blue curve: voltage
Fig. 19: Hunting effect due to motor start on saturated power plant, and behavior with compensator installed.
With the compensator installed, the power drawn from the power plant is drastically reduced and sufficient margin is available to start the motor successfully. The installation could run satisfactory at nominal rating and more efficiently than before.
Another example of Power quality improvement is on the site of an oil field exploitation, made of one central power station feeding many drilling and pumping clusters. The vast majority of the loads were AC drive controlled. There were approximately 40 clusters, each with a load in the range of 2 MW. Without the installation of the active filters, the distortion at the LV side of the cluster was about THDV = 12% and the THDI = 27% (Fig. 20).
After the installation of the active filters, the THDV dropped to THDV = 2% and the THDI = 3% (Fig. 21).
This resulted in a huge improvement of the Power Quality of the clusters allowing the plant to run within IEEE 519 standard limits ensuring trouble free operation of the different clusters.
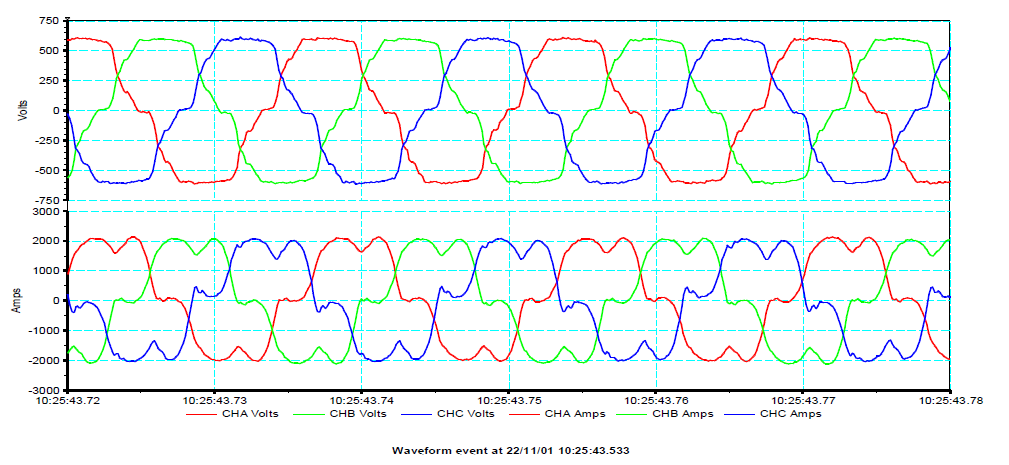
Fig. 20: Voltage (top) and current (bottom) waveforms before filtering at LV cluster side
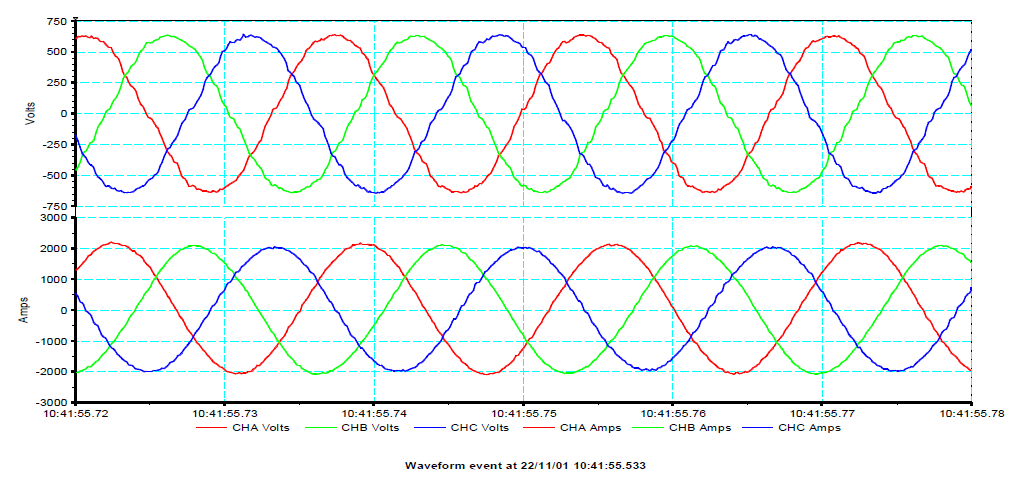
Fig. 21: Voltage (top) and current (bottom) waveforms after filtering at LV cluster side
fourth example considers the Power Quality on board of a vessel. The vessel considered has an electrical power plant consisting of 2 generators running at around 600 A each. The main loads are 2 DC drive based propulsion units. Before compensation, the THDI was around 25% and the corresponding THDV around 22%. The cos φ of the installation was around 0.76. The typical fuel consumption of the vessel was in the range 14000-15000 l/month.
The customer requirements were to (a) reduce the harmonic pollution to acceptable levels to avoid having technical problems with the propulsion units, and (b) to perform reactive power compensation without the risk of overcompensation. For this reason, ABB active filters were selected and installed. After installation the customer findings were that his technical problems were resolved but to his great satisfaction, he could also save around 10% of fuel costs. On year basis, the customer could save around 18000 l of fuel. This was caused by several factors, the main one believed to be that one generator could be switched off more frequently thanks to the improved network quality.
As seen in previous examples, Power Quality issues often arise in industrial networks due to the presence of a non-negligible number of (large) pollution loads. In commercial applications however, Power Quality is also a concern. In such applications, typically many single-phase polluting loads are present which create problems such as:
- Increasing harmonic stress which is put on equipment that is typically more vulnerable than industrial equipment.
- Resonance excitation due to the presence of 3rd harmonic components in combination with capacitor banks with wrongly chosen detuning reactor or no reactor at all.
- Neutral currents in excess of neutral conductors and bus-risers rating.
- Too high neutral to earth voltages which may not be acceptable for product operation and/or from safety point of view.
- The presence of capacitive cos φ due to modern server hardware, this potentially leading to the need to derate UPS-systems etc.
Fig. 22 shows the picture of an office building where Power Quality issues were reported. The elevators regularly broke down, leading to frustration to users, facility management and owner, as well as supply cables running too hot and the presence of other technical failures.
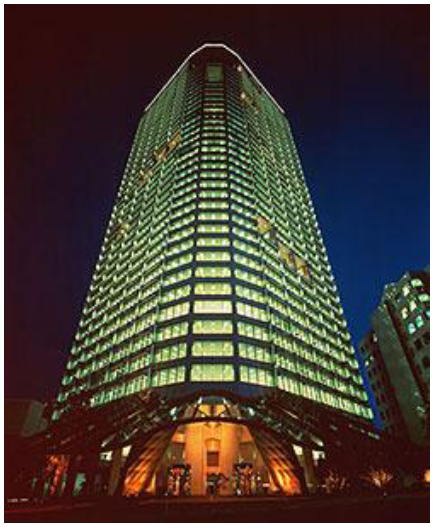
Fig. 22: Building where Power Quality problems used to lead to regular elevator breakdowns
In order to solve the problems ABB installed a combination of suitable power factor correction banks and active filters. This resolved the problems in the building. In addition, however, the local Utility has evaluated the solution installed and has concluded that the improvement in Power Quality resulted in a reduction of greenhouse gasses equivalent to taking 25 large cars of the road.
A last example looks at the Power Quality in a prestigious multi-star hotel. This hotel incorporates guest rooms and suites as well as function rooms and business centers. Typical loads encountered are high-speed lifts, dimmer switches and other sophisticated lighting equipment, as well as the typical office equipment including PC‟s, printers, etc. As a result of all these loads, the Power Quality had deteriorated to such an extent that the voltage was unstable. As a consequence, changing the operating point of loads in one side of the building would affect also the operation of other loads in other rooms. This was clearly unacceptable as it could lead to loss of customers due to below standard service offered.
A Power Quality solution was sought and after installation of ABB filtering equipment the problems disappeared.
CONCLUSIONS
This paper reviews the importance of good Power Quality. It presents Power Quality costs and solutions to poor Power Quality. A basic description of Power Quality is given together with its quantification through different parameters. Then, appropriate solutions for each problem type are identified and described. Attention is paid to the importance of the right control systems for the compensating equipment. Field results from different applications are given to give the reader a better insight in the benefits that may be gained by having good Power Quality in installations.
REFERENCES
[1] European Copper Institute, “European Power Quality Survey”, 2002
[2] French Nuclear Energy Society, “Le contenu en CO2 des differéntes filières de production d‟électricité: des questions et des réponses”, Revue Générale Nucléaire, N. 1, 2000
[3] IEEE, « IEEE C57.110 Recommended Practice for Establishing Liquid-Filled and Dry- Type Power and Distribution Transformer Capability When Supplying Nonsinusoidal Load Currents”, March 2008
[4] IEC 60050-161, ‘International Electrotechnical Vocabulary (IEV) – Chapter 161: Electromagnetic compatibility’, IEC publication, 09 – 1990
[5] IEC 868, ‘Flickermeter: Functional and design specifications’, International Standard, IEC publication, 1986
[6] IEC 61000-4-15, ‘Electromagnetic compatibility – Flickermeter – Functional and design specifications’, International Standard, IEC publication, 11 – 1997
[7] IEEE Standard 519-1992, “IEEE Recommended Practices and Requirements for Harmonic Control in Electric Power Systems”, IEEE, New York, NY, USA, 1993.
[8] Recommendation G5/4, “Limits for Harmonics in the UK Electricity Supply System”, The Electricity Council Chief Engineers Conference, United Kingdom.
[9] Technical Report IEC 61000-3-6, “ELECTROMAGNETIC COMPATIBILITY (EMC) – Part 3: Limits – Section 6: Assessment of emission limits for distorting loads in MV and HV power systems”, International Electrotechnical Commission., October 1996.
[10] European Standard EN 50160, “Voltage characteristics of electricity supplied by public distribution systems”, European Committee for Electrotechnical Standardization, November 1994.
[11] B.C. Kuo, “Automatic Control Systems”, John Wiley & Sons, Inc. New York, NY, USA