Glossary of terms are used within the Energy Sector
Compliments of the Australian Energy Market Commission (AEMC) is an independent statutory body with two key roles: making and amending rules for the National Electricity Market, elements of the natural gas market and related retail markets; and providing strategic and operational advice to the COAG Energy Council.
Accumulation meters measure how much electricity has flowed through them since they were installed. The quantity used in any given period is determined by subtracting the previous reading from the current reading. Most electricity meters in Australia are accumulation meters except in Victoria where advanced meters have been rolled out.
Ancillary services control power flow into or out of a network. They maintain the secure operating state of the power system by facilitating and controlling the continuous flow of electricity so supply continually meets demand. Ancillary services include network support, system restart and voltage support . Intermittent generators (like wind and solar) and technological innovation have opened opportunities for increased competition to supply these ancillary services which have traditionally been provided by generators and retailers.
Advanced metering services use the data which is collected by advanced (or smart) meters. Services made possible by advanced meters include remote retrieval of interval consumption data, managed and controlled load services, remote connection and disconnection of electricity supply, and quality of supply monitoring.
Advanced metering infrastructure is made up of systems required to support advanced metering. It includes smart metering and other services such as controlled load circuit and managed load services
Average daily load is a customer’s average daily consumption of electricity measured in kWhs.
Capacity based tariff is a pricing component of the total electricity bill that is based upon how much of the network’s capacity has been used by a customer during the billing period. Typically the capacity value is based on either the customer’s maximum demand or the customer’s coincident maximum demand during the billing period or season.
Capacity market describes the market framework governing the production and sale of electricity in Western Australia. In a capacity market generators receive a payment for having capacity available, even if it is not used. They receive an additional payment (spot price) for actual amounts of electricity sold. There are several forms of capacity market, depending on how capacity is bought and sold. The national electricity market is an energy only market – see energy only market.
Churn is a measure of the extent to which energy is traded and retraded as market participants manage their risks. A higher churn rate indicates a more liquid market.
Coincident maximum demand (CMD) is consumption during the interval of time when the local electricity supply system has its maximum demand interval. Typically the local electricity supply system has a maximum demand interval and maximum demand value for both summer and winter seasons.
Combined cycle gas turbine (CCGT) is a power station that generates electricity by gas turbines whose exhaust is then used to make steam generated electricity via a steam turbine. Combined cycle gas turbines are more efficient than open cycle gas turbines.
Combined heat and power (CHP) is generation which produces both heat and power. This can be a more efficient use of both fossil and renewable fuels if there are customers for the heat.
Critical peak pricing is a feature of specific contracts usually made between retailers and business customers as a form of demand response. The electricity price during these periods is usually much higher than the standard rate to encourage customers to reduce consumption at these times. The retailer gives customers advance warnings for a critical peak period event, and contracts usually anticipate a set number of these events a year.
Day ahead markets buy and sell electricity for delivery on the day after a trade takes place.
Demand buyback is commonly used in the United States and other markets so customers can participate in demand response if they don’t want to commit to interruptible contracts or direct control programs. Customers in demand buyback programs will respond on a day-ahead basis to payment offers from suppliers in return for a cut in the customer’s demand.
Demand reduction is a change in consumer behaviour to reduce the amount of energy consumed, for example through switching off lights when they are not needed.
Demand side participation (DSP) is when consumers make decisions regarding the quantity and timing of their electricity consumption in line with the value they place on using electricity services. Demand side participation in Australia’s national electricity market is key to delivering more affordable energy. If consumers make informed choices about the quantity and timing of their electricity use, they can reduce demand when prices are higher which can lead to less money being spent on poles and wires; as long as reduced demand happens at the right time and place. Demand side participation options are available to consumers (or to intermediaries acting on behalf of consumers) to reduce or manage their electricity use. Examples include peak shifting, electricity conservation, fuel switching, utilisation of distributed generation and energy efficiency.
Demand side response (DSR) is an active, short-term reduction in electricity demand by consumers who decide to respond to price signals throughout the day by shifting their electricity use to another period, or to use another type of generation, or to simply not use electricity at specific times.
Distributed generation (also called embedded generation) comes from electricity generators which are connected to the distribution network close to load/centres of demand. It includes co-generation units, back-up generation or renewable energy generators, including residential solar. Distributed generation in the demand side participation context can be located on consumer premises that may or may not be connected to a distribution network. It excludes standalone and scheduled generators and generation which are connected to the transmission network.
Efficient demand side participation refers to consumer actions made independently or through an intermediary, to manage or reduce electricity consumption in order to receive a benefit like lower electricity costs. These decisions are efficient when the received benefit is greater than the loss in value incurred by consumers as a result of these decisions to change their consumption.
Embedded generation (see distributed generation).
Energy efficiency is achieved when the same amount of energy can produce increased outcomes or when using less energy produces the same outcomes.
Energy intensity is the measure of total primary energy use per unit of gross domestic product.
Energy unserved is the amount of electricity demand each year that cannot be met due to insufficient supply.
Feed-in tariff is a type of subsidy scheme that provides revenue support to selected generators eg specific technologies like solar panels.
Forward markets buy and sell electricity for delivery at a future date eg month, season or year ahead.
Inclining block tariffs are electricity charges that have a price for consumption up to a specified level over a specified period, and then another price for consumption above the specified level.
Inertia is the ability of the power system to resist changes in frequency before cascading instability causes widespread blackouts. Inertia is provided by spinning generators, motors and other devices that are synchronised to the frequency of the system. Historically in the national electricity market plentiful inertia has been provided by synchronous generators, such as coal and gas-fired power stations and hydro plant. Non-synchronous generation technologies such as wind turbines and photo-voltaic panels are not synchronised to the grid and currently have low or no physical inertia.
Interoperability describes the ability of two or more networks, systems, devices, applications, or components to share and readily use digital information securely and effectively.
Interruptible electricity tariffs offer a lower service level for electricity supply in exchange for a lower price. Under the terms of this type of contract, electricity retailers or network businesses can interrupt the customer’s general supply to help balance the system in times of peak demand.
Liquidity is the level of trading created by the number of buyer and sellers willing to trade in the energy market. A highly liquid market has many traders. A market with low liquidity does not have much action. Liquidity enables companies to quickly buy or sell a product without causing a significant change in its price and without incurring significant transaction costs. Liquidity gives market participants confidence in traded prices. This in turn informs investment decisions and can help facilitate new entry.
Managed load services are the electrical loads managed by a third party. Typically, these loads are not separately metered and may not involve tariff arrangements separate from the general supply tariff. An example of a managed load is a signal to adjust an air-conditioning thermostat setting up or down from the temperature set by the customer.
Marginal cost is an economic term that describes the cost of an additional unit or the extra cost in relation to the baseline.
Market conditions describe the features that must be present in so everyone in the market can make informed decisions on what to produce or buy. They include information, pricing structures, and technology.
Market and regulatory arrangements are mechanisms that facilitate market conditions. They include laws, regulations, commercial arrangements and incentives that influence behaviour and inform choices of consumers and businesses.
Market offer contracts have terms and conditions which must adhere to laws, such as consumer protection. Outside of these minimum requirements, retailers have flexibility in how they design their offers in response to consumer preferences and retail market conditions. Generally, the terms of market offer contracts vary from standing offer contracts and could include incentives, different billing periods, and additional fees and charges for flexible service arrangements. See standing offer contracts.
National electricity market (NEM) is the wholesale market for the supply of electricity in all states of Australia except Western Australia and the Northern Territory. The output of all electricity generators is aggregated in a pool and supplied as needed to meet demand according to rules set by the AEMC. It is the world’s longest interconnected power system, from north Queensland to South Australia. The NEM is a market in transition – moving from predominantly large-scale synchronous generation to greater amounts of smaller, distributed, and intermittent non-synchronous generation.
Network pricing is the regulated network component of your energy bill. The other major components are competitive generation and retail components
Network pricing signals are built into the structure of a network tariff and designed to encourage a specific customer response. The customer’s retail tariff may amplify, absorb or simply pass through the network price signal.
Peak load or peak demand are terms which are used interchangeably to denote the maximum power requirement of a system at a given time; or the amount of power required to supply customers at times when need is greatest. They can refer either to the load at a given moment or to averaged load over a given period of time.
Rate of change of frequency (ROCOF) is the amount of time that is available to arrest a change in frequency before it moves outside permitted operating limits.
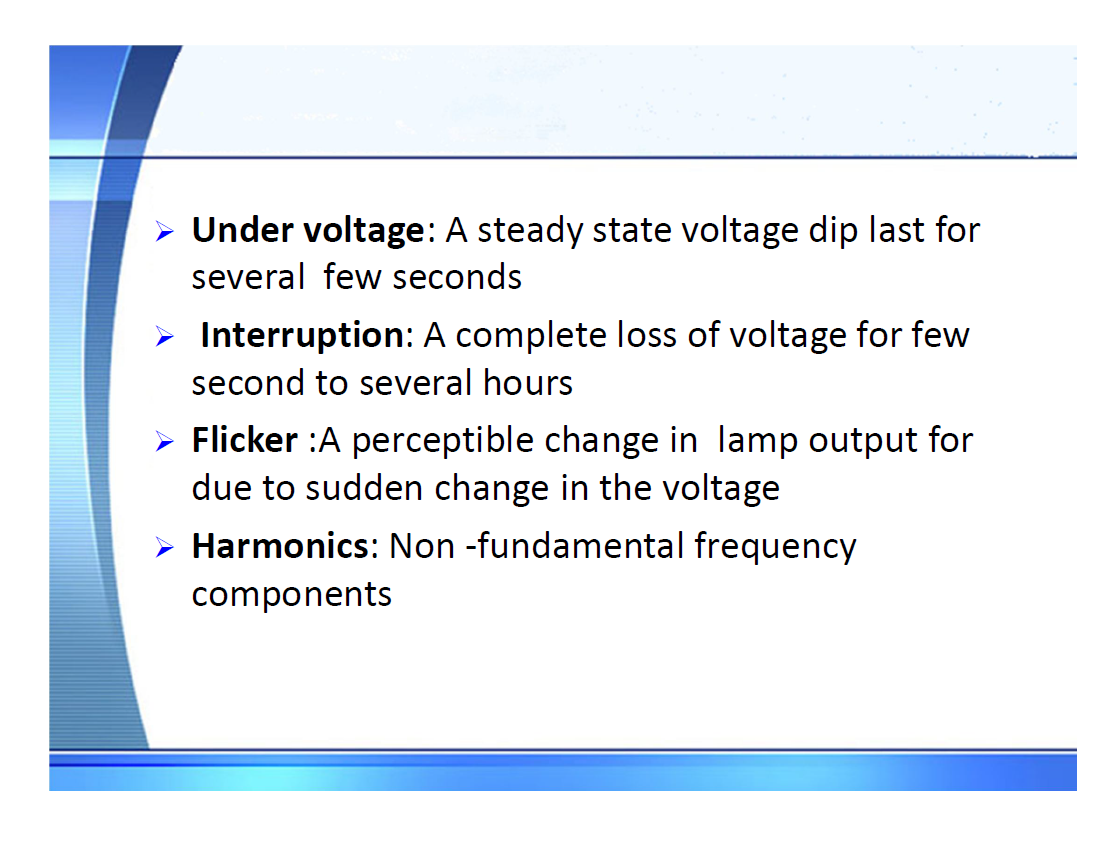
Reliability is the extent to which customers have a continuous electricity supply. Interruptions to continuous supply can be of varying duration from fractions of a second to several hours, depending on the cause and what has to be done to restore supply. Reliability in the power system means there is enough capacity (generation and network poles and wires) to supply customer demand.
Reliability events are caused by insufficient generation or network capacity to meet consumer demand. Reliability events due to insufficient generation and interconnector capacity are usually predicted ahead of time by supply and demand forecasting.
Security in the power system relates to the physical stability of the system. The power system is secure when technical parameters such as voltage and frequency are maintained within defined limits. To maintain frequency the power system has to instantaneously balance electricity supply against demand.
Security events are caused by sudden equipment failure (often associated with extreme weather or bushfires) that results in the system operating outside its defined technical limits.
Smart meters measure electricity consumption on an interval basis and can be read remotely with a smart meter management system.
Smart metering technology includes both the smart meter itself as well as IT management and communication systems that bring the consumer’s premises within the scope of the electricity network’s automated control systems (upstream functionality); and provide customers with an increased capacity to manage their electricity consumption with in-house control systems that connect to the meter.
Spinning reserve is the extra generating capacity that is available by increasing the power output of generators that are already generating electricity into the network.
Standing offer contracts can be found in jurisdictions where retail prices are still regulated by jurisdictional regulators or governments. Consumers may also be on a standing offer by default if they have not shopped around for their electricity. They general provide benchmark prices against which retailers make discounted market offers.
System strength is a measure of the electrical current that would flow into a fault at a given point in the power system. Reduced system strength in certain areas of the network may mean that generators are no longer able to meet technical standards and may be unable to remain connected to the power system at certain times.
Thermal storage typically involves the use of chillers to create ice during off-peak hours that is then melted during peak hours to offset air conditioning load. Chillers are installed only at larger load sources due to costs and economies of scale.
Time of use relates to a type of tariff applied to electricity consumption rates that vary depending on the time of consumption; with the cost of electricity being highest in periods of peak demand.
Two-way communication meters can retrieve data at a distance like usage, network and supply quality, damage, network or meter status and non-metrological data and then make the information available to service providers. They enable service providers to remotely configure metering systems, and to implement firmware/software updates. It is also possible for suppliers to send information to customers’ smart meters.
Vulnerable customers are customers with limited capacity to pay their electricity bills.
Reference
https://www.aemc.gov.au/energy-system/energy-terminology