Published by Terry Chandler, A Power Quality Practitioner ™ for 30 years, Director of Engineering Power Quality Thailand LTD/Power Quality Inc. USA,Consultant for Dranetz Corporation USA (Asia business unit General manager)

Harmonics defined by multiple standards around the world.
- IEC 61000-4-7 Class I defines harmonics and how to measure them.
- IEEE 519-2014 defines harmonic limits.
- This paper is focused on the measurement technique, the accuracy of the measurement and identifying the source of the harmonics in a repeatable, industry recognized method.
Why do we need to measure harmonics?
- Some local regulations require documented harmonic levels and maximum allowable harmonics
- Many countries/states/city/electric utilities have these regulations
- Electrical system issues related to harmonics:
- Overheating transformers
- Overheating neutrals
- Power Factor Capacitor failures
- Notching in the sinewave causes high frequency interference
- Mystery breaker tripping
- Transformer or panel audible noise
- Unexplained electrical system interference and operations.
- Low Power Factor
Measurement techniques are documented in detail by IEC 61000-4-30 class A Edition 3
- IEC 61000-4-7 Class I standard (harmonics standard referenced)
- All modern PQ meters that are rated Class A measure harmonics to this standard.
- The instruments digitize the waveform and execute a FFT to calculate the harmonic values of THD and individual harmonics values The Harmonics FFT algorithm is specified exactly in the standard
- Harmonics are calculated on 10/12 cycle samples and must be GAPLESS. (Some instruments state 99.9% gapless??)
Harmonic Current Flow
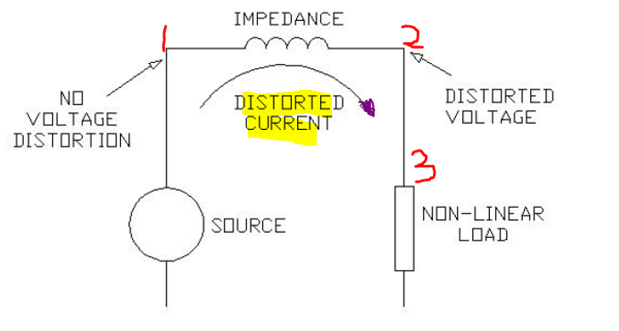
Harmonic Load Current
Impedance:
The AC circuit equivalent of resistance in DC circuits. Impedance is the opposition to AC current flow made up of the available circuit elements of resistance, capacitive reactance, and inductive reactance. Each AC current frequency (harmonic) may be subject to a different impedance in the circuit. – Mike Lowenstein is president of Harmonics Ltd., Monroe, Conn.
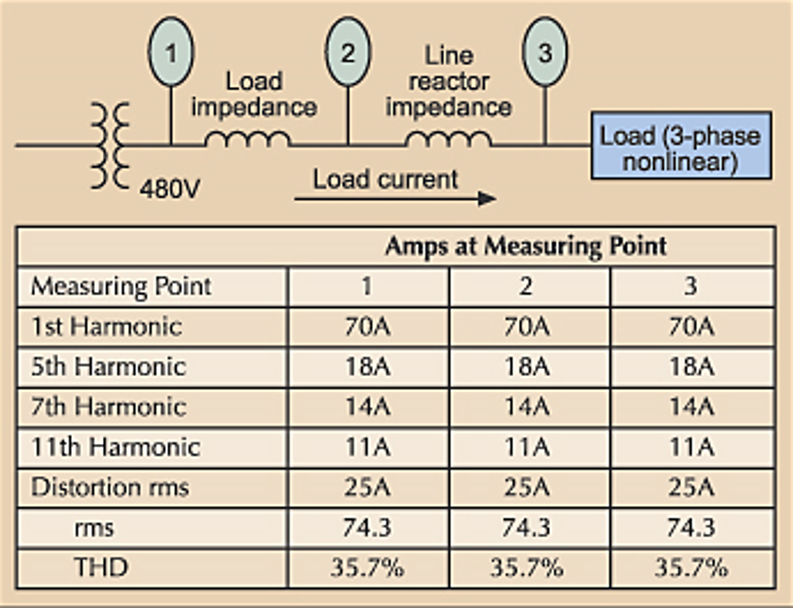
Voltage Distortion (result of current)
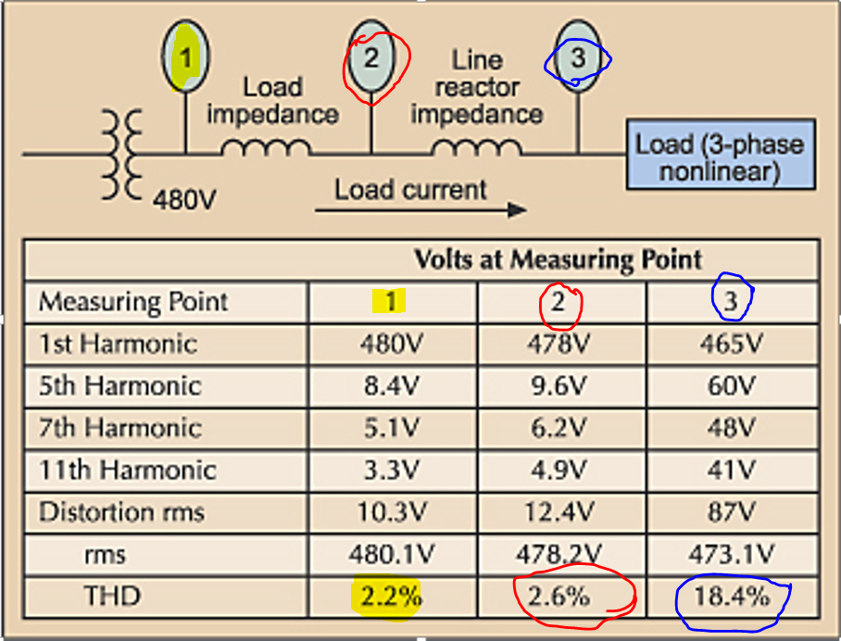
Note : the distorted current is constant the voltage distortion changes based on the Measurement point.
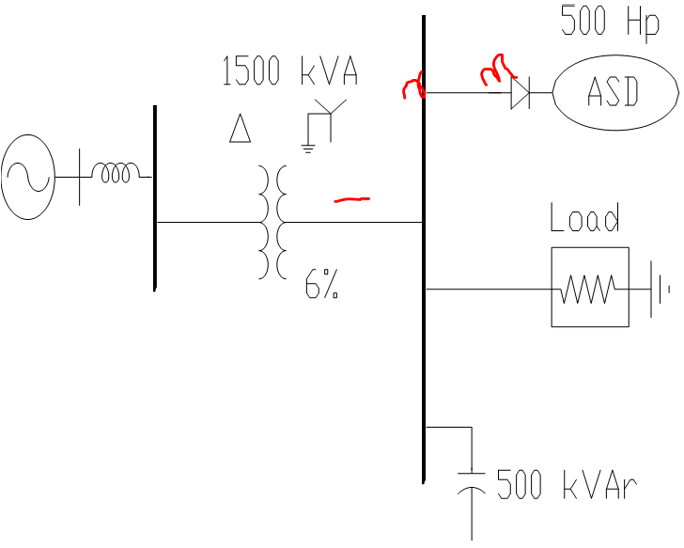
Harmonic Flow on Feeders
Normal path:

Figure 5: Harmonic currents tend to flow from the harmonic source (nonlinear load) into the utility source because it is the lowest impedance.
Flow Path Altered by Capacitor – II
- Adding a capacitor causes current to flow in abnormal paths

Monitoring for Harmonic Studies
- How long to monitor
- What to monitor “voltage, current and power harmonics”
- Where to monitor
- Monitoring during a test
Monitoring Duration
- The only constant in harmonics is the varying rate of change
- Monthly
- Weekly
- Daily
- Hourly
- By the minute
- By the second
- By the cycle
- Data is needed for the amount of time it takes to clearly define the harmonic situation under ALL conditions.
How many simultaneous monitoring points? It depends on the situation and loads.
Is voltage distortion from the voltage or the current?
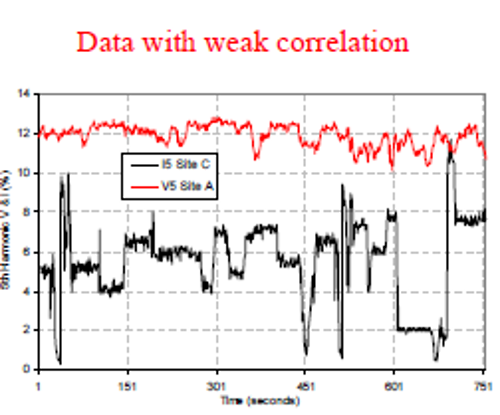
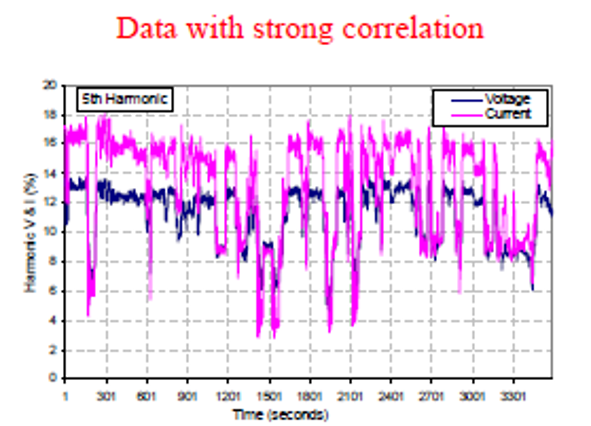
The variations are useful time is in seconds!!
Harmonic Power Flow
- Which direction is the harmonic power flowing? from the source to the load, or, from the load to the source?
- A controversial topic, the most commonly accepted practice is to measure the harmonic watts. The phase angle, or the relationship between the voltage and current for a particular harmonic. (note: NOT THD!)
- The same rules that would be applied to a pure sine wave of voltage and current (which has only a fundamental frequency component) would be applied here.
Harmonic current flow?
- Why is harmonic current flow is always indicated as from the non-linear load/s end towards the source end (“backwards” from normal load current flow) ?
- Jbartos (Electrical) 20 Apr 01 The nonlinear load is a source of harmonics. If electrical equivalent circuits are drawn, one for each harmonic frequency, the different frequency sources (harmonic frequency sources) will be located at the nonlinear load location and the harmonic currents will be flowing from it.
- This assumes a perfect source with no harmonic distortion!! In the real world of electrical networks, the source is not perfect. – Terry C.
- This assumes a perfect source with no harmonic distortion!! In the real world of electrical networks, the source is not perfect. – Terry C.
Measuring Harmonic Power Flow Low Voltage (Direct Connection)
- Sampling frequency
- (# of samples per cycle divided 2)
- Voltage resolution (What is the minimum voltage a meter can make with defined accuracy?)
- For example, if the 9th harmonic voltage is .1% of the 230v fundamental then actual voltage will be 0.23 Vrms. Most PQ meters minimum accuracy specification is 1vrms or 10 Vrms or a % of full scale at low levels.
- Current resolution of the meter. Specification is typically +/- 0.1% reading +/- 0.05% of full scale. So, with a full scale of 100.00 amps of 50 Hz current and a 9th harmonic of .1 %, the current value of the 9th harmonic would be 0.1 amp. But the measurement accuracy would be +/- (.05X10=.5amps!!)
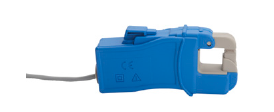
- Low voltage 10 amp
– Frequency response
– Low current accuracy (typical 10% to 90% rated)
CT’s – TR2510A

Measuring Harmonic Power Flow (in a transmission or distribution system)
- PQ meter capabilities (can it determine the phase angle of harmonic voltage and current?)
- Sample frequency, Voltage resolution, Current resolution
- PT
- Frequency response
- Voltage output resolution relative to instrument
- HV/Medium CT
- Frequency response
- Output current magnitude
- Low voltage CT
- Frequency response
- Output current magnitude
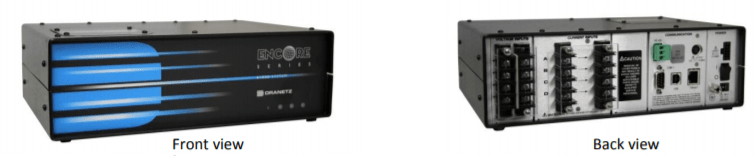
Typical PQ meter Voltage Accuracy
- Permanently installed (D-BMI 61K)
- 0 – 600V, 1000Vpk, AC/DC coupled
- RMS: 512 Samples/cycle, +/- 0.1% Reading, +/-0.05%FS, over 7KHz bandwidth
- IEC61000-4-30 Class A compliant
- Harmonics: IEC61000-4-7
- Flicker: IEC61000-4-15
- PQ: IEEE1159, IEEE519
PQ meter Current Accuracy (voltage input without I to V transducer)
- Range: 0 – 1.5V, DC coupled (AC/DC)
- RMS: 512 Samples/Cycle, +/- 0.1% Reading, +/-0.05%FS, 3KHz bandwidth
- IEC61000-4-30 Class A compliant
- Harmonics: IEC61000-4-7
- Flicker: IEC61000-4-15
- PQ: IEEE1159, IEEE519


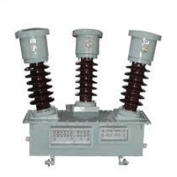
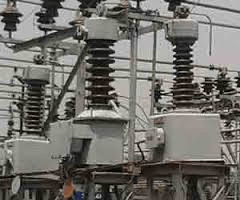
Medium Voltage or HV Voltage and Current Transducers
- Voltage transducers
- PT Potential Transformers (inductive)
- CVT Capacitive voltage transducer
- Resistive divider
- Current transducers
- Inductive
- Fiber optic
Voltage Transducers (PT or VT)
- Required to reduce the voltage level to safe to connect meter.
- CVT (Capacitive coupled)
- Inductive Transformer
- Resistor divider

Frequency Response Transformer Type PT (Typical?)
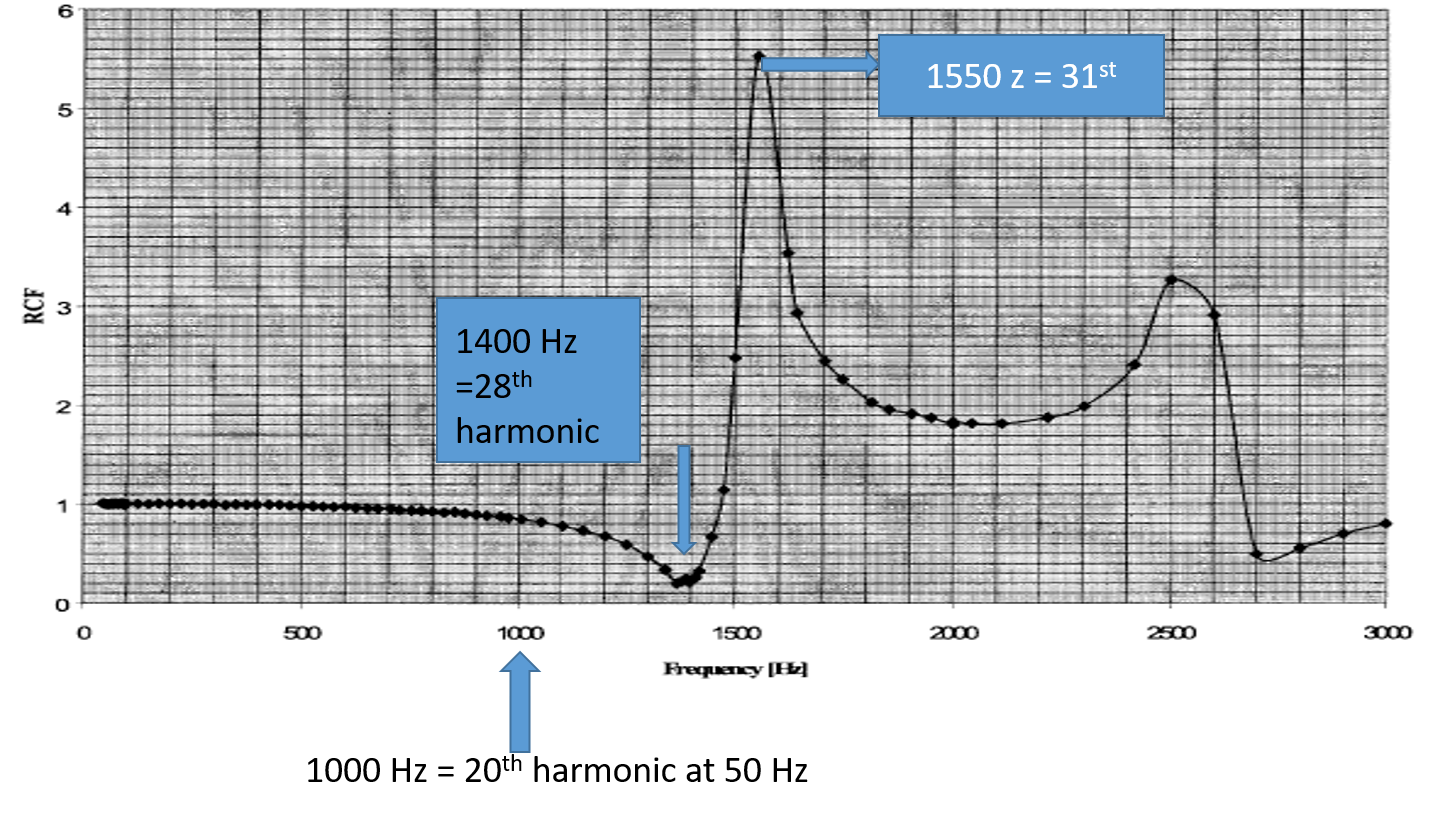
Transducer Output Value at Harmonic Frequencies
Example:
- VTHD Voltage Distortion of 2% at 110kV
Assume 50% of the THD is the 5th harmonic (1% 5th harmonic) 1 % of 110kV = 1.1kV of the 5th harmonic (250 hertz) / PT ratio 110kV to 100V divide by 1000.
Actual 5th harmonic voltage presented to instrument is 1.1 volt.
If 7th Voltage harmonic is 0.1% then 110/1000 = 0.1VAC is presented to voltage channel.
If 9th voltage harmonic is 0.01% .010 VAC is presented to the voltage channel.
Voltage channels are typically specified from 1 or 10vrms to 600v or 1000vrms.
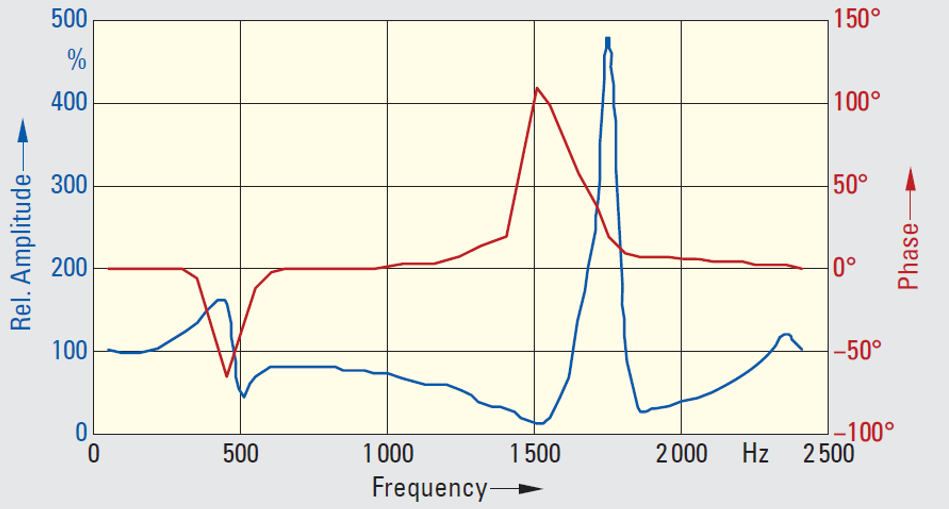
VT Errors at Range of Frequencies

Errors in Inductive Voltage Transformers PTs
HV/MV Inductive Current Transducers
- Accuracy and frequency response

Secondary Current Transducer
- Accuracy varies with frequency.
- Frequency response is not linear.
- Precision measurement of very low levels of harmonic power is limited by phase angle error of CT.
- Example, if primary current is 50% of full load. CT secondary current would be 50% of 1 or 5 amps. (0.5 or 2.5 amps). If 5th harmonic current is 1%, = 0.005 amps or 0.025 amps. Clamp on CT minimum rated current is 0.1 amp.


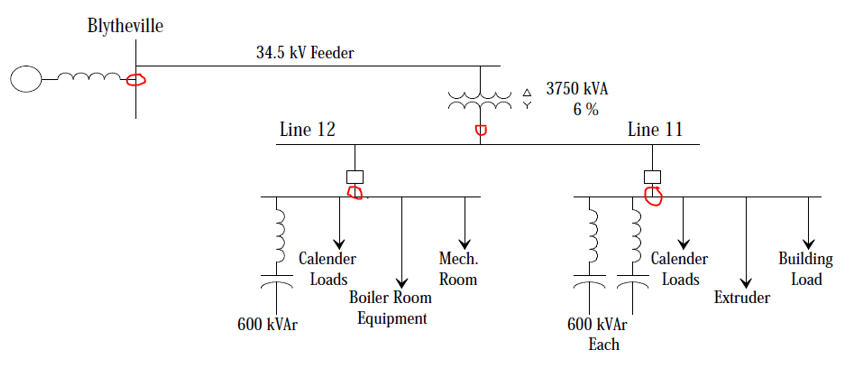
Is it possible to identify the harmonic source on distribution substation buss? YES! But it’s not easy and it is expensive.
- What is needed:
- PQ instruments on the buss CT and PT that can record the V harmonics, I harmonics with phase angles and periodically record the 10 cycle sample waveforms of at least 128 samples per cycle.
- PQ instruments on each feeder that is a significant load. (IE greater than 5%)
- Software that can post process the data to align the time stamps, calculate all harmonic parameters including power from the waveform samples.
- PQ engineering training to analyze the data.
- Patience!
Conclusions
- Monitoring and evaluating harmonics in electrical system is a complex task due to complexity of the measurements and interaction of the various loads.
- Determining the source of the harmonics on the transmission or medium voltage grid has additional complexity of the voltage and current transducers.
- With detailed simultaneous measurements of all feeders, PQ engineering and software it is possible to deduce the source of harmonics on a substation bus bar.
- The only constant in harmonics is the varying rate of change!
Contact the author TerryC@powerquality.co.th
If you can’t explain it to a 6th grader, you don’t understand it yourself ~ Albert Einstein

This is a very informative site. Keep up the great work.
LikeLike