Published by Terry Chandler, A Power Quality Practitioner ™ for +30 years,
Director of Engineering Power Quality Thailand LTD/Power Quality Inc. USA,
Consultant for Dranetz Corporation USA (Asia business Unit General Manager)
Contact TerryC@powerquality.org
What is Power Quality (PQ)?
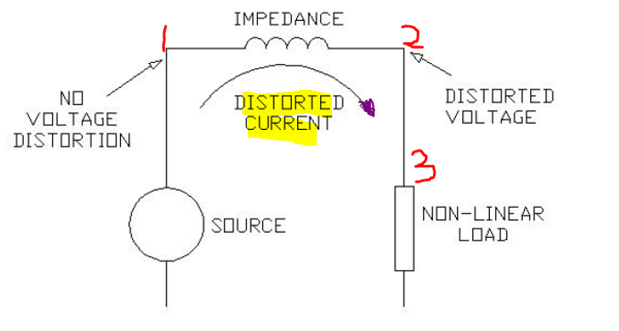
- The characteristics of the supply voltage and the electrical system that affect the performance of the load.
- The characteristics of the load that affect the electrical supply system and/or other loads. (TerryC. 1992)
What is Quality of Supply (QOS)?
- The characteristics of the supply voltage that affect the performance of the load.
- The characteristics of the electrical distribution system that affects the electrical loads. (Transformer size and distance to the loads)
Power Quality Definition?
- There are many more definitions from IEC, IEEE, Various PQ engineers and experts.
- PQ is a complex engineering & economic situation that is constantly changing due to technology and political environment changes. (TerryC. 2006)
PQ problems (costs) vs Power passing thru a semiconductor switch

Semiconductor Sales vs PQ

Power Reliability vs Power Quality
- Power Reliability is the presence of voltage at the meter point.
- Power Quality is the value of the voltage (and other PQ parameters) as a percent of nominal at the meter. – Mr. Phil Sarikas, Intel Corporation 4/97
Quality of Supply Parameters (Utility)
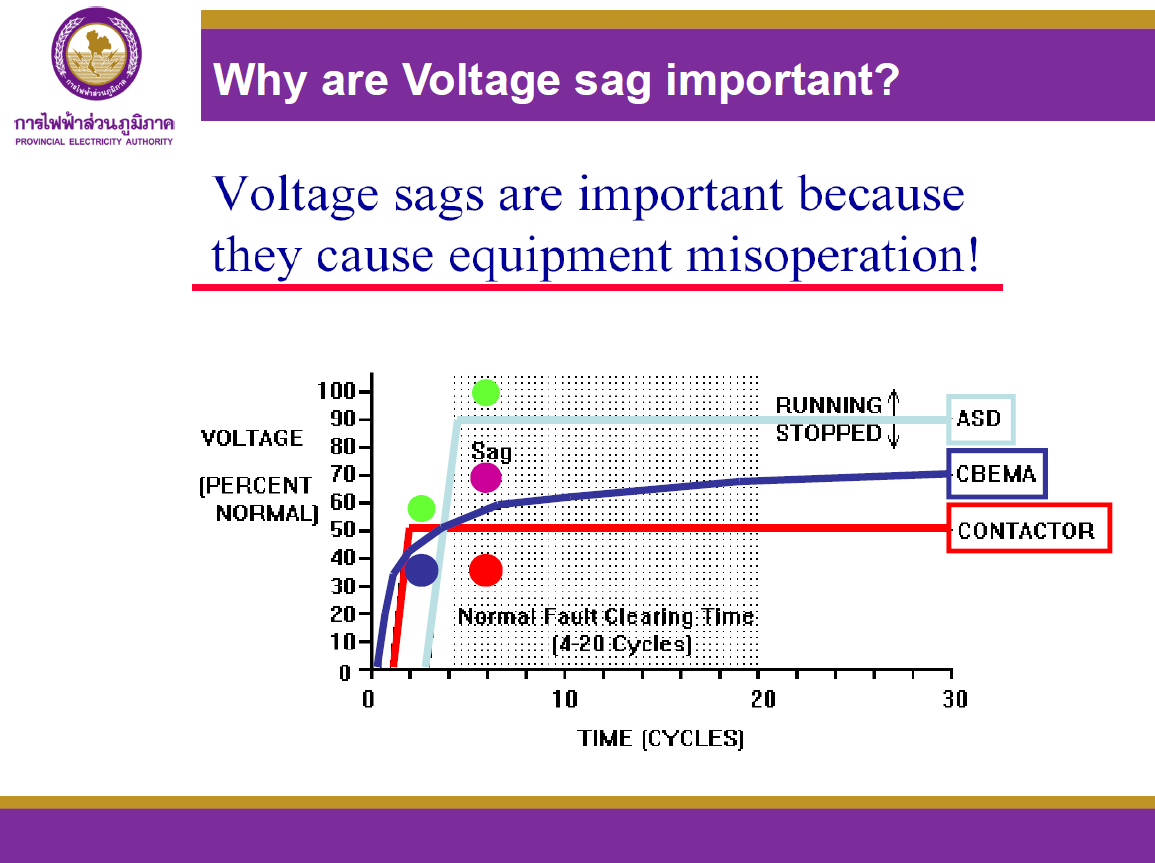
- RMS voltage, Sags (dips) and Surges (swells) – Disturbances
-
Voltage transients (slow, medium, and fast)
- Lightning and switching transients that damage sensitive electronic loads
- Lightning and switching transients that damage sensitive electronic loads
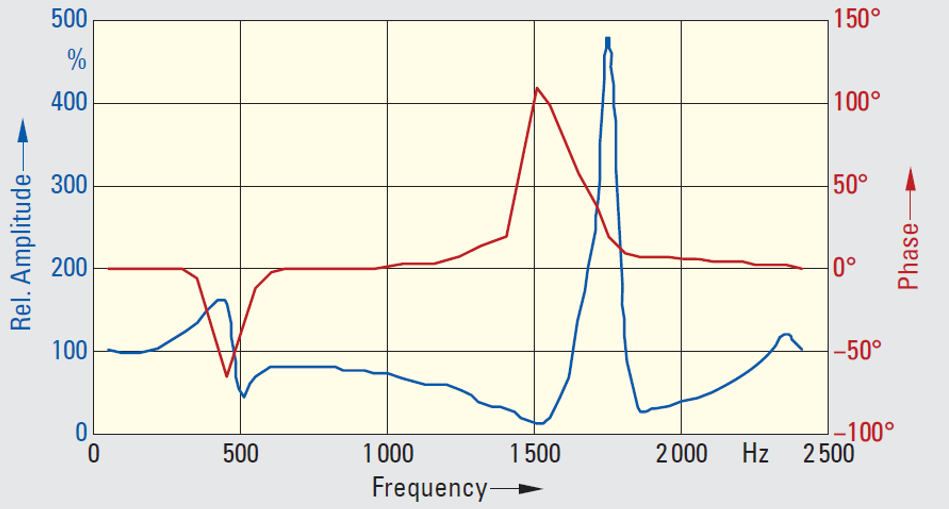
- Sinewave – wave shape-harmonics – System losses
- Voltage imbalance – phase differences – System losses
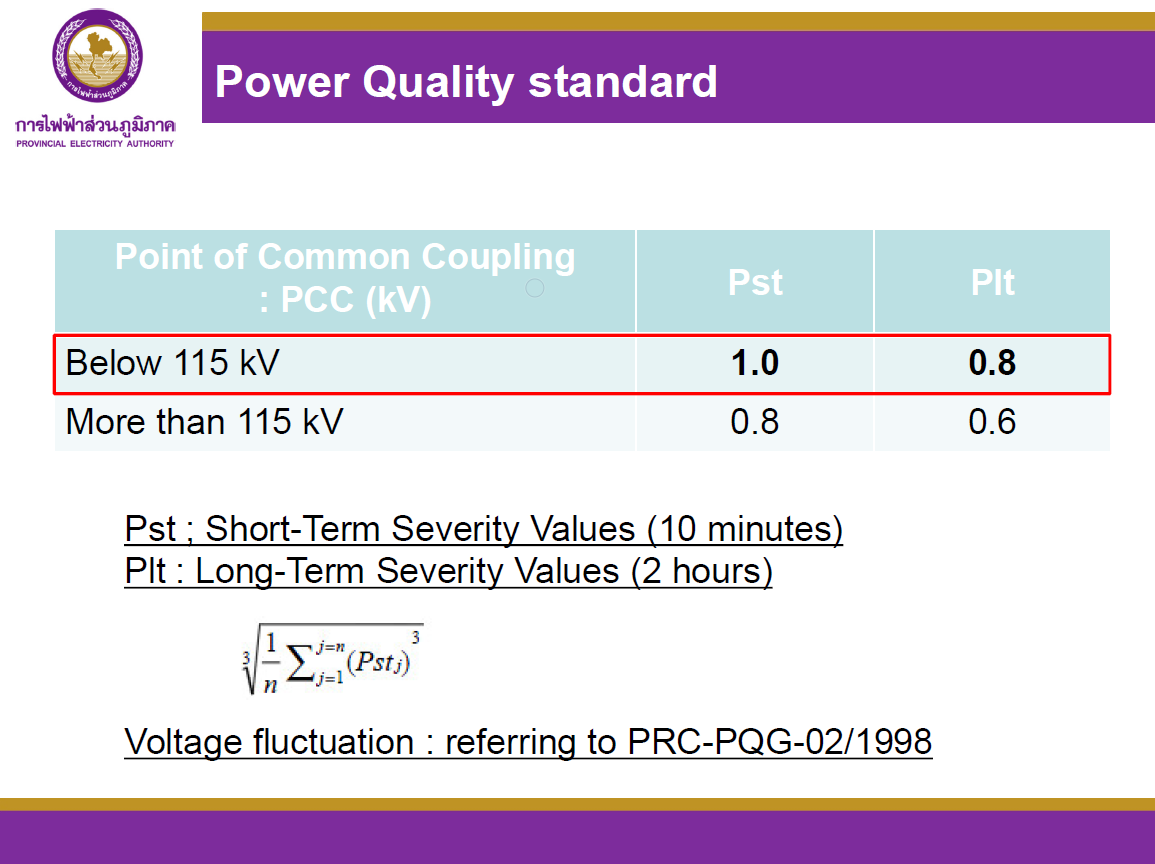
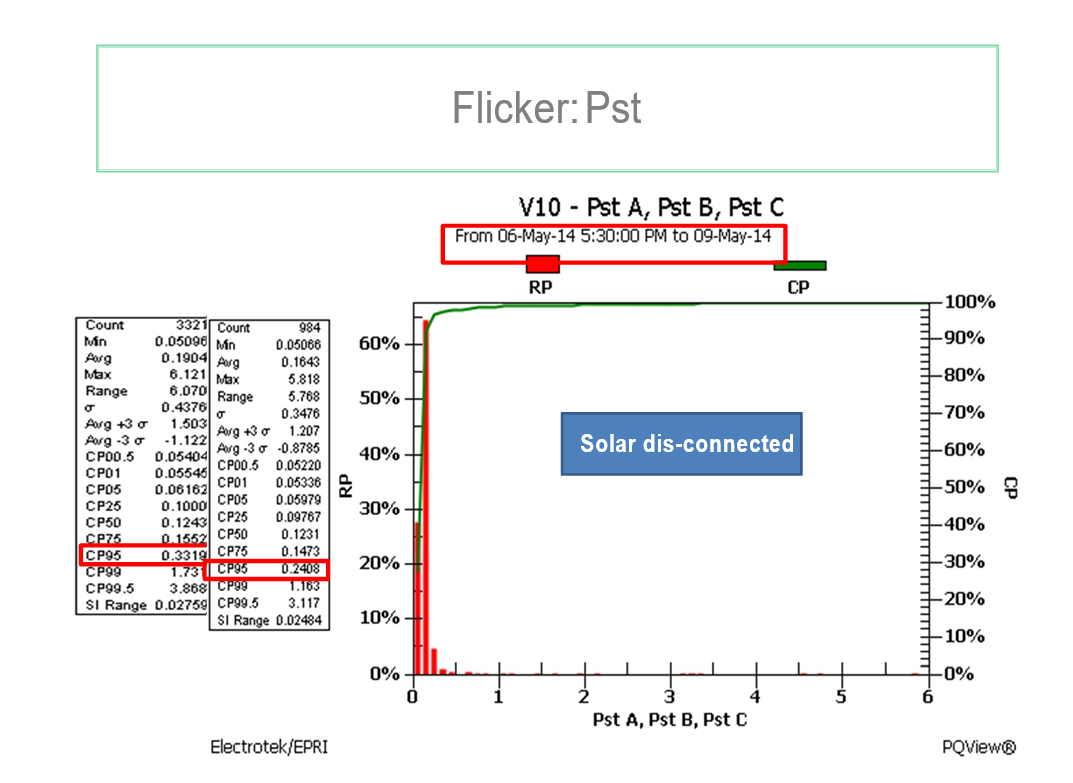
- Flicker- small periodic voltage variations at frequencies lower than ½ fundamental-The only parameter that affects people directly
- Frequency Variations
- Power Factor? System losses
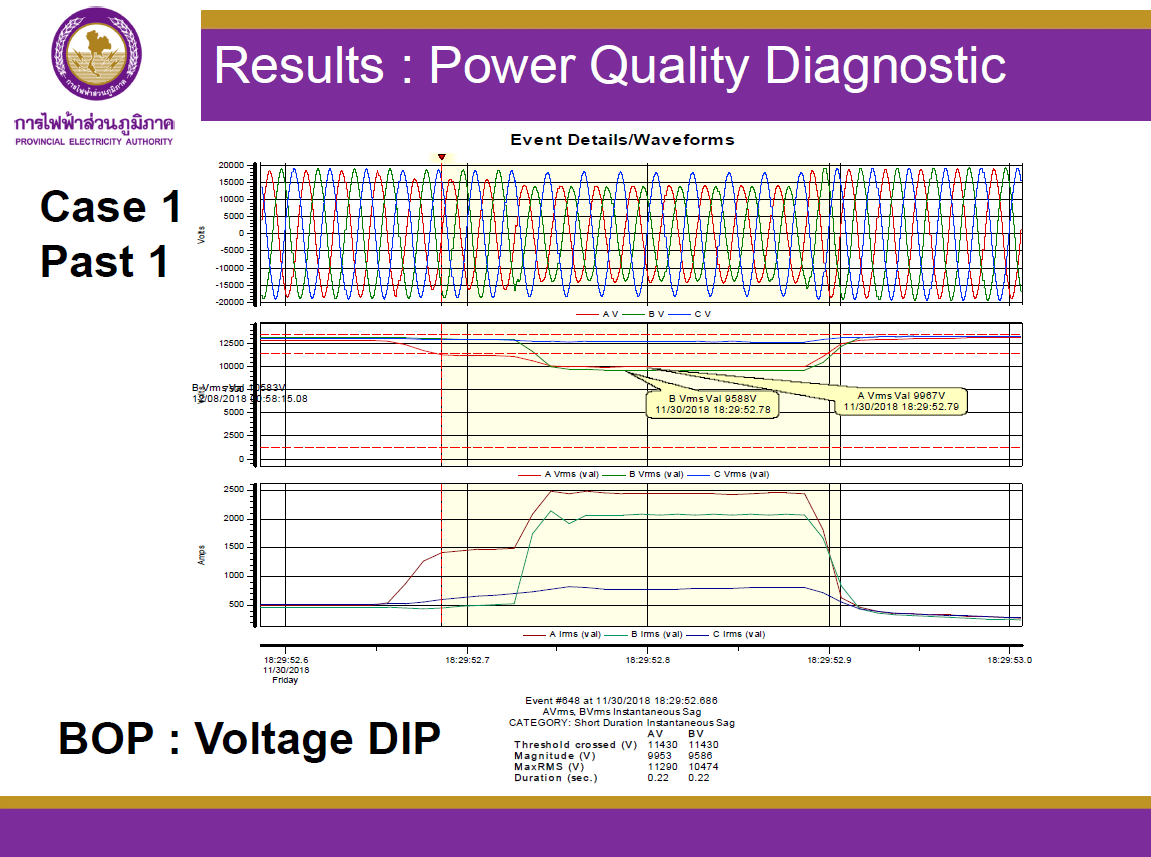
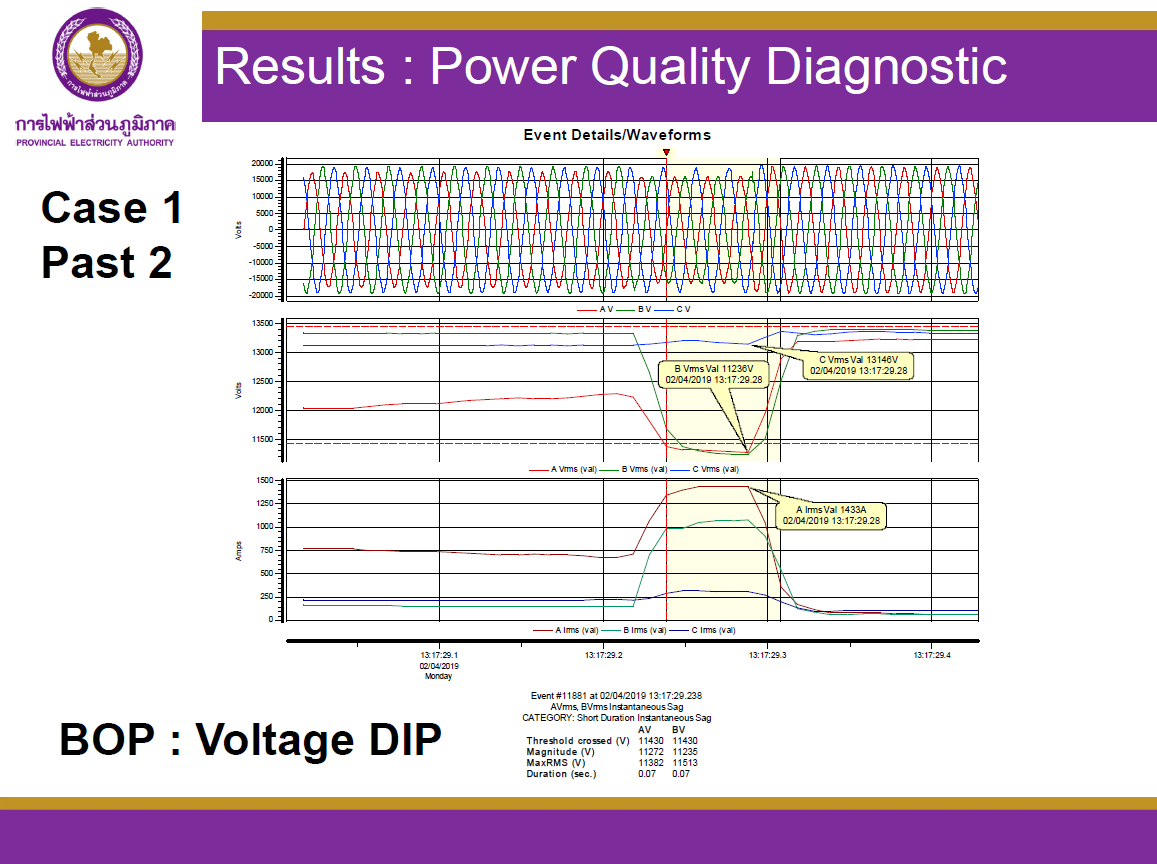
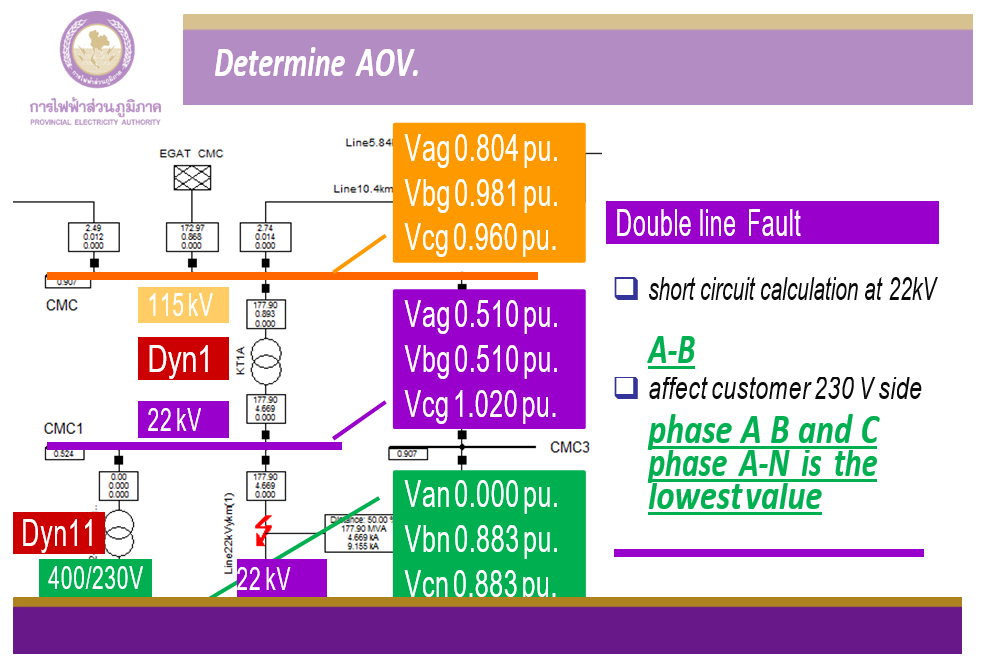
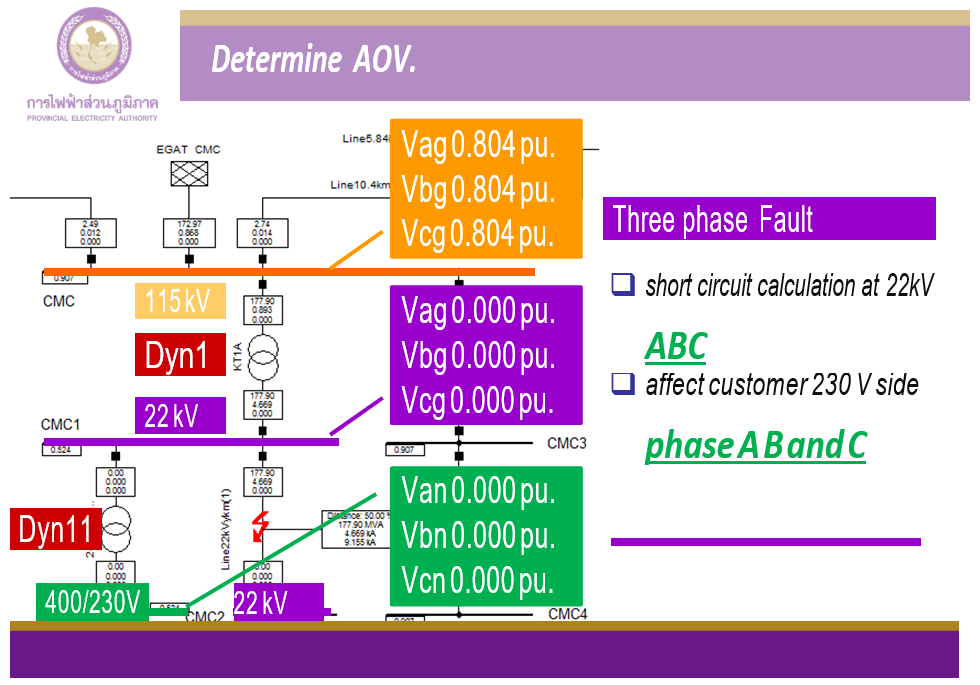
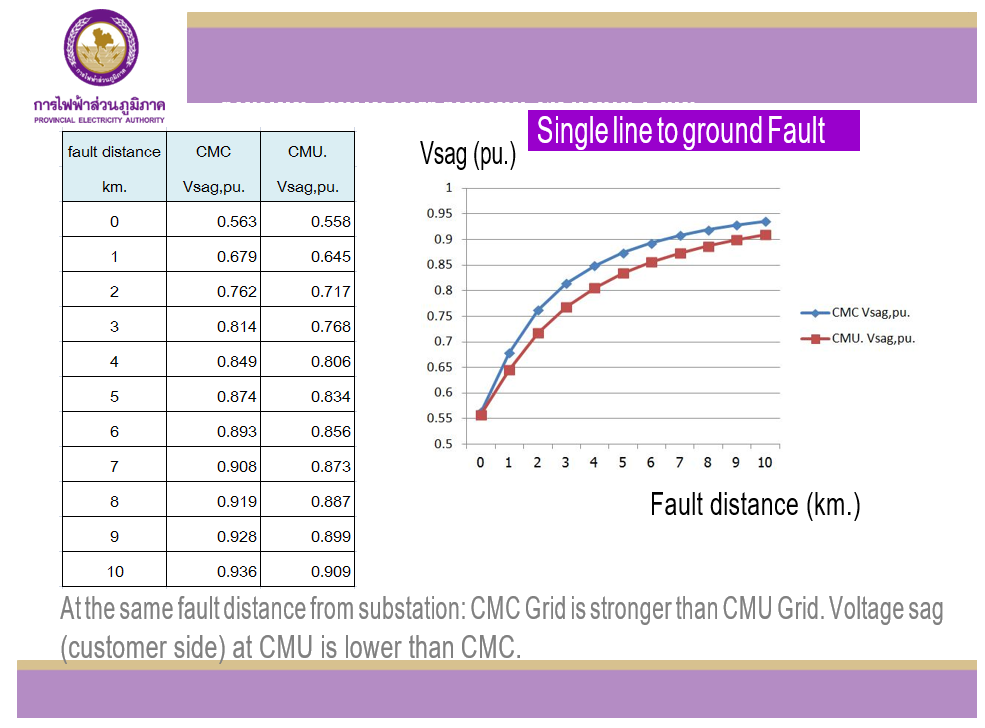
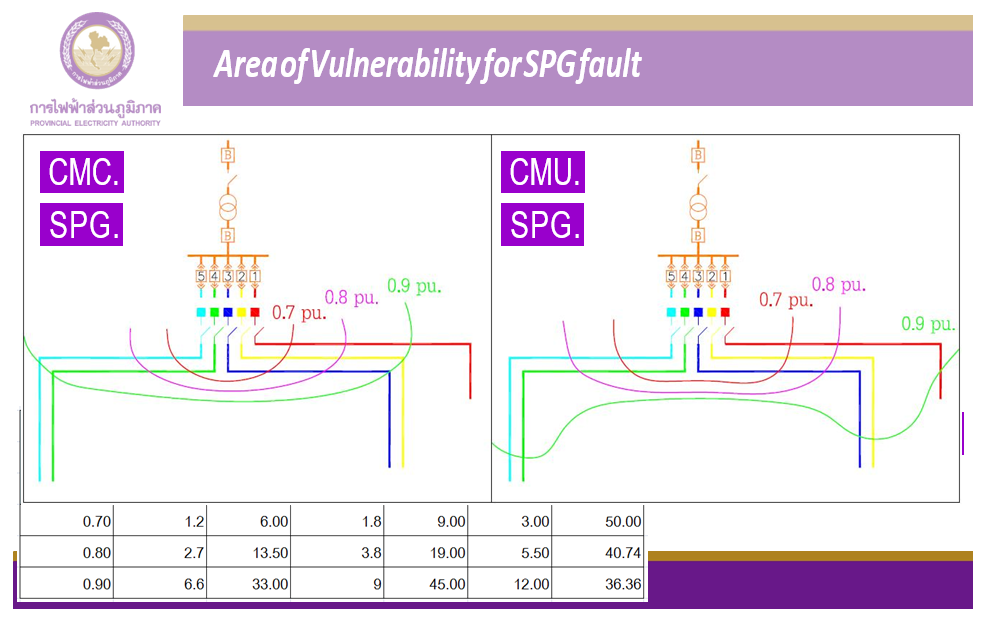
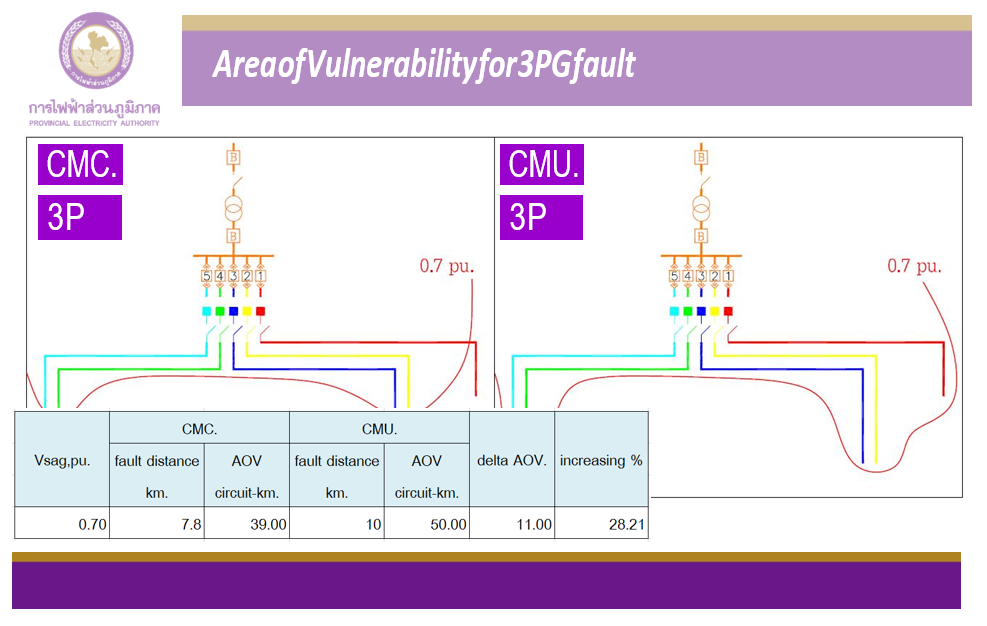
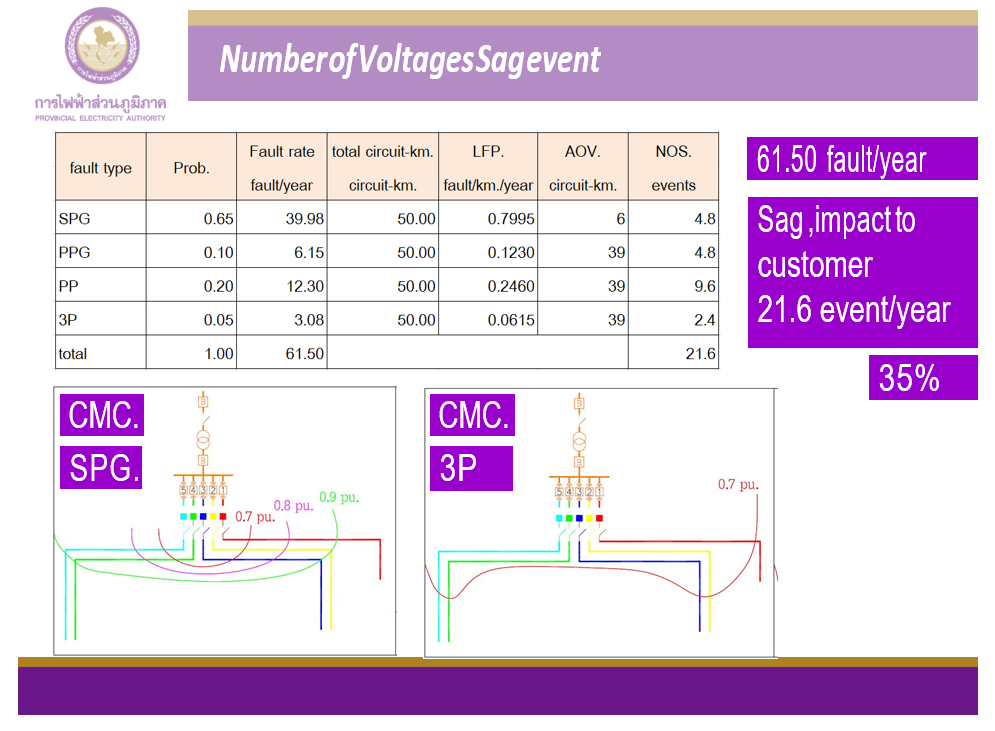
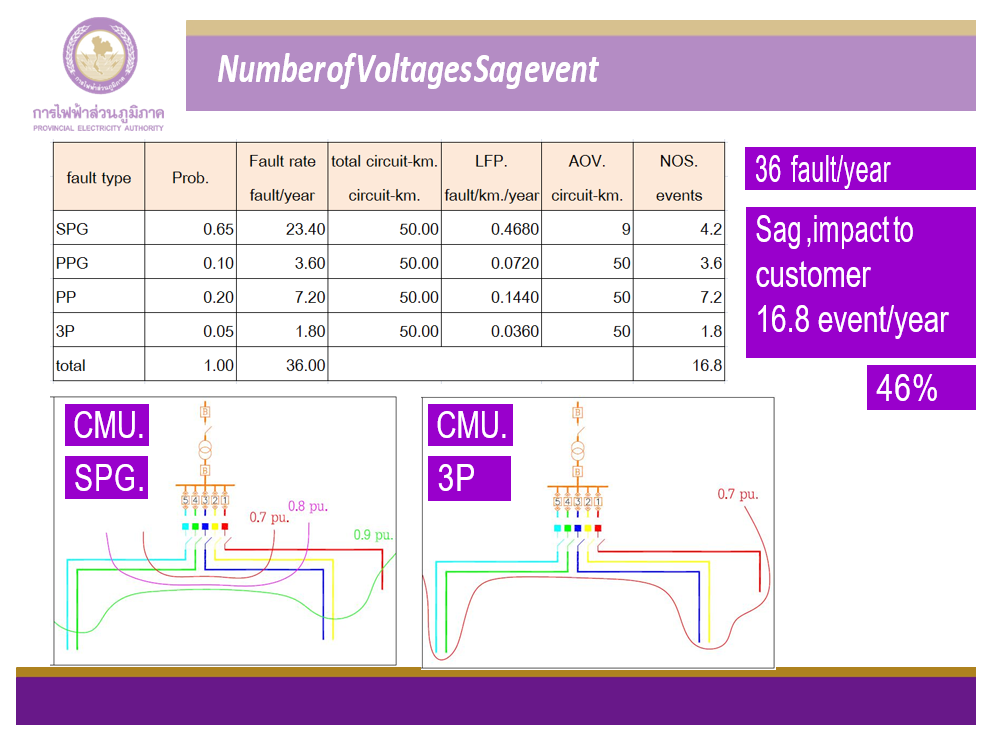
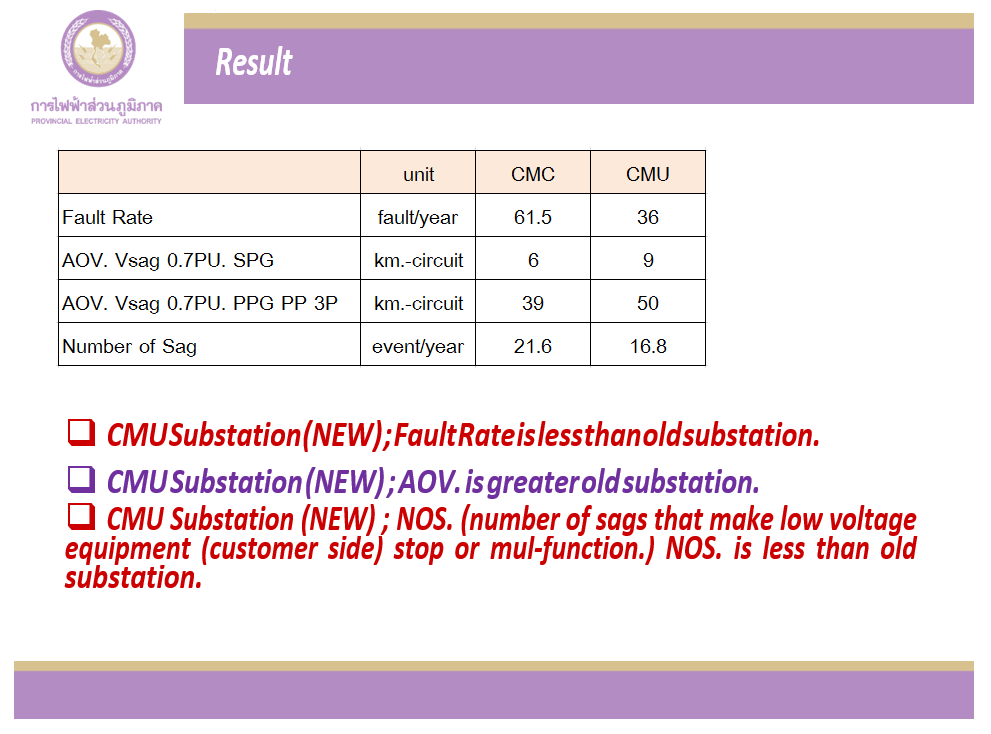
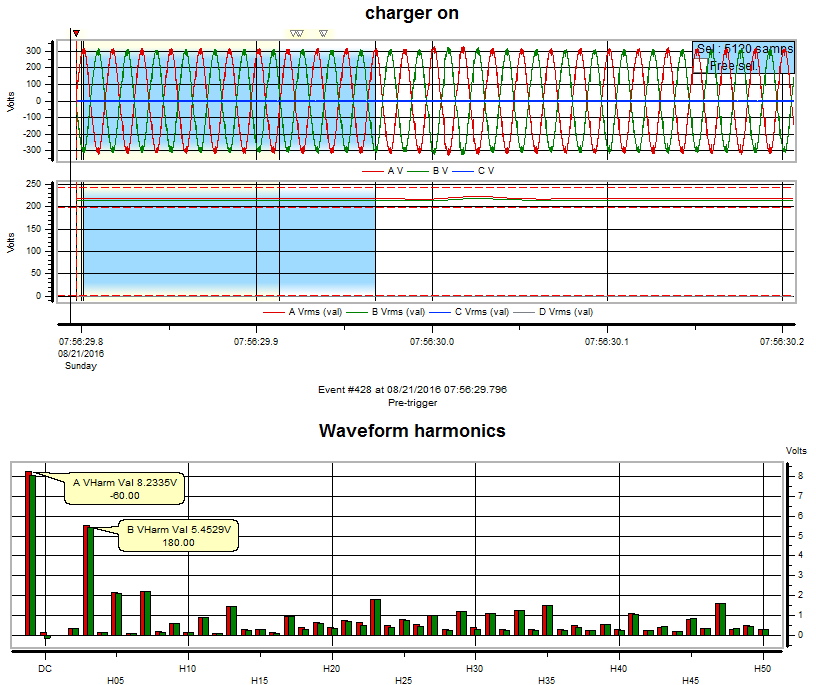
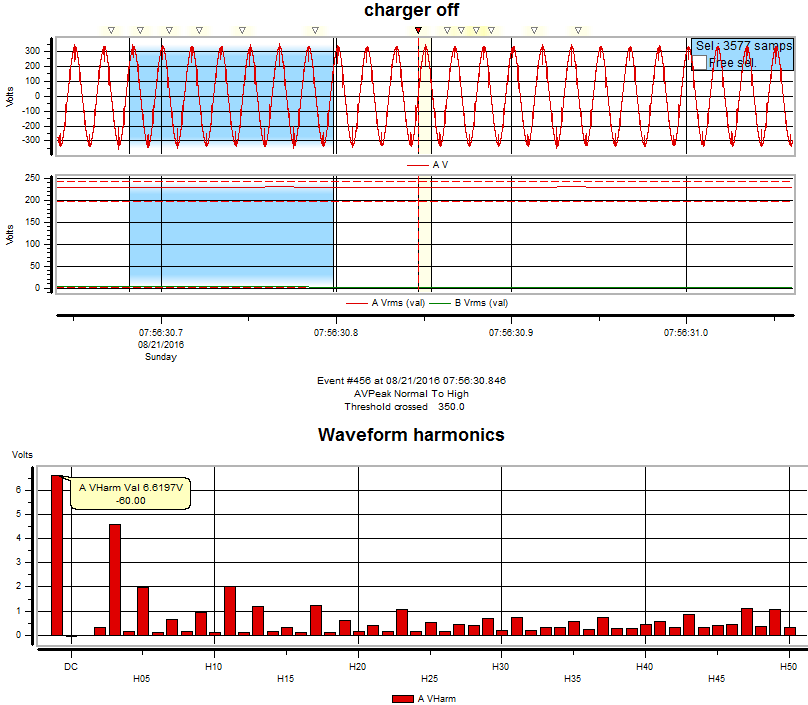
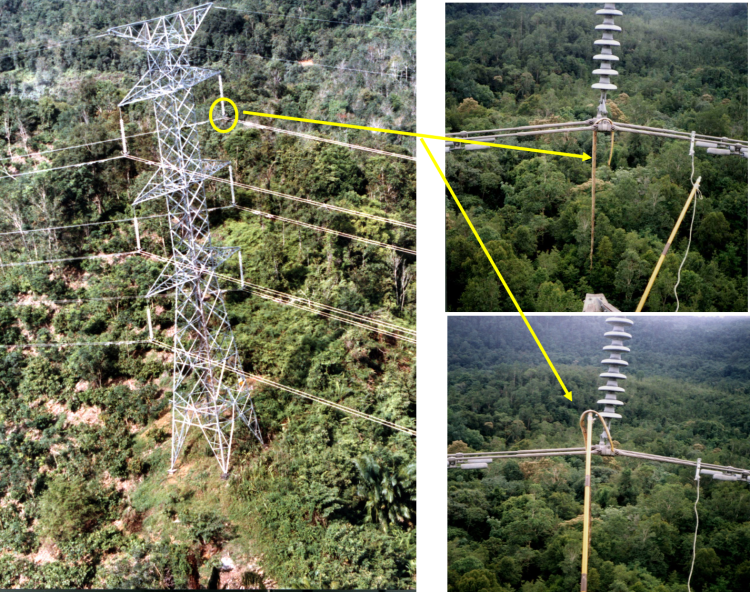
Source of most common voltage sag from utility distribution system or transmission or generation

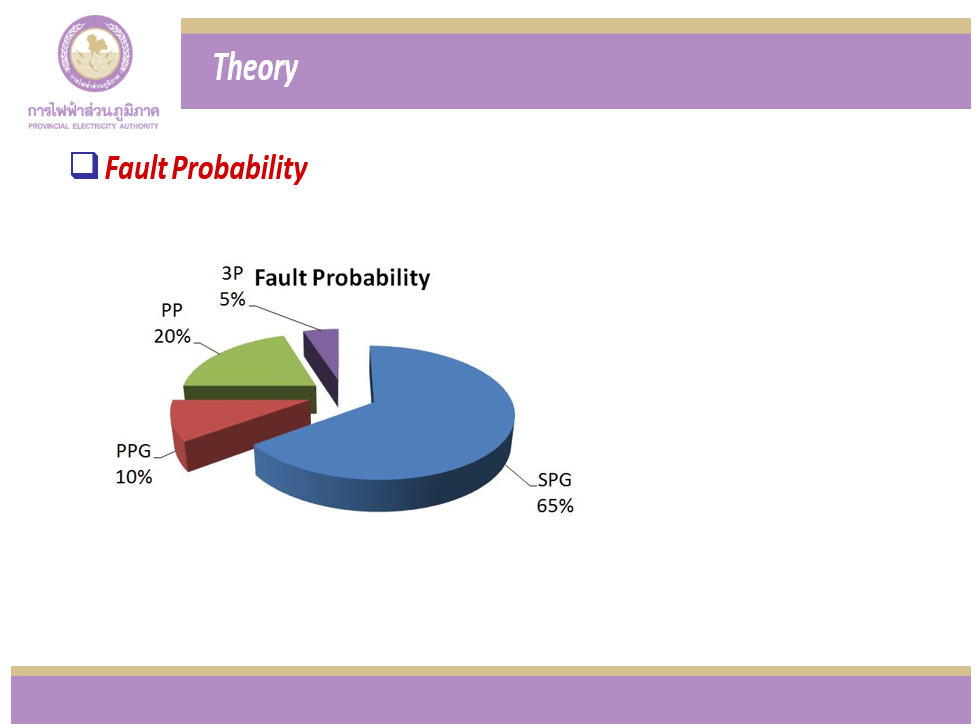
A fault on transmission system
Voltage Sag Example (QOS)

Power Quality Parameters User Side
- RMS voltage, Sag (dips) and surges (swells)
- Voltages transients (slow, fast, and extremely fast)
- Sinewave – wave shape – harmonics (Voltage and current)
- Voltage imbalance (phase imbalance) (Voltage and current)
-
Flicker- small periodic voltage variations at frequencies lower than ½ fundamental. (current)
- The only parameter that affects people directly
- The only parameter that affects people directly
- Internal electrical system design and construction.
- Grounding /Earthing internal. (Ground loops and current in the ground conductor.
- Waveshapes, Harmonics, Interharmonics (current)
Source of the PQ issues?
In PQI’s 30 years of experience and data shows:
- 80% of the PQ issues are on the customer side of the meter.
- 80% of the $ losses are caused by the 20% of the PQ issues from the utility side of the meter.
- Majority of the issues from utility are voltage sags/short outages, flicker and harmonics caused by other loads.
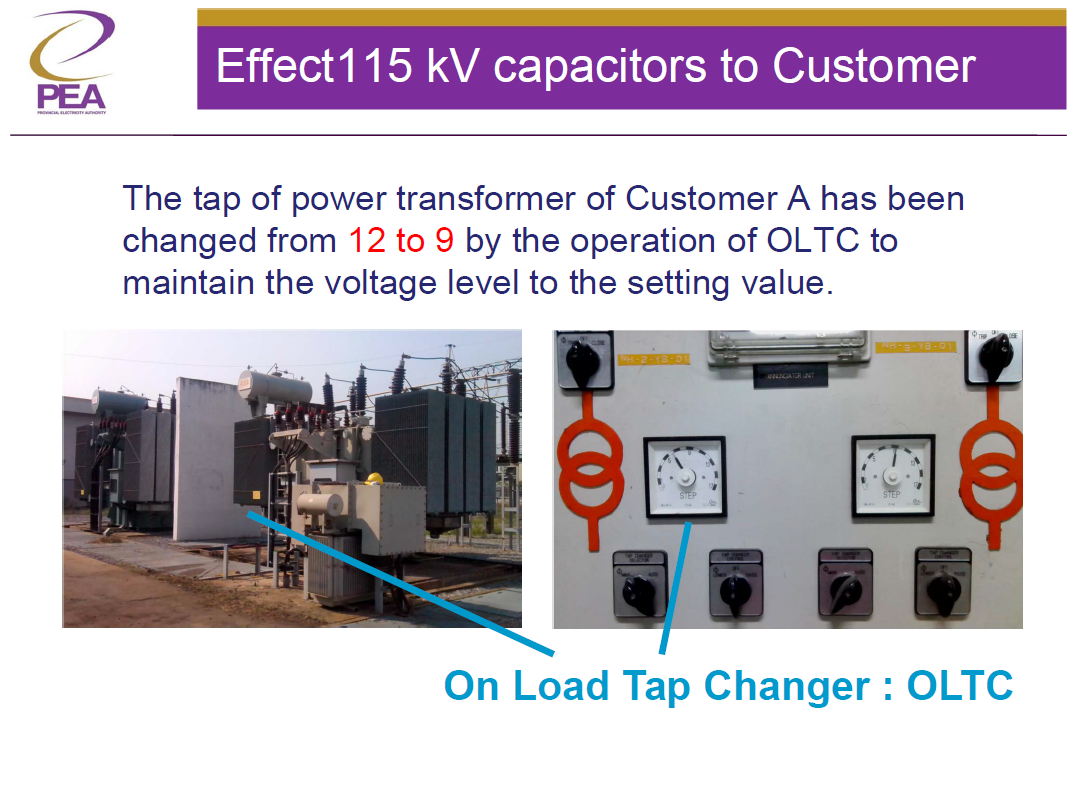
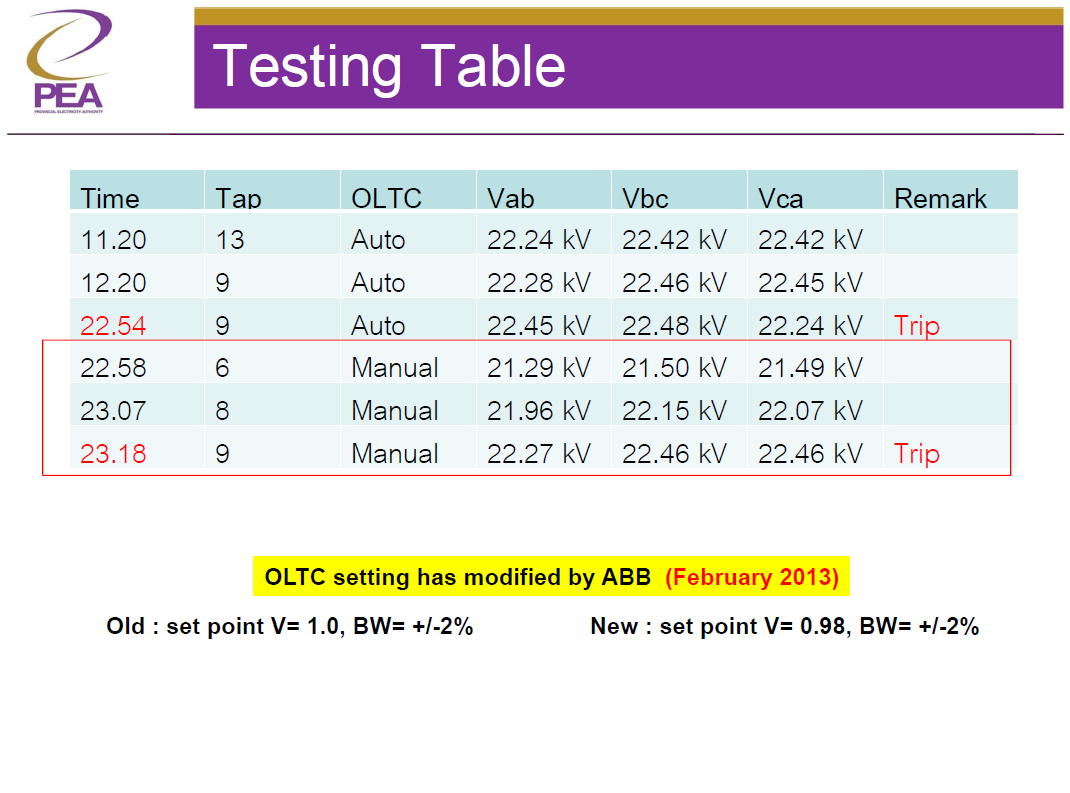
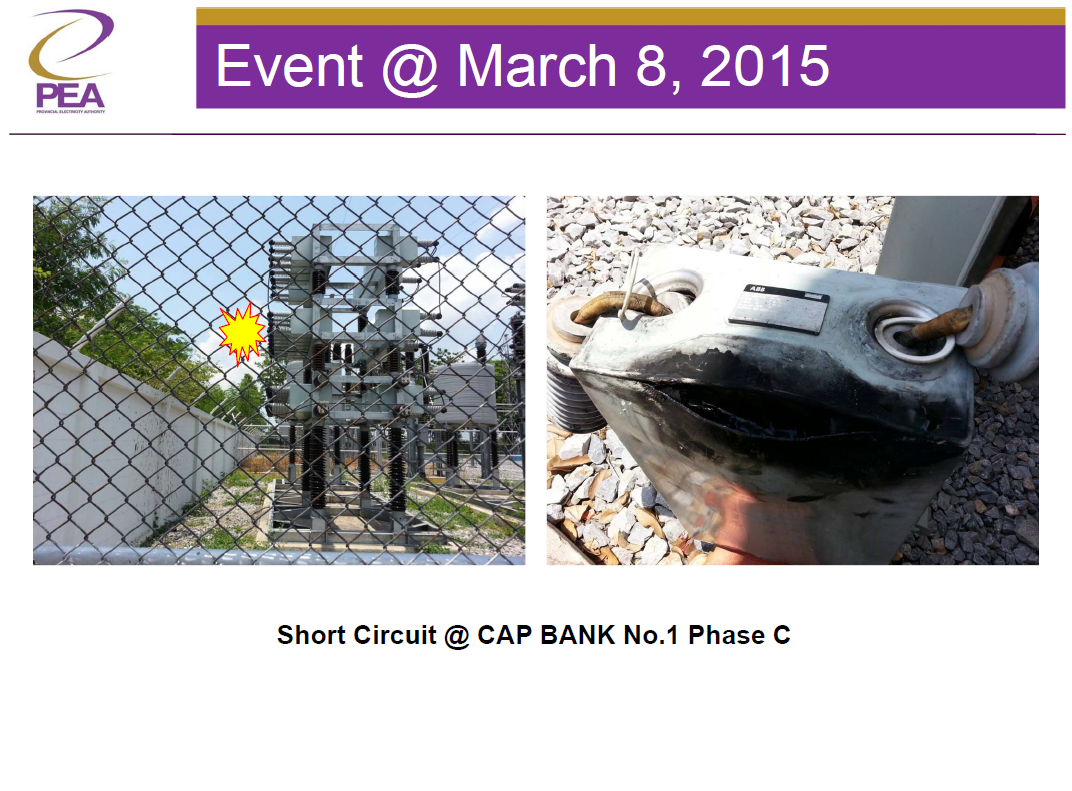
- Voltage transients include decaying ringwaves (PF cap switching)
- Flicker usually caused by steel mill loads but now maybe from wind turbines
Power Quality is a constantly changing situation of varying loads, varying generation types, varying weather.
- For the first 20 years it was the loads changing in sensitivity to normal electrical distribution operations.
- Loads changing from incandescent lamps and motors to new technologies and Invertor (VFD,VSD’s) motor drives
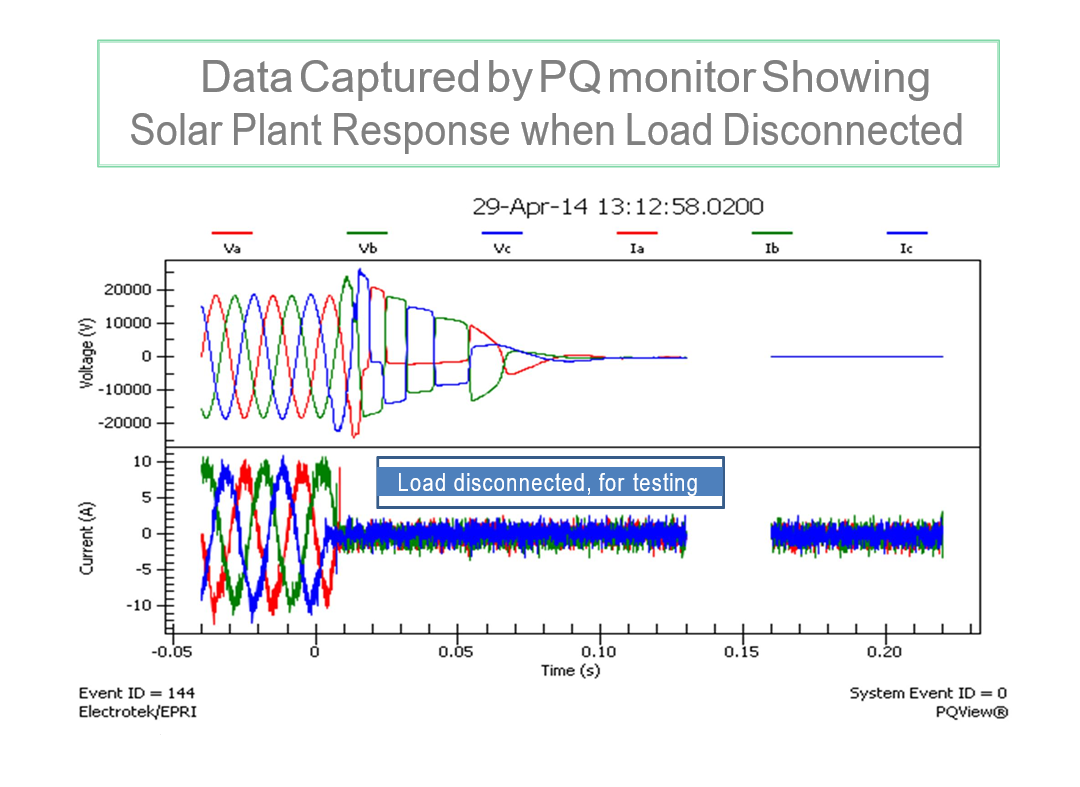
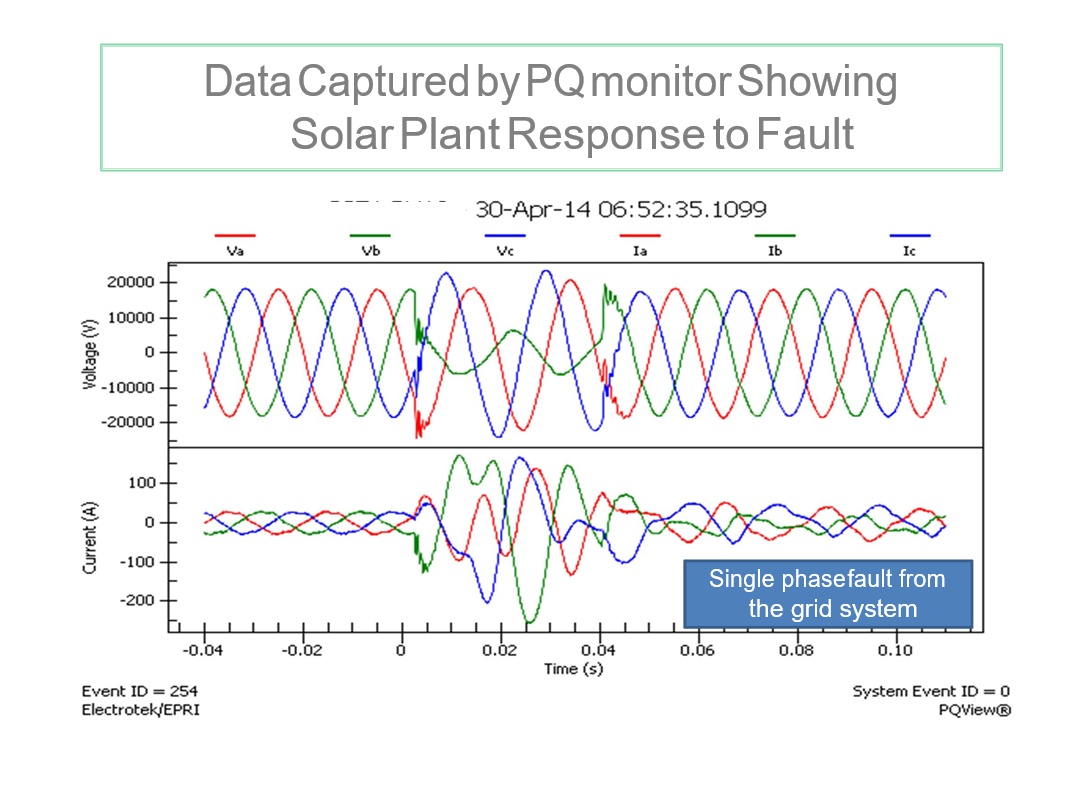
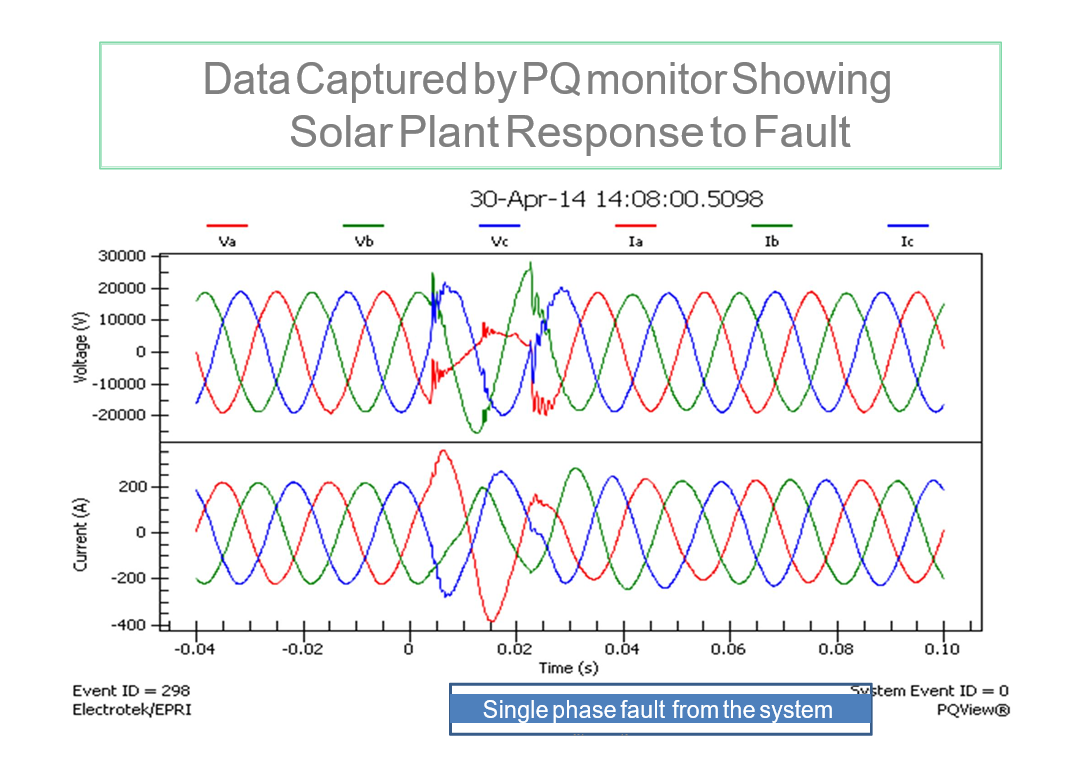
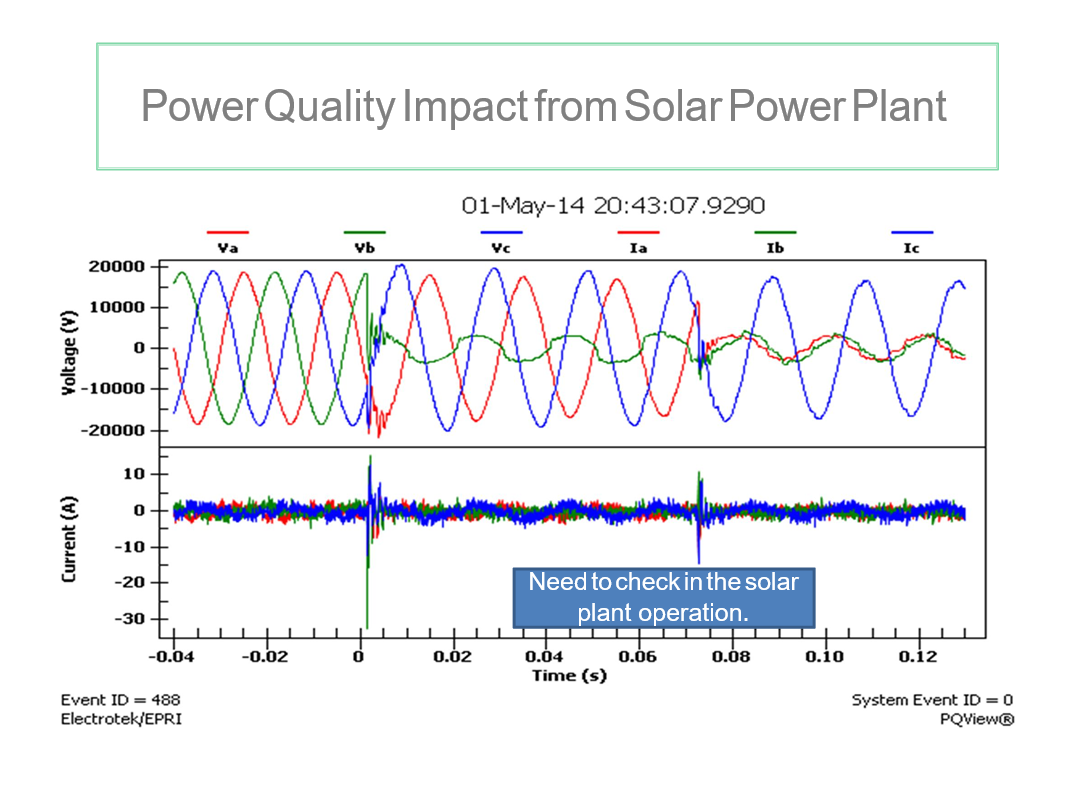
- Generation changing from rotary to invertor-based renewables.
- Remote generation
- Harmonics causing losses
- Government influence/mandates of SmartGrid
Influence on Power Quality due to drive for more energy efficient loads.
-
Lighting technology
- Incandescent bulbs to Compact Fluorescent to LED
- Incandescent bulbs to Compact Fluorescent to LED
-
Motor Control technology
- Voltage control to SCR control to High Power Switching
- Voltage control to SCR control to High Power Switching
- Power Switching technology for heating
Today Power Quality is more about data/information. (SmartGrid)
- SmartGrid ( 7,250,000 results from a Google search)
- A SmartGrid is an electrical grid which includes a variety of operational and energy measures including smart meters, smart appliances, renewable energy resources, and energy efficiency resources.
- What does Power Quality have to do with SmartGrid?
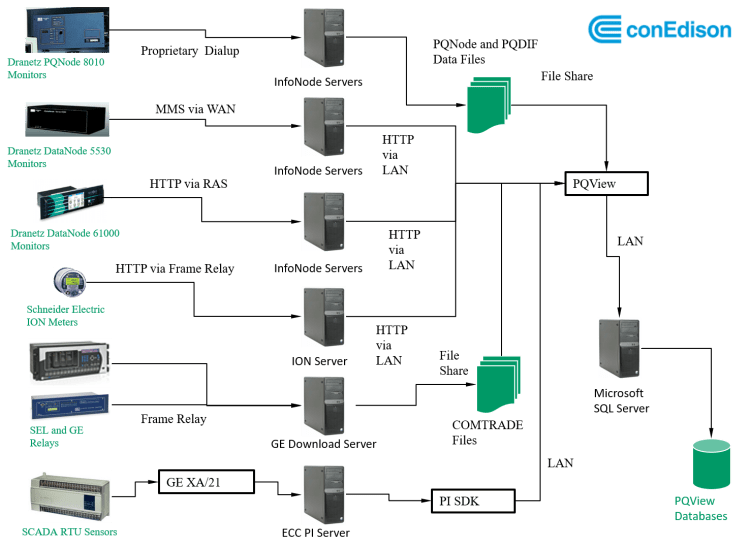
Data Integrated by Power Quality Monitoring System at Con Edison
-
Transmission Feeders
- Digital Fault Recorders
- Digital Fault Recorders
-
Area Substation Transformers
- Power Quality Monitors
- Event Correlation with SCADA Breaker Operations
- Power Quality Monitors
-
Network Distribution Feeders
- Digital Relays
- Event Correlation with SCADA Breaker Operations
- Digital Relays
-
Area Substation Capacitors
- Indirect: PQ Monitors
- Direct: Some Digital Relays
- Indirect: PQ Monitors
-
Secondary Networks
- Power Quality Monitors
- Power Quality Monitors
-
Unit Substation Transformers
- Power Quality Monitoring
- Phasor Measurement Sensors during Network Intermesh
- Station Battery Sensors
- Power Quality Monitoring
-
Long Island City Smart Meters
- Energy and Power Quality Data Logs
- Energy and Power Quality Data Logs
-
High Tension Remote Monitoring
- Power and power quality monitoring
- Power and power quality monitoring
-
Distribution and Transmission SCADA
- Automatic momentary interruption analysis and correction with IEDs
- Automatic momentary interruption analysis and correction with IEDs
Energy Efficiency and Power Quality
- There is a worldwide movement to increase the energy efficiency of loads.
- According to the International Energy Association, electric motors consume 45 percent of the total energy in the world. Lighting energy consumption is a distant second at 19 percent. https://www.iea.org/
- Energy efficiency is the one energy resource all countries possess in abundance.
Global Impact of Energy Efficiency

Electrical Energy Efficiency
- Same amount of work in the same amount of time with less Kilowatts. (KWhr)
Load Categories
-
Industrial
- Motors, lighting, building envelope, electronics
- Motors, lighting, building envelope, electronics
-
Commercial
- Lighting, building envelope, electronics
- Lighting, building envelope, electronics
-
Consumer
- Appliances, lighting, building envelope
- Appliances, lighting, building envelope
- Government
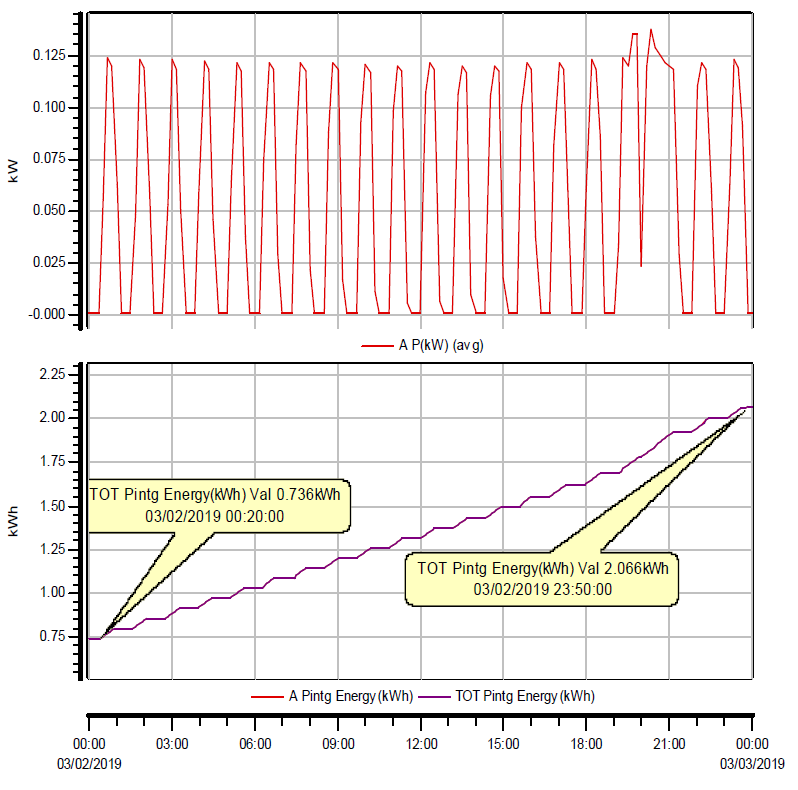
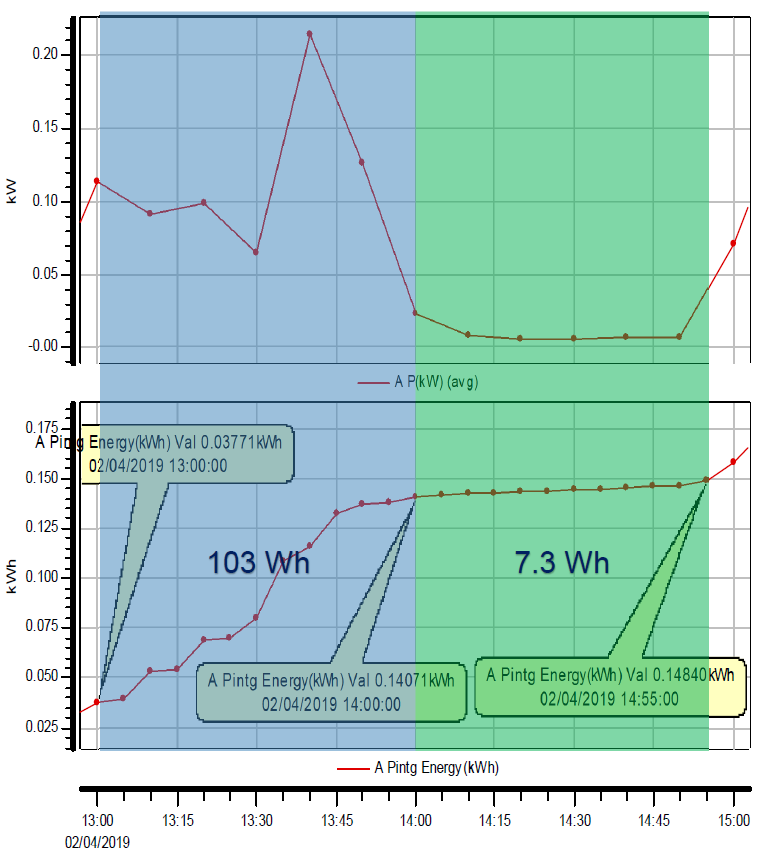
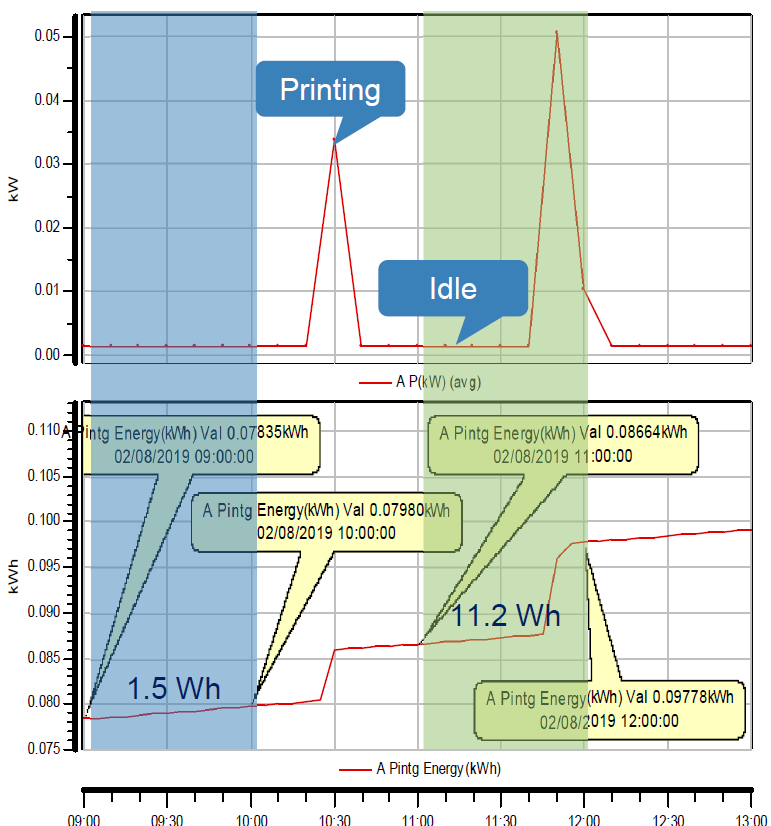
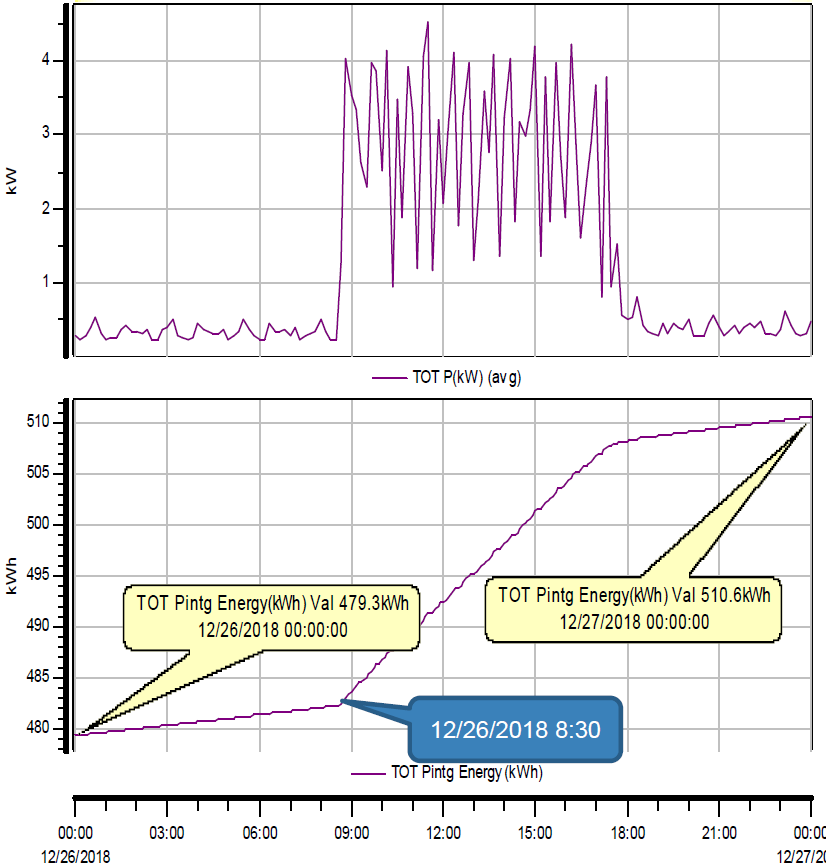
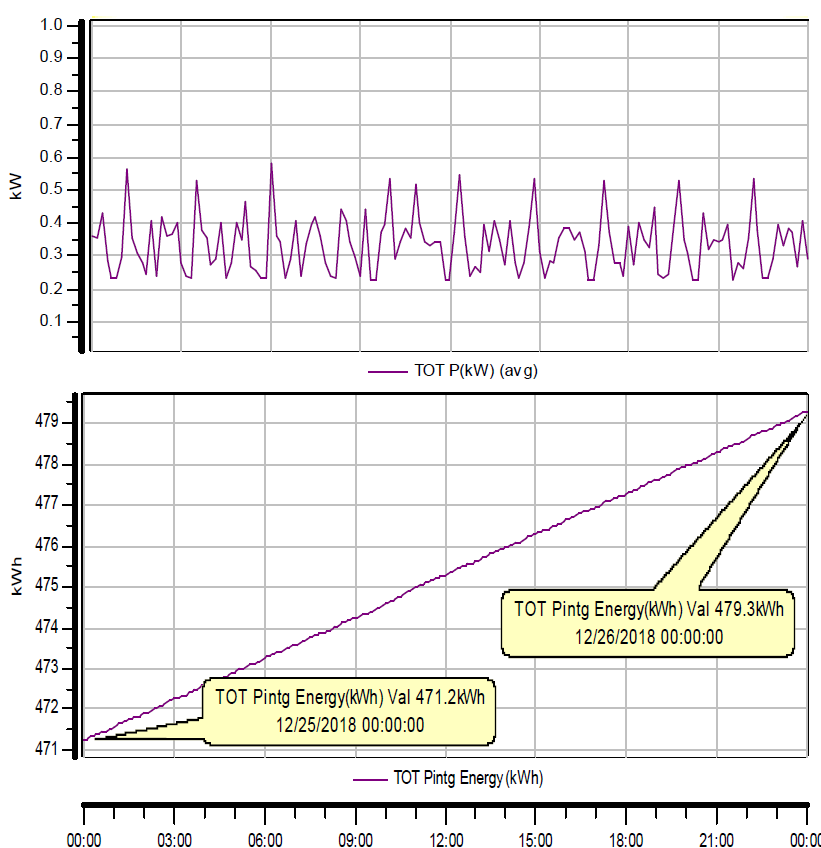
Parameters of Electrical Usage
- Voltage stability
- Voltage imbalance
- Amps to determine load characteristics
- Watts, KW, KWhr
- Power Factor
- Maximum demand
- Time of day usage
- Economic losses and return on investment require data $$$$$
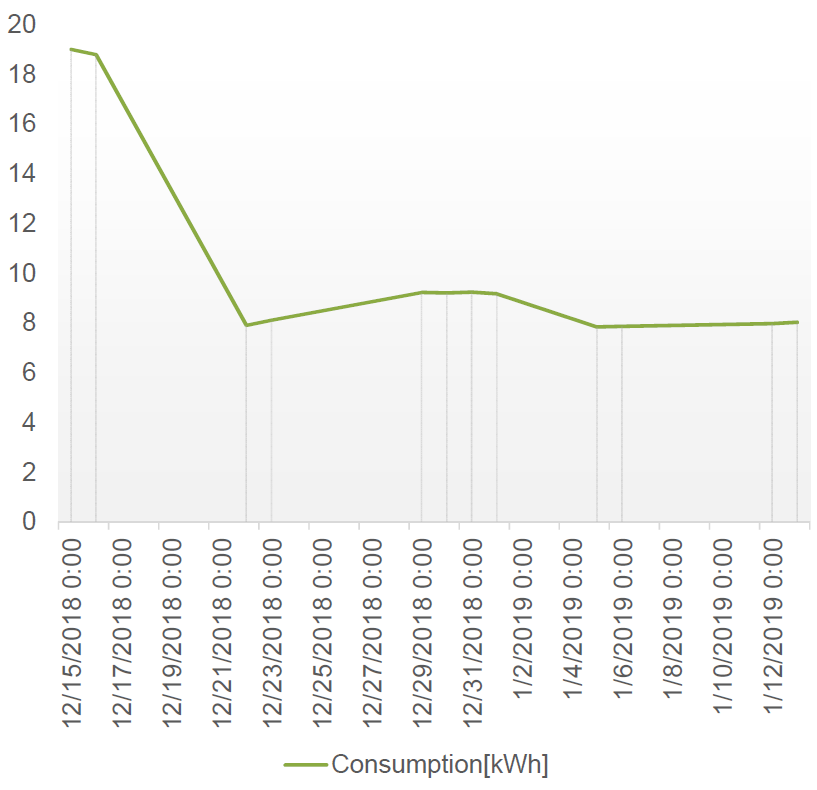
The Basics of Energy Savings
-
Motors
- VFD/VSD reduce the energy not needed once the load is started
- Improve the control by electronic switching
- VFD/VSD reduce the energy not needed once the load is started
-
Lighting
-
Change in technologies
- Incandescent – Fluorescent – LED – specialty
- Incandescent – Fluorescent – LED – specialty
-
-
Electronic loads
- Increased integration of semiconductors
- Increased integration of semiconductors
-
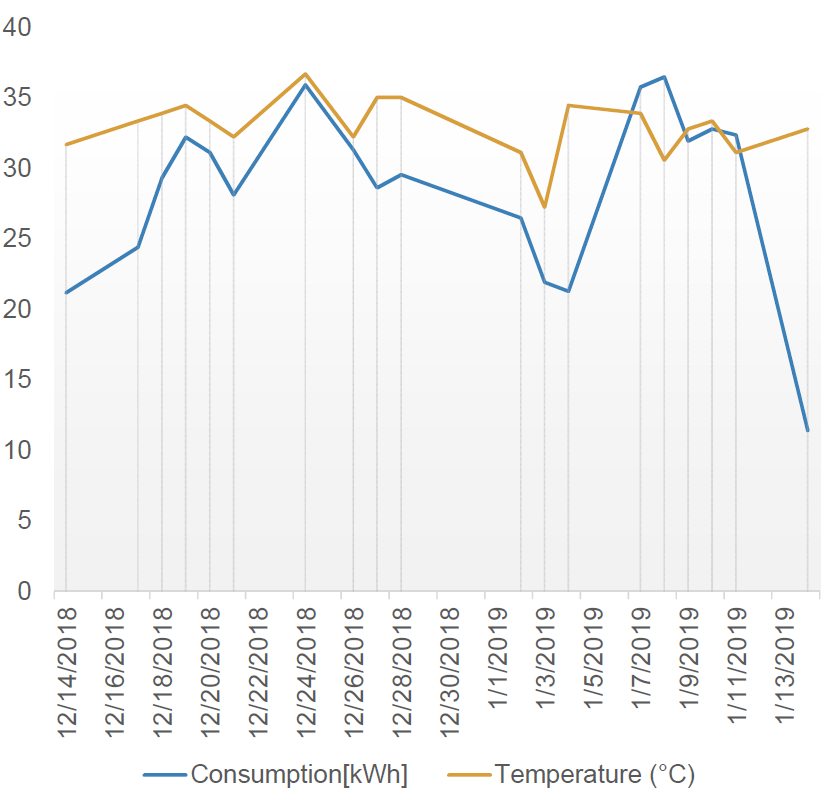
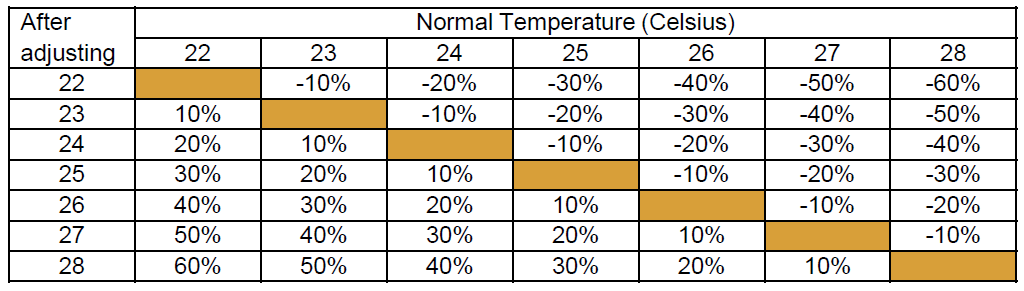
Temperature
- Insulation, control, and technology
- Insulation, control, and technology
The Relationship Electricity usage to Power Quality Situations (parameters)
- As energy efficiency of loads increases (decreases), it changes the sensitivity to PQ parameters and increases (decreases) the generation of harmonics

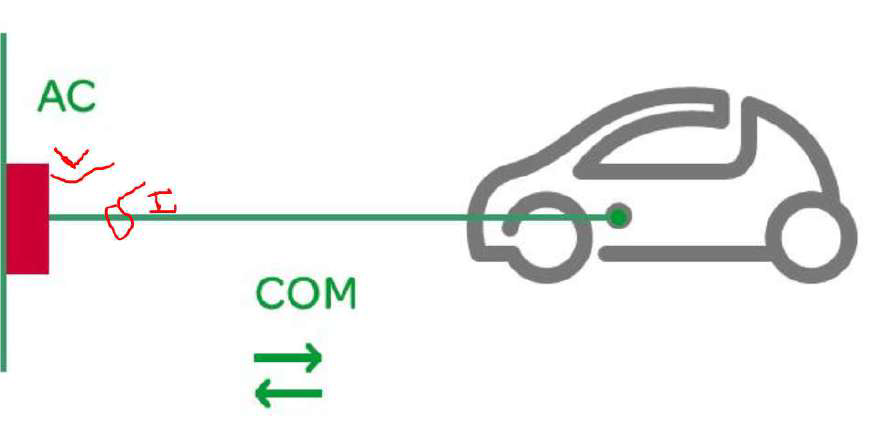
Computer Power Supplies (AC to DC)
-
Linear power supplies change to Switch mode.
- Voltage operating range went from +/- 5% to universal voltage 90vac to 240vac
- More sensitive to transients
- Generate more harmonics
- Voltage operating range went from +/- 5% to universal voltage 90vac to 240vac
-
Next generation
- PF corrected
- Lower Ithd but at higher order harmonics
- PF corrected

Lighting (22%)
-
Incandescent lights to solid state ballast fluorescent lights
- Sensitivity to voltage reduced
- Increase in harmonics
- Sensitivity to voltage reduced
-
Next, LED lights
- Decrease in harmonics
- Decrease sensitivity to Voltage?
- Decrease in harmonics


Lamp Efficiency Comparison and PQ Sensitivity
Light Dimmers
- Lowers power used
- Increases Harmonics
- Sensitive to voltage transients
-
Sensitive to voltage sags
- Light blinks
- Light blinks
Solid State Lights (SSL)
- Significant energy savings
- Sensitive to voltage transients
- AC to DC converter generates harmonics


Motors
- 70% of electrical load (Industrial) 45% of global load
- High Efficiency motors
-
Electronic controls for existing motors
- Variable Speed Drives (VFD)
- Variable Frequency Drives (VSD)
- Soft start
- Variable Speed Drives (VFD)
High Efficiency Motors

Add VFD (VSD) to Motors
-
Variable speed drives
-
Sensitive
- Sags
- Phase shifts
- Transients
- Imbalance
- Sags
-
- Generates harmonics
How a VFD or VSD works?

Drivers for Change in PQ and Efficiency
- Cost savings
- Improving control over processes
- Energy efficiency (Green World)
- Reduce size and weight of equipment by lowering power consumption
-
Advances in technology
- Semiconductor
-
Materials of all types
- Insulation and conductors
- Insulation and conductors
- Semiconductor
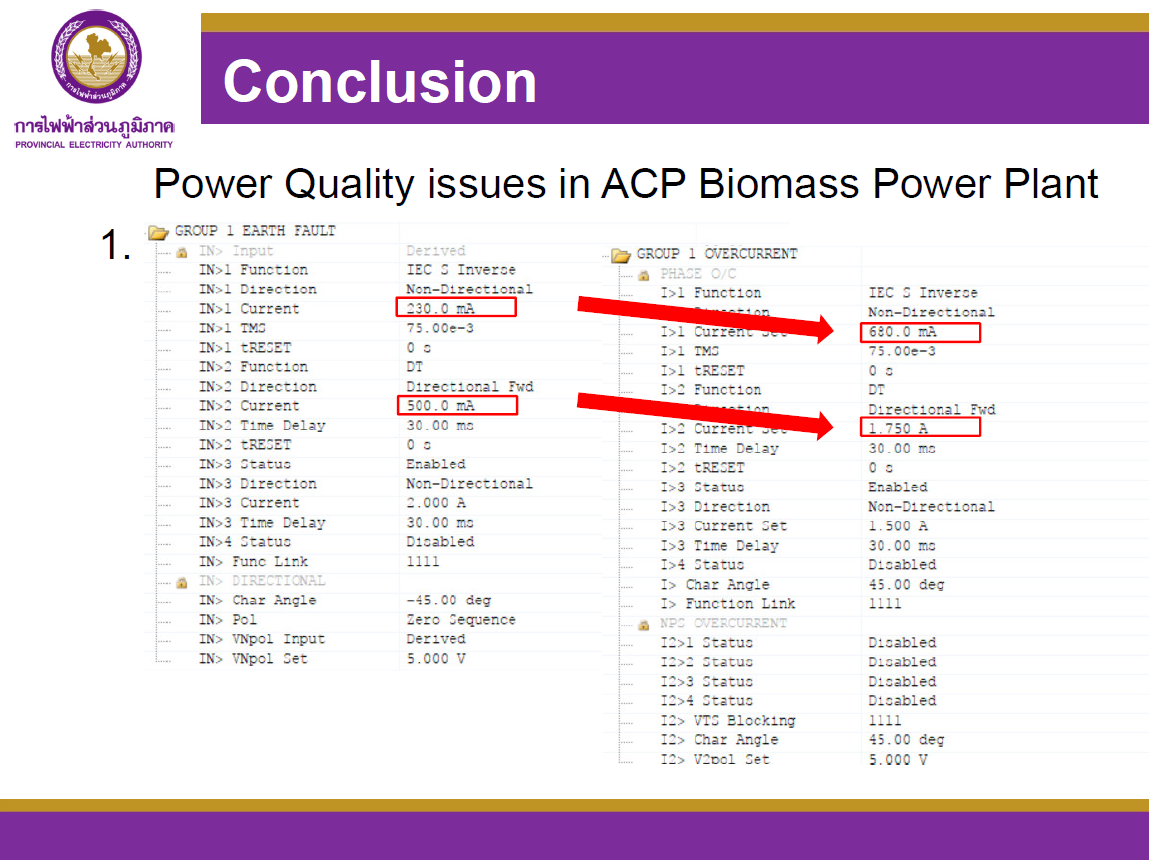
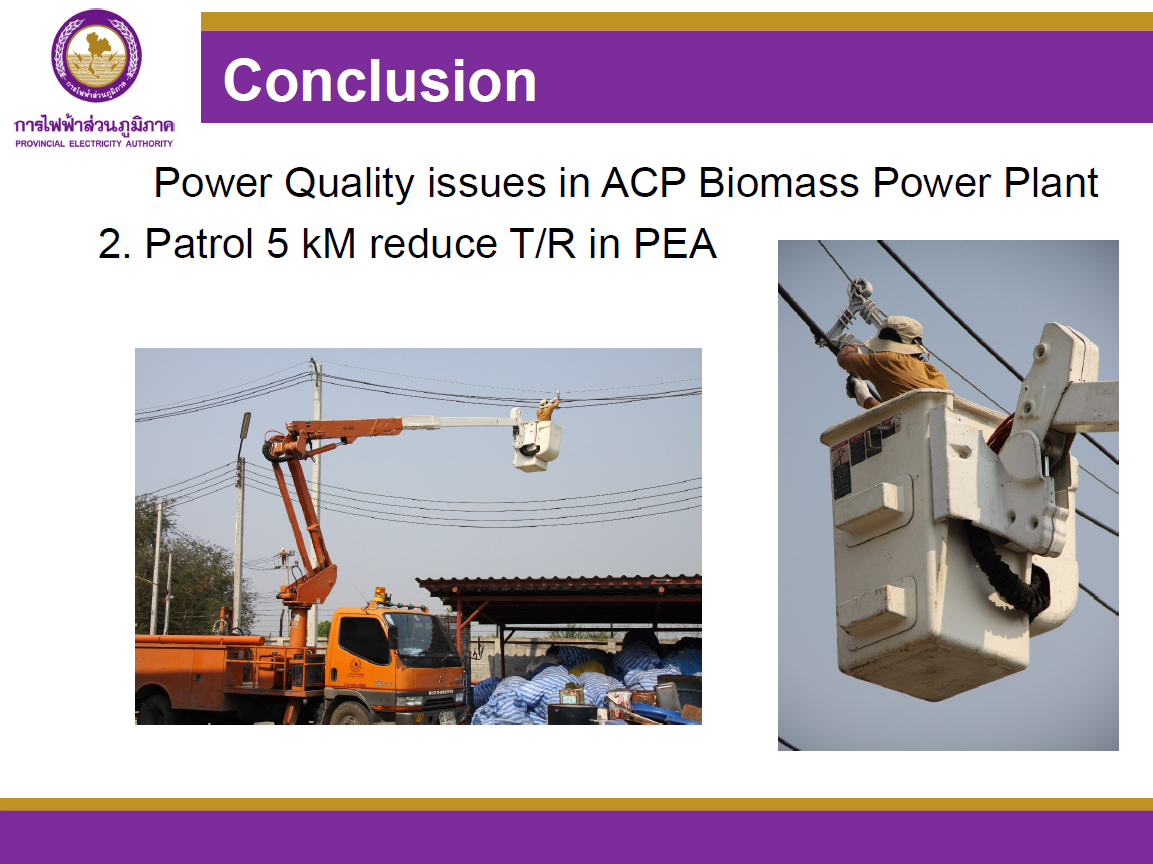
Conclusions
- Power Quality and Energy efficiency are linked by the changing technologies
-
The Changing technologies are a global situation.
- The only constant is the varying rate of change!
- The only constant is the varying rate of change!
- Effective engineering depends on global information and technical resources
- I have been an IEEE member for more than 30 years! It is a global organization that has provides consistent and valuable resource data for wide variety of electrical subjects