White Paper
Dranetz industry leading power analysis software provides professional reports and analysis to all users
INTRODUCTION
Dran-View® is a Windows-based software package that enables power professionals to simply and quickly visualize and analyze power monitoring data. It is easy to navigate, delivers automated functionality, and incorporates powerful analytical capabilities and customizable options to meet the needs of each individual user. By supporting more than 12 languages, Dran-View is used by thousands of customers around the world and has become the industry leading power management software tool. Dran-View is available in two versions, Pro and Enterprise, so there’s a version to meet everyone’s needs.
This White Paper explores some of the powerful features and benefits of Dran-View that have made it the most widely used power analysis software used worldwide.
DRAN-VIEW PRO
Powerful in its own right, Dran-View Pro is a great tool for any application, large, small, simple or complex. Its advanced, yet simple to use feature set enables you to get the most out of your power survey. Features include trending of any recorded parameter in a stacked or overlaid format, analysis of any waveshape or event recorded at any time, harmonic analysis, customizable displays and many other features. Dran-View Pro includes an advanced report writer and even a rescue kit to help you undo mistakes made during your study such as reversed CT’s, wrong time and more.
DRAN-VIEW ENTERPRISE
Dran-View Enterprise includes all of the features found in Pro, but includes enhanced capabilities such as multiple site capabilities, mathematical channels to compute your own parameters, floating annotations, snapshots/bookmarks, additional file formats such as Comtrade & PQDIF and much more.
Let’s take a tour and explore some of the features and benefits of Dran-View. Since there are two versions of Dran-View, look for the Pro and Enterprise labels to easily know which version the feature applies. Many features described in this white paper include quick access using the Dran-View toolbar. In such cases the associated toolbar icon is shown.
COMPATIBLE INSTRUMENTS
Dran-View is compatible with all current, and many legacy Dranetz 3 phase products, including:
- Portable instruments: HDPQ Xplorer, Guide, Visa, -SP PX5, PX5-400, PowerGuide, PowerVisa, Energy Platform EP1
- Permanent Systems: Encore Series, Mavosys, Signature System. Dran-View is also compatible with other Dranetz products and those from other manufacturers when using file formats such as PQDIF, COMTRADE, csv, txt and others discussed in this white paper.
DRAN-VIEW USER INTERFACE – PRO, ENTERPRISE
 Figure 1 Dran-View User Interface
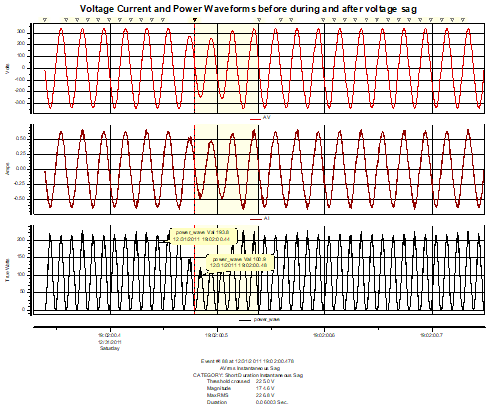
Dran-View features an intuitive, easy-to-use interface that enhances even the first-time user’s experience. Shown in Figure 1, you’ll see Dran-View’s ‘2 pane browser’ interface. Consider a ‘pane’ a window into any portion of your power survey. On the left side you’ll see the timeplot, or historical view pane which enables you to trend any parameter over the entire recording period. The timeplot pane allows you to show trends in a stacked (shown) or overlaid format based upon the user’s preference. On the right side you will see the data pane that shows details of any recorded event that’s selected. Details of events such as wave shapes, measured data, etc can be easily displayed in a graphical or textual format. By moving the splitter control bar, you can resize the windows to suit your needs. Simply drag the bar to the right to enlarge the timeline pane or to the left to enlarge the data pane. Buttons are also available on the toolbar to quickly maximize either pane.
By changing the properties (right click, properties) of each pane, you can easily customize the display appearance to your liking. You can add or subtract parameters, change the color or line thickness of any trend or waveform, adjust the font size and details of the labeling, and much more.
CONVENIENT ON-SCREEN TOOLS
EVENT CONTROLS – PRO, ENTERPRISE

There are several ways to scan your event data. You can pull down the event list and randomly select any event of interest. Another, more visual approach is to use the Previous, Next, and other event controls. Simply press  (previous event) or
  (next event) controls and view the change in the trend and wave shapes and easily see the details of each event as you scan the list.
ZOOMING – PRO, ENTERPRISE

Zooming is a fast and easy way to find the data of interest. By using the mouse to draw a ‘zoom window’ on any trend or wave shape you can magnify that part of the display to the full size of the display window. Zoom in as many times as necessary to show the data of interest. Zoom out one step at a time or go immediately back to the original display at your convenience.
PAN – ENTERPRISE

Once you’ve zoomed in to see the data of interest the Pan tool is a cool feature that lets you slide the data in the window left and right without changing the zoom level. Simply press the Pan button on the toolbar then drag the data in the window left or right to see information off the screen without changing the x and y axis.
DELTA TOOL – PRO, ENTERPRISE

The Delta tool helps you measure between two points on a trend or waveshape. Simply click the Delta tool button in the toolbar, click and hold the mouse at the point you want to measure from, then drag the mouse to where you want to measure to.
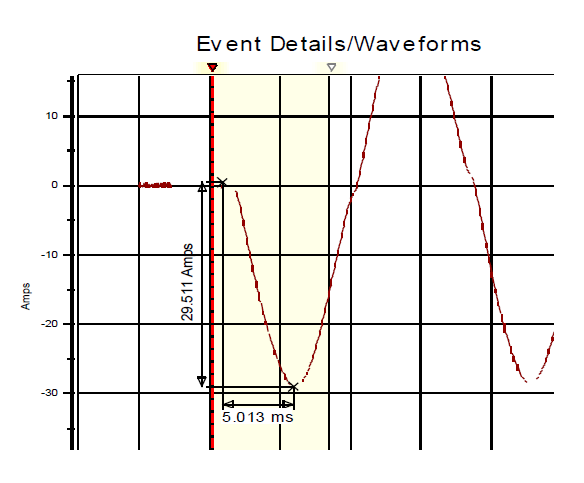
Figure 2 Delta Measurements
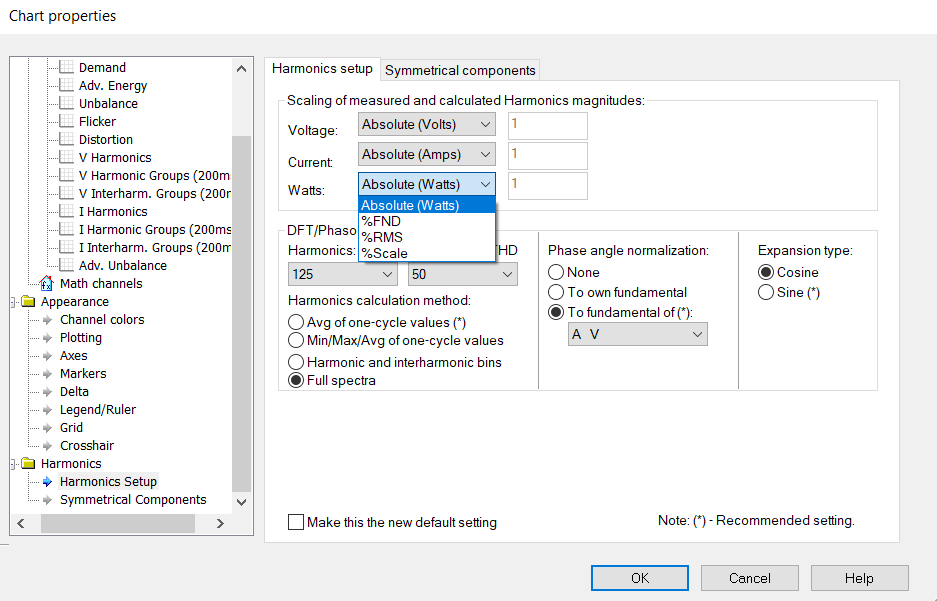
DISPLAY APPEARANCE – PRO, ENTERPRISE
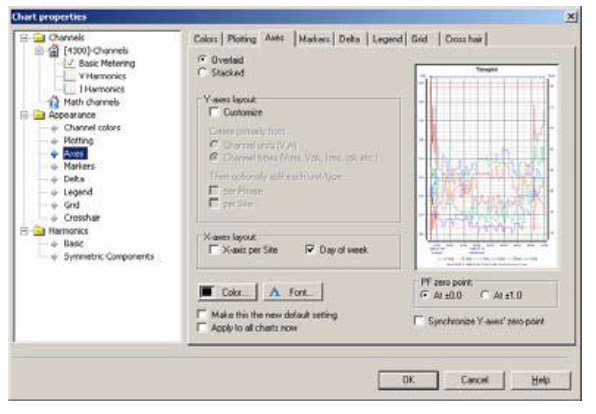
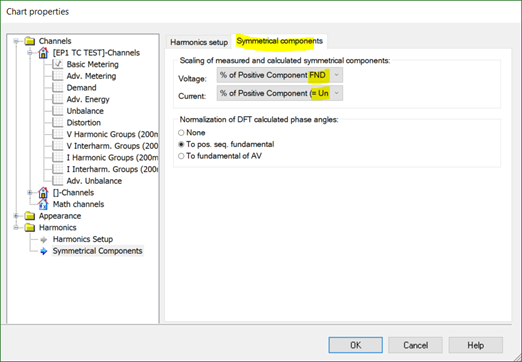
Figure 3 Chart Properties
Each trend or wave shape display can be customized to your liking. Just right click on the display and select Properties to adjust items such as the parameters and channels displayed, stacked or overlaid trends, line style/color/thickness, fonts, legend, grid lines and more.
With Dran-View you can even change the channel names and labels to customize the display to your exact requirements. Let’s say you want to change the generic label ‘A Vrms’ to something directly related to your survey, maybe ‘Critical Bus 6 L1’, simply right click on the channel label, select Properties and change the text to your liking.
DISPLAY OBJECTS – ENTERPRISE
Dran-View Enterprise unlocks the power of your user interface and exposes each trend, event detail, phasor, and table as a configurable ‘object’. Not only can you add or subtract any object such as a trend, you can also rearrange the display and change appearance to meet your needs.
CONVENIENT FEATURES & BENEFITS
Dran-View is more than just a PC viewer for power monitoring surveys. Dran-View has many features and benefits that differentiate it from any other power monitoring software. Such features make Dran-View simple and convenient to use yet provides an advanced feature set for even the most demanding of professional applications.
Let’s explore some of these features and how they provide benefits to our users.
SNAPSHOT TOOL – ENTERPRISE

Snapshots are similar to web site bookmarks and let you take a picture of any number of trend or waveform displays and view them again at any time, maintaining the zoom level and other display adjustments you’ve made. As an example, let’s say there were 2 major Power Quality events found during your survey. When you zoom in or otherwise locate the data you’re interested in simply press the Snapshot button to save that view. On the left side of the display you’ll see a picture of your snapshot. Unzoom the display and Zoom in to locate the next event, adjust the display to your liking and click Snapshot button again. You’ll see the new snapshot added to the snapshot list. Add as many snapshots as you like. To return to any snapshot taken simply double click on its picture and Dran-View will take you to that exact display. At that time you can continue to adjust the display as you see fit.
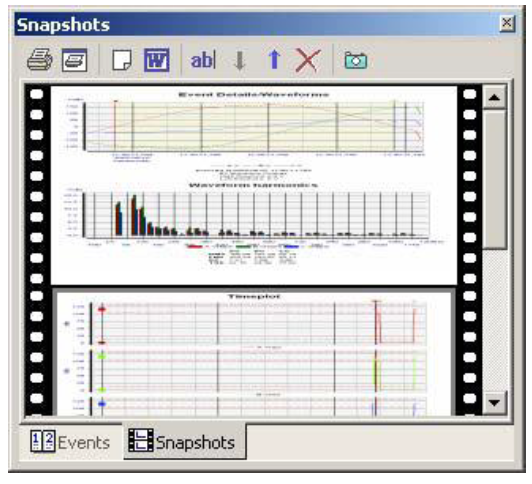
Figure 4 Snapshots
MULTI-SITE – ENTERPRISE
Many power surveys include more than one power monitor, so you need to analyze data from 2 or more instruments at the same time. Common applications may be when measuring the input and output of a device in efficiency or UPS applications. In such cases the objective of the survey is to directly compare input and output data. When using Dran-View Pro you can open multiple sites, but they are treated separately, not viewed simultaneously, so you must switch between them. A much more convenient method is found in the Multi-Site feature of Dran-View Enterprise. With Multi-Site you can overlay data from multiple sites on one trend or waveform display and even adjust the x axis (time) to make sure they are synchronized. When viewing data using Multi-Site, each instruments data is maintained separately but can be combined together for analysis.
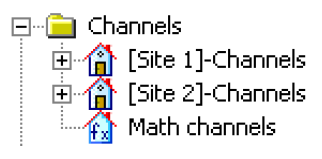
Figure 5 Viewing charts from multiple sites
ANNOTATIONS AND PICTURES – ENTERPRISE
A picture speaks a thousand words and helps greatly to see what you’ve monitored. Dran-View Enterprise enables you to add a diagram or photograph to any trend or wave shape window. Maybe a photograph of the damage done by the PQ problem, wiring diagram or other picture would help describe the event and, once added, is included in your DV6 file.
Data annotations enable you to add your own comments at any point on a trend or waveform. Simply click on any waveform or trend to highlight it, right click at the point where you want the annotation and select ‘Data Annotation. The annotation will appear, then double click on it to change the text and properties such as font, etc.
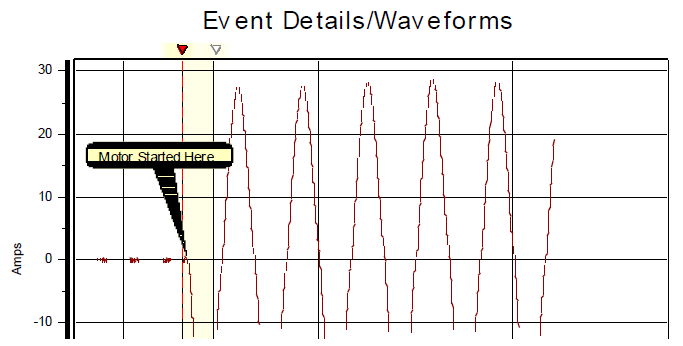
Figure 6 Data Annotation
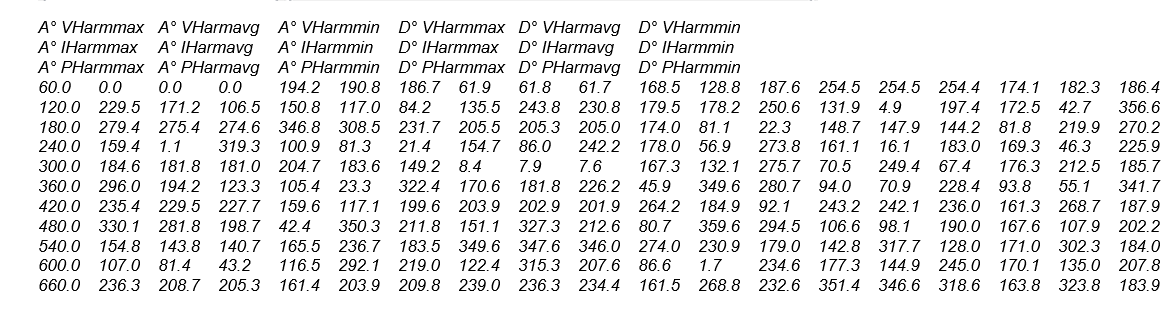
DATA LIST EXPORTING – PRO, ENTERPRISE

Many applications require exporting data to other software packages. A common example may be an energy application where electrical energy data collected during your power survey needs to be included in other software that combines data from systems measuring utilities such as gas, water, steam, etc. Dran-View’s ASCII exporting function enables you to easily export in many common formats, such as comma, tab and space delimited formats. You can also format the time in the saved file. Exported ASCII data can be saved to the Windows clipboard or a file. To export data from any trend or waveshape click the data list icon in the toolbar. The data points from the display will be shown. Right click on the list and select ‘Copy’ to save to the Windows Clipboard or ‘Save As’
to save in a file. In both cases a ‘Settings’ window will appear where you can select the export options mentioned above.
PQDIF, COMTRADE & OTHER FILE FORMATS – ENTERPRISE
Many applications require the user to compare data from different monitoring systems. Dran-View Enterprise enables the user to read data from Dranetz or other manufacturer’s products by supporting the PQDIF, COMTRADE, text, csv and other file formats.
PQDIF (Power Quality Data Interchange Format) or IEEE1159.3 is a universal file format used in the Power Quality industry and is common in fixed monitoring systems, such as the Dranetz Encore Series. Dran-View can directly import any compatible PQDIF file stored by other systems. Simply select File->Open and change the file type to PQDIF, then open the file directly into Dran-View.
COMTRADE files are commonly used in fault recorders and other utility applications for sampled waveform data. To import a COMTRADE file into Dran-View select File->Open and change the file type to COMTRADE. Dran-View will open the COMTRADE import wizard where you can identify each waveform and appropriate data labels and characteristics.
Text files such as csv, txt, xls files are also supported by Dran-View. When importing Text files select File- >Open and change the file type to TEXT. Dran-View will open the ‘Text Import Wizard’ where you can set properties such as delimitation type (comma, tab, etc), time format and other items.
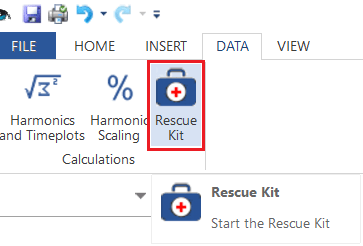
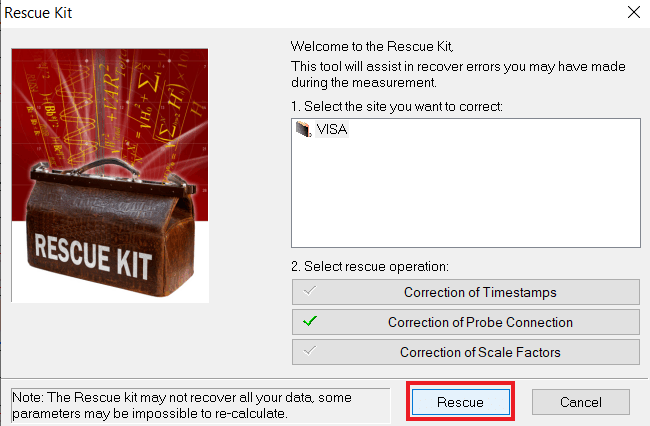
RESCUE KIT – PRO, ENTERPRISE

Have you every completed a power survey then realized you had a CT connected backwards, the instrument time was wrong or had another human error? The Dran-View Rescue Kit can undo some mistakes during your survey.
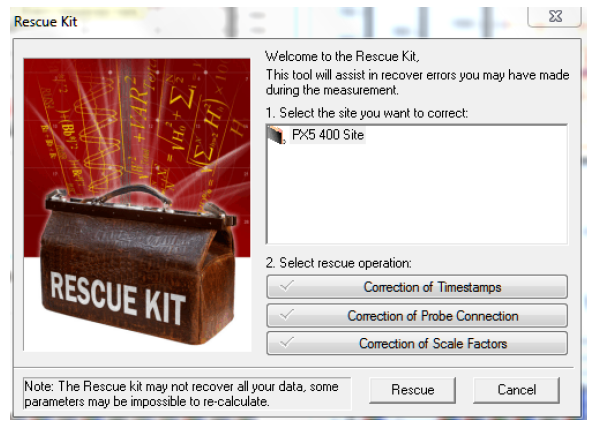
Figure 7 Rescue Kit
Some errors cannot be fixed but the Rescue Kit can fix items such as inverted current probes, improper scale factors and wrong time. Simply click Tools->Rescue Kit to open the Rescue Kit.
MATH CHANNELS – ENTERPRISE
Dran-View has a quite powerful Math channel feature that enables you to create your own computations from your measured data. Similar to functions found in an Excel spreadsheet, Dran-View’s Math feature provides computational functions such as Mathematical (SQRT, PWR, etc), Trigonometric (SIN, COS, TAN, etc), logical (<, >, =, etc), Power (RMS, DFT, etc) and more. Math channels are created by applying formulas and computational functions to measured and computed data from your survey.

Figure 8 Dran-View’s Math Channels
A simple example is a VA computation using the Voltage and Current measurements from your survey; maybe it wasn’t recorded by the instrument. VA is V x I, which is the basic formula you will create in the Math channel, as shown in Figure 8. Your custom VA computation is trended like any other parameter in Dran-View.
A common application is to compute ground leakage current in a 3-phase wye circuit. In such cases, the current in phases A, B, C and Neutral are measured by the power monitor. Using Dran-View you create a Math channel to compute leakage current by adding the current in phases A, B, C and Neutral with the remaining current being leakage current. This feature is like having a 5th current channel monitoring the ground current, which is oftentimes very impractical to accomplish.
You can create multiple Math channels, create a name for each channel with each having its own custom formula.
REPORT WRITER – PRO, ENTERPRISE

Figure 9 Dran-View Report Writer
Dran-View has a built in report writer that enables you to produce professional, custom reports that can include your company logo. All reports are created in an .rtf format that’s compatible with most word processors, such as Microsoft Word. As a result you can easily edit the report to your liking.
The Dran-View report writer has two modes: custom and automatic. The automatic mode creates a report very quickly with little user interaction. In just three easy steps you’ll have a report ready for your management, client or customer.
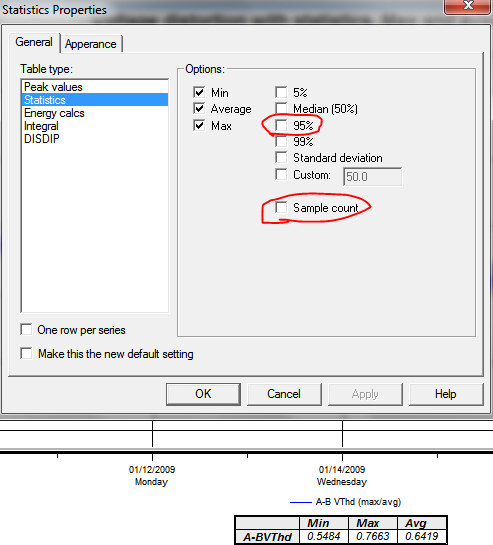
The custom report mode offers you complete control of the content of your report. You can include or exclude any channel, parameter, statistical analysis and even enable compliance reports such as EN50160, G5/4, NVE and others. You can also create your own custom standard by adding your specific compliance information. Once you create a report formatted to your liking, you can save a template and recall the report format for use in future reports.
HARMONICS – PRO, ENTERPRISE

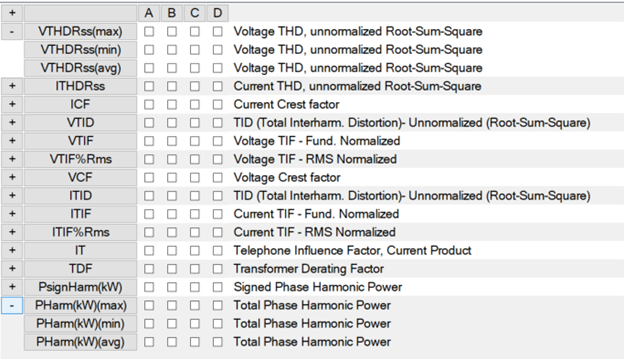
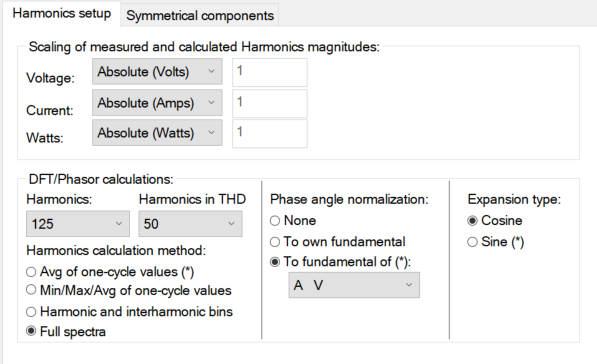
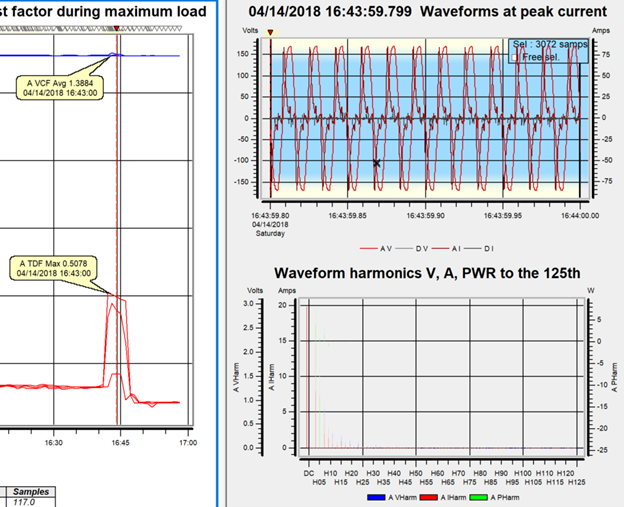
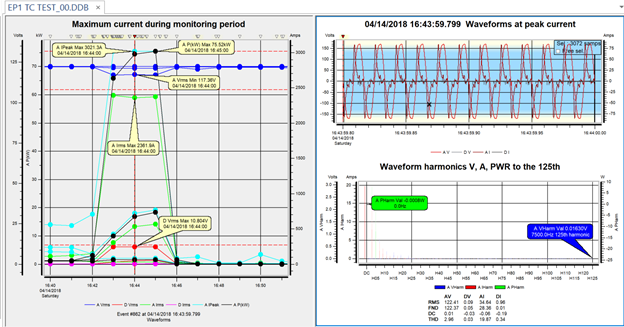
Dran-View has some powerful capabilities for harmonic analysis. Being a data viewer, Dran-View displays trends and details of any harmonic information recorded by the instrument, such as THD, Symmetrical Components, K factor, individual harmonics and more. Harmonic based data can be trended alongside any other parameter. If waveforms were recording during an event, simply press the DFT toolbar button to display the harmonics of the recorded waveshapes.

Figure 10 Harmonics Spectrum
By viewing the properties of the harmonic display you can change the appearance, number of harmonics to display and other settings.
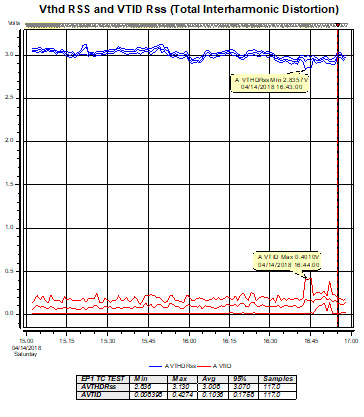
HARMONICS/TIMEPLOT CALCULATOR – ENTERPRISE

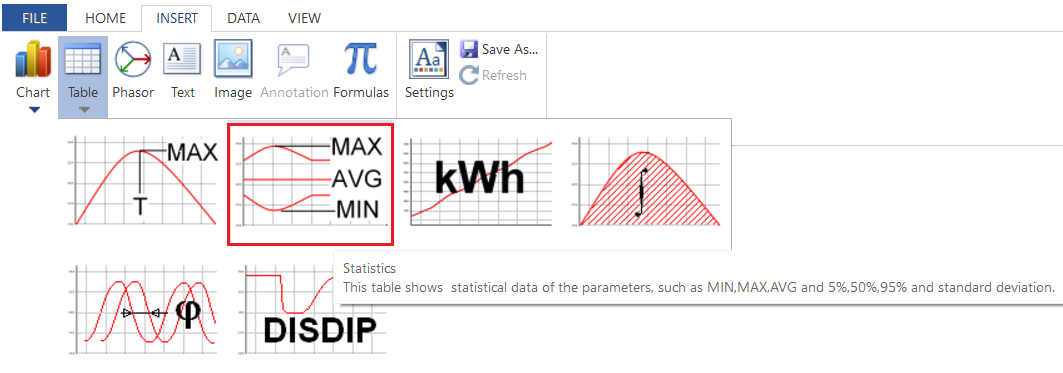
Dran-View can also compute RMS, power, harmonic and other parameters from the waveshape information recorded by the instrument. This is in addition to any parameters recorded directly by the instrument. As an example, let’s assume the instrument recorded waveforms with its journal (timed) readings. If the journal interval was programmed to 10 minutes, digitized waveshapes are recorded by the instrument at that interval for the duration of the survey.
Dran-View Enterprise can create trends of harmonics and other parameters using the journal waveshapes by using the Calculate Harmonic/Timeplots tool. This feature can compute many parameters including individual harmonics, VTHD, ITHD, VRMS, IRMS, Frequency and others. Again, this is in addition to any parameters recorded by the instrument during your survey.
An example is generator testing, where it’s common to require cycle by cycle frequency trends during generator start-up. Most instruments compute an average frequency so this usually isn’t available directly from the instrument data. By using the Harmonic/Timeplot Calculator, Dran-View can compute the required cycle by cycle frequency using the waveshapes captured during the generator start-up.
CONCLUSION
This white paper described many of the features and benefits of DranView, but space doesn’t allow us to cover all Dran-View brings to our users. For complete details please consult the Dran-View users. For more information about Dran-View, or any Dranetz product please visit http://www.dranetz.com.