Published by Thaweesak Aranchot, Electrical Engineer, Power Quality (Thailand) Co., Ltd.
Plan
- Measure actual usage of each load for recording a consumption. Then determine a way to reduce the usage without impacting a business efficiency
- Investigate the actual data comparing with Electricity bill
Introduction
- The energy consumption at PQT was studied to determine\how much energy was used, where it is being used, and how much it costs.
- Dranetz HDPQ Xplorer was setup for monitoring the usage at the main board of small office facility. EP1 was setup for determining an individual load.
- Then investigate an energy usage and compare with a MEA electricity bill to determine the exact energy usage and cost.
Loads of the Building
Figure 1:
- A main of air Conditioner is set as 25 degree.
- Operate continuously 9 hours.
- The usage is 18.8 kWh on working day
 Figure 1
Figure 2:
A trend plot is showing a usage of two 36-watt fluorescent lamps in an hour.
18W x 12 – Consumed à 2.94 kWh/Day
36W x 4 – Consumed à 3.83 kWh/Day
Total = 6.77 kWh/Day
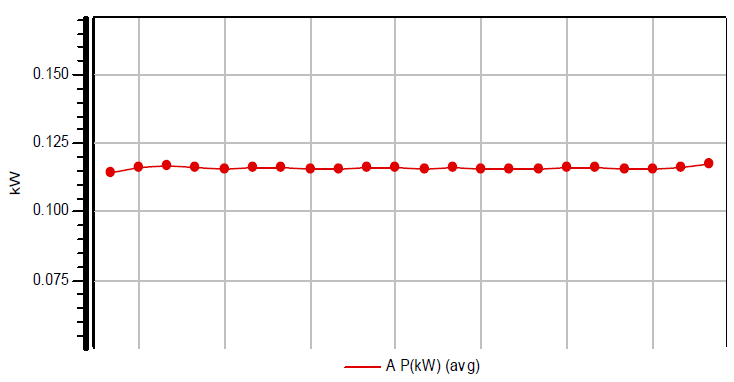
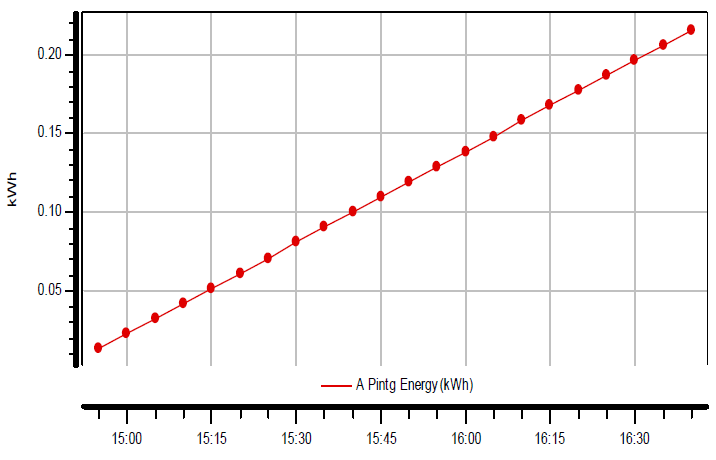
Figure 2
Figure 3:
- A full day used 1.29 kWh without opening a door.
- The usage will be 1.77 kWh per day if disturbs refrigerator operating.
 Figure 3
Figure 4:
- Water pump usage is operated for part time.
- Trend plot displays an hour usage of a water pump.
 Figure 4
Blue area is operating area
Green area is non-operating area
Figure 5:
- Office equipment: computer, router, printer, and CCTV.
- Illustration is a consumption of Printer
- Consumption is 2.35 kWh per Day

Figure 5
Blue area is operating area
Green area is non-operating area
A Consumption for Working Day
Load consumption of a working day in Percentage.
Average consumption is 30 kWh per day.

Figure 6:
- Trend plot is displaying a business day usage for all loads in the office.
- A business day usage is 31.3 kWh for per day
 Figure 6
Figure 7: Working day usage between middle of December to middle of January.

Figure 7 – Working day consumption
A Consumption for Non-Working day
Display a single day usage for Non- Working day (Figure 8)
- A day off usage is about 8 kWh
- There are kinds of load that always run all times such as CCTV, security lights, router, refrigerator.
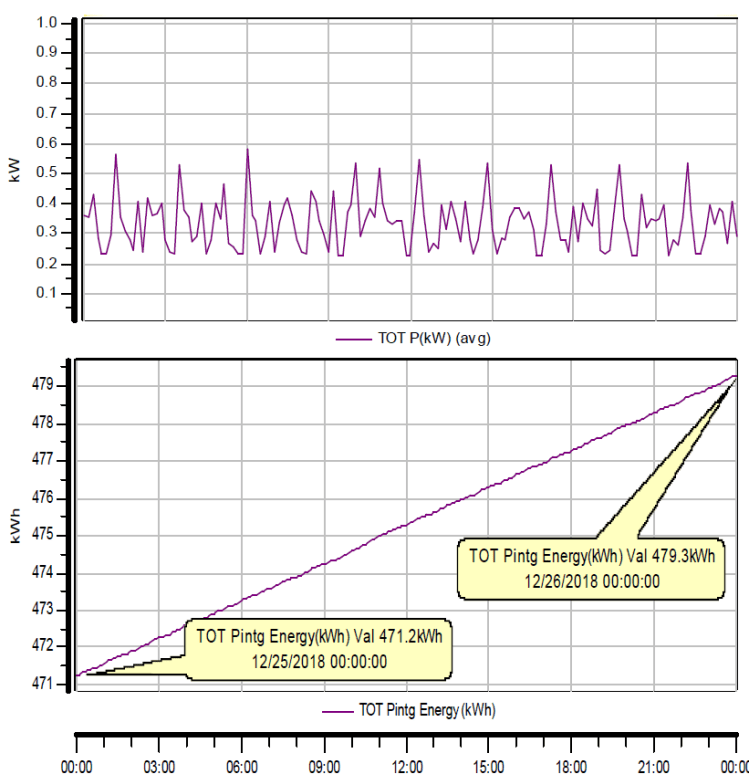
Figure 8
Figure 9: Non-working day usage between December 2018 to January 2019
 Figure 9
Total Consumption (Figure 10)
- Electricity bill displays monthly usage during December 14, 2018 and January 14, 2019.
- Total cost is 3,323.54 THB including vat, service charge and FT factor.

Figure 10
Solutions: How can we save cost of electricity?
Saving cost, we could reduce electricity of the main load for example:
- Air conditioner: Typically, higher temperature can be able to reduce energy usage by decreasing 10% of usage. (Table below)

- Clean an air filter regularly for saving 10% of the air conditioner consumption.
- Reduce an operation time of air conditioner for an hour that can be able to reduce 10 % of Air conditioner usage. (Credit: Analysist energy management book for small and medium business, December 2012, Ministry of Energy, Thailand.)
- Install an insulation on wall or ceiling to reduce temperature inside that allow the air conditioner work less than high temperature. (Credit: Department of Energy, United State of America.)
We could reduce electricity of load for example, Lighting:
- Fluorescent lamp can be replaced with LED lamp to reduce energy usage.
- A LED lamp costs 400 THB and owner will get back in 12.7 month.
