
To do advanced harmonic analysis using the postprocessing capability of Dran-View 7 (DV7) Enterprise.

Note: Use the waveform capture on periodic basis to collect the most useful data but not necessary for normal PQ activity and reports.
The steps below give a few examples.
Step 1. Open the data file of the site of interest and select Voltage or current or both graphs. Change graph label for clarity.
Step 2. Select insert from the tool bar and the tables followed by Statistics.
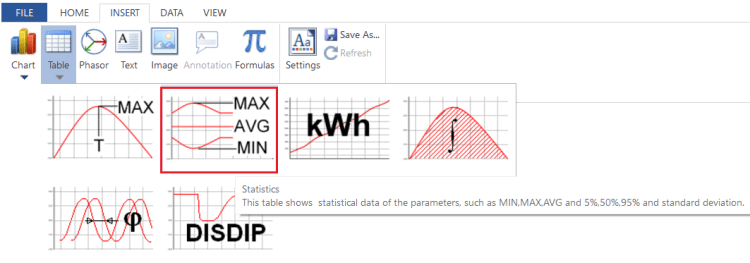
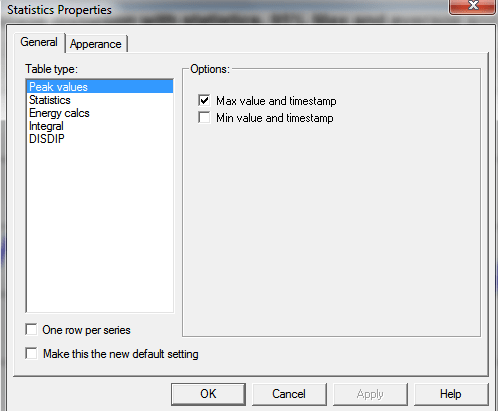
Step 3. Double click on the statistics box. It will bring up the following selection box.

To adjust the time period for the statistics, simply zoom or unzoom the graph of the data and the statistics are reported on the time of the graph.
Step 4. Follow the instructions to move statistics box to the graph you want.

Step 5. Add data labels for clarity, save graph with camera icon
![]()
or report writer can automatically insert this graph in the report.
![]()
