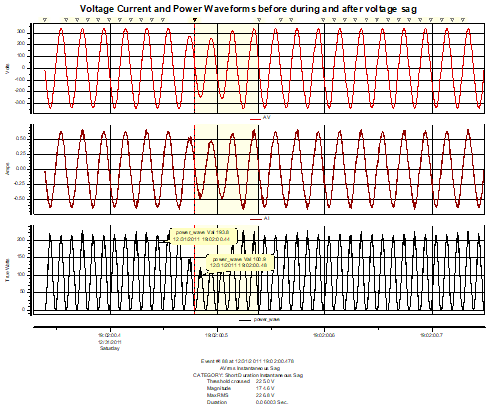
Case 1. Display waveforms of voltage, current and Power before, during and after an event.
Case 2. Display waveforms of voltage, current and calculate the power waveform from the data of any waveforms recorded by the instrument.

HDPQ waveforms of Voltage, current and Power from 10 cycles of waveform data.
Case 3. Display harmonic spectrum of the waveforms from case 1 and case 2.

Calculated from waveforms above (case 1 & 2).
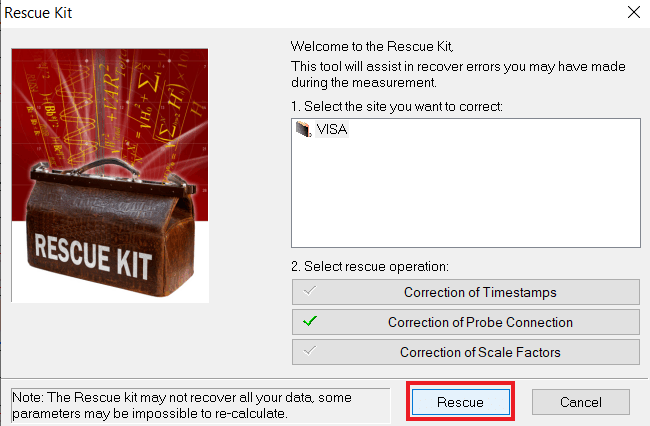
Case 4. Correct power displayed due to CT connection error.

Voltage and current waveform with Decaying Ringwave transient. Current waveform – CT is reversed.
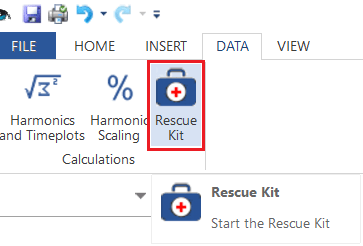
Use Rescue Kit to correct the CT connection error.


Corrected waveforms
Case 5. Voltage, current and power waveforms before, during and after a voltage sag with harmonics calculated. (2 examples)

Example 1. Voltage, current, power waveforms with harmonics calculated.

Example 2.
Conclusions:
HDPQ (and PX5/PG/PV) can record the voltage and current waveform samples. Then Dv6 or DV7 can calculate all the parameters from the samples.
This application note: shows the ability for the user to see not only waveform of power but also analyze the harmonics before during and after the voltage sag or decaying ring-wave event.
This application note also shows how the user can correct the data if the installer makes a connection mistake.
Questions: contact Terryc@powerquality.org
