Published by Electrotek Concepts, Inc., PQSoft Case Study: VCB Current Chopping Evaluation, Document ID: PQS1207, Date: June 1, 2012.
Abstract: This case study presents a customer vacuum circuit breaker (VCB) current chopping transient overvoltage evaluation. A high-frequency transient model was created to simulate vacuum circuit breaker opening and closing and the resulting transient overvoltages and arrester energy duties. Vacuum circuit breaker operations are one of the causes of high rate-of-rise (dv/dt) transients. The simulation results show that properly – designed R-C snubbers will reduce the initial rate-of-rise of the transient voltages, which may be beneficial because severe dv/dt transient voltages can damage the first few turns of insulation of dry-type transformers and motors or excite internal transformer resonances producing severe overvoltages.
VCB CURRENT CHOPPING TRANSIENT CASE STUDY
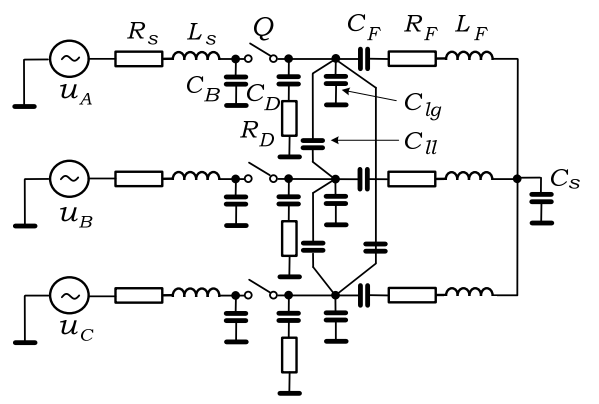
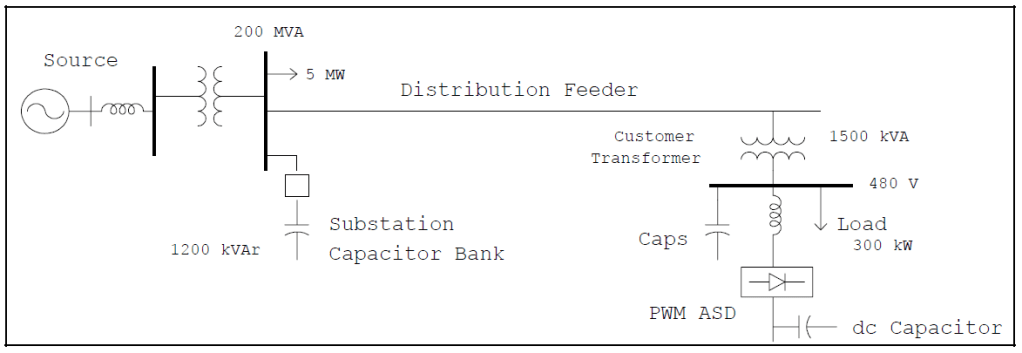
A customer vacuum circuit breaker (VCB) current chopping transient overvoltage evaluation was completed for the system shown in Figure 1. The principal objectives of the case study were to determine transient overvoltages and evaluate mitigation alternatives during vacuum circuit breaker current chopping events. The power conditioning mitigation alternatives of MOV surge arresters and R-C snubbers were also evaluated.
The simulations for the case study were completed using the PSCAD® program. A high frequency transient model was created to simulate the vacuum circuit breaker current chopping transients and resulting overvoltages and arrester energy duties. A high frequency model was required to accurately represent the very high current chopping transient frequencies.
A high-frequency transient model of a portion of the customer facility and the adjacent power system was created using the PSCAD simulation program. The transient simulation model consisted of an equivalent source impedance at the 21kV service entrance, two 2,000 kVA step-down transformers, 21kV vacuum circuit breakers (BKR #1 and BKR #2), cable segments between the main 21kV substation bus and transformers, and equivalent secondary load representations.
Traditional inductive transformer models generally look like an open circuit to very high frequency transients. Therefore, the 60 Hz transformer model can be improved by adding capacitances between windings and from the windings to ground. This type of model will act as a capacitive voltage divider to transfer a portion of the surge from the primary to the secondary windings. Bushing and winding capacitance values for the substation and customer step-down transformers were assumed based on typical data. Other substation equipment, such as circuit breakers and instrument transformers, are represented by their stray capacitances to ground. Typical stray capacitance values of substation equipment are provided in Annex B of IEEE Std. C37.011.

Power system apparatus, such as transformers, switchgear, and cables may be exposed to various types of transients. IEEE Std. 1159 (Recommended Practice for Monitoring Electric Power Quality) defines the various transient power quality categories. Some of the categories include additional subcategories for a more accurate description of a particular power quality variation. High-frequency oscillatory transients have a principle frequency range of 0.5 – 5.0MHz, typical durations of 5μs, and typical voltage magnitudes of 0 – 4.0 per-unit.
High-frequency transients and very steep overvoltages may cause problems for electrical equipment because they can create local overstressing of the insulation system. Vacuum circuit breaker opening and closing operations are one of the causes of these high rate-of – rise (dv/dt) transients. Dry-type transformers and motors are often more vulnerable due to their lower insulation level (BIL) ratings.
Vacuum circuit breakers are understood to be capable of initiating a phenomena described as current chopping. The physics of the vacuum circuit breaker allow for a smaller space to be utilized in the interruption of current in a vacuum. It is well well-known that these devices can interrupt (chop) current. This is a different behavior than typical air circuit breakers, which normally allow current arcing following contact separation until a natural zero crossing occurs. Usually, the current chopping phenomenon is not troublesome. However, there are specific circuit configurations that can cause problems. The most common concern results from the use of vacuum interrupters to de-energize unloaded transformers or other highly inductive circuits. In this case, the inductive current to the transformer is interrupted, causing a transient overvoltage. The equivalent circuit for this condition is shown in Figure 2.
The transient overvoltage may be approximated by evaluating the energy transfer between the inductor and the stray system capacitance in the circuit:
Energy = 1/2*LmIc2 = 1/2*CV2
V = √(Lm/C)*Ic = Zs*Ic
Zs = √(Lm/C)
where:
Ic = chopping current level (A)
Lm = transformer magnetizing inductance (H)
C = stray system capacitance (transformer side of switch) (F)
R = transformer losses (Ω)
Zs = surge impedance (Ω)
V = transient switching surge voltage (V)
The factor Zs in the equation is termed surge impedance. The equation shows that the transient overvoltage reached is the product of the current chopped (amps) and the surge impedance (ohms). It is an interesting relationship because it is independent of the actual system operating voltage. Current chopping has the capability to cause overvoltages that are many multiples (per-unit) of the system voltage. The expressions also highlight the importance of the stray system capacitance. In other words, more capacitance results in lower transient overvoltages. Most vacuum circuit interrupters are only capable of chopping 2-10 amps of current, which means the current will arc across separating contacts until the value of instantaneous current is below that range.
Because of a vacuum’s dielectric characteristics, vacuum circuit breakers are somewhat more likely to interrupt high-frequency current components during pre-striking and current chopping events than other types of switches (e.g., oil, air, SF6). This is due to the high di/dt at the moment that the current passes through zero. Pre-striking during vacuum circuit breaker closing occurs relatively often. However, the resulting transient overvoltages are generally relatively low compared to de-energizing current chopping.
There are several mitigation alternatives for controlling the high-frequency transients and very steep overvoltages that can overstress the insulation system of the electrical equipment. The most popular protection method is MOV surge arresters connected at the terminals of transformers and switchgear. Surge arresters provide overvoltage protection; however, they may not adequately limit very high rate-of-rise (dv/dt) transient voltages. Surge arresters do not filter the high-frequency oscillations and they do not eliminate reflected waves.
In addition to surge arresters, there are several mitigation alternatives that can control the rate-of-rise of the transient voltages. This is beneficial because severe dv/dt transient voltages can damage the first few turns of insulation of dry-type transformers and motors. Additional mitigation options include surge capacitors, snubbers, and series inductances. Snubbers are R-C filter networks that include fuses, capacitors and resistors.
A high-frequency transient model of a portion of the customer facility was developed using the PSCAD simulation program. This model was used for the vacuum circuit breaker current chopping analysis. The model was based on oneline drawings and other information that is summarized in this section. The model was designed so transient voltages could be determined for various vacuum circuit breakers operating conditions. A oneline diagram of the transient model was previously shown in Figure 1. The accuracy of the simulation model at 60 Hz was determined using simulated short-circuit fault current magnitudes and other steady-state quantities.
The representation of the 60 Hz source equivalent at the service entrance under assumed normal system conditions included:
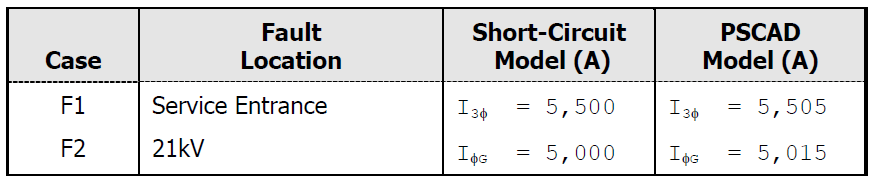
Three-phase (I3φ) fault current: 5,500 A, X/R = 11.4 (200.1 MVA)
Single-line-to-ground (IφG) fault current: 5,000 A, X/R = 11.4 (181.9 MVA)
Table 1 summarizes the results for the initial steady-state fault cases. The simulation model was also verified using a number of other steady-state quantities, such as bus voltages and transformer currents. The short-circuit equivalent at the service entrance bus represents a reduction of the entire utility system.
Table 1 – Steady-State 60Hz Short-Circuit Fault Comparison
The step-down transformers were modeled in PSCAD using the classical three-phase, two winding transformer model. The two transformers had winding voltage ratings of 21kV/480V and were connected delta/wye-ground. The transformer BIL ratings included 110kV for the high-side windings and 10kV for the low-side windings.
A summary of the transformer data included:
| Name | Rating | Ztx(%) | No Load Loss | Loss Load | Ie @ 100%V |
|---|---|---|---|---|---|
| TX #1 | 2,000kVA | 7.50% | 4,500W | 18,000W | 0.75% |
| TX #2 | 2,000kVA | 7.50% | 4,800W | 17,525W | 1.10% |
The nonlinear portion (saturation) of the transformer model was represented by specifying three parameters of the core saturation characteristic. The air core reactance of the transformers was assumed to be twice (2.0x) the leakage reactance (in per-unit), the knee voltage was assumed to be 1.2 per-unit, and the magnetizing currents were determined from the transformer test reports.
A traditional inductive transformer model generally looks like an open circuit to very high frequency transients. The 60 Hz transformer model can be improved by adding capacitances between windings and from the windings to ground. This type of model will act as a capacitive voltage divider to transfer a portion of the surge from the primary to the secondary windings. Capacitance values for the step-down transformers were based test report data. The capacitance values included in the transient model were CH = 200ρF, CL = 1,800ρF, and CHL = 1,200ρF.
Other substation equipment, such as circuit breakers and instrument transformers, were represented by their stray capacitances to ground. Typical stray capacitance values of substation equipment are provided in Annex B of IEEE Std. C37.011. When a range of values is given, the middle value was used. Based on the facility drawings, the relevant equipment was summarized and the equipment capacitances were totaled to determined effective values on the different segments of the 21kV apparatus. The values used in the simulation model included:
Effective Capacitance (segment between source and 200’ cable): 300ρF
Effective Capacitance (other elements on main switchgear bus): 1,200ρF
Effective Capacitance (between breaker #1 and transformer #1): 500ρF
Effective Capacitance (between breaker #2 and transformer #2): 500ρF
The MOV surge arrester was modeled in PSCAD using the built-in metal oxide surge arrestor model. This component models a gap-less metal oxide surge arrester, where the user may specify the I-V characteristic. The arrestor evaluated during the study included a Hubbell DynaVar PDV-100 for the step-down transformer primary winding.
The surge arrester ratings included:
Hubbell DynaVar PDV-100 (214222) Heavy Duty:
Rated Voltage (Duty Cycle): 27 kV
Maximum Continuous Operating Voltage (MCOV): 22 kV
Maximum Energy Discharge Capability: 2.2 kJ/kVrated MCOV
Maximum Energy Discharge Capability: 48.4 kJ
Maximum Switching Surge Protective Level (MSSPL): 58.0 kV (@ 500 A)
Maximum 0.5μs Discharge Voltage: 86.0 kV (@ 10kA)
Protective Characteristic (peak voltage – 8×20μsec discharge):
[1.5kA – 63.7kV, 3kA – 68.6kV, 5kA – 72.4kV, 10kA – 80.0kV, 20kA – 91.8kV, 40kA – 108.3kV]
The 21kV cable sections shown in Figure 1 were included in the transient model. Impedance data for the 60 Hz cables included:
Conductor: 500 kcmil
Positive sequence impedance (Z1): 0.1340 +j0.0970 Ω/1000’
Zero sequence impedance (Z0): 0.4420 +j0.3160 Ω/1000’
Capacitance (C1): 84.60ρF/ft
Conductor: 1/0 awg
Positive sequence impedance (Z1): 0.0350 +j0.0790 Ω/1000’
Zero sequence impedance (Z0): 0.3170 +j0.2170 Ω/1000’
Capacitance (C1): 51.35ρF/ft
A traveling wave model in PSCAD was used to represent each feeder segment for the high frequency vacuum circuit breaker switching analysis. The traveling wave model, which is based on the Bergeron method, is based on a distributed L-C parameter traveling wave line models, with lumped resistances. It represents the L and C elements of a PI section in a distributed manner. The program calculates the line constants for the cable segments before each simulation. The calculated surge impedance of the 500 kcmil conductor was approximately 55Ω and the calculated surge impedance of the 1/0 awg conductor was approximately 64Ω.
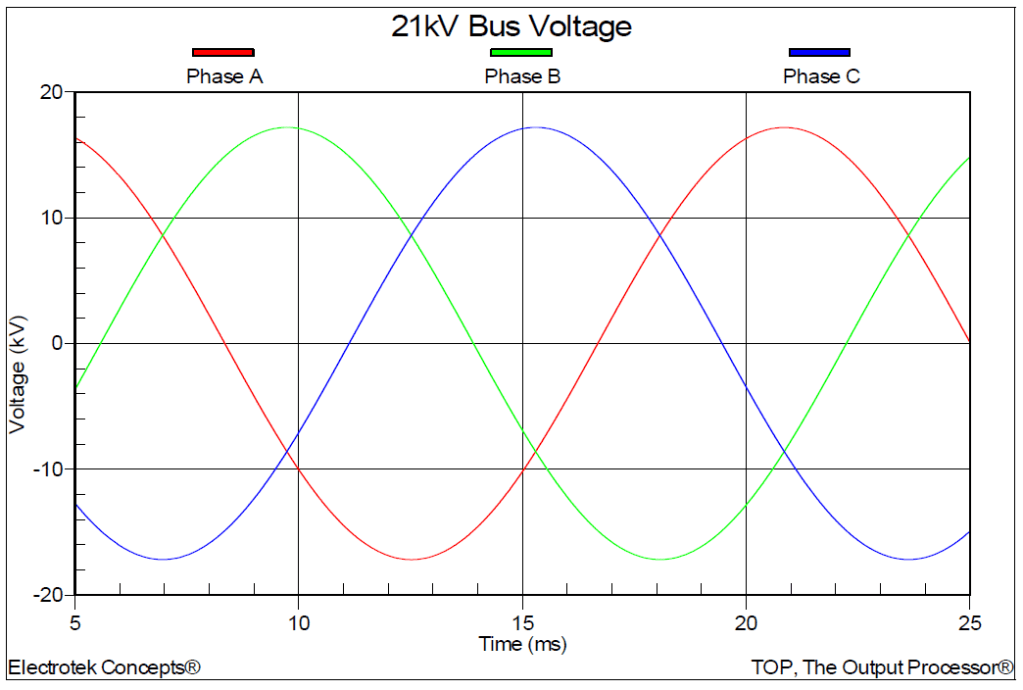
The initial simulation case (Case 1) included all of the components in Figure 1. Case 1 did not include any faults, vacuum circuit breaker operations, arresters, or other surge suppression devices. It was completed to assure that the desired steady-state voltages and power flow quantities were achieved before the current chopping cases were completed. The simulated steady-state 21kV bus voltage is shown in Figure 3. The simulation duration for Case 1 was 0.025 seconds (1.5 cycles) and the solution time step was 0.25μsec. It should be noted that a 1.0 per-unit peak line-to-ground voltage is 17.146kV (21kV*√2/√3). The step-down transformer secondary reactive load values were assumed to be 400kVAr, which results in a lightly loaded step-down transformer with approximately 10 amps rms current on the 21kV primary windings.
Opening a vacuum circuit breaker with no (0 amps) chopping current (ideal operation) produces relatively small transient voltages. Case 2 was completed to show the opening of the vacuum circuit breaker #1 (BRK1) with an ideal operation (no chopping current). The resulting transient voltages at the transformer 1 primary windings are shown in Figure 4.
Most vacuum circuit interrupters are only capable of chopping 2-10 amps of current, which means the current will arc across separating contacts until the value of instantaneous current is below that range. The current chopping value for the 21kV vacuum circuit breakers was assumed to be 8 amps.
Case 2 involved opening the vacuum circuit breaker #1 (BKR1) with an assumed chopping current of 8 amps. It should be noted that Case 2 did not include any arresters or other surge suppression devices. The timing for the circuit breaker contacts to open was 8.50msec.
Figure 5 shows the resulting three-phase circuit breaker #1 currents for Case 2. The figure highlights the phase currents being chopped at an 8 amp value. The current chopping produces the transient voltages at the transformer #1 primary winding that are shown in Figure 6. The magnitude of the transient overvoltage is the product of the current chopped (amps) and the surge impedance (ohms) of the circuit.
The peak transient voltage in Figure 6 was 118.601kV. This compares with a high-side transformer winding BIL rating of 110kV. The simulation case did not have any surge arresters included in the model. This case is used to show the worst-case voltages that would be present without any surge protection in-service. The time for the transient voltage to reach the 118.601kV value was approximately 110μsec.

Case 4 involved opening circuit breaker #1 with an assumed chopping current of 8 amps. Case 4 included a Hubbell DynaVar PDV-100 (27kV Rating, 22kV MCOV) arrester (three – phase set) connected to the transformer #1 primary windings.
Figure 7 shows the resulting three-phase transformer #1 primary winding voltages for Case 4. The peak transient voltage in Figure 7 was 44.551kV. This compares with a high-side winding BIL rating of 110kV. For comparison, the peak transient voltage without the surge arrester (Case 3) was 118.601kV for the 8 amp current chopping value.
The maximum simulated arrester energy duty was 0.12 kJ, which is approximately 0.25% of the assumed rated energy capability 48.4 kJ. The time for the transient voltage to reach the 44.551kV magnitude was approximately 70μsec. Case 4 shows how the surge arrester reduces the transient voltage magnitudes at the transformer primary terminals during the current chopping event.
Case 5 investigated opening circuit breaker #1 with a 8 amp chopping current and with an R-C snubber connected at the switchgear terminals. The snubber’s resistor value was 30Ω and the capacitor value was 0.25μF. Figure 8 shows the resulting three-phase transformer #1 primary winding voltages for Case
The peak transient voltage was 47.789kV. Case 5 shows how an R-C snubber affects the transient voltages at the transformer primary terminals during the current chopping event.
Figure 9 shows a comparison of the transformer #1 primary (Phase B) voltages for Cases 4 and 5. Case 4 included the arrester connected to the transformer #1 primary windings, while Case 5 included the R-C snubber connected at the switchgear terminals. Figure 9 emphasizes the fact that the rate-of-rise (dv/dt) for the case with the surge arresters is more severe. The comparison of the results shows that surge arresters provide overvoltage protection, but they may not limit high rate-of-rise (dv/dt) transient voltages. Properly – designed R-C snubbers should reduce the initial rate-of-rise of the transient voltages, which may be beneficial because severe dv/dt transient voltages can damage the first few turns of insulation of dry-type transformers or excite internal transformer resonances producing severe overvoltages.
SUMMARY
This case study summarized a customer vacuum circuit breaker (VCB) current chopping transient overvoltage evaluation. A high-frequency transient model was created to simulate the current chopping transients and resulting overvoltages and arrester energy duties. A high-frequency model was required to accurately represent the current chopping phenomena. The simulation results show that properly designed R-C snubbers will reduce the initial rate-of-rise of the transient voltages, which may be beneficial because severe dv/dt transient voltages can damage the first few turns of insulation of dry-type transformers and motors or excite internal transformer resonances producing severe overvoltages.
REFERENCES
- IEEE Guide for the Application of Insulation Coordination, IEEE Std. 1313.2-1999, IEEE, October 1999, ISBN: 0-7381-1761-7.
- IEEE Application Guide for Transient Recovery Voltage for AC High Voltage Circuit Breakers Rated on a Symmetrical Current Basis, IEEE Std. C37.011-1994, IEEE, ISBN: 1-55937-467-5.
- Electrical Transients in Power Systems, Allan Greenwood, Wiley-Interscience; Second Edition, April 18, 1991, ISBN: 0471620580.
- R.C. Dugan, M.F. McGranaghan, S. Santoso, H.W. Beaty, Electrical Power Systems Quality, McGraw-Hill Companies, Inc., November 2002, ISBN 0-07-138622-X.
- “IEEE Recommended Practice for Monitoring Electric Power Quality,” IEEE Std. 1159-2009, IEEE, June 2009, ISBN: 978-0-7381-5940-9.
RELATED STANDARDS
IEEE Std. 1313.2, IEEE Std. C37.011
GLOSSARY AND ACRONYMS
BIL: Basic Impulse Level
MCOV: Maximum Continuous Operating Voltage
MOV: Metal Oxide Varistor
PSCAD: Power Systems Computer Aided Design
TVSS: Transient Voltage Surge Suppressor
VCB: Vacuum Circuit Breaker