Published by Electrotek Concepts, Inc., PQSoft Case Study: Effect of Distribution Feeder Loading on Harmonic Resonance, Document ID: PQS0703, Date: July 26, 2007.
Abstract: A utility operates 1200 kVAr and 600 kVAr capacitor banks on a 25.56kV distribution feeder. The utility uses frequency scan simulations to determine the effect of the capacitor banks and seasonal load levels on the impedance vs. frequency response characteristics for the feeder. It is assumed that the results will be more severe for the low load condition because there are lower levels of damping.
This case study evaluates the effect of seasonal load variation on the frequency response characteristic of a 25.56kV distribution feeder.
INTRODUCTION AND MODEL DEVELOPMENT
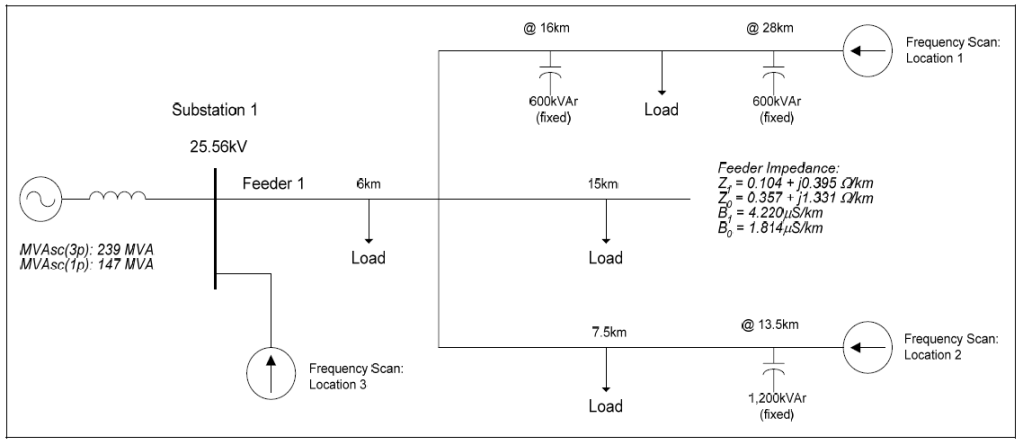
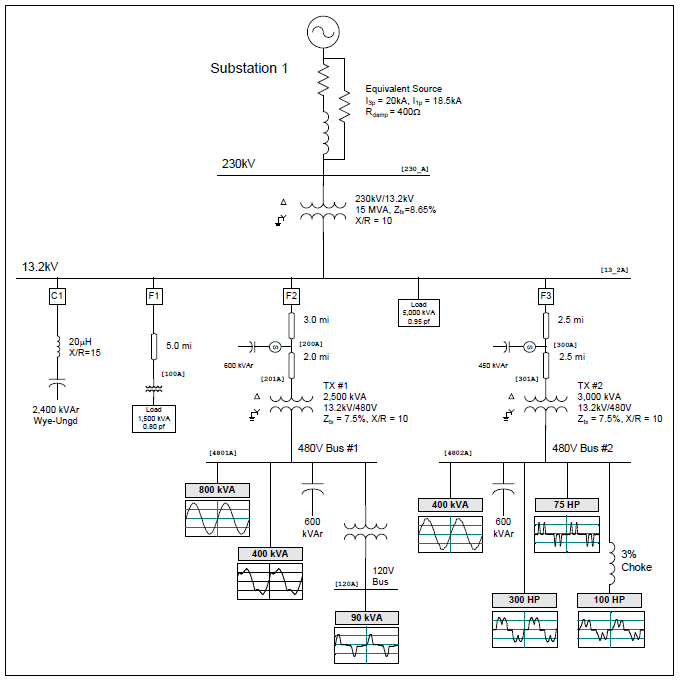
The effect of seasonal load variation on the frequency response characteristic of a 25.56kV distribution feeder was studied for the system shown in Figure 1. The accuracy of the system model was verified using three-phase and single-line-to-ground fault currents and other steady-state quantities, such as capacitor bank rated current and voltage rise. Frequency scan analysis was used to determine the impedance vs. frequency characteristic for the feeder for various operating conditions.
Figure 1 – Oneline Diagram for the Feeder Resonance Case Study
SIMULATION RESULTS
The following frequency scan cases were completed for the case study:
Case Number
Scan Location
Load Condition
Capacitor Bank Status
Case 1a
1
Full Load
All Off
Case 1b
1
Full Load
All On
Case 1c
2
Full Load
All Off
Case 1d
2
Full Load
All On
Case 1e
3
Full Load
All Off
Case 1f
3
Full Load
All On
Case 1g
1
30% Load
All Off
Case 1h
1
30% Load
All On
Case 1i
2
30% Load
All Off
Case 1j
2
30% Load
All On
Case 1k
3
30% Load
All Off
Case 1l
3
30% Load
All On
.
The frequency range for these cases was 60 Hz to 5,000 Hz (1 Hz increment). The load on the feeder for the “full load” condition was approximately 10.4 MVA at 98% power factor.
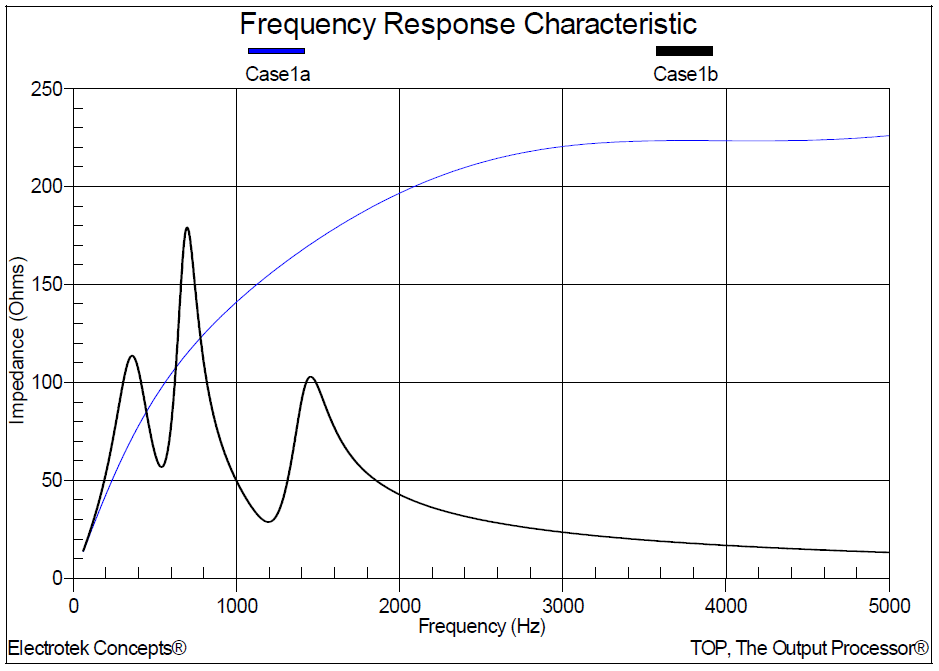
Figure 2 shows the impedance vs. frequency simulation results for scan location number 1 (600kVAr, full load) without and with the feeder capacitor banks in service.
Figure 2 – Frequency Response at Scan Location Number 1 with Full Load
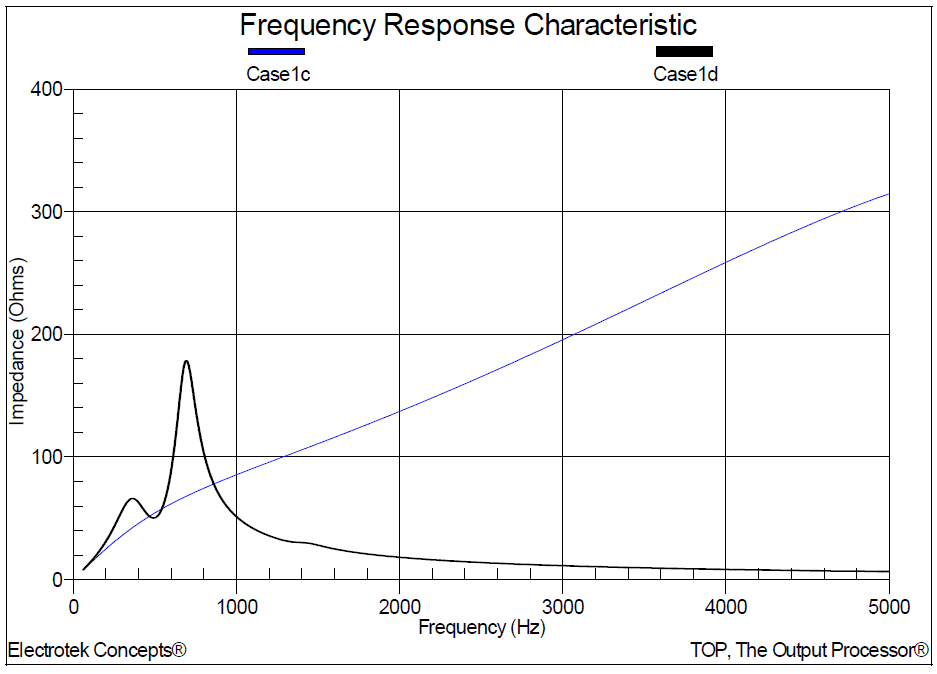
Figure 3 shows the impedance vs. frequency simulation results for scan location number 2 (1,200kVAr, full load) without and with the feeder capacitor banks in service.
Figure 3 – Frequency Response at Scan Location Number 2 with Full Load
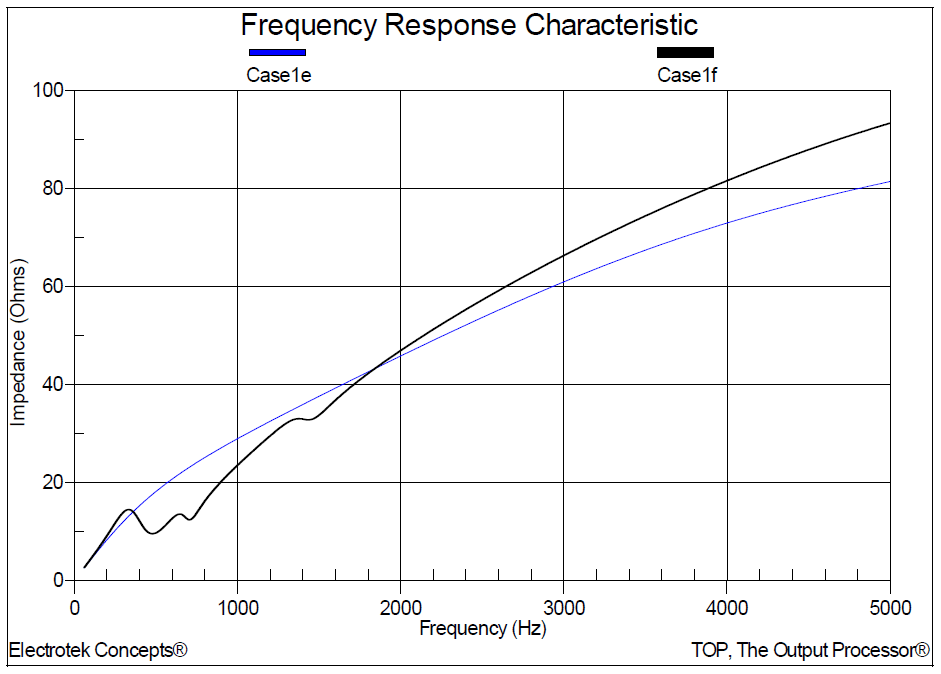
Figure 4 shows the impedance vs. frequency simulation results for scan location number 3 (substation bus, full load) without and with the feeder capacitor banks in service.
Figure 4 – Frequency Response at Scan Location Number 3 with Full Load
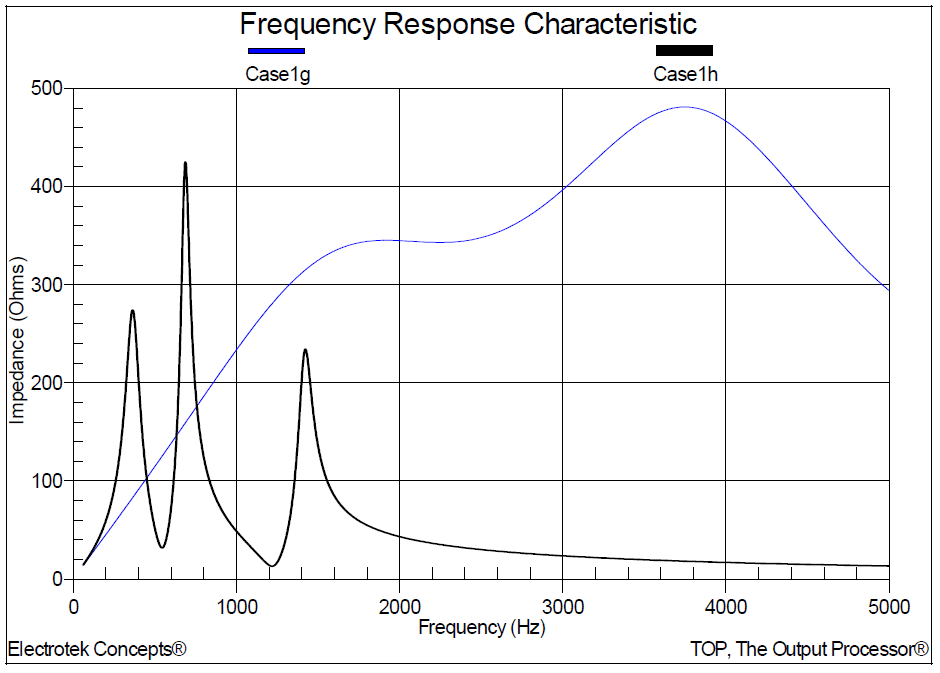
Figure 5 shows the impedance vs. frequency simulation results for scan location number 1 (600kVAr, 30% load) without and with the feeder capacitor banks in service.
Figure 5 – Frequency Response at Scan Location Number 1 with 30% Load
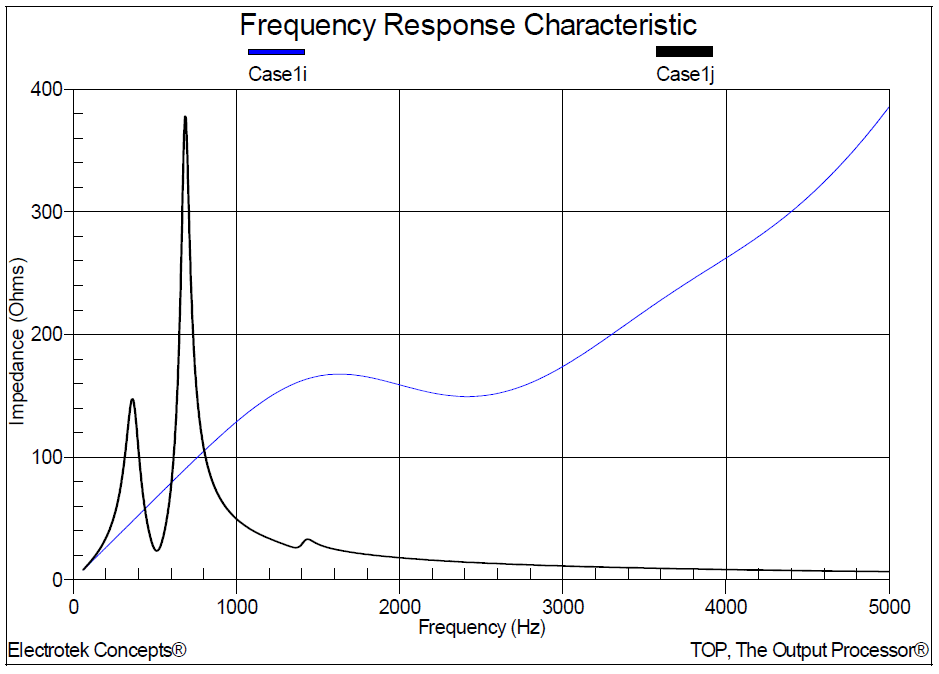
Figure 6 shows the impedance vs. frequency simulation results for scan location number 2 (1,200kVAr, 30% load) without and with the feeder capacitor banks in service.
Figure 6 – Frequency Response at Scan Location Number 2 with 30% Load
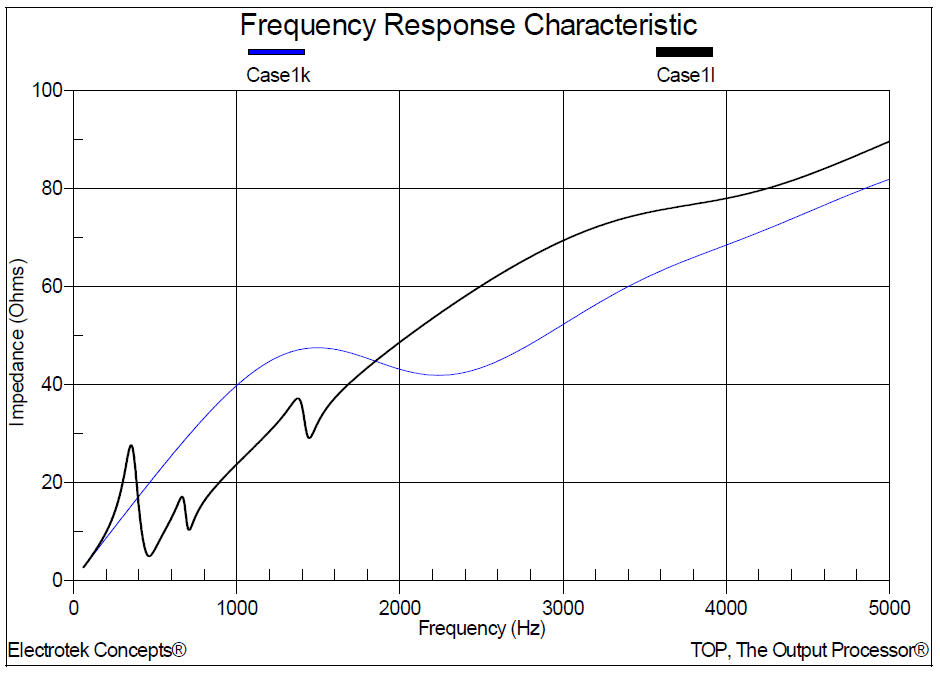
Figure 7 shows the impedance vs. frequency simulation results for scan location number 3 (substation bus, 30% load) without and with the feeder capacitor banks in service.
Figure 7 – Frequency Response at Scan Location Number 3 with 30% Load
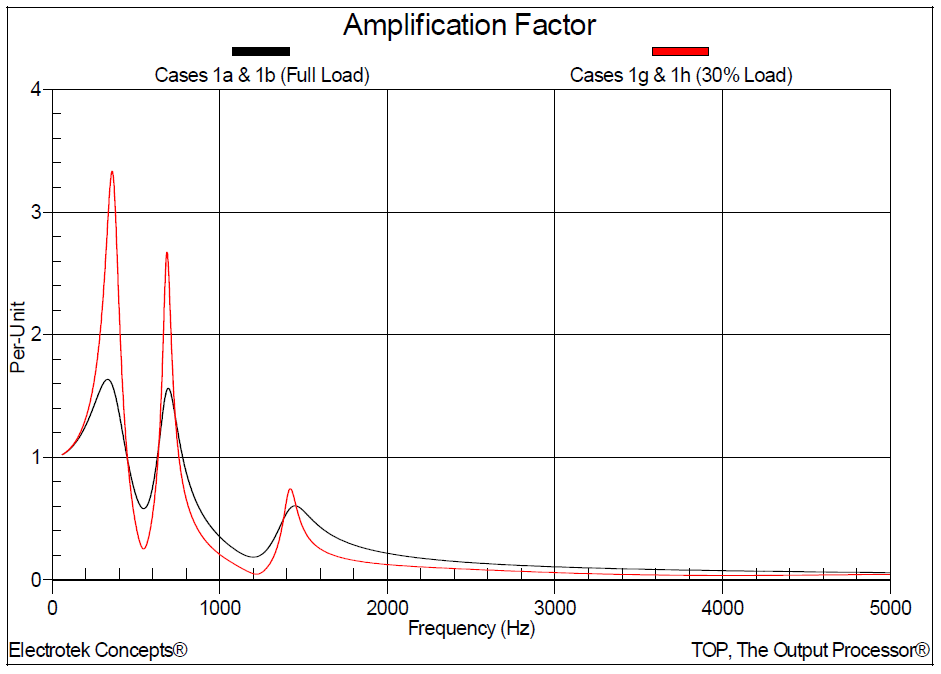
Figure 8 shows the amplification factors for scan location number 1 (600kVAr) for the full load and 30% load conditions. Amplification factor is defined as the ratio of impedance with capacitor banks to the impedance without capacitor banks (e.g., Case 1b divided by Case 1a).
Figure 8 – Amplification Factors for Scan Location Number 1
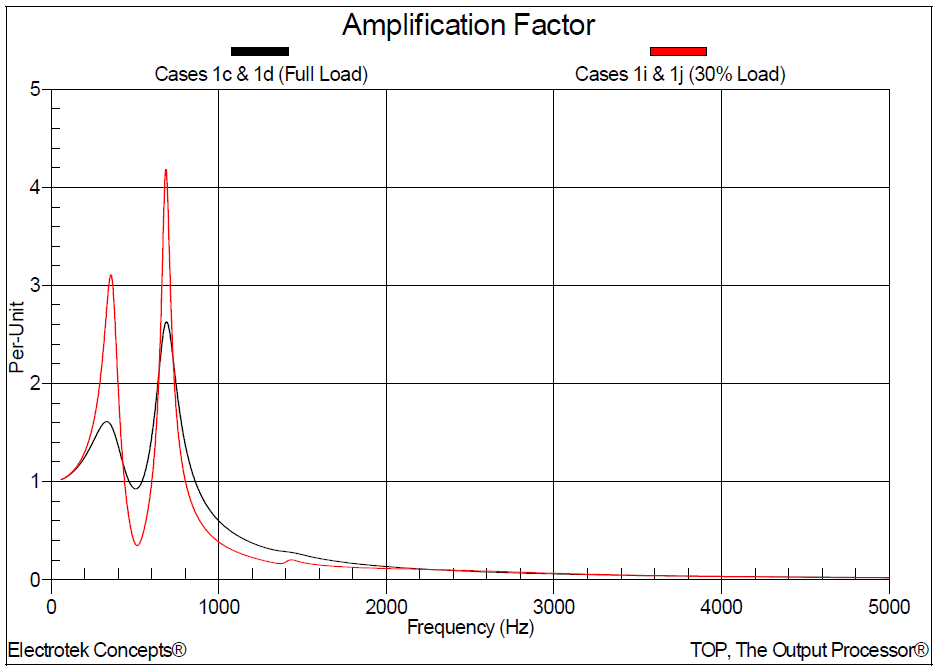
Figure 9 shows the amplification factors for scan location number 2 (1,200kVAr).
Figure 9 – Amplification Factors for Scan Location Number 2
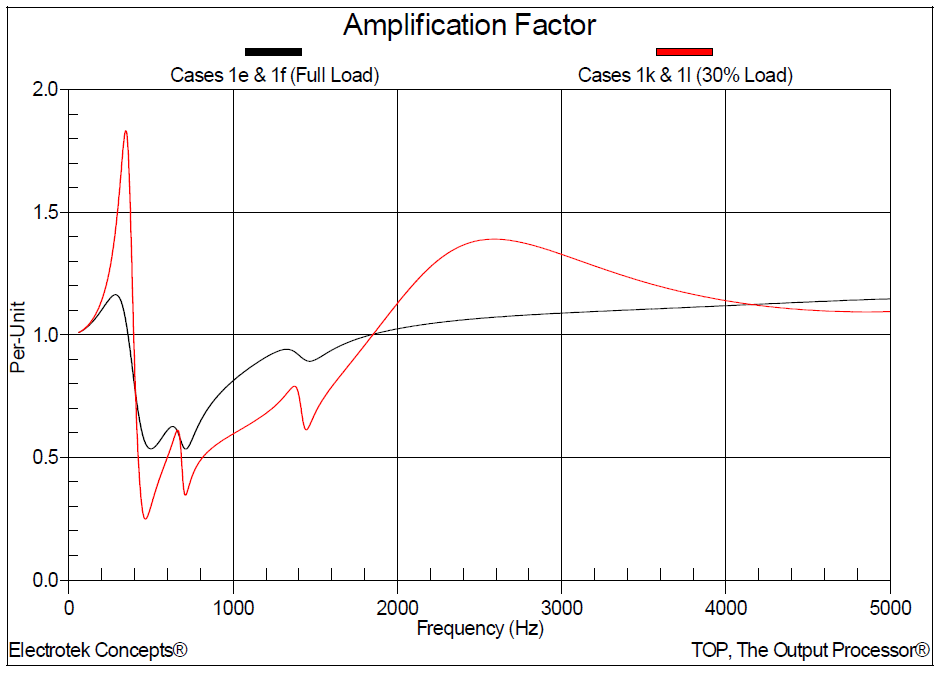
Figure 10 shows the amplification factors for scan location number 3 (substation bus).
Figure 10 – Amplification Factors for Scan Location Number 3
SUMMARY
The simulation results show that the impedance vs. frequency response characteristics for the feeder are more severe for the low load condition due to the fact that there are lower levels of damping (resistive elements).
Additional observations include:
1. For scan location number 1, the simulated parallel (high impedance) resonant frequencies were approximately 360 Hz, 700 Hz, and 1420 Hz. The series (lower impedance) resonant frequencies were approximately 540 Hz, and 1,200 Hz. The amplification factor range was between 0 and 3.4.
2. For scan location number 2, the parallel resonant frequencies were approximately 360 Hz and 700 Hz. The series resonant frequency was approximately 500 Hz. The amplification factor range was between 0 and 4.2.
3. For scan location number 3, the parallel resonant frequencies were approximately 360 Hz, 660 Hz, and 1380 Hz. The series resonant frequencies were approximately 460 Hz, 700 Hz, and 1440 Hz. The amplification factor range was between 0 and 1.83.
REFERENCES
Power System Harmonics, IEEE Tutorial Course, 84 EH0221-2-PWR, 1984.
RELATED STANDARDS IEEE Std. 519-1992, IEEE Std. 1036-1992
GLOSSARY AND ACRONYMS ASD: Adjustable-Speed Drive CF: Crest Factor DPF: Displacement Power Factor PF: Power Factor PWM: Pulse Width Modulation THD: Total Harmonic Distortion TPF: True Power Factor
Published by Andrzej OLENCKI1, Daniel BELICA2, Jarosław MARKIEWICZ3, Piotr MRÓZ4 , Calmet Spółka z o.o. Zielona Góra (1,2,3), Uniwersytet Zielonogórski (4)
Abstract. The development of Polish portable standards of power network parameters and their concepts are presented, taking into account the requirements of the IEEE-1459 standard in the scope of the separation of the fundamental frequency power components P1 and Q1 from apparent power S for the purpose of calibrating electricity meters. The issues of calibration uncertainty of working active power P1 meters were discussed and two concepts of their calibration were presented: with the use of active power P standards and wit the use of working active power P1 standards.
Streszczenie. Przedstawiono rozwój krajowych przenośnych wzorców parametrów sieci energetycznej i ich koncepcje z uwzględnieniem wymagań standardu IEEE-1459 w zakresie wydzielenia komponentów mocy P1 i Q1 o częstotliwości podstawowej z mocy pozornej S dla potrzeb wzorcowania liczników energii. Omówiono zagadnienia niepewności wzorcowania liczników roboczej mocy czynnej P1 oraz przedstawiono dwie koncepcje ich wzorcowania: z zastosowaniem wzorców mocy czynnej P i z zastosowaniem wzorców roboczej mocy czynnej P1. (Wzorce parametrów sieci energetycznej z implementacją definicji mocy wg IEEE-1459).
Keywords: electricity meter, reference meter, power calibrator, automatic test system. Słowa kluczowe: licznik energii elektrycznej, licznik wzorcowy, kalibrator mocy, automatyczny system testujący.
Introduction
The state of the three-phase power network is presented by means of a vector graph and a set of values of such network parameters as: voltages and currents, phase shift angles (or power factors), angles between voltages, frequency and also active, reactive and apparent powers and energies. To calculate the values of these parameters, parameter definitions and their analytical models in the form of equations are needed, which are implemented in the algorithms of measurement (for meters) and reproduction (for sources) of the power network parameter standards.
In 2010, after 30 years of discussing new power definitions, when the mechanism of electricity flow under non-sinusoidal conditions was well known, IEEE 1459 [1] was developed, which provides consistent and unambiguous power definitions better suited for electricity billing purposes under sinusoidal and non-sinusoidal conditions. The primary innovation of the IEEE 1459 standard is the separation of the fundamental frequency power components P1 and Q1 from the apparent power S. The active, reactive and apparent powers with basic frequency are the quintessence of the power flow in electric networks. They define what is generated, transmitted, distributed and sold by the electric utilities and bought by the end users. This standard is based on the belief that a fair distribution of financial burdens between the electricity supplier and recipient is a prerequisite for maintaining a high quality of electricity supply. In addition, it is stated that the current level of microprocessor technology allows manufacturers of electrical instruments to construct new, accurate and versatile metering equipment that are able to measure electricity defined by means of advanced mathematical models.
Technical specifications and subject standards for active energy meters currently used in North America (ANSI C12 series) and Europe (IEC 62052 series) and international recommendations OIML R46 [2] are not yet adapted to the rational settlement of energy in non-sinusoidal conditions. Currently, the need to measure the first harmonics of power for energy billing purposes only applies to reactive energy measurement [3].
Works [4, 5] describe the design of electricity meter construction with implemented the new power definitions of the IEEE 1459 standard for the needs of comparative measurements of power P and P1, Q and Q1 as well as S and S1 of energy flow in connections of real users. A Radian 4150 Meter Test Set [6] was used to calibrate and test these electricity meters. The 4150 includes a Radian RD-30 Reference Standard for determining the accuracy of the meter under test. Unfortunately the Radian RD-30 measures only P and Q powers and it is not possible to measure the fundamental frequency power components P1 and Q1 in non-sinusoidal conditions.
The errors evaluation of a wattmeter for the measurement of IEEE 1459 standard power quantities in non-sinusoidal conditions was described in [7]. A Multifunction Calibrator Fluke 5720A [8] and a precision current shunt were used as a power network parameters standard.
Induction meters are replaced for electronic meters in the last 20 years on a massive scale. During this time, many papers [9-12] were published on the errors of active energy electronic meters in relation to the requirements of current standards for meters. Unfortunately, these standards are based on the definition of power developed in the 1940s, this definition does not take into account the changes that have occurred in the last 50 years, in particular the flow of energy caused by harmonic voltages and currents [1, 13].
The development of polish standards for sinusoidal and non-sinusoidal, stable and variable power networks parameters, by 2009, is described in [14]. At that time, papers were published on the subject of energy flow directions as well as working and reflected active power [15] as well as the correctness of electricity meter readings. An important area of using network parameter standards is checking revenue electricity meters in two situations: meters connected to the network and meters disconnected from the network. The next part of the work describes the development of polish standards of network parameters in the last decade, with particular emphasis on the possibility of checking electricity meters P, P1, Q and Q1 under non-sinusoidal voltages and currents.
Standards for testing of electricity meters connected to the network
The indications of revenue electricity meters are the basis for financial settlements between the energy supplier and its recipient, and therefore checking the accuracy of meter indications is given big attention. This is manifested, inter alia, in checking the accuracy of the meters connected to the network on site of their installation. The recommended form of verifying the correctness of connecting the meter to the network and checking the error of the meter is the non-invasive connection of the meter tester (reference meter) into the circuit of the measuring and billing system, without the need to disconnect the current and voltage circuits of the meter, as shown in Figure 1.
Fig.1. The scheme of connecting the meter tester in the measuring and billing circuit
Meter testers, in accordance with the draft standard IEC 62057-2 [16], are named as the Portable Working Standard [17] or the Portable Reference Meter [18] and according to the definition [16] are working standards used for measurement of current, voltage, power, energy and error of electricity meters and also, if needed, for measurement of the burden for voltage and current transformers, determination of the ratio error and phase displacement for current transformers. The most advanced testers have implemented the power quality analyzer functionality, such as MTE PWS 3.3 [17] or the polish Calmet TE30 [19], which according to the terminology used in the standard [16] is named as a Portable Three Phase Standard Meter and Energy Quality Analyzer.
The TE30 tester introduced in 2014 meets the requirements of the IEC 62057 standard and has the functionality of an power quality analyzer and also is distinguished by the innovation possibility of measuring power and energy according to various versions of the power cuboid [20], in particular according to the IEEE 1459 [1] with separate components power P1 and Q1. The implemented functions of measuring the power spectrum, reflected active power, harmonic power and distortion power allow evaluation of energy flows. The reference meter function of the fundamental active power enables the measurement of percentage error in the calculation of electricity due to uncontrolled energy flows through the installed measuring and billing system. The energy cuboid measurement function with separated components of the first harmonics enables the measurement of all energy components for the calculation of non-technical losses of electricity caused to the harmonic energy flow [21].
Standards for testing of electricity meters disconnected from the network
The advantage of using standards to reproduce network parameters is that they allow checking electricity meters at all required load points of the meter, but this requires disconnecting the voltage and current circuits of the meter from the power grid, as shown in Figure 2. Two concepts are used to construction of standards to reproduce power network parameters:
• as a set of measuring power supply and reference meter necessary to ensure the required accuracy of voltage, current and power reproducing, • as a three-phase power and energy calibrator (Fig. 2).
In Poland, in Zielona Góra, from many years [14], the building concept of standards for testing of electricity meters disconnected from the network is been developing, based on the power and energy calibrators. In 2014, the three-phase power and energy calibrator Calmet C300B [22] was introduced with the function of an automatic electricity meter tester, which allows checking the meter error in two measurement configurations:
• with reference to the accuracy of the internal calibrator standard (Fig. 2). This makes it possible to check the electricity meter error of powers P and P1, Q and Q1 with uncertainty up to 0.02%,
• with reference to the accuracy of the external reference meter (Fig. 3). The measurement system is then implemented according to the first concept of standard construction, in which the calibrator performs the function of a precise three-phase measuring power supply and the function of standard is taken over by an external reference meter.
Fig.2. The scheme of the measuring system for checking the electricity meter error with the accuracy related to the calibrator
In the system with an external reference meter, shown in Figure 3, the calibrator has two impulse inputs for counting impulses from the meter under test and the reference meter. In this system it is possible to check electricity meters of such powers, which are measured by reference meters and with such uncertainties as guaranteed by reference meters. Well-known reference meters measure electricity of P and Q powers, e.g. the Radian RD33 meter [23], while the authors are not known of other, than TE30 [19], reference meters of P1 and Q1 powers.
Comparing the systems presented in Figures 2 and 3, it can be seen that the use of an external reference meter (Fig. 3) results in an almost double increase in the number of connections required. The revenue meter is a highly nonlinear load and connected as a meter under test to the calibrator output can cause additional distortion of the calibrator output signals. In a situation where additional and uncontrolled distortion of the calibrator output voltages and currents affects the accuracy of the meter error determination, it is recommended to use a system with an external reference meter.
Fig.3. The scheme of the measuring system for checking the electricity meter error with the accuracy related to the external reference meter
Automatic Test Systems
In recent years, a new kind of standards for checking electricity meters has appeared, which are named as the Three-phase Fully Automatic Test System with Reference Standard and Integrated Current and Voltage Source. Examples of such systems are Zera MT781 / MT786 [24], MTE PTS 3.3C [25] and the first Polish Calmet TS33 system [26]. These systems allow the checking of meters completely connected to the network (Fig. 1) or completely disconnected from the network (Fig. 2) and additionally checking the meters in the “mixed” connection system shown in Figure 4.
Fig.4. The scheme of the measuring system for checking the electricity meters in current injection mode
Checking the electricity meter error in a mixed system has two advantages simultaneously:
• non-invasive test – no need to disconnect the meter voltage and current circuits, • the possibility to perform an automatic test at predefined load points.
In the discussed connection system, the TS33 test system is used as a system with a reference meter and an integrated current source – the power calibrator of this system works in the mode of a three-phase synchronized current source (frequency and phase shift angles) with input voltage.
The TS33 system introduced in 2019 meets the requirements of the IEC 62057-2 standard [16] for the function of a reference meter, has the functionality of the power quality analyzer and is distinguished by the innovation possibility to measure and reproduce power and energy according to the IEEE 1459 [1] with separate components P1 and Q1 power for checking the error of electricity meters P, P1, Q and Q1 powers with uncertainty up to 0.05%.
Calibration uncertainty of electricity meters at fundamental frequency
Active power in non-sinusoidal conditions is given by the formula:
.
where: P1 – fundamental active power, Pn – harmonic active power of order n, PH – harmonic active power, Vn – RMS value of harmonic voltage of order n, In – RMS value of harmonic current of order n, φn – phase angle between the Vn and In.
Equation (1) shows, that two concepts of P1 electricity meter calibration are possible. The first, using the standard of fundamental harmonic active power, according to the following calibration equation:
.
where: P1MUT – reading from meter under test, P1S – fundamental active power measured or reproduced with used power network parameters standard, u(P1S) – uncertainty of fundamental active power of standard.
In the second concept, the active power standard can be used according to the following calibration equation:
.
where: PS – active power measured or reproduced with used power network parameters standard, u(PS) – uncertainty of active power of standard, PH – harmonic active power, u(PH) – uncertainty of harmonic active power of standard.
Equation (3) shows that calibration of the P1 electricity meter using the P power standard under non-sinusoidal conditions is possible – the P1 working power value is obtained by subtracting the calculated value of the harmonic power PH from the active power value PS . However, the uncertainty balance should take into account the uncertainty of harmonic active power expressed by the formula:
.
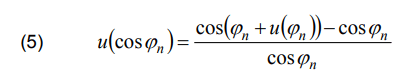
where: u(Vn)/Vn and u(In)/In are the uncertainties of voltage and current harmonics and u(cosφn) is the uncertainty of the harmonic power factor given by the formula:
.
where: u(φn) is the uncertainty of the harmonic phase shift angle.
Analysis of equations (4) and (5) shows that when calibrating the P1 active power meter using the P active power reference meter in the measuring systems shown in Figures 1 and 3, or using a calibrator (Fig. 2), knowledge is required on the values of amplitudes and harmonic phases of test voltages and currents of distorted signals and on the uncertainty of their reproduction.
The TE30 [19] reference meter, the C300B [22] calibrator and the TS33 [26] test system with the error check function of the P and P1, Q and Q1 power meters in non-sinusoidal conditions allow to check electricity meters according to the IEEE 1459 without the need for laborious procedures associated with taking into account the uncertainty of harmonics reproduction according to the formula (4).
Conclusions
The discussion about the need to measure the electricity of the fundamental active power for accounting purposes has been going on for many years and was crowned with the development of the IEEE 1459 standard. Over the past ten years, a new generation of portable power network parameters standards has been developed and introduced for production: TE30 reference meter with power quality analyzer function, C300B three-phase power / energy calibrator with automatic meter tester function and the first Polish Automatic Test System with a reference meter and integrated current and voltage source model TS33. All of the above standards have the functions of automated checking of active and reactive power electricity meters as well as the first harmonics of these powers implemented, which is an innovation in the area of power network parameters standards for the purposes of checking electricity meters. Calibration of P1 electricity meters using the P1 reference meter improves the calibration process because there is no need to include harmonics uncertainty (uncertainty of amplitudes and phases) in the uncertainty balance, what is required when using the P reference meter.
REFERENCES
[1] IEEE Std 1459-2010, IEEE Standard Definitions for the Measurement of Electric Power Quantities Under Sinusoidal, Nonsinusoidal, Balanced, or Unbalanced Conditions, The Institute of Electrical and Electronics Engineers, USA, 2010 [2] OIML R 46-1/-2 Edition 2012, Active electrical energy meters. Part 1: Metrological and technical requirements. Part 2: Metrological controls and performance tests, France, 2012 [3] IEC 62053-24:2014, Electricity metering equipment (a.c.) – Particular requirements – Part 24: Static meters for reactive energy at fundamental frequency (classes 0,5 S, 1 S and 1) [4] Berrisford A.J.: Smart Meters Should be Smarter, IEEE PES Conference, San Diego, California, USA, 2012 [5] Berrisford A.J.: A Smarter Meter: IEEE-1459 power definitions in an Off-the-Shelf Smart Meter, IEEE I2MTC Conference, Pisa, Italy, 2015, 830-835 [6] Automated Test Platform Model 4150, Radian Research, USA, http://www.radianresearch.com/pdf/Model_4150_Brochure_INTER.pdf [7] Cataliotti A., Cosentino V., Cara D., Lipari A., Nuccio S.: A DAQ-based sampling wattmeter for IEEE Std. 1459-2010 powers measurements. Uncertainty evaluation in non-sinusoidal conditions, Measurement, Volume 61, 2015, 27-38 [8] The 5700A/5720A Series II High Performance Multifunction Calibrators. Extended Specifications, Fluke, USA [9] Rui Wang, Jing Yuan: Study on electrical energy meter for energy measuring under harmonics condition, AEST Conference, China, 2016 [10] Volokhin V., Diahovchenko I., Kurochkina V., Kanalik M.: The influence of non-sinusoidal supply voltage on the amount of power consumption and electricity meter readings, Energetika, T .63 (2017), Nr. 1, 1-7 [11] Bilik P., Prauzek M., Josefova T.: Precision check of energy meters under nonsinusoidal conditions, CIRED Conference, Stockholm, 2013, 1-4 [12] Novotny J., Drapela J., Topolanek D.: Fraquency responce of revenue meters in measured active energy, ICHQP Conference, Brazil, 2016, 524-529 [13] Cetina Quijano, Roscoe A., Wright P.: Challenges for Smart Electricity Meters due to Dynamic Power Quality Conditions of the Grid: A Review, AMPS Conference, Liverpool, UK, 2017 [14] Olencki A.: Rozwój wzorców parametrów sieci energetycznej, Pomiary, Automatyka, Kontrola, nr 12, 2009, 409-411 [15] Czarnecki L., Toups T., Working and Reflected Active Powers of Three Phase Loads, Przegląd Elektrotechniczny, 91 (2015), nr.11, 149-153 [16] IEC 62057-2 /Ed.1, Portable Test Equipment and Test Procedure for Electricity Meter and Electricity Meter Installation, 2009 [17] PWS 3.3 Three-phase Portable Working Standard and Power Quality Analyzer, MTE, Switzerland, 2016, https://www.mte.ch/data/files/PWS%203.3%20English_R02%20(07.2016).pdf [18] MT320 Three Phase Reference Meter, ZERA, Germany, https://www.zera.de/fileadmin/pdf_and_more/Products/Meters/Portable/MT320_CAT_EXT_GB_V105.pdf [19] Three Phase Network Analyzer and Tester of Electricity Meters and Instrument Transformers TE30. Calmet, TE30 Data sheet EN 2018-03 https://www.calmet.com.pl/images/pdf/TE30-Three-Phase-Working-Standard-Data-Sheet-EN.pdf [20] Olencki A.: Sprawdzanie poprawności pomiaru energii elektrycznej z zastosowaniem wzorca prostopadłościanu mocy i energii, Zeszyty Naukowe Wydziału Elektrotechniki i Automatyki Politechniki Gdańskiej, Nr 66, 2019, 67-70 [21] Olencki A.: Pomiar strat nietechnicznych energii elektrycznej z wykorzystaniem nowoczesnych technik diagnostycznych, Pomiary i Diagnostyka w Sieciach Elektroenergetycznych, Kołobrzeg, 2018, 35-44 [22] Three Phase Power Calibrator and Tester of Power Engineering Devices C300B. Calmet, C300B Data sheet EN 2019-06 https://www.calmet.com.pl/images/pdf/C300B-ThreePhase-Power-Calibrator-Data-Sheet-EN.pdf [23] RD33 Portable Three-phase Electricity Standard, Operations Manual, Radian Research, USA, http://www.radianresearch.com/manuals/RD-33.pdf [24] Moving Test – MT781/MT786 Three-phase Fully Automatic Test System with Integrated Current and Voltage Source, Zera,Germany, 2016, https://www.zera.de/fileadmin/pdf_and_more/Products/Meters/Portable/MT78x_Pros_EXT_GB_V404.pdf [25] PTS 3.3C Three-phase fully automatic test system with class 0.05 reference standard and integrated three-phase current and voltage source, MTE Meter Test Equipment, Switzerland, 2015, https://www.mte.ch/data/files/PTS%203.3%20C%20English_R04%20(08.2015).pdf [26] Three-phase Fully Automatic Test System with Reference Standard and Integrated Current and Voltage Source TS33. Calmet, TS33 Data sheet EN 2019-06 https://www.calmet.com.pl/images/pdf/TS33-Three-PhaseFully-Automatic-Test-System-Data-Sheet-EN.
Authors: dr hab. inż. Andrzej Olencki, Calmet Spółka z o.o., ul. Kukułcza 18, 65-472 Zielona Góra, E-mail: A.Olencki@calmet.eu; mgr inż. Daniel Belica, Calmet Spółka z o.o., ul. Kukułcza 18, 65- 472 Zielona Góra, E-mail: D.Belica@calmet.eu; mgr inż. JarosławMarkiewicz, Calmet spółka z o.o., ul. Kukułcza 18, 65-472 Zielona Góra, E-mail: J.Markiewicz@calmet.eu; dr inż. Piotr Mróz, Uniwersytet Zielonogórski, Instytut Metrologii, Elektroniki i Informatyki, ul. Prof. Z. Szafrana 2, 65-516 Zielona Góra, E-mail: P.Mroz@imei.uz.zgora.pl
Source & Publisher Item Identifier: PRZEGLĄD ELEKTROTECHNICZNY, ISSN 0033-2097, R. 96 NR 3/2020. doi:10.15199/48.2020.03.01
Published by Krzysztof PRZYSTUPA1, Lublin University of Technology (1)
Abstract. The article discusses the problem of the widespread use of devices that require increased quality electric power supply. An example of a practical division of electricity receipts into several categories is shown. Methods of increasing the reliability of power supply are described and the most commonly used technical solutions for this purpose are discussed.
Streszczenie. W artykule omówiono problem powszechnego występowania urządzeń, które wymagają zasilania o podwyższonej jakości dostaw energii elektrycznej. Pokazano przykład praktycznego podziału odbiorów energii elektrycznej na kilka kategorii. Opisano metody zwiększenia niezawodności zasilania oraz omówiono najczęściej stosowane w tym celu rozwiązania techniczne. Wybrane metody poprawy niezawodności zasilania
Keywords: power negativity, power quality, Uninterruptible Power Supply (UPS) Słowa kluczowe: niezawodność zasilania, jakość zasilania, zasilacz bezprzerwowy (UPS)
Introduction
There are many types of electricity receivers that require continuous and almost ideal power supply. Despite the fact that the degree of power supply reliability in the power system is very high, IT equipment, data processing and transmission equipment, precise control units and control of long-term industrial processes are sensitive to various types of interference that may occur in the power grid. The scale of the problem is also shown by the fact that the requirements for the power quality are important for different receivers: on the one hand, it can be medical equipment, and on the other, ordinary LED lighting [1].
Phenomena disrupting energy supply not only cause deterioration of power quality in the sense defined by ISO 9000 series standards but also affect the durability of devices, their lifetime and reliability. Poor power quality also has an adverse effect on the quality of products manufactured with sensitive devices. An example may be the quality of the produced light, errors in data transmission or the quality of the surface worked in the milling process. For correct operation of the described devices, it is necessary to use guaranteed electric power supply systems, both AC and DC [2-4].
Different requirements as to the reliability of the power supply resulted in the development of recipients’ classification. The main division concerns two groups: industrial recipients and municipal recipients. It has been assumed that there are three categories of recipients in the group of industrial recipients:
• Category I – with the highest requirements (highest reliability of power supply). These are devices whose failure may cause a threat to human life or very serious material losses.
• Category II – with increased requirements regarding the quality and reliability of power supply. These are devices whose failure causes losses in production.
• Category III – with no special requirements. These are other devices not classified in categories I or II.
When designing the power system for devices of category I, it is necessary to take into account the detailed requirements of individual devices and, without using a relatively adequate back-up power supply system, which must be independent of the basic power supply. In the case of the third category, sometimes the back-up systems are also used, but only when it is economically justified. The described division results from project findings and it is not directly related to the applicable law. It should be noted that the categorization of devices is very often related to the structure of the external power grid and distribution network inside the plant.
In practice, the technical capabilities of the local electricity supplier (distribution company) are very important and decisive.
Municipal recipients, i.e. recipients supplied from public distribution networks usually with a voltage of up to 1kV, are non-industrial recipients with public facilities (residential buildings, banks and hospital buildings with some exceptions, offices, railway facilities, aviation objects, commercial facilities, etc.). This group is sometimes also divided into three or four categories.
In category I with the highest priority power supply, the recipients require uninterruptible power supply or have devices in the case of which the power supply must be reliable. The applied solutions consist in using uninterruptible power supply from a back-up source, e.g. power generator adapted for long-lasting work. This solution is used for hospital operating rooms, banking computer systems, etc.
In category II with a high priority supply power, breaks should not exceed 1 second. For this purpose, for example, two independent power lines from the energy system are used. Entities belonging to this group are: hospitals, radio stations, railway stations and equipment, airports, etc.
In category III with a medium power supply priority, breaks should not exceed several seconds. The solutions applied mainly concern emergency lighting as well as numerically controlled elements and devices. The problem is solved by power generators. The energy consumers in this group are, for example, large residential buildings, large office buildings, and sometimes road infrastructure elements.
In the last IV category there are no additional requirements as to the reliability of power supply. Relatively long power interruptions lasting even many minutes are allowed. Typical objects in this category are single-family houses in rural areas, houses in sparse urban buildings, blocks of flats etc. Most often, these objects are powered by a single radial line.
The presented division, similarly as in the case of industrial recipients, is not legally defined, but it rather results from design practice and distribution companies [5].
Increased reliability of power supply
Increasing the reliability of power supply can be obtained through various financial investments, with the increase in reliability being determined by the exponential function.
This makes it necessary to choose a reasonable investment, which should be determined by considering the required parameters, which include:
The power of the source and the maximum time to deliver energy.
• Switchover time, i.e. the time from the moment of voltage decay on the basic source until the load is supplied from the back-up source. Yet, this time is often extended by the time of decreasing the power quality and the time of returning to the appropriate minimum level of power quality. • Efficiency of the applied solution. • Maintenance cost both during work and stand-by.
An ideal alternative source of back-up power should meet the following requirements:
• Unlimited source of energy, i.e. high power. • Unlimited working time. • Zero changeover time. • Low operating costs during operation. • Zero operating costs while waiting.
Unfortunately, practical solutions do not have such parameters. Table 1 presents the most common practical solutions for back-up power supply and their feature
Table 1. Backup power supply devices and their parameters
Type of supply
Source power
Changeover time
Installation costs
Additional power line from the grid
Unlimited
From milliseconds to seconds
Very high
Power generator
Nearly unlimited
From a few seconds to a few minutes (rarely less than a second)
From medium to high
Batteries
Usually low, Rarely medium, Occasionally high.
From a few seconds to nearly seamless
Low or medium
Uninterruptible power supply (UPS)
From low to high. Rarely low.
From less than a second to nearly seamless
From medium to high
.
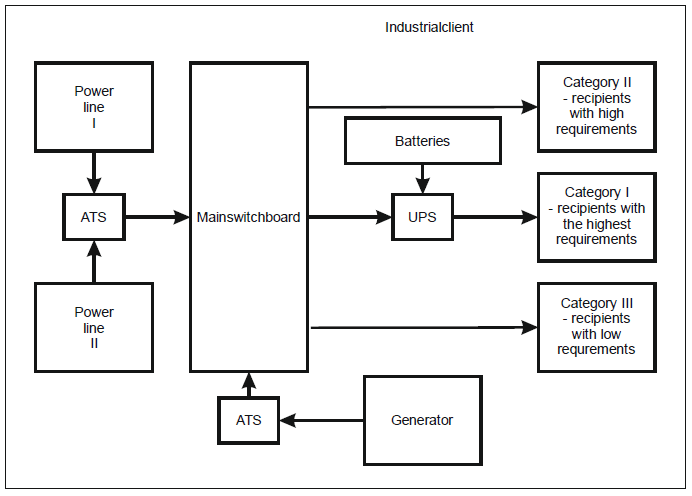
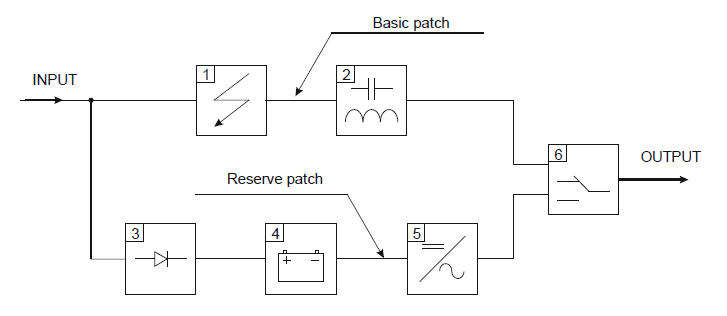
According to Table 1, recipients with increased requirements for energy quality and reliability of its supply should be supplied from at least two power lines. Such a power supply requires the use of ATS automatics – automatic switching on of the reserve. This solution is the most expensive, but at the same time provides unlimited power supplies. An alternative to using power from the second power line is the use of a power generator. In this case, the investment costs are much lower than those related to the construction of the power line but the delivered power drops significantly. The time required to start the unit can also be extended. This solution also requires ATS automation and complex automation to control the operation of the unit. The use of the generator may be the third route of energy supply in the case of particularly demanding customers (two power lines and generator), such a solution greatly increases the reliability of energy supplies but increases the possibility of extending the total time of reserve power supply [6].
Fig.1. The power supply system of a customer with increased requirements for reliability
In case of recipients using important IT systems, local computer networks, microprocessor devices controlling complex technological processes, UPS uninterruptible power supplies are used. They provide an almost reliable power supply, with low power, in a relatively long time with a very short switching time of the power source. UPS devices in the internal structure have ASS automatics. Fig.1 shows an example of a customer supply system with increased requirements for power reliability [7-9].
Two-sided power supply
The two-sided power supply from the power grid is implemented from two independent main power points, so-called MSP (main supply point). It can be implemented using high voltage (HV) networks, medium voltage (MV) networks and sometimes even low voltage (LV) networks.
Generators
There are four groups of power generators:
• In the first group there are generators that are switched on manually after power supply decay. The power of these generators is from several dozen KW to several MW. The time of readiness for loading depends on the power and ranges from 5-15 seconds for small devices up to 3-4 minutes for the largest devices.
• In the second group there are devices with powers similar to those of the first group, but these are devices equipped with electronics enabling automatic start. This solution significantly shortens the time of preparing the device for load.
• In the third group there are devices equipped with a flywheel (constantly rotating mass). The second characteristic feature of these devices is equipping them with the most frequently controlled electronic clutch. Aggregates of this group work according to the following algorithm: an electric motor powered from the basic power line continuously drives the flywheel on the common shaft with an electric generator. However, the generator does not work because it is disconnected by the clutch. In the event of a failure, the clutch is switched and the generator starts producing energy. During the nominal operation of the generator, the drive is carried out by combustion engines. In the group of these devices there are those in which the generator operates in the idle state and after the supply voltage decays, the generator goes into the rated operating state. The spinning mass provides the necessary energy for a period of time from the power supply failure until the generator’s generator drive is fully started.
• In the fourth group there are devices of similar construction to those from the third group, with the generator working in them continuously supplying selected important devices. At the moment of the power supply decay, the generator load is increased by attaching additional receivers.
Batteries
In industrial practice, two types of systems are used in which the batteries work [10]:
• In the normal operating condition of the supply network, the batteries are constantly recharged. In the event of a failure of the basic power supply, the battery is switched on. This system is used to power the so-called own needs, e.g. telephone switchboard, power supply for DC receivers, as well as receivers that can be powered by both direct and alternating current, e.g. emergency lighting.
• In the second system there is a much larger rectifier that simultaneously recharges the batteries and supplies the load. It is only in the event of an emergency that the energy consumption from the batteries is started. The system of such work has features characteristic for uninterruptible power supplies.
Uninterruptible Power Supply (UPS)
Uninterruptible Power Supply UPS units are intended for supplying loads with the highest quality requirements, and especially for power supply continuity [11-14]. In industrial practice there are three basic types of UPS:
• Passive readiness (VFD class sometimes referred to as off-line). • Double conversion (VFI class sometimes referred to as on-line). • Interactive line (class VI sometimes referred to as hybrid).
Off-line systems charge the battery during normal operation of the basic power supply. At the moment of the failure of the basic power supply, the inverter is started, which draws energy from the batteries providing the necessary power supply to the receivers (Fig. 2). In off-line power supplies, the primary power source is the power grid. The backup power source is batteries, or less often their sets. In simplified terms, it can be said that the off-line power supply “does nothing” until a power failure occurs. This failure does not have to involve a power failure. It may also be a change in amplitude or frequency. The operation of the switch (6 fig. 2) depends on the electronic logic used.
Fig.2. Block diagram of UPS, off-line type (standby)
The relatively long time of switching paths from primary to standby is a fundamental disadvantage of VFD (off-line) power supplies.
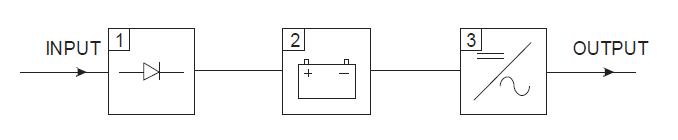
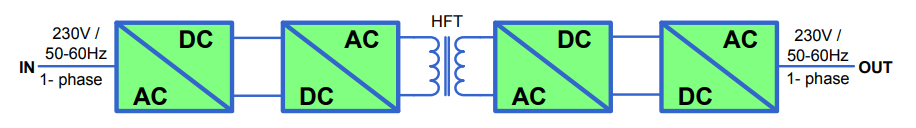
On-line systems are based on a complete idea from separating the receiver from the power grid (Fig. 3). The energy taken from the network is used only for charging the battery. The power supply is supplied from the energy accumulated in the battery through the inverter.
Fig.3. Block diagram of UPS, on-line type without bypass
Theoretically, a completely smooth and imperceptible transition of the receiver from the basic power supply to the standby power supply is the key advantage of the VFI (online) power supplies. The second advantageous feature of this type of power supplies is the possibility of the receiver working with the frequency of the supply voltage other than the frequency of charging the battery system.
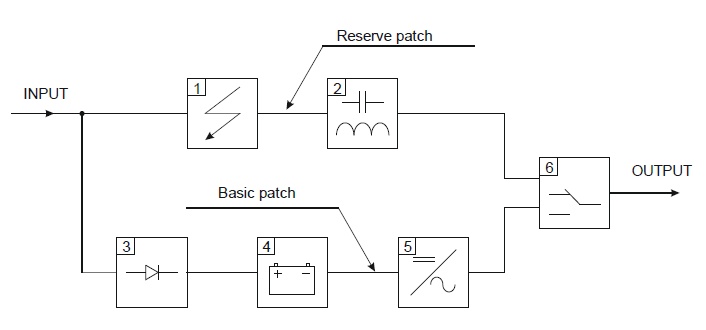
Linear interactive UPSs work in such a way that during normal operation of the basic power part of the energy is consumed permanently recharging the battery. At the same time, some of the battery energy continuously goes to the receiver. In this solution, there is a constant power backup for the primary energy backup (Fig.5 and Fig. 6).
The main part of the solution shown in Fig.5. is a transformer with three windings (6). Two of them constitute a classical network transformer and the third winding placed on the primary side has a control and intervention role. In its circuit there is a battery and DC/AC converter or an electronic system that works in one direction as an inverter and in the opposite direction as a rectifier. This winding is used to introduce corrective energy in the moments of loss of basic power supply or energy reception when there is too much of it. In the event of a power failure, the auxiliary winding takes over the whole task of supplying energy.
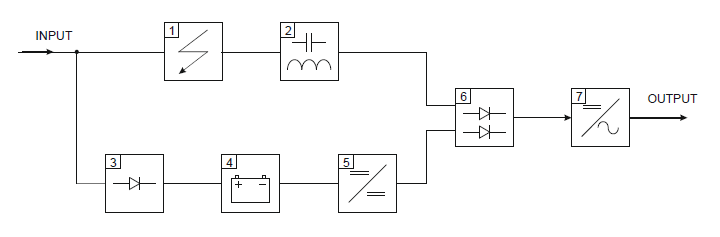
In the situation of power supply of devices that do not allow disturbances in the shape and frequency of power supply, systems similar to the solution proposed in Fig. 6 are used.
The inverter (5 -Fig.6) in the state of waiting for power failures does not work. It is launched when it is detected. The battery charging system (3 -Fig.6.) is small because it works only for the needs of the battery. This type of power supply does not show or has a very low switching time. The last group of devices used to improve the reliability of power supply are non-conventional devices. We include devices using super capacitors, flywheels and superconducting magnetic energy storage (SMES) [15].
REFERENCES
[1] Arrillaga J., Neville R., Watson S., and Chen S., Power system quality assessment. Chichester, England: John Wiley & Sons, 2000. [2] Bollen M. H. & Bollen M. H., Understanding power quality problems: voltage sags and interruptions. Vol. 445. New York: IEEE press, 2000. [3] Arrilaga J., Watson N. R., Chen S., Power system quality assessment. John Wiley & Sons, Chichester, New York, Weinheim, Brisbane, Singapore, Toronto, 2000. [4] Barlik R., Nowak M., Jakość energii elektrycznej-stan obecny i perspektywy. Przegląd Elektrotechniczny, 2005, 81: 1-12. [5] Klajn A., Markiewicz H., Jakość energii i nie zawodność zasilania w instalacjach elektrycznych. Dodatek do miesięcznika INPE, Zeszyt 14, marzec 2017. [6] Siwy, E., Witek B., Wybrane zagadnienia technicznej realizacji koncepcji Smart Grid w kontekście jakości zasilania z sieci z generacją rozproszoną. Przegląd Elektrotechniczny 88.8 (2012): 116-119. [7] Dołęga W., Układy zasilania zakładów przemysłowych w aspekcie niezawodności i pewności dostawy energii elektrycznej. Mechanizacja i automatyzacja górnictwa 49 (2011): 23-26. [8] Sutkowski T., Rezerwowe i bezprzerwowe zasilanie w energię elektryczną-urządzenia i układy. Stowarzyszenie Elektryków Polskich. Centralny Ośrodek Szkolenia i Wydawnictw, 2007. [9] Martyniak T., Nawrocki J., Antończyk B., Optymalizacja doboru agregatów prądotwórczych oraz wytyczne ich zabudowy w pojazdach specjalnych, Szybkobieżne Pojazdy Gąsienicowe 1 (2005). [10] Wiatr J., Miegoń M., Zasilacze UPS oraz baterie akumulatorów w układach zasilania gwarantowanego. Dom Wydawniczy MEDIUM, 2008. [11] PN-EN 62040, Systemy bezprzerwowego zasilania (UPS). [12] Lasseter R. H., Eto J. H., Schenkman B., Stevens J., Vollkommer H., Klapp D., Linton E., Hurtado H., Roy J., CERTS microgrid laboratory test Bed, IEEE Transactions on Power Delivery, 26 (1), art. no. 5673682, pp. 325-332. 2011. [13] Lasseter R.H., Smart distribution: Coupled microgrids, Proceedings of the IEEE, 99 (6), art. no. 5768104, pp. 1074-1082, 2011. [14] Aamir M., Mekhilef S., An Online Transformerless Uninterruptible Power Supply (UPS) System with a Smaller Battery Bank for Low-Power Applications, IEEE Transactions on Power Electronics, 32 (1), art. no. 7428955, pp. 233-247, 2017. [15] Cieśla A., Skowron M., Pole magnetyczne jako źródło energii w nadprzewodnikowych zasobnikach energii. Przegląd Elektrotechniczny 94 (2018).
Authors: Krzysztof Przystupa, PhD, Eng. Politechnika Lubelska, Wydział Mechaniczny, Katedra Automatyzacji, ul. Nadbystrzycka 36, 20-618 Lublin, E-mail: k.przystupa@pollub.pl
Source & Publisher Item Identifier: PRZEGLĄD ELEKTROTECHNICZNY, ISSN 0033-2097, R. 94 NR 12/2018. doi:10.15199/48.2018.12.62
Published by Andrzej ŁEBKOWSKI, Gdynia Maritime University, Department of Ship Automation
Abstract. The paper presents the results of temperature and short-circuit research of battery types most commonly used in electric vehicles. Basing on performed tests, the plots of changing internal resistance of lead-acid and lithium batteries are shown. On the basis of conducted short-circuit experiments of selected lithium based batteries of types used in electric vehicles, the risk of fire occurrence is made. (Badania termiczne, przeładowania oraz zwarciowe akumulatorów stosowanych w pojazdach elektrycznych).
Streszczenie. W pracy przedstawiono wyniki badań temperaturowych oraz zwarciowych dla najczęściej stosowanych typów akumulatorów w pojazdach elektrycznych. W oparciu o przeprowadzone badania, przedstawiono przebiegi zmian rezystancji wewnętrznej akumulatorów kwasowych oraz litowych w zależności od temperatury. Na podstawie przeprowadzonych badań zwarciowych wybranych typów akumulatorów litowych stosowanych w pojazdach z napędem elektrycznym, dokonano oceny możliwości pojawienia się pożaru.
Słowa kluczowe: pojazdy elektryczne, akumulatory litowe, właściwości termiczne i zwarciowe, rezystancja wewnętrzna. Keywords: electric vehicles (EV), lithium batteries (Li-Ion, LiFePO4, LTO), thermal & short-circuit behavior, internal resistance.
Introduction
The problem of properties of batteries powering the electric powertrains in vehicles is a topic of many academic papers. The vehicles manufacturers are offering their products with many battery types, beginning from the cheapest Lead-Acid (Pb-A), through nickel based batteries (Ni-Fe, Ni-Zn, Ni-Cd, Ni-MH), lithium based (Li-Ion, LiTiO, LiCoO, Li-MnO2 LiMn2O4, LiFePO4, LiSO2, Li-SOCl2, LTO), up to the newest, state of the art graphene polymer batteries.
The engineers are trying to optimize the performance of traction batteries in order to maximize the vehicle’s functionality (largest possible usable volume inside the vehicle, high range) while minimizing the manufacture costs and maximizing the battery lifetime.
The newly incoming battery types are characterized by having few times more energy density (ca. 1000 Wh/kg [1]) than batteries used by now, and promise to revolutionize the automotive market. The wave of electric vehicle battery technology progress [2,3] is as of now passing through the biggest research centers in the world. This progress is causing some governments to consider future halting of the possibility of registration of new, internal combustion powered cars. Projects of such bans effective from 2025 are discussed in the Netherlands [4], and from 2030 in the Germany [5]. These changes make one wonder, whether the chemical batteries are a safe energy storage medium?
The contemporary traction battery types can supply the energy at the rate of 30-fold time their rated capacity (30C), with a charging rate of 5C, where C is the capacity of the battery in [Ah]. The newly designed battery types offer even higher performance levels, with discharge on the order of 100C [6,7]. The available battery types caused the available car types to divide into segments, such as: small electric cars with a range of 150 to 200 km, middle class cars with range between 200 and 400 km, luxury cars with range in excess of 400 km, utility vans (100-200 km), cargo trucks (1200-1900 km) and urban area busses (100 to 500 km). The introduction of new generation of graphene-polymer batteries can blur the existing boundaries, due to the great reduction of mass to energy capacity ratio.
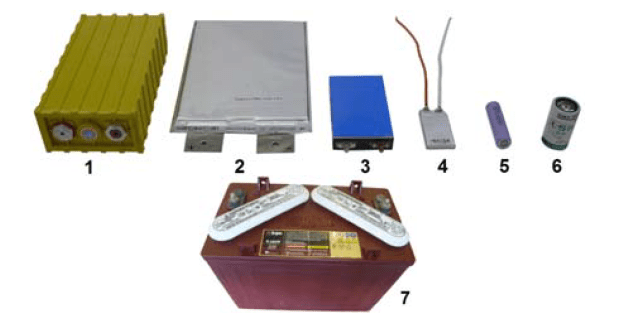
The article presents the results of research on currently used energy storage device types, which are deployed in electric vehicles. The testing included following batteries: prismatic type LiFePO4 with 160 Ah capacity (energy density of 95 Wh/kg, Fig. 1-1), : prismatic type LiFePO4 with 60Ah capacity (energy density of 85 Wh/kg, Fig. 1-1), caseless LiFePO4 with 20 Ah capacity (125 Wh/kg, Fig. 1-2), LiFePO4 with 8 Ah capacity (energy density of 100 Wh/kg, Fig.1-3), Li-PO with 1000 mAh capacity (110 Wh/kg, Fig. 1-4), Li-Ion with 2200 mAh capacity (energy density of 160 Wh/kg, Fig. 1-5) and a lithium-thionyl chloride (Li-SOCl2) primary cell with 13 Ah capacity (470 Wh/kg, Fig. 1-6). For comparison, the tests also included a Lead- Acid battery with 150 Ah capacity and energy density of 50 Wh/kg (Fig. 1-7).
Due to the environmental conditions in which the batteries are normally used and their operation mode (charge – discharge), four tests were performed: chilled battery, heated battery, overcharged battery and short-circuit.
Table 1 contains the basic parameters of the batteries used in electric vehicles.
Table 1. EV traction battery parameters [6,7]
Type
Energy density [Wh/kg]
No of cycles [SOH 80%]
Charge / Discharge current [C]
Working Temp. [°C]
Nominal Voltage [V]
Lead-Acid
35÷50
600
0,1 / 2
-20÷40
2,1
Ni-Cd
50÷80
500
1 / 15
-20÷50
1,2
Ni-MH
50÷100
800
1 / 5
-20÷50
1,2
Na-NiCl2
90÷110
1 500
1 / 2
245÷350
2,6
LiFePO4
90÷120
3 000
5 / 30
-20÷60
3,2
Li-PO
130÷220
500
2 / 25
-20÷60
3,7
Li-ION
160÷200
1 000
5 / 30
-20÷50
3,6
LTO
70÷80
20 000
5 / 20
-25÷55
2,4
Graphene polymer
1000
8000
100 / 100
-20÷60
2,3
.
The battery working temperature refers mostly to the operational mode in which the energy is taken from the battery. Most of the batteries including Li-Ion cannot be charged when their temperature is lower than 0°C (32°F). The stated number of cycles coincides with battery State of Health (SOH) reaching the level of 80%. Most battery manufacturers recommend replacing the battery when SOH drops below that value, it does not mean, however, that the battery will cease to work afterwards. Everything depends on conditions in which the particular vehicle were operated. For instance, if a newly manufactured vehicle could achieve a range of 150km on one charge, that vehicle will have a range of 120km at SOH of 80% (≥3000 charge-discharge cycles), 105km at SOH of 70% (≥5000 charge-discharge cycles), 90km at SOH of 60% (≥7000 cycles). Assuming 250 working days per one year, the SOH level of 80% corresponds to 12 years of battery operation, SOH 70% – 20 years, SOH 60% – 28 years, SOH 50% – 36 years. The situation is different in case of Li – Ion batteries, when SOH of 80% is reached after 4 years of operation, SOH 70% – 6 years, SOH 60% – 8 years, SOH 50% – 10 years. During the research, the batteries were tested when exposed to low temperatures and short-circuit conditions. No tests of battery heating and overcharge were performed.
External Cooling
One of the important properties of any electric vehicle battery is its capacity to supply energy in low temperature conditions. Many thermal models of batteries are available [8-18], but the described behavior does not exactly correspond to real battery parameters, especially for temperatures below 0°C (32°F). These parameters are the cause of most electric vehicles poor performance, especially reduction in range, when the ambient temperature drops below 0°C (32°F). This phenomena is caused by internal battery electrochemical reactions performance being highly dependent on the temperature. The drop in effective battery capacity can span, depending on the battery type, from 8 to 25% each time the temperature drops by 10°C (18°F) in relation to reference temperature of 20°C (68°F). When discharged at too low temperature, the battery can be irreversibly damaged by permanent changes in its internal structure, resulting in large drop of SOH value or even a total failure of a battery.
There are measures available, which can prevent these problems from arising, in the form of battery heating systems. Unfortunately, only a small group of manufacturers is installing these conditioning systems in their products, and then, only for vehicles destined for operation in northern parts of Europe and North America. There are several possible methods to employ in the battery conditioning systems, in order to maintain the temperature in the preset operating area. One of the methods is to power individual battery cells with an alternating current at high frequency [19], which increases the internal cell temperature.
The other solution is a liquid conditioning system which, depending on the ambient temperature, can either cool down or heat up the battery. Another way is to harness the air conditioning system of the vehicle in which the battery is installed. This design uses a part of the air conditioning unit to cool or heat the battery (heating is accomplished by a parking heating system e.g. a Webasto) [20].
Finally, there are battery conditioning systems using specially crafted battery boxes, containing heating mats placed at sides and bottom of the box [21]. The heating system is powered either by energy stored in the battery itself, or from mains supply, when the vehicle is connected for the duration of charging and standby. It can be argued, that using extra energy for raising the battery temperature increases the vehicle operation costs, but keeping in mind, that the maintaining higher (proper) battery temperature increases its life, as well as the vehicle range, these steps seem well justified. An exception from this rule, are the vehicles using the molten salt batteries, which to operate, require a high temperature of 245÷350°C (473÷662°F), at power consumption on the average level of 70÷90W, supplied at all times.
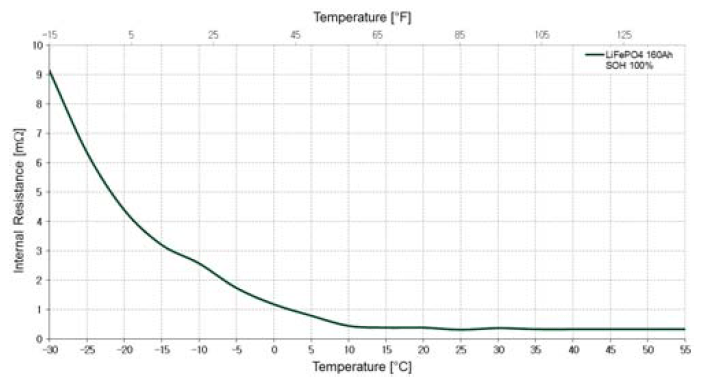
Fig.2. Dependence of internal resistance versus temperature for a LiFePO4 battery, 160Ah – load of 1C
Fig.3. Dependence of internal resistance versus temperature for a LiFePO4, 60Ah – load of 1C
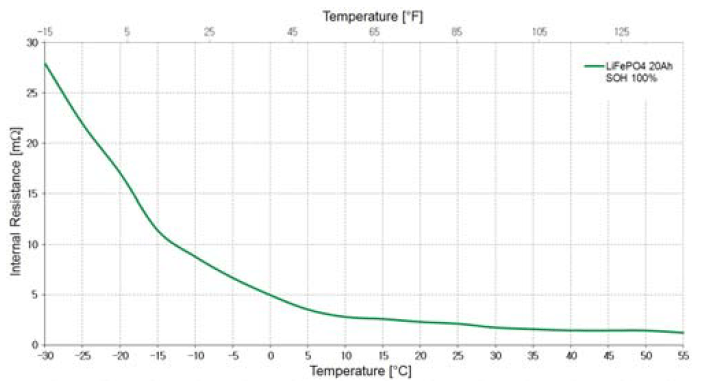
Fig.4. Dependence of internal resistance versus temperature for a LiFePO4, 20Ah (caseless) – load of 1C
Fig.5. Dependence of internal resistance versus temperature for a LiFePO4, 8Ah – load of 1C
Fig.6. Dependence of internal resistance versus temperature for a Li-PO, 1000mAh – load of 1C
Fig.7. Dependence of internal resistance versus temperature for a Li-Ion, 2200mAh – load of 1C
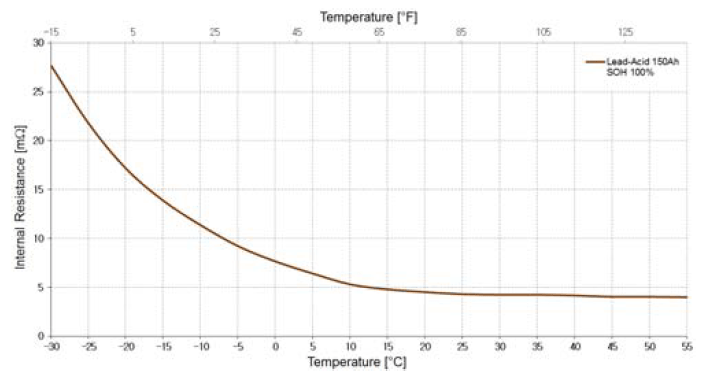
Fig.8. Dependence of internal resistance versus temperature for a Lead-Acid battery, 150Ah – load of 1C
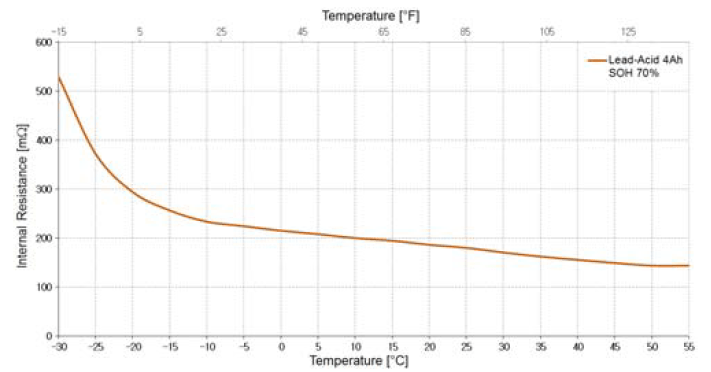
Fig.9. Dependence of internal resistance versus temperature for a Lead-Acid battery, 4Ah – load of 1C
During testing, the batteries under test were placed in the climate chamber, which could hold a preset temperature in the range of -30°C÷55°C (-22°F÷131°F). Preceding the testing, the batteries were held in the climate chamber for a period of at least 8 hours. The measurement of battery internal resistance were conducted by the Electric Vehicle Battery Tester [22]. Measurements were taken from the minimal temperature of -30°C (-22°F), every 5°C (9°F), up to the maximum temperature of °C (131°F). The results of tests for most popular battery types is presented on Fig. 2 ÷ Fig. 9.
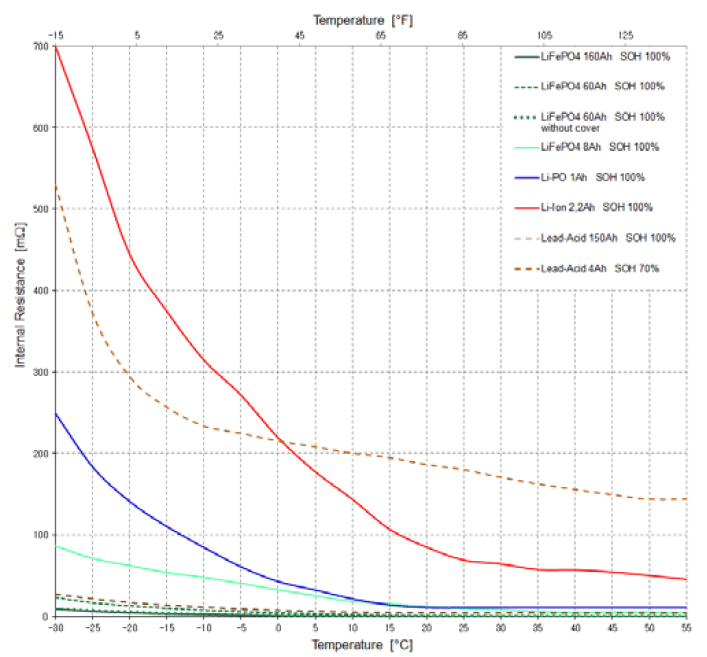
A set of internal resistance versus temperature plots for tested batteries is presented in Fig. 10.
Fig.10. Dependence of internal resistance versus temperature for lithium based batteries (LiFePO4, Li-PO, Li-Ion), and Lead-Acid battery – load of 1C
External Heating
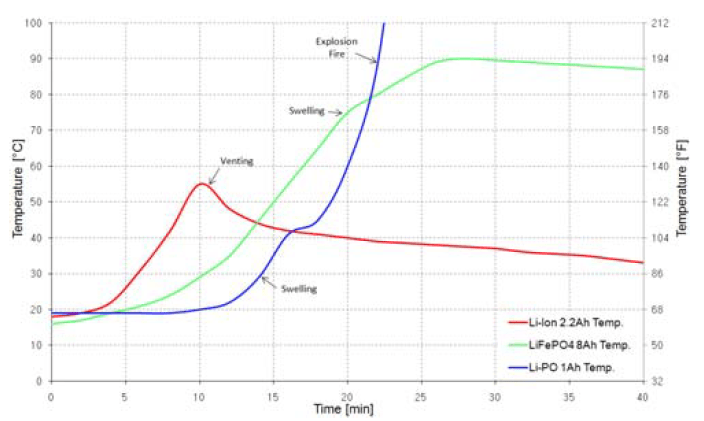
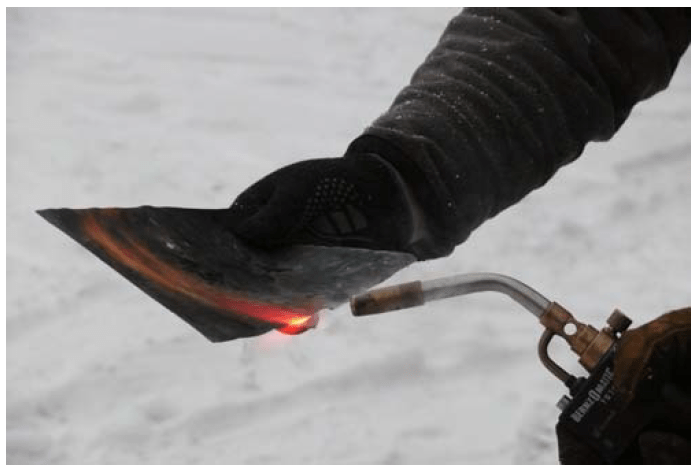
During operation of electric vehicle, it is possible, it will happen in an extremely high ambient temperature (40°÷50°C (104÷122°F)). Taking into consideration additional heat input from internal heating due to high battery circuit current (from e.g. fast charging, high vehicle acceleration), the battery can overheat and become damaged – its internal structure will be destroyed. Another possible mode of failure is thermal runaway, caused by temperature rise on the level of 10°C/minute or higher (Fig.11). It is caused by an exothermic reaction occurring from high temperature which releases large amount of energy in a very short time. The runaway reaction usually results in total loss of the battery, as well as swelling of the battery enclosure from high internal pressure, or even violent rupture of the enclosure associated with expulsion of boiling electrolyte. To prevent the thermal runaway, cooling systems based on liquid or air cooling (using air conditioning system) are applied [20]. During the testing, the batteries were heated at the rate of 10°C(18°F)/15 minutes [23,24].
Fig.11. Temperature development during external heating of Li-Ion LiFePO4 and Li-PO batteries
Overcharge
The process of charging an electric vehicle’s battery is an essential matter considered during engineering an electric powertrain. Engineers working on the powertrain should choose the correct battery type guaranteeing proper vehicle reliability. Choice of the battery type results in requirement of providing the battery with proper operating conditions, such as: limiting the maximal level of shocks and vibration, ensuring water-tightness by designing proper battery enclosure and proper working temperature range by applying a temperature conditioning system. Apart from proper climatic conditions, the battery requires proper charging and discharging parameters, compatible with its requirements (Table 1). It is the purpose of supervisory systems for charging and discharging usually called BMS (Battery Management System), which operate together with onboard and off-vehicle chargers (regular chargers, fast chargers, contactless (induction) chargers, etc.) BMS systems can be constructed as passive or active, active systems have the capacity for controlling (balancing) the voltage levels on individual battery cells. There exists however, a possibility of malfunction of various system components, of e.g. a charger, or a BMS, or a disruption of data exchange between BMS and charger. Another possible risk exists, which can be overlooked by vehicle designers. When the vehicle is operating with fully charged battery, and the regenerative braking is used, it could result in damage to the battery from overcharging, by supplying a large current to an already fully charged battery.
Fig.12. Overcharge of LiFePO4, Li-PO and Li-Ion batteries with charge current of 2C
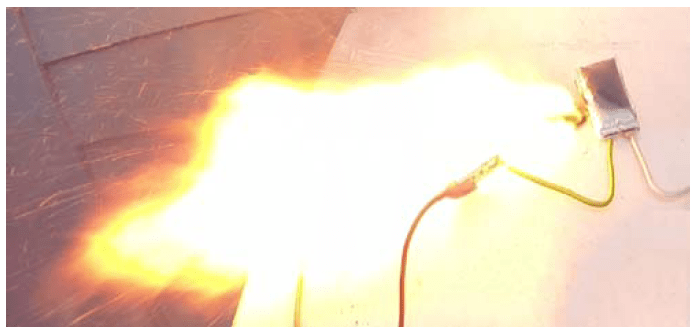
Overcharging a battery reveals in a rise in battery temperature, its swelling due to vaporizing electrolyte or even loss of containment and release of gases to outside atmosphere (Fig. 12.). If the battery is not fitted with adequate safeguards disconnecting circuit (PTC – Positive Temperature Coefficient (temperature over 90°C (194°F)); CID – Current Interrupt Device (internal pressure over 1MPa (145psi)); mechanical safety vent (pressure over 3MPa (450psi))), which would sever the circuit in such case, there is a possibility of battery fire or even explosion [23, 24] (Fig. 13).
Fig.13. View of Li-PO 1000mAh battery during overcharge test at 2C which ended with explosion and fire
Short Circuit
A very serious matter, from the point of safety of vehicle occupants and other traffic users, is the behavior of the vehicle’s battery when subjected to various possible short circuit scenarios: short circuit in the main traction circuit, short circuit from mechanical damage of the battery (puncture, violent shock, crushing, vibration, etc.) and external battery heating. Short circuits or general overcurrent conditions in the main traction current can cause rapid heating of the battery interior which would lead to permanent damage to internal battery structure or to spontaneous battery combustion. In case of battery being heated, after reaching certain temperature there is a possibility of creating a thermal runaway condition which would lead to even quicker temperature rise and create a fire and explosion risk. In everyday life, there are reports of electronic devices (laptop computers, mobile phones, tablets, electric cars, etc.) catching fire due to stressed battery. In many of these cases, the battery itself was not the direct reason of fire, rather the too thin wires connecting the battery to energy consumers tend to overheat, and ignite flames. In order to mitigate the cases when the batteries become fire hazard from overloading or short circuit, various protective devices are being applied in form of protective thermal fuses, which interrupt flow of current when they detect too high temperature.
Fig.14. The plot of current and temperature during short circuit of LiFePO4 160Ah battery
Another danger of the safety of vehicle and its passengers is the condition of electrical contacts (wire, battery, inverter, motor, fuse and contactor terminals). Loose or corroded terminals can lead to increased resistance, localized heating and even a fire. There are described cases of authorized vehicle service station recommending replacement of whole battery unit, based on computer diagnostic run which reported a failed battery. Meanwhile a simple terminal cleaning job would suffice to return that battery to operational status [25].
A yet different case exists when battery becomes physically damaged as a result of vehicle collision. Then, any thermal fuse fitted outside the battery would become useless, and in case the battery enclosure is designed from poor materials, the battery fire and/or explosion is likely.
The same type of batteries, as in internal resistance test, were tested. The test was conducted by short circuiting the battery terminals while recording the results of such short circuit. The temperature and current levels were registered, the results are presented on Fig. 14 ÷ Fig. 24.
Fig.15. The plot of current and temperature during short circuit of LiFePO4 8Ah battery
The tested lithium iron phosphate batteries were judged as very safe for operators. During the short circuit test the LiFePO4 160Ah and 8Ah batteries have neither exploded nor ignited, despite reaching high temperature and high current values. The battery with 160Ah capacity has endured the short circuit for 730 seconds with average current value of 942A. A LiFePO4 160Ah battery should supply a current of 3C in 900 seconds, while during the test the recorded value indicated over 6C in almost 800 seconds. After 650 second mark, the battery safety vent activated and released an intense stream of white colored gas cloud from inside the battery (Fig. 14). It has to be stated that vented gasses from a LiFePO4 battery are vary noxious (they are literally boiling and decomposing electrolyte). Apart from normally expected gasses created during combustion of organic materials, such as CO2, CO, H2, CH4, C2H4, C2H6, C3H6, C2H5F1 and others, other toxic compounds like HF (hydrogen fluoride) and POF3 (phosphorous oxyfluoride) are present, derived from fluorine used as lithium battery electrolyte [26].
Fig.16. View of LiFePO4 8Ah battery, after the short circuit test
The short circuit test of 8Ah battery went similar, with one notable difference, when after 20 second mark a rapid rise of case temperature was recorded, after 60 seconds the enclosure began to swell and after 120 seconds the vent opened (Fig. 15). Whole process of short circuit took about 2 minutes with average current of 80A. During the test, the battery achieved the maximal current value of 10.3C (while manufacturer allows 3C max.). The tested LiFePO4 batteries demonstrated very good parameters regarding the safety of operation. The neither exploded, nor ignited and thus did not created a danger for human life and health (Fig. 16). The plates of 160Ah LiFePO4 battery did not ignite even when exposed to open flames (Fig. 17). When operated in proper conditions, this type of battery can be successfully used in electric vehicles for more than 10 years, while retaining their properties (Table 1).
Fig.17. An unsuccessful attempt of ignition of LiFePO4 battery plate
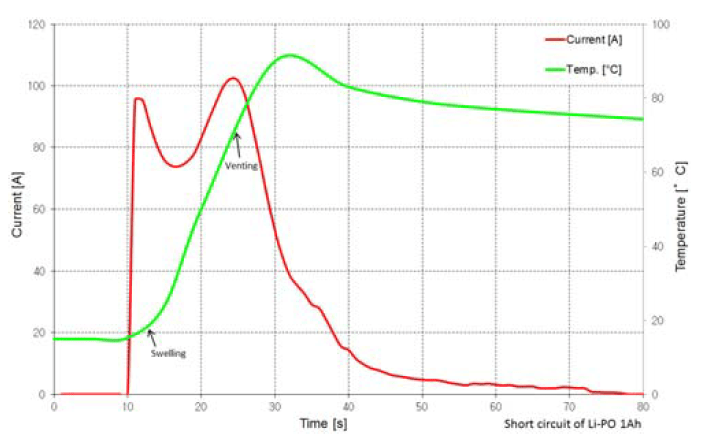
During test run of Li-PO battery, a rise in temperature with an almost simultaneous swelling of battery case (Fig.19) was observed after about 6s from the beginning of terminal short. After about 14s the case seal was broken, releasing vapors into surrounding atmosphere. Any further activity ceased after 30s mark (Fig. 18). It is worth noticing, that the Li-PO battery has shown a capability to supply an enormous current of 102C (with manufacturer stated max. of 25C) with only 1Ah total capacity. The battery did not ignite or explode during this test.
Fig.18. The plot of current and temperature during short circuit of Li-PO 1000mAh battery
Fig.19. View of Li-PO 1000mAh battery, after the short circuit test
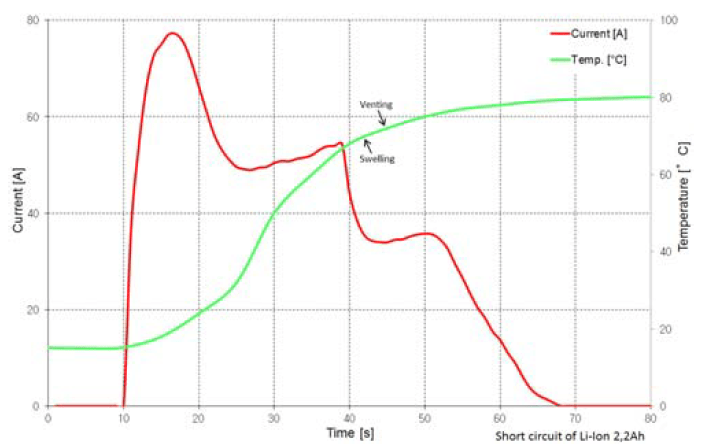
Fig.20. The plot of current and temperature during short circuit of Li-Ion 2200mAh battery
Fig.21. View of Li-Ion 2200mAh battery, after the short circuit test
During test run of Li-Ion battery, which is at the moment the most common chemistry employed in electric vehicles, a rise in temperature was noticed after 10 seconds from the onset of short. After 32s mark the case swelling begun, and 4 seconds after that, a safety valve has opened along with a slight emission of gasses and a squirt of electrolyte. The duration of emission was very short (Fig. 20). During the test, the average current achieved was 21C (4.5C max as stated in the datasheet) for about 50 seconds, with nominal battery capacity of 2.2 Ah. The battery did not ignite or explode during this test (Fig. 21).
To compare the operational properties, a primary battery using Li-SOCl2 chemistry and 13Ah capacity was also tested. After 30 seconds from shorting of terminals, the battery temperature began to rise. In the next 3 seconds the case begun to swell, and after 52s from the start of the test, the battery exploded and begun to violently emit fire (Fig. 22, Fig. 23).
Fig.22. The plot of current and temperature during short circuit of Li-SOCl2 13Ah battery
Fig.23. View of Li-SOCl2 13Ah battery, after the short circuit test
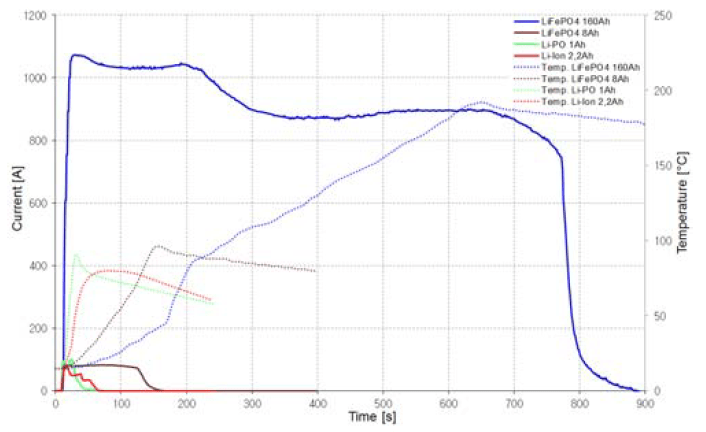
Fig.24. Plot of currents and temperatures during the short circuit battery tests
Despite igniting and loosing containment, the battery continued to supply current for next 15 seconds. During the test, the batter was able to source current on the order of 3.9C, while the max. allowable discharge current is stated as 0.14C. This test confirmed, that this battery type is unsuitable for electric vehicles, due to real possibility of explosion and fire emission during extreme stress.
Results
The conducted tests have proven, that:
• with dropping temperature, the battery internal resistance rises, which limits the capacity to supply energy. Because of this fact, the application of thermal conditioning systems (heating and cooling) in electric vehicles is recommended, both when the vehicle is moving and when it is stationary. The battery temperature is crucial parameter, it is important that the battery temperature should be 5°C or higher before beginning of the vehicle operation, • battery overheating can result in exothermic reaction and possibly destroy the battery completely, • battery overcharge can destroy its internal structure. Assurance of proper BMS operation (balancing and equalization) is of utmost importance, • short circuit testing resulted in battery venting and release of hot electrolyte. It has to be emphasized, that all tested rechargeable batteries performed adequately, meaning that none of them have ignited nor exploded. It proves that currently produced batteries are high quality. Unfortunately, a lot of data in the Internet contain reports of traction batteries which exploded or ignited, • state of charge (SOC) of the battery has impact on the amount of heat emitted during the test. The more fully charged a battery was, the more heat it emitted, • in order to increase safety level for all battery types, a new type of electrolyte could be designed, which during conditions of overheat, overcharge or short circuit would not emit any toxic compounds, • correctly designed, batteries for electric vehicles should have capacity to withstand: low and high ambient temperature; overheating; short circuit conditions; high pressure inside the casing; excessive charge and discharge currents; low voltage due to greater than nominal depth of discharge (DOD); over voltage resulting from overcharge; shocks and impacts during collisions, • following the proper operation procedures (maintaining recommended temperature and voltage ranges) should protect the user from nasty surprises while simultaneously provide long and stress free battery life.
REFERENCES
[1] Graphenano and Grabat launch graphene-based batteries, Graphene-info, http://www.graphene-info.com, 08.04.2016. [2] Noya C., Másdetallestécnicos de las baterías de Graphenano. Certificados TÜV y Dreka., ForoCochesElectricos, http://www.forococheselectricos.com (02.2016) [3] Lee S.K., Oh S.M., Eunjun Park E., Scrosati B., Hassoun J., Park M.S., Kim Y.J., Kim H., Belharouak I., Sun Y.K., Highly Cyclable Lithium–Sulfur Batteries with a Dual-Type Sulfur Cathode and a Lithiated Si/SiOx Nanosphere Anode, Nano Letters, 15 (5)2015, p. 2863–2868. [4] Dockrill P., The Netherlands is making moves to ban all nonelectric vehicles by 2025, Science alert, http://www.sciencealert.com, 13.04.2016. [5] Lambert F., All new cars mandated to be electric in Germany by 2030, electrekt, http://www.electrek.co, 14.06.2016. [6] Battery University, http://www.batteryuniversity.com, (07.2016). [7] Battery and Energy Technologies, http://www.mpoweruk.com, (07.2016). [8] Gu W.B., Wang C.Y., Thermal–Electrochemical Modeling of Battery Systems, Journal of the Electrochemical Society, Volume 147, Issue 8, (2000) p.2910-2922. [9] Doughty D.H., Butler P.C., Jungst R.G., Roth E.P., Lithium battery thermal models, Journal of Power Sources, Volume 110, Issue 2, (2002) p.357-363. [10] Biechl H., Rahmoun A., Modelling of Li-ion batteries using equivalent circuit diagrams, Przegląd Elektrotechniczny, 88 (7b/2012), p.152-156. [11] Malinowski M., Iwan A., Paściak G., Electrical properties of polymer fuel cells based on modified electrolytes, Przegląd Elektrotechniczny, 90 (9/2014), p.73-76. [12] Liu S., Jiang J., Shi W., Ma Z., Wang L.Y., Guo H., Butler– Volmer-Equation-Based Electrical Model for High-Power Lithium Titanate Batteries Used in Electric Vehicles., IEEE Transactions on Industrial Electronics, Volume 62, Issue 12, (2015) p.7557-7568. [13] Kasprzyk L., Bednarek K., The Selection of Hybrid Energy Storage for Electrical Vehicle, Przegląd Elektrotechniczny, 91 (12/2015), p.129-132. [14] Damay N., Forgez Ch., Bichat M.P., Friedrich G., Thermal modeling of large prismatic LiFePO4/graphite battery. Coupled thermal and heat generation models for characterization and simulation, Journal of Power Sources, 283 (2015), p.37-45. [15] Panchal S., Dincer I., Agelin-Chaab M., Fraser R., Fowler M., Thermal modeling and validation of temperature distributions in a prismatic lithium-ion battery at different discharge rates and varying boundary conditions, Applied Thermal Engineering, 96 (2016), p.190-199. [16] Li J., Wang L., Lyu Ch., Wang H., Liu X., New method for parameter estimation of an electrochemical-thermal coupling model for LiCoO2 battery, Journal of Power Sources, 307 (2016), p.220-230. [17] Yan Y., Li Y., Skyllas-Kazacos M., Bao J., Modelling and simulation of thermal behaviour of vanadium redox flow battery, Journal of Power Sources, 322 (2016), p.116-128. [18] Jiang J., Ruan H., Sun B., Zhang W., Gao W., Wang L.Y., Zhang L., A reduced low-temperature electro-thermal coupled model for lithium-ion batteries, Applied Energy, 177 (2016), p.804-816. [19] Pesaran A.A., Vlahinos A., Stuart T., Cooling and Preheating of Batteries in Hybrid Electric Vehicles, 6th ASMEASME–JSME Thermal Engineering Conference, Hawaii Island, (03.2003). [20] Ji Y., Wang Ch.Y., Heating Strategies for Li-Ion Batteries Operated From Subzero Temperatures, Electrochimica Acta, 107 (2013) p.664-674. [21] Łebkowski A., System for Monitoring of Battery Pack Parameters in an Electric Vehicle Using GSM/GPS Technology, Przegląd Telekomunikacyjny – Wiadomości Telekomunikacyjne, 11 (2014), p.1396-1399. [22] Łebkowski A., Electric Vehicle Battery Tester, Przegląd Elektrotechniczny, 12 (2016). [23] Larsson F., Mellander B.E., Abuse by External Heating, Overcharge and Short Circuiting of Commercial Lithium-Ion Battery Cells, Journal of The Electrochemical Society, 161 (2014), p.1611-1617. [24] Feng X., Weng C., Ouyang M., Sun J., Online internal short circuit detection for a large format lithium ion battery, Applied Energy, 161 (2016), p.168-180. [25] Toyota Hybrid cheap fix, http://www.imgur.com/gallery/j8Bcp, (08.2015). [26] Larsson F., Andersson P., Mellander B.E., Lithium-Ion Battery Aspects on Fires in Electrified Vehicles on the Basis of Experimental Abuse Tests, Batteries no. 2: 9, 2016.
Author: dr inż. Andrzej Łebkowski, Akademia Morska w Gdyni, Katedra Automatyki Okrętowej, ul. Morska 83, 81-225 Gdynia, E-mail: andrzejl@am.gdynia.pl.
Source & Publisher Item Identifier: PRZEGLĄD ELEKTROTECHNICZNY, ISSN 0033-2097, R. 93 NR 5/2017. doi:10.15199/48.2017.05.13
Published by Bartłomiej TWOREK, Politechnika Śląska, Instytut Elektrotechniki i Informatyki, Zakład Maszyn Elektrycznych i Inżynierii Elektrycznej w Transporcie
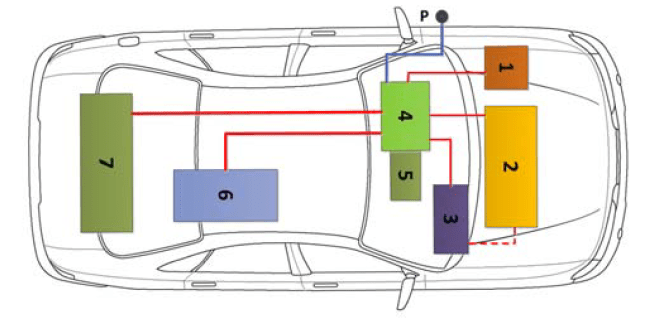
Abstract. This article presents improvement concepts of automotive electrical systems. 12-volt electrical systems are heavy and not effective for hybrid and electric vehicles. Author of this article performed study of energy consumption to analyze this problem. For this purpose 10 Channel Automotive Ammeter was developed. Current measurements were made in vehicle fuse boxes during test drives and simulation tests. Studies have shown that some circuits are overloaded and incorrectly designed. After summarizing of measurement results, author developed concept of Energy Distribution Controller with integration of Power Rail. This solution combined with 48-volt installations, will allow to developed efficient electric system for hybrid and electric cars.
Streszczenie. W tym artykule przedstawiono koncepcje usprawnień w samochodowych systemach elektrycznych. 12-woltowe systemy stosowane we współczesnych pojazdach są ciężkie i nieefektywne dla pojazdów hybrydowych i elektrycznych. Autor tego artykułu przeprowadził badania zużycia energii w pojazdach samochodowych. W tym celu został opracowany 10 kanałowy amperomierz służący do pomiaru prądu w samochodowych instalacjach elektrycznych. Podczas badań symulacyjnych i jazd testowych prąd był mierzony w skrzynkach bezpiecznikowych pojazdów. Badania wykazały że niektóre obwody elektryczne są nadmiernie obciążone i niepoprawnie zaprojektowane. Autor przedstawił koncepcję sterownika Centralnej Dystrybucji Energii z integracją szyny zasilającej. Rozwiązanie te połączone z instalacjami 48-voltowymi pozwoli opracować efektywny system dystrybucji energii dla pojazdów hybrydowych i elektrycznych. (Koncepcje rozwoju instalacji elektrycznych w pojazdach elektrycznych i hybrydowych).
Słowa kluczowe: Instalacje elektryczne w pojazdach samochodowych, Pomiar zużycia energii elektrycznej w pojazdach Keywords: Automotive Electric Systems, Measurement of energy losses, Power Rail, Energy Distribution Controller
Introduction
12-volt installations are currently common in vehicles. This type of electric systems are not effective in cars with high power consumption. The disadvantage of typical installations are also the weight (about 60 kg). The average length of electrical harnesses is approximately 6000 m and depends on vehicle variants. The cost of electrical wires is also high because copper is used as main conductor. Weight and costs shall be reduced by optimizing the construction of electric system.
Author performed energy consumption measurements to analyze this problem. The current measurements were made with using 10 Channel Automotive Ammeter in car fuse boxes. After measurement sessions results were analyzed and summarized. Study of energy consumption done by author confirms also statement that main electric circuits are overloaded. Author has developed concept of Energy Distribution Control Unit with integration of 48 Volt electric system and Power Rail. This solution allows to integrate an effective electric system for hybrid and electric vehicles.
Measurement of energy consumption
Measurement of power consumption are used to evaluate the effectiveness of the electrical installation. Professional measurement stands are located in laboratories and can simulate the operations of the vehicle electrical system. This method of measurement is very accurate but does not allow analysis of parameters in the vehicle’s operation and test drives.
Author has developed a new method for measuring energy consumption with using 10 Channel Automotive Ammeter. This equipment allows to measure current in fuse box and power consumption in mass-produced vehicles without disassembling the components. Fig. 1 shows the schematic of test stand. Test stand includes 10 Channel Automotive Ammeter, Clamp ammeter (optional) and oscilloscope.
Vehicles with complex electrical system were selected for tests. Measurement sessions of energy consumption was performed during laboratory tests and test drives. This methods allows to simulate the operating conditions of the electrical system in different types of vehicles.
Table 1 presents part of measurement results during measurement of energy consumption. Circuit ID, fuse type and list of electrical equipment are detailed specified in manufacturer technical documentation. The last column presents measured current during tests.
Fig. 1. Vehicle Energy Consumption Stand.
Table 1. Measurement results in automotive electric systems
ID
Electrical Equipment
Fuse Type
I, A
F1S
Engine Control Unit
20 A
3.41
F2S
Horn
15A
0.10
F3S
Windscreen washer pump
10 A
0.12
F4S
Headlight Washer Pump
10 A
0.09
F5S
Engine equipment, Secondary fan motor
15 A
3.51
F6S
Mass flow sensor, Directional light system
10 A
2.31
F7S
Power steering
10 A
1.15
F8S
Starter
25 A
0.01
F9S
Clutch pedal sensor, Brake pedal sensor
10 A
0.08
F10A
Main fan motor
30 A
8.14
F11S
A/C fan
40 A
6.51
F12S
Windscreen wipers
30 A
0.06
F13S
Body Control Module (BSI)
40 A
5.12
F17S
Low beam right
15 A
3.21
F18S
Low beam left
15 A
3.23
MF1
DC Motor – heating system
50 A
3.12
MF2
ABS system
50 A
2.31
MF4
BSI equipment
80 A
8.12
MF8
Suspension hydraulic pump, Suspension air compressor
40 A
7.16
.
10 Channel Automotive Ammeter
Measurement of power losses in car electrical systems is difficult to perform due to set correct measurement range.
The solution to this problem is to measure the current using an ammeter designed by the author. Most of popular ammeters have too small measuring range (about 20 A). 10 Channel Automotive Ammeter developed by the author can measure the current up to 200 A. This measurement instrument is based on ACS770 Hall effect current sensors which can measure current in wide range.
Advantages of using 10 Channel Automotive Ammeter:
• ability to protect electrical circuits during electrical measurements, • convenient access to the electrical circuits and harness, • ability to perform measurements during vehicle operation and test drives
Ammeter Specification is presented in Table 2.
Table 2. General specification of 10 Channel Automotive Ammeter Input Voltage:
After measurement sessions results have been analyzed and summarized. The conclusion is that 12V electrical systems and energy distribution solutions have reached the peak of efficiency. This confirms the fact that complexity of electrical circuits must be optimized. The number of electronic controllers and electrical components has increased in modern vehicles. Load factor level and the weight of electrical installations also must be reduced.
Measurement of the maximum power consumption in the vehicle’s electrical circuits was tested in simulations of environmental conditions. During tests heating elements were switched on at low temperatures (e.g. glow plugs, window heating), engine cooling systems were tested at high temperatures (e.g. engine fans, air conditioning). Power consumption measurements were performed by author with using 10 Channel Automotive Ammeter.
Research shows that these electrical circuits are overloaded (Fig.2):
1) Starter circuit (up to 260 A), 2) Windscreen and mirror heating (up to 18 A), 3) Seat heating and control (up to 17 A), 4) Actuators and electric motors circuits (up to 15 A), 5) Engine cooling system (up to 12 A), 6) Hydraulic pump and air pressioner in active suspension system (up to 9 A), 7) Fuel heating and heating systems (e.g fuel heaters, glow plugs) (up to 14 A), 8) Vehicle lighting based on halogen bulbs (up to 25 A)
Fig. 2. Main 12 V energy loads in vehicle.
Measurement results have contributed to develop the concepts described in next chapters.
48 Volt Systems
The energy consumption analysis presented in this article shows that main 12V circuits are overloaded. The way to optimize energy distribution systems is to use higher voltage level in vehicle electric system. During research made by key automotive companies, it was decided to increase the voltage level up to 48 V. Typical examples where 48V installations can be used are electric motors used in electric window lifts, power steering motors and other actuators that require high power efficiency [1]. Development of 48V components was initiated in hybrid and electric cars.
Components should be designed in a compact form, oversized solutions are not recommended (except safety equipment). It is also a good practice to replace heavy pneumatic and hydraulic systems with electrical solutions. Electric components can be installed in places where they are not exposed to high temperature and humidity, so their life cycle will be increased [2].
After analyzing of these problems, it can be stated that the development of 48V systems and equipment is a good improvement to implement new solutions in electric and hybrid vehicles. 48V systems have also disadvantages that were not previously present. The main problem is the increased incidence of arterial discharge [3]. This problem occurs in the components that switch the circuits on and off, particular case are the integrated relays [4].
Energy Distribution Control Unit
After analysis of 48V systems, author developed the concept of an extended electrical installation which integrates the 12V and 48V systems. The solution is shown in Fig.3.
The main component of the system is the Energy Distribution Control Unit (4) connected to the bidirectional DC/DC converter (5). The energy sources are lithium-ion batteries (7), 12V lead-acid battery (1) and supercapacitors (6). Additionally it is possible to charge the battery system using an alternator (3) driven by petrol engine (2). Energy Distribution
Control Unit functions:
• integration of 12V and 48V systems, • DC/DC converter control, • battery charge level calculation • diagnostics of battery systems, • battery charging process control, • charging interface (Plug-in), • supervision of circuit overload protection using eFuse and regular fuses (redundancy of over current protection), • cell balancing (active and passive balancers), • diagnostics of electrical circuits and components.
This concept can be applied to electric and hybrid cars. In electric vehicles, the motor operates as load, but it is also possible to work in a generator mode. In vehicles with petrol engines the alternator works as a source of electric energy. This concept includes cooperation with the efficient lithiumion cells that during operation require a balancing process. Implementing these features allows to integrate BMS (Battery Management System) with Energy Distribution Controller.
The concept of integrating electrical systems involves the use of conventional lead-acid battery, it is a relatively cheap type of power source and can supply components at low ambient temperatures. Typical process is petrol motor start up (high current efficiency at low temperatures). Components such as electric turbochargers require additional power sources to supply large amount of power in a short time. Author in his concept predicted the possibility of using supercapacitor batteries that could supply energy to selected components. The concept of this system includes the use of additional optional power sources. Example is electric retarder that allows energy recovery from braking. An additional source of energy are also the solar panels that can be used in cars operating in warm climates. The integration of these energy source allows solar batteries to be charged.
The Central Energy Distribution Controller advantages:
• ability to integrate multiple energy sources, • effective protection of electrical circuits against surges and short circuits, • possibility to apply concept in electric and hybrid vehicles • redundancy in energy sources • diagnostics and active measurement of electrical circuits
Disadvantages of Central Energy Distribution Controller:
• cost of electrical system expansion, • electric system complication (power sources, electrical components, assembly elements).
In the next part of this article author will describe the integration of this Central Energy Distribution System with Power Rail.
Fig. 3. Concept of power sources decentralization (detailed description in the text)
Concept of Central Power Rail
The concept of 12V/48V installation includes Central Distribution Controller described in the previous chapter is an evolutionary solution that will improve the electrical systems in modern vehicles. It can be stated that this concept enforces application of Central Power Rail. This solution limits the number of wires and harnesses, weight of complete electric system will be also reduced. The concept developed by the author integrates the central data bus with Power Rail. The rail integrates three or more conductors (+48V, +12V, GND) which are developed for distribution of energy to the receivers.
Power Rail reduces the energy losses. Special contacts with large contact surface can directly power electrical components and equipment. The Central Power Distribution Controller allows the rail to protection against overvoltage’s and short-circuits (eFuse integration). Author’s concept allows to integrate the Power Rail with the data bus. Thanks to this solution number of transmission wires and harnesses will be limited. Integration of Power Rail and lithium-ion batteries and can deliver more energy to electric receivers located in vehicle.
Fig. 4. Power rail integration with Central Energy Distribution System – author’s conception:
1) Lead-acid battery, 2) Petrol engine, 3) Alternator, 4) Energy Distribution Control Unit, 5) Bidirectional DC/DC converter, 6) Supercapacitors, 7) Lithium-ion batteries, P) Plug-in connector
Conclusion
This article shows that electrical installations in modern vehicles need to be optimized. Measurement of energy consumption confirms that new solutions in power distribution shall be implemented in hybrid and electric cars. Concept of Central Power Controller developed by author of this article is good solution because this ECU (Electronic Control Unit) can integrate many functions and limits the number of wires and harnesses. Power Rail implementation optimizes energy distribution system and extends the data transfer system.
Implementation of Energy Distribution Control Unit concept will be described in next article after creating of Central Power Controller prototype. The effectiveness analysis of the new proposed solution will be done after laboratory tests and measurement sessions.
REFERENCES
[1] German Electrical and Electronic Manufacturers Association, 48-Volt Electrical Systems – A Key Technology Paving to the Road to Electric Mobility, Die Elektroindustrie, Frankfurt 2016, [2] Kuypers M., Application of 48 Volt for Mild Hybrid Vehicles and High-Power Loads, SAE Technical Paper 2014-01-1790, January 2014, [2] Druhm O., Die Spannung steigt, Zukunftige Bordnetzarchitekturen mit 48V, Automobil Elektronik 09- 10/2017, October 2017, [3] Ernst M., Heuermann M., Die wichtigsten Bordnetz-Trends, Elektronik Automotive Sonderheft Bordnetz, September 2014, [4] Vollmer A., 48-V-Mildhybrid, Automobil Elektronik 05-06/2016, [5] Babiel G., Bordnetze Und Powermanagment. Thermische Modellbildung fur elektrische Und elektronische Bauelemente, Springer Vieweg, Dortmund 2013, [6] Babiel G., Elektrische Antriebe in der Fahrzeugtechnik, Springer Vieweg, Dortmund 2017, [7] Reif K., Batterien, Bordnetze und Vernetzung, Springer-Verlag, Wiesbaden 2010, [8] Meyer G., Advanced Microsystems for Automotive Applications, Springer, Berlin 2011.
Author: mgr inż. Bartłomiej Tworek, Politechnika Śląska, Instytut Elektrotechniki i Informatyki, Zakład Maszyn Elektrycznych i Inżynierii Elektrycznej w Transporcie, ul. Akademicka 10, 44-100 Gliwice, E-mail: bartlomiej.tworek@polsl.pl
Source & Publisher Item Identifier: PRZEGLĄD ELEKTROTECHNICZNY, ISSN 0033-2097, R. 94 NR 6/2018. doi:10.15199/48.2018.06.30
Published by Electrotek Concepts, Inc., PQSoft Case Study: Distribution System Harmonic Evaluation, Document ID: PQS1013, Date: October 15, 2010.
Abstract: This case study presents a utility distribution system harmonic analysis evaluation. The simulations were completed using the SuperHarm program. The analysis included frequency response and harmonic distortion simulations for a 13.2 kV substation and several industrial customers with power factor correction capacitor banks. The mitigation alterative included a shunt passive harmonic filter which reduced voltage distortion levels below the specified limitations.
INTRODUCTION
A distribution system harmonic analysis case study was completed for the system shown in Figure 1. The 13.2 kV utility substation included a 15 MVA, 230 kV/13.2 kV step-down transformer and a number of distribution feeders that supplied several industrial customers. There was a 2,400 kVAr, 13.2 kV capacitor bank at the substation bus and 600 kVAr and 450 kVAr capacitor banks on the two distribution feeders. The customer loads included 600 kVAr, 480 V power factor correction capacitor banks and a variety of nonlinear devices. The case study was completed using the SuperHarm® program. The accuracy of the simulation model was verified using three-phase and single-line-to-ground fault currents and other steady-state quantities.
Figure 1 – Illustration of Oneline Diagram for Distribution Harmonic Evaluation
SIMULATION RESULTS
Relevant utility system and customer data for the case included:
Substation capacitor bank rating: 2,400 kVAr Short-circuit capacity at the 13.2 kV bus: 168 MVA (ISC = 7.326 kA) Substation load: 5,000 kVA, 0.95 pf Feeder load: 1,500 kVA, 0.80 pf Feeder capacitor bank ratings: 450 kVAr, 600 kVAr Customer capacitor bank rating: 600 kVAr Miscellaneous linear load: 800 kVA Fluorescent lighting (ITHD = 21.7%): 400 kVA DC drive (ITHD = 35.3%): 300 hp PWM ASD (no choke – ITHD = 130.8%): 75 hp PWM ASD (with 3% choke – ITHD = 45.1%): 100 hp Switch mode power supplies (ITHD = 77.2%): 90 kVA
Figure 2 shows a representative simulated nonlinear load model current waveform (single phase) for the 300 hp dc drive operating at 75% power factor. The current had a fundamental frequency value of 343 A, an rms value of 363 A, and a THD value of 35.3%. The simulated waveform shown in Figure 2 was created using an inverse DFT with 256 points per cycle. The nonlinear load characteristics were determined using field measurements at the customer facilities.
Figure 2 – Customer dc Drive Current Waveform
Figure 3 shows the impedance vs. frequency simulation result with the 2,400 kVAr, 13.2 kV substation capacitor bank in service (Case 7b). The base-case result with no utility or customer capacitor banks in service (Case 7a) is also shown on the graph so the two conditions can be easily compared. The simulated parallel resonance due to the addition of the shunt capacitor bank was 504 Hz (8.4th harmonic). A simple expression may be used to validate this result:
In addition, the simulated steady-state voltage rise with the 2,400 kVAr, 13.2 kV capacitor bank in service was 1.4%. This value may be validated using the following expression:
where: hr = parallel resonant frequency (x fundamental) ΔV = steady-state voltage rise (per-unit) MVA3Φ = three-phase short circuit capacity (MVA = √313.2 kV7.3kA≈168MVA) MVAr3Φ = three-phase capacitor bank rating (MVAr)
Figure 3 – Illustration of Frequency Response with Substation Capacitor Bank In-Service
Figure 4 shows the impedance vs. frequency characteristic simulation results for the following system conditions:
– Case 7a: No utility or customer capacitor banks in-service – Case 7b: 2,400 kVAr, 13.2 kV substation bus capacitor bank in-service – Case 7c: 2,400 kVAr, 13.2 kV substation bus, 600 kVAr feeder #2, and 450 kVAr feeder #3 capacitor banks in-service – Case 7d: 2,400 kVAr, 13.2 kV substation bus, 600 kVAr feeder #2, 450 kVAr feeder 3, and both 600 kVAr, 480 V customer capacitor banks in-service
The results show that the frequency response characteristic was very dependent on the status of the utility and customer capacitor banks. The addition of the two 13.2 kV distribution feeder capacitor banks moved the parallel resonance from the 8.4th harmonic to the 6.7th harmonic (Case 7c), while the addition of the two customer low voltage capacitor banks moved the parallel resonance to the 4.6th harmonic (Case 7d). The condition also resulted in a second parallel resonance near the 9.2nd harmonic. The addition of the other capacitor banks also created new parallel resonances at harmonics between the 12th and 24th.
The simulation results illustrate the fact that the frequency response characteristic was far more complex with multiple capacitor banks in-service than the trivial base-case with just one capacitor bank in-service (Case 7b).
Figure 4 – Illustration of Frequency Response with Multiple Capacitor Banks In-Service
Table 1 summarizes the results for the four corresponding harmonic distortion simulations. The table includes the simulated voltage distortion (VTHD) levels at five buses for the four different operating conditions previously summarized in Figure 4. The voltage distortion at the customer #2 low voltage bus exceeded the commonly applied 5% limitation for the case with the 600 kVAr, 480 V power factor capacitor bank in-service (Case 7d). In addition, the voltage distortion at the 450 kVAr, 13.2 kV capacitor bank location on feeder #2 was very close to exceeding the 5% limitation.
Figure 5 shows the corresponding secondary bus voltage waveform that was created using an inverse DFT with 256 points per cycle.
Table 1 – Summary of the Simulated Voltage Distortion Results
Case Number
13.2 kV Bus
13.2 kV Feeder #2
13.2 kV Feeder #3
480 V Bus #1
480 V Bus #2
7a
0.45%
0.53%
2.09%
1.28%
4.44%
7b
0.73%
0.85%
2.01%
1.48%
4.31%
7c
1.17%
2.67%
2.99%
2.83%
4.87%
7d
1.21%
1.62%
4.87%
2.92%
9.43%
.
For the customer with the 3,000 kVA, 7.5% impedance transformer and the 600 kVAr power factor correction capacitor bank, the parallel resonant frequency on the secondary bus may be approximated using the following expression:
where: hr = parallel resonant frequency (x fundamental) XC = capacitor bank reactance (Ω) XSC = system short circuit reactance (Ω) MVA3Φ = three-phase short circuit capacity (MVA) MVAr3Φ = three-phase capacitor bank rating (MVAr) kVAtx = three-phase transformer rating (kVA) kVAr3Φ = three-phase capacitor bank rating (kVAr) Ztx% = transformer reactance (%)
Figure 5 – Illustration of 480 Volt Bus Voltage
Due the excessive voltage distortion levels at the low voltage bus, customer #2 decided to reconfigure their 600 kVAr capacitor bank as a 4.7th harmonic filter. Figure 6 shows the basic configuration of the harmonic filter, while Figure 7 summarizes the filter component and duty calculations.
When mitigation of harmonic distortion is required, one of the options is to apply a filter at the source of harmonics, or at a location where the harmonic currents can be effectively removed from the system. The most cost effective filter is generally a single-tuned passive filter and this will be true for the majority of cases. Filters should be carefully designed to avoid unexpected interactions with the system.
Passive filters are made of inductive, capacitive, and resistive elements. They are relatively inexpensive compared with other means for eliminating harmonic distortion, but they have the disadvantage of potentially adverse interactions with the power system. They are employed either to shunt the harmonic currents off the line or to block their flow between parts of the system by tuning the elements to create a resonance at a selected harmonic frequency.
Filters are generally tuned slightly below the harmonic frequency of concern. This method allows for tolerances in the filter components and prevents the filter from acting as a direct short circuit for the offending harmonic current. It also minimizes the possibility of dangerous harmonic resonance should the system parameters change and cause the tuning frequency to shift slightly higher.
Figure 6 – Illustration of a Low Voltage Single-Tuned Notch Filter Configuration
Table 2 summarizes the results for the additional case evaluating the 600 kVAr, 4.7th harmonic filter bank at the customer #2 bus. The corresponding frequency response characteristic is shown in Figure 8. The voltage distortion level at the low voltage bus was reduced from 9.43% to 2.18% with the addition of the harmonic filter. In addition, the voltage distortion at the 450 kVAr, 13.2 kV capacitor bank location on feeder #2 was reduced from 4.87% to 1.29%. This result illustrates the advantage of the passive harmonic filter by diverting a majority of the harmonic current from flowing onto the utility system.
Figure 8 shows the impedance vs. frequency simulation results with the customer #2 600 kVAr power factor correction capacitor bank reconfigured as a 4.7th harmonic filter (Case 7e). Due to the excessive component duty requirements, the low voltage capacitor bank units that were used in the harmonic filter were rated at 600 V for application on the 480 V bus. The harmonic filter component calculations are summarized in Figure 7.
Table 2 – Summary of the Simulated Voltage Distortion with a Harmonic Filter
Case Number
13.2 kV Bus
13.2 kV Feeder #2
13.2 kV Feeder #3
480 V Bus #1
480 V Bus #2
7a
0.45%
0.53%
2.09%
1.28%
4.44%
7d
1.21%
1.62%
4.87%
2.92%
9.43%
7e
0.33%
1.11%
1.29%
1.82%
2.18%
.
Figure 7 – Customer Low Voltage Filter Design Calculations
Figure 8 – Illustration of Frequency Response with a Low Voltage Filter Bank
The significant design calculations for the harmonic filter summarized in Figure 7 are shown below. The actual fundamental frequency compensation provided by a derated capacitor bank was determined using
Because the filter draws more fundamental current than the capacitor bank alone, the supplied fundamental frequency compensation may be determined using:
where: hrnew = resulting (new) parallel resonant frequency (x fundamental) hfilter = harmonic filter tuning frequency (x fundamental) XSC = system short circuit reactance (Ω) Xfilter = reactance of series filter reactor (Ω)
Passive filters should always be placed on a bus where the short-circuit impedance (XSC) can be expected to remain relatively constant. While the notch frequency is determined by the filter tuning, and will remain fixed, the new parallel resonance will move as the system short circuit impedance varies. For example, one common problem occurs in factories that have standby generation for emergencies. The parallel resonant frequency for running with standby generation alone is generally much lower than when interconnected with the utility. This may shift the parallel resonance down into a harmonic where successful operation is impossible. Filters often have to be removed for standby operation because of this. Filters must also be designed with the capacity of the bus in mind. The temptation is to rate the current-carrying capability based solely on the load that is producing the harmonic. However, even a small amount of background voltage distortion on a very strong bus may impose severe duty on the filter.
SUMMARY
This case study summarized a utility distribution system harmonic analysis evaluation. The analysis included frequency response and harmonic distortion simulations for a 13.2 kV substation and several industrial customers with power factor correction capacitor banks. The mitigation alterative applied included a shunt passive harmonic filter which reduced voltage distortion levels below the specified limitations.
REFERENCES
1. IEEE Recommended Practice for Monitoring Electric Power Quality,” IEEE Std. 1159-1995, IEEE, October 1995, ISBN: 1-55937-549-3. 2.R.C. Dugan, M.F. McGranaghan, S. Santoso, H.W. Beaty, “Electrical Power Systems Quality,” McGraw-Hill Companies, Inc., November 2002, ISBN 0-07-138622-X.
RELATED STANDARDS IEEE Std. 1159, IEEE Std. 519
GLOSSARY AND ACRONYMS ASD: Adjustable-Speed Drive CF: Crest Factor DPF: Displacement Power Factor PF: Power Factor PWM: Pulse Width Modulation THD: Total Harmonic Distortion TPF: True Power Factor
Published by Artur J. MORADEWICZ, Instytut Elektrotechniki
Abstract. The element of infrastructure that provides a connection between an electric vehicle (EV) and a depleted battery and electric source that will charge/discharge these batteries is the Electric Vehicle Service Equipment (EVSE). Recently, the interest of electric vehicles and their charging infrastructure has been the subject of extensive research and development in the world. The infrastructure for charging electric vehicles (EV) will be a key factor in ensuring a smooth transition from conventional mobility to e-mobility. The paper focuses the present charging standards and concept for future EV charging solution. The article touches the problem associated with bidirectional EV chargers which open the way for V2G technology and stationary or dynamic contactless inductive charging which open the way for automated driving EV technology. (Pokładowe i zewnętrzne ładowarki pojazdów elektrycznych).
Streszczenie. Element infrastruktury zapewniający połączenie między pojazdem elektrycznym (EV) a baterią i źródłem elektrycznym, które ładuje / rozładowuje te akumulatory, to sprzęt do obsługi pojazdów elektrycznych (EVSE). Ostatnio zainteresowanie pojazdami elektrycznymi i infrastrukturą ich ładowania jest przedmiotem intensywnych badań oraz rozwoju na świecie. Infrastruktura do ładowania pojazdów elektrycznych (EV) będzie wkrótce kluczowym czynnikiem zapewniającym płynne przejście od konwencjonalnej mobilności do e-mobilności. Artykuł skupia się na obecnych standardach ładowania i koncepcji przyszłego rozwiązania ładowania akumulatorów EV. Porusza również problem dwukierunkowych ładowarek EV, które otwierają drogę technologii V2G oraz stacjonarnego lub dynamicznego bezstykowego ładowania indukcyjnego, które otwiera drogę dla zautomatyzowanej technologii zasilania EV w czasie jazdy.
Słowa kluczowe: osprzęt elektryczny do obsługi pojazdów, ładowanie pojazdów elektrycznych, dwukierunkowe ładowarki EV, stacjonarne / dynamiczne bezstykowe ładowanie indukcyjne. Keywords: Electric Vehicle Service Equipment (EVSE), charging electric vehicles, bidirectional EV chargers, stationary / dynamic contactless inductive charging.
Introduction
The interest in electric vehicles and their charging systems is in the focus of not only large automotive companies, but also start-ups and energy companies that want to diversify their production. On 7th June 2016, Deputy Prime Minister of Poland, Mateusz Morawiecki, announced that the Council of Ministers will prepare an Electromobility Development Plan for Poland. The Electromobility Development Plan is to become one of the pillars of the Responsible Development Plan. It is expected to create conditions for the development of manufacturing and spreading of electric vehicles. The Ministry of Energy assumes that there will be 1 million electric vehicles on Polish roads by 2025. It will be the key component of the National Framework for the Deployment of Alternative Fuels Infrastructure that Member States are required to prepare under the Directive 2014/94/EU and notify to the European Commission by 18 November 2016. However, despite government support and significant progress in EV technology, there are still limitations to their massive use. These include, above all: -high price of electric cars (about 30-50% higher than its equivalent with an internal combustion engine), still small range based on one battery charging, long battery charging time, lack of developed battery charging infrastructure. Many of these problems help to solve advanced and modern power electronics. Therefore, the power electronics system has broadly entered electromobility in the area that can be broadly divided into three specific departments: the power station charging system architecture (in particular ultra-fast charging), battery charger systems themselves, and regulated electric drives with AC motors.
The solid-state transformer
The element of infrastructure of EV chargers that provides a connection between an electric vehicle (EV) and a depleted battery and electric source, very often implemented as energy transformers in the SST arrangement [1]. The structure of solid-state transformer (Fig. 1) in many variants, we can find in many different EV chargers. The solid-state transformer (SST) has been regarded as one of the several most emerging technologies. The basic idea of the SST is to achieve the voltage transformation at high-frequency, therefore to potentially reduce the volume and weight compared to the traditional power transformer. The 50/60-Hz ac voltage is transformed to a high frequency of tens of kilohertz, by high frequency converter, then this high-frequency voltage through the high frequency transformer is transferred to secondary side to secondary side high frequency converter [2], similarly to contactless energy transfer systems. This significantly decreased volume and weight, and finally, shaped back into the desired 50/60-Hz voltage to feed the load. This is the basic idea of SST which can be denoted HVAC/LVAC (high voltage AC/low voltage AC). Usually SST transformer is realized in more complex form HVAC/HVDC/LVDC/LVAC (high voltage AC/high voltage DC/low voltage DC/low voltage AC), in which many attractive features may be potentially achieved.
The most advanced applications of SST are units which can replace traditional transformers in electrical grids. These systems are ideally suited to became building elements of Smart Grids, because they can realize:
• bidirectional power flow • change of power parameters – voltage and frequency regulation • optimized energy distribution based on communications between operator and customers • transformation of power either to AC or DC form • replacement of mechanical switches with transistors enables fast operator reaction to the disturbances and faults in energetic grid
Besides this main field of application there are many others:
• Electric car chargers (in particular modern chargers, this structure can be used in wired and wireless chargers), • Interfaces of renewable sources of energy • Active filters, • Passive power compensators, • Frequency transformers for electric motors, • Interfaces of local energy storage.
Currently, these structures are developed in Electrotechnical Institute mainly in terms of their application in EV chargers in various configurations, on-board chargers, external chargers as well as contactless chargers.
Fig. 1. Basic structure of level 2 charger with SST, power range up to 3kW
Table 1. The classification and associated parameters and types of currently used slots in the terminals wired chargers.
.
Stationary Off and On board chargers
The electrical equipment, which is required for connecting electric vehicles, and more specifically the electric vehicle battery to a power source is varied. The basic variation is the type of source: power from an alternating current (AC) or direct current (DC) source that will supply energy to the vehicle battery. Another internal division of these devices is their division due to the power of the charger, there are three levels:
AC Charging: Level 1: 120V single phase, 2kW and below Level 2: 208-240V, single phase, up to 20kW Level 3: undefined, single or three phase DC Charging: Level 1: 200–450V, 20kW and below Level 2: 200-450V, 20 to 80kW Level 3: 200-450V, above 80kW
The infrastructure for charging electric vehicles, its costs, availability and performance are very important factors that directly affect the smoothness of the transition to electromobility and have a wider application.
There are different variations of charging technology for electric vehicles, standards, requirements, different technological approaches and different charging levels (both in terms of power and time). Table 1 shows the classification and associated parameters and types of currently used slots in the terminals wired chargers [1, 8-11].
Fig. 2. Basic structure of level 2 or 3 on board system with battery management and driving system.
The basic features of the off board chargers is generally higher kW transfer and included more sophisticated BMS systems, additionally: managing battery heating, communications to building/home/grid energy management systems, demand charges, removes weight from vehicle, the higher the energy transfer rate, the higher the required EVSE / vehicle conductivity.
The basic features of the on board chargers is generally lower kW transfer and less concern about battery heating, BMS is managed by on board rectifier (Fig. 2). The on board chargers adds weight to vehicle. An important feature of electric vehicle chargers is if they are 2-directional, and if the energy stored in the vehicle’s battery can be transferred to the power grid, external energy storage or to another electric vehicle (Fig. 3). Vehicle to Grid (V2G) is a concept that has already been extensively described in the professional literature before EV began to appear in greater numbers on the streets of our cities. Now, however, when they are and will be more and more of them, the right cooperation EVSE and EV can become a distributed energy resource (DER) on a much larger scale and with greater significance. [3-6]. This market is just emerging, however, taking into account the number of electric vehicles and the energy stored in their batteries, will have a significant impact on system services in the power grid.
This is because the number of parked vehicles is always greater than those in motion / used. And that electric vehicles have the storage of electricity, it creates room for another and their new use. Energy storage for electric vehicles can be used by home users or large structures function as part of the power system.
Contactless chargers integrated with propulsion system
Inductive charging, also known as Inductive Power Transfer (IPT), Contactless Power Supply (CPS), Wireless Power Transfer (WPT) or Contactless Energy Transfer (CET), it is still a new technology on the market that allows users to charge PEV batteries without using a cable connection [7, 12-13]. This system consists of, among others, a charging pad (the primary side of the system installed at the power point) and the receiving pad (secondary side installed under the vehicle). Energy is transferred through a flagstone, asphalt layer, non-metallic material, water, and others.
It should be emphasized that a significant contribution to the research and development of contactless power supply systems has a sector directly related to the development of science and its applications in industry. The Electrotechnical Institute (IEL) in Warsaw has developed the 50kW contactless energy transfer (CET) system to charge large EV battery (Fig. 4). There are now working on a hybrid system combining CET system with the propulsion system. This technology, despite the initial fears, provides impressive energy transfer efficiency even for larger air gaps between the transmitter and the PEV load receiver. The successful development, implementation of wireless technology and its economical and comfortable operation is another step of its more general and broader application. Currently, work is underway on the possibility of wireless charging in the roadway (currently in separate lanes) as a method of continuous charging of the vehicle’s battery during its use on the road. Effective implementation of this technology is of particular importance to reduce the size of the battery in the vehicle, both vehicles type PEV and HEV. This explains the interest in this subject. The contactless charger of an electric vehicle is an on-board charger, thus increasing the weight of the vehicle, however, because of the numerous advantages, enjoys great interest.
Figure 4 presents a contactless energy transfer system, whose secondary side converter is integrated with the drive inverter. The topology has supply port from single or three-phase AC source, connected by active rectifier converter PC1 as of-board part of the system. On the opposite side is the second port – energy storage as the power battery of electric vehicle. Electric motor is the third port of this concept circuit topology. The circuit should be build on the modern SiC transistors. The additional mechanical / power electronic connectors S1, 2, 3, N are required, in order to reconfigure the circuit, and switch-ON desirable operating mode. By means of appropriate configuration of the switches S1, 2, 3, N, the stator winding of the electric motor LD1, D2, D3 is disconnected or added to the circuit of the system. The topology has three operating modes that are charging and recharging mode and driving mode, PC4 converter is working. In charging and recharging operating mode converters PC2 and PC2 can operate like DAB converter. Each mode works independently. This power system should be designed to turn on or off automatically. The proposed circuit structure has two important advantages: one is galvanic insulation, the other a more convenient to use power system. The disadvantage is the more complex structure of the system due to the required additional switches. On the other hand reduce the weight of the contactless power supply system installed on board of the vehicles. The possible configurations of the structure of the system on the secondary side are shown in Figure 5. These are selected options of configuration that in the target system will depend on the type and power of the electric motor used, as well as on power electronic converters installed on the vehicle.
Fig. 3 Vehicle to Grid and Vehicle to Vehicle system multi combination topology.
Fig. 4. The structure of contactless energy transfer system topology connected to the grid and integrated with EV driving system.
Fig. 5. The structure of secondary side – possible system configurations.
Conclusions
It should be emphasized that there is currently no single applicable standard of charging used, there are commonly many types of chargers with different parameters. The easiest way to charge electric vehicles is to use an additional built-in AC charger, which is an AC / DC converter with galvanic isolation. This type of solution is often used, but only as low-power chargers. The high-capacity on-board charger would significantly increase the weight of the vehicle and limit the usable space. For this reason, the built-in AC charger is usually limited to approximately 20 kW of charging power in commercial electric vehicles. An integrated charger using a combination of drive inverter and drive motor winding for charging EV batteries also increases the total weight of the vehicle, however, it gives the user much more comfort and safety of use. Currently, IEL works on reconfigular converters PC3, PC4 and their use in electric vehicles are carried out.
This work was financed from the project: TECHMATSTRATEG1/347452/1/NCBR/2017
REFERENCES
[1] “Electric Vehicle Charging Technology Analysis And Standards”, FSEC Report Number: FSEC-CR-1996-15, [2] Xu She, Alex Q. Huang, and Rolando Burgos. “Review of Solid-State Transformer Technologies and Their Application in Power Distribution Systems”, IEEE Journal of Emerging and Selected Topics in Power Electronics, 2013 [3] Y. Fan, W. Zhu, Z. Xue, L. Zhang, Z. Zou, “A Multi-Function Conversion Technique for Vehicle-to-Grid Applications”, Energies 2015, 8, 7638-7653; doi:10.3390/en8087638, [4] M. Kesler, M. C. Kisacikoglu, L. M. Tolbert, “Vehicle-to-Grid Reactive Power Operation Using Plug-In Electric Vehicle Bidirectional Offboard Charger”, IEEE Transactions on Industrial Electronics, vol. 61, no. 12, 2014, [5] G. Buja, M. Bertoluzzo, C.Fontana, “Reactive Power Compensation Capabilities of V2G-Enabled Electric Vehicles”, IEEE Transactions on Power Electronics, vol. 32, no. 12, 2017, [6] M. Yilmaz, P. T. Krein, “Review of Battery Charger Topologies, Charging Power Levels, and Infrastructure for Plug-In Electric and Hybrid Vehicles”, IEEE Transactions on Power Electronics, vol. 28, no. 5, 2012, [7] G. R. C. Mouli, P. Venugopal, P. Bauer, “Future of Electric Vehicle Charging”, 19th International Symposium POWER ELECTRONICS Ee2017, October 19-21, 2017, Novi Sad, Serbia, [8] SAE Standard J1772, “SAE Electric Vehicle and Plug-in Hybrid Electric Vehicle Conductive Charge Coupler,” 2010. [9] SAE Hybrid Committee, “SAE Charging Configurations and Ratings Terminology,” 2011. [10] “Standard IEC 62196 – Plugs, socket-outlets, vehicle connectors and vehicle inlets – Conductive charging of electric vehicles – Part 1, 2, 3” [11] “Standard IEC 61851 – Electric vehicle conductive charging system – Part 1, 21, 22, 23, 24” [12] Gautham Ram Chandra Mouli, Prasanth Venugopal, Pavol Bauer. “Future of electric vehicle charging”, 2017 International Symposium on Power Electronics (Ee), 2017 [13] Gan Jinhao, Wang Hui, Wang Tengxin, Wang Yubin. “An integrated topology for on-board charger and driven of electric vehicle”, IEEE International Conference on Industrial Technology (ICIT), 2017.
Author: Dr Eng. Artur Jan Moradewicz, Electrotechnical Institute, 28 Pozaryskiego St., 04-703 Warsaw, E-mail: a.moradewicz@iel.waw.pl;
Source & Publisher Item Identifier: PRZEGLĄD ELEKTROTECHNICZNY, ISSN 0033-2097, R. 95 NR 2/2019. doi:10.15199/48.2019.02.30
Published by Krzysztof ZAGRAJEK, Konrad WRÓBLEWSKI(1), Piotr BICZEL(2), Łukasz SOSNOWSKI(3), Warsaw University of Technology, Institute of Electrical Power Engineering (1); Institute of Theory of Electrical Engineering, Measurement and Information Systems (2) ; Innogy Stoen Operator (3)
Abstract. The paper presents the problems of operating a fast charging station for electric vehicles in a collecting point of electric vehicle (EV) car sharing innogyGO! Authors presented measurements of the parameters of the power quality in operational conditions, and also proposed a number of tests that should be carried out to investigate the impact of EV charging on the distribution grid. Each of the analysed tests is a reflection of the real demand for charging vehicles by the end-users.
Streszczenie. W artykule przedstawiono problematykę pracy stacji szybkiego ładowania pojazdów elektrycznych działających w punkcie zbiorczym wypożyczalni pojazdów elektrycznych (EV) innogyGO!. Zaprezentowano pomiary parametrów jakości energii elektrycznej w warunkach operacyjnych, a także zaproponowano szereg testów jakie należy przeprowadzić przy badaniu wpływu ładowania EV na sieć dystrybucyjną. Każdy z analizowanych testów jest odzwierciedleniem rzeczywistych potrzeb ładowania pojazdów przez użytkowników.(Eksploatacja stacji szybkiego ładowania pojazdów elektrycznych w Warszawie – Studium przypadku punktu zbiorczego innogyGO!).
Keywords: electric vehicles, electric vehicles charging stations, e-car sharing, distribution grid operation, power quality Słowa kluczowe: pojazdy elektryczne, stacje ładowania pojazdów elektrycznych, wypożyczalnie samochodów elektrycznych, praca sieci dystrybucyjnej, jakość energii elektrycznej.
Introduction
Nowadays, the policies of governmental organisations are aimed at ensuring the development of sustainable public transport [1,2]. Under current legislation, EU member states are obliged to create a National Framework for the Development of Electromobility [3].The development of electromobility means that in the coming years, it will be a lot of tasks for distribution system operators (DSO), in terms of ensuring the adequacy of grid infrastructure [4,5]. There will be a rapid increase in the number of electric vehicles (EV) and therefore lot of challenges within creating market and technical conditions for the purchase of private battery electric vehicles (BEV), but also support and implementation of electric vehicle car sharing (EVCS). Solutions for EVCS are widely known in Europe, including Poland [6,7]. They do not always have to be based on classic passenger cars, but also on innovative concepts [8]. However, it is important to maximise the mobility of users, i.e. to allow the user to leave the vehicles at their destination (one-way Electric Vehicle car sharing). In Poland, such programmes can be used both in Warsaw (innogyGO) and in Wrocław (Vozilla) [9,10]. The best known European solution was the rental of small electric vehicles in Paris – Autolib. Unfortunately, due to financial reasons, the project was terminated [8].
Popularization of EV requires the use of appropriate incentives to purchase them. In 2019, the Polish government introduced regulations enabling these vehicles to drive on bus lanes and allowed them to park free of charge in paid parking zones, as well as prepared financial support mechanisms. Currently, these are 30% of the purchase price of EV, but not more than 8700 euros. Unfortunately, the drawback of this mechanism is the maximum purchase price of EV, which is 29,000 euros, which means that only a few cars are within the set price limit. Analysing the world literature it can be observed that the amount of the subsidy in Poland is at a comparable level to other countries at the beginning of the process of popularization of EV, however, there were no limits on the price of electric vehicles [11].
Regardless of the incentives, the number of electric vehicles in Poland is significantly increasing. Fig. 1 shows the increase in the number of EV vehicles in 2019, while Fig. 2 shows the number of vehicles newly registered in the first half of 2019 divided into EV models.
Fig. 1. Number of electric vehicles in Poland from April to October 2019 – based on [12]
As shown in Figure 2, more than half of the new electric vehicles registered in H1 2019 belong to the innogyGO electric vehicle car sharing company. Their fleet currently consists of BMW i3 and i3s. The charging of these vehicles can take place in public charging stations, but also in special parks where these vehicles are collected.
Fig. 2. New registrations of BEV electric vehicles at the end of H1 of 2019 – based on [12,13]
The aim of this paper is to examine the impact of fast charging of EV vehicles, held at the e-car sharing point, on the power quality parameters in a heavily urbanised area. Therefore, 5 tests were defined, during which power quality measurements were performed. The methodology of such tests was also developed in order to improve their accuracy.
Description of the electric grid in the studied area
The Warsaw energy network, due to its metropolitan nature, is characterized by a very high demand for power per unit of area. In densely built-up districts, especially of an office and service character, this density exceeds the value of 12MW / km2. This necessitates the construction of a dense network with a large number of stations and short lines with high capacity. The distances between the stations are small, the average distance between stations outside the city centre is 4 – 5 km, and in the city centre about 1 – 1.5 km. New HV/MV stations are built as indoor ones, with transformers with a capacity range of 25 – 63MVA installed. This allows a significant reduction in the size of the terrain and the volume occupied by the stations.
The urban nature of Innogy Stoen Operator`s area of operation, as well as the provisions of local spatial development plans meant that new lines are built as cable. In practice, these requirements apply to all voltage lines. Existing overhead lines can be upgraded leaving their overhead character if this is not the case in conflict with the current local plan (which is increasingly rare) and that is why most overall modernizations are planned as cable lines. Such kind of line – in addition to reducing the size of the area needed and reducing transmission losses – also have an important movement feature. Their bandwidth to a small extent – unlike overhead lines – it depends on the time of year. This is extremely important in today’s reality in which the summer peak power is comparable with the powers of winter peaks. Cable lines avoid the resulting problem from a decrease in the line capacity as the ambient temperature increases.
Saturation of Warsaw’s districts with a cable grid according to fig. no 3 reflects the urban characteristics of the city. Most cable lines are laid in the oldest districts, in the city centre and directly adjacent areas, i.e. Śródmieście, Ochota, Wola, Mokotów, Praga Południe, Żoliborz, Praga Północ, Targówek and Bemowo. The peripheral districts, characterized by younger buildings created in the last thirty years, have a less compact MV cable network. However, these are areas that will continue to develop intensively due to the continuous increase in the number of Warsaw residents. One should also take into account overhead lines, which practically no longer exist in the city centre, however in districts such as Wawer or Białołęka they constitute over a dozen or more percent of the total MV network, and still perform the function of distribution networks. In the near future, systematic cabling of overhead lines is planned, which will contribute to increasing the density of the cable network also in the outskirts of Warsaw.
Fig. 3. The degree of MV network cabling in Warsaw area – length of cable lines [km] per 1 km2 of district area
Methodology of research
Measurements of the operating parameters of the charging station were carried out on 18.10.2019 at the innogyGO! EVSE located at 3 Eliza Orzeszkowa Street in Warsaw. They were run from 12:21 to 13:56, during which 5 tests were conducted. The object of the tests was a charging station PRE Edward Biel EVB max DC, which parameters are presented in the table 1. The vehicle used during the tests was a standard BMW i3 belonging to the fleet of electric vehicle car sharing company, whose technical data is presented in the table 2. The measurements were recorded using a power analyser Hioki 3198 with an interval of 1 second. The figure 4 shows the timeline with the tests performed.
Table 1. The parameters of PRE Edward Biel max DC charging station
Parameter
PRE Edward Biel max DC
Rated input voltage
230/400 V
Rated insulation voltage
500/690 V
Rated frequency
50 Hz
Surge voltage withstanding
8 kV
DC charging power
50 kW
DC output voltage:
50 ÷ 500 V DC
DC output current:
0 ÷ 125 A
Efficiency of DC systems:
95%
.
Table 2. The technical data of BMW i3 [14]
Parameter
Technical Data
Type of electric motor
Synchronous AC
Power of the electric motor
125 kW
Battery type
Lithium-ion battery
Battery voltage
360 V
Battery capacity
42 kWh
Range
260 ÷ 280 km
Energy consumption
0,11÷ 0,15 kWh/km
.
Fig. 4. Timeline of conducted tests
As shown in Fig. 4, the first step was to prepare the measuring station so that the measurements could be made at the output of the charging station on the AC side. The single line diagram of the measurement system is shown in the figure 5. The first test (Test 0) concerned the verification of the conditions of operation of the DSO grid. As a result, a benchmark for further analyses was obtained. During Test 0, the work of the charging station was also checked in the no-load condition and also during the process of synchronization with the vehicle. The next measure performed was Test 1, i.e. 10-minute charging of an electric vehicle. The aim of this research is to check the impact of short charging on the DSO grid, which could represent the charging of EV during short break in travel. The vehicle had a deeply discharged battery, i.e. its State of Charge (SOC) was very low and amounted to 3%. The next test (Test 2) was to perform a regular charging of the electric vehicle, i.e. from the state of SOC = 25% to 85%. This represents a typical charging that can take place while staying at a workplace, shopping mall or P&R parking lot. The electrical parameters of the charging station were then checked for compliance during a sudden power outage (Test 3). In the first part of this test, the power supply was switched off by means of an emergency button and then, after about 2 minutes, the power supply was switched on again. Therefore, it was possible to simulate a situation in which the power lines could be damaged or a sudden loss of voltage could occur, and then the power supply from the DSO was restored. The last test (Test 4) was to check the operating parameters of the charging station when trying to charge the vehicle to its maximum charge before a long journey, i.e. charging it to SOC = 100%. According to the available knowledge, this charging process should be in Constant Voltage (CV) mode, as opposed to 25% to 85% in Constant Current (CC) mode [15].
Fig. 5. Single line diagram of LV substation at Orzeszkowa Street
The following parameters were analysed during the tests:
• Phase voltages and currents; • Power factor cosφ; • Total harmonic distortion of voltage and current
(4) THD = √Σnk=2 U2k / U1
• Long-term and short-term flickering nuisance; • State of charge of EV battery (reading from the on-board compute
Results
The tests were carried out on 18.10.2019 from 12:21:10 to 13:56:08. The BMW i3, with an initial SOC of 3%, was used for the tests. The figure 6 shows the EV charging profile with the SOC level recorded. Based on the fig.6, the registered charging process seems to be typical (Level 2) for a DC fast charging station. The maximum charging power was 33 kW. This means that the charger has a load limit of 66% of the rated power (50 kW). The charging process lasted 1 hour 30 minutes, with about 55% of the time when the battery level (SOC) increased from 3% to 85%. The last charging phase, the so-called constant voltage (CV) charging, took about 40 minutes. At the end, the SOC level was 100%, which means that the EV was fully charged. The second phase is characterized by a decreasing current, and thus charging power, with increasing SOC.
Fig. 6. Measurements of charging power and SOC of EV during whole test
The first part of the research, i.e. Test 0, concerned the study of the operating conditions of the DSO grid, in the case when the EVB max DC charger was working in no-load state. Figure 7 shows selected measurements recorded during the test. As can be seen from the figure 7, the operation of the no-load charger does not interfere with the operation of the power grid. The recorded values of the voltage total harmonic distortion (THDU) slightly exceed 2% (despite recording measurements with 1-second interval). It should be expected that the recorded values of the aforementioned coefficient may come from the distribution network to which 5 EVB max DC chargers have been connected in its immediate vicinity. Due to the proximity of the DSO MV substation, the measured values of the phase voltage are slightly higher than the rated ones.
Fig. 7. Test 0 – Measurements of phase voltage (a) and THDU (b)
The second part of the measurements, i.e. Test 1, concerned the study of the impact of short-term charging on the DSO grid, as well as the observation of the increase in the level of SoC in the EV vehicle. The test lasted 10 minutes and the exemplary measurement values are shown in Figure 8. Based on Fig. 8a it was confirmed that the charger has a capacitive character. During a 30 kW charge, the reactive power generation was a maximum of 8 kVar. This means that the station operated with the power factor within the range of cosφ = 0.96 – 0.99, so in accordance with the applicable polish regulations [16]. Based on Figure 8b, it can be observed that during the 10-minute charging of the EV, the phase voltage limit values were not exceeded (recorded values of 235 V). The THDU (Fig. 8c) recorded during this test, as well as the harmonic voltage spectrum, allow to state that the limits forced by Polish law were not exceeded [16].
Fig. 8. Test 1 – Measurements of reactive power (a), phase voltage (b) and THDU (c)
The next part of the test (Test 2) was to perform a typical charging of an electric vehicle from the level of battery charge of SoC = 23.5% to the level of SoC = 85%. The test started at 12:35:01 and lasted till 13:16:00. Chosen measurement values are shown in Fig. 9. Based on Fig. 9a it can be observed that in the period from 13:09 to 13:16 the value of reactive power generation and thus the power factor cosφ slightly decreases (from 8 kVar to 5.5 kVar). However, it can be stated that these are transition states, resulting from the synchronization of the power electronic systems, and the device still maintains the capacitive character of the work. Based on fig. 9b it can be stated that the obtained values of phase voltages during the whole time of Test 2 were at the level of 235 V. These values are similar to those obtained in previous tests. Similar results were also obtained for the voltage total harmonic distortion analysis (Fig. 9c).
Fig. 9. Test 2 – Measurements of reactive power (a), phase voltage (b) and THDU (c)
The aim of the next test (Test 3) was to check the impact of a sudden disruption of the charging station’s power supply on the occurrence of potential violations of power quality parameters. Test 3 consisted of two parts – switching off the power to the charging station by using the emergency button and then, after a few minutes, reenergizing the power supply. In the case of the first part, the 6-second interval (13:16:22 ÷ 13:16:27), in which the process of switching off the power supply took place, was analysed. The analysed section contains the operating status of the charger just before switching off the voltage (2 sec.), the moment of switching off the voltage, as well as the status after switching off the power supply (3 sec.). In the case of the second part, the 5 second interval (13:17:55 ÷ 13:17:59), during which the power supply to the charging station was restored, was analysed. Fig. 10 shows the Total harmonic distortion of voltage and current during switching off and on the charging station. In Fig. 10a it can be read that during the dynamic state voltage disturbances occurred (introduction of higher harmonics). Interestingly, the phenomenon was recorded only for phase L3. Probably the recorded disturbances could have originated from the devices of the charging station’s auxiliaries. During the analysis of the current total harmonic distortion (THDI) (Fig. 10b), values of several hundred percent were observed. This is probably a transitional state of gradually disconnected power electronic devices. As in the case of part 1 of Test 3, high values of the THDI factor were observed (Fig. 10d). THDU values do not exceed the limit values (Fig. 10c), i.e. they are within the ranges defined in the EN 50160 Standard [17]. It should be noted that the existing regulations refer only to 10-minute measurements, and the conducted measurement were recorded with a 1-second interval.
Fig. 10. Test 3 – Measurements of THDU during switch off (a), THDI during switch off (b), THDU during switch on (c) and THDI during switch on (d)
The last test carried out (Test 4) involved charging the EV vehicle to reach the battery charge level, according to the readings from the on-board computer, SOC= 100%. Test 4 was performed from 13:18:00 to 13:56:08. The measurements were started when the BMW i3 on-board computer showed SOC= 85%. Fig. 11 shows the selected parameters recorded during Test 4.
Fig. 11. Test 4 – Measurements of reactive power (a), phase voltage (b) and THDU (c)
Figures 6 and 11a show that the EV charging in Test 4 is done mostly in constant voltage mode (CV). A significant decrease in the charging power was observed in the last phase of the test when the SOC reaches about 90% (according to the on-board computer). This is close to 80% of the rated capacity of the battery, which would confirm the change in the charging mode – from constant current (CC) to Constant voltage (CV). Moreover, it should be noted that the process of charging from the level of SOC = 90% to the level of SOC = 100% took more than 30 minutes. This confirms the theoretical assumptions of the charging mode of lithium-ion batteries in constant voltage (CV) mode [15]. Based on Fig. 11a, it can be observed that during battery charging, the charging power consumption is gradually reduced with a constant level of reactive power. As a result, the power factor while charging the battery to the maximum level gradually decreased. After 13 minutes of charging it was only cosφ = -0.8, after 27 minutes cosφ = -0.4, to reach cosφ ≈ -0.25 at the end of charging, after 35 minutes from the beginning of the test. The values of phase voltages during the reduction of the charging power increase from 235 V to 236.5 V (Fig. 11b). The THDU values for all three phases oscillate around 2% (Fig. 11c).
Conclusion and discussion
The paper presents the results of measurements in operational conditions of the fast charging station of electric vehicles operating in the collecting point of electric vehicles car sharing company – innogyGO! Based on them it can be stated that there were no significant violations of the limit values in the field of power quality parameters. The values of phase voltages as well as the THDU factor did not differ from those in the EN 50160 standard. From the obtained measurement results it can be noticed that the control of the THDI factor, especially in dynamic states, will be a big concern. The measurements confirmed that EVs are being charged according to theoretical assumptions, which will allow easier planning of network traffic through DSOs. Nevertheless, the process of implementing electromobility in the municipal power grid is a huge challenge for the Distribution System Operators.
The inclusion of vehicle charging systems in the distribution grid and ensuring continuity of supply to customers also imposes on distribution system operators a number of new challenges related to the expansion of the network as well as providing consumers with energy supplies in a continuous manner and with appropriate parameters. Another task for the DSO resulting from the implementation of vehicle charging stations in the low voltage grid is the need for dynamic reconfiguration of the power network. Making the right switching decisions requires the use of Smart Grid technology, including the collection of remotely transmitted data and their analysis.
The dynamic development of vehicle charging systems will not be possible without progress in the construction of charging stations adapted for two-way energy flow, but also will not be possible without changing the habits of electric vehicle users and changes in legislation correlated with this phenomenon.
REFERENCES
[1] Croce A., Musolino G., Rindone C., Vitetta A., Sustainable mobility and energy resources: A quantitative assessment of transport services with electrical vehicles, Renewable and Sustainable Energy Reviews, 113 (2019), no. 109236 [2] Letnik T., Marksel M., Luppino G., Bardi A., Božičnik S., Review of policies and measures for sustainable and energy efficient urban transport, Energy, 163(2018), pp. 245-257 [3] Directive 2014/94/EU — deploying the EU’s alternative fuels infrastructure [4] Ma T., Mohammed O., Optimal Charging of Plug-in Electric Vehicles for a Car-Park Infrastructure, IEEE Transactions on Industry Applications, 50 (2014), no. 4, pp. 2323-2330 [5] Khan W., Ahman F., Alam M., Fast EV charging station integration with grid ensuring optimal and quality power exchange, Engineering Science and Technology, an International Journal, 22 (2019), no.1, pp. 143-152 [6] Firnkorn J., Muller M., Free-floating electric carsharing-fleets in smart cities: The dawning of a post-private car era in urban environments?, Environmental Science & Policy, 45 (2015), pp.30-40 [7] Pieriegud J., Zawieska J., Mobility-as-a-service – global trends and implementation potential in urban areas in Poland, Transport Economics and Logistics, 79 (2018), pp. 39-51. [8] Mounce R., Nelson J., On the potential for one-way electric vehicle car-sharing in future mobility systems, Transportation Research Part A, 120 (2019), pp. 17–30 [9] InnogyGO e-car sharing, [online], https://innogygo.pl/pl [access:17.12.2019] [10] Vozilla e-car sharing, [online], https://www.vozilla.pl/ [access:17.12.2019] [11] Palmer K., Tate J., Wadud Z., Nellthrop J.,Total cost of ownership and market share for hybrid and electric vehicles in the UK, US and Japan, Applied Energy, 209 (2018), pp. 108–119 [12] Polish Alternative Fuels Association, Electromobility meter in Poland (in Polish), [online], http://pspa.com.pl/aktualnosci [access: 17.12.2019] [13] Samar, Results of sales of electric cars in Poland in the first half of 2019 (in Polish), [online], https://www.samar.pl/__/3/3.a/104111/3.sc/11/Firmyratuj%C4%85-sprzeda%C5%BC autelektrycznych-.html?locale=pl_PL [access: 17.12.2019] [14] Technical data of BMW i3, [online], https://www.bmw.pl/pl/allmodels/bmw-i/i3/2013/at-a-glance.html, [access: 17.12.2019] [15] Jiang L., Li Y., Huang Y. et al., Optimization of multi-stage constant current charging pattern based on Taguchi method for Li-Ion battery, Applied Energy, 2019, (article in press), https://doi.org/10.1016/j.apenergy.2019.114148. [16] Regulation of the Minister of Economy on detailed conditions for the operation of the power system (in Polish), Journal of Laws No. 93, item 623 [17] European Standard EN 50160:2010 Voltage characteristics of electricity supplied by public distribution systems
Authors: mgr inż. Krzysztof Zagrajek, Politechnika Warszawska, Instytut Elektroenergetyki, ul. Koszykowa 75, 00-662, Warszawa, E-mail: krzysztof.zagrajek@ien.pw.edu.pl; mgr inż. Łukasz Sosnowski, innogy Stoen Operator, ul. Piękna 46 00-672 Warszawa, E- mail:lukasz.sosnowski@innogy.com; dr hab. inż. Piotr Biczel Instytut Elektrotechniki Teoretycznej i Systemów Informacyjno-Pomiarowych ul. Koszykowa 75 00-662 Warszawa; inż. Konrad Wróblewski, Politechnika Warszawska, Instytut Elektroenergetyki, ul. Koszykowa 75, 00-662, Warszawa, E- mail: konradw@post.com;
Source & Publisher Item Identifier: PRZEGLĄD ELEKTROTECHNICZNY, ISSN 0033-2097, R. 96 NR 5/2020
Published by Sampsa KUPARI, Metropolia, Helsinki University of Applied Sciences
Abstract: The electrical vehicle form a huge load (and occasionally a generator as well) that is not resistive but possibly of nonlinear character. This may have an effect on distribution network power quality and possibly disturb seriously other consumers. If this is not taken care of before expansion of electrical vehicles boom, serious damage may occur.
Streszczenie. Ładowanie akumulatorów samochodów o napędzie elektrycznym stworzy bardzo duże obciążenie o nieliniowym charakterze, co może oddziaływać na jakość energii w sieci oraz stanowić poważnie zagrożenie dla innych odbiorców energii. Analiza tego zagadnienia przed powszechnym wprowadzaniem pojazdów o napędzi elektrycznym pozwoli uniknąć szeregu poważnych problemów w przyszłości (Wpływ wprowadzenia pojazdów o napędzie elektrycznym na jakość energii w sieciach rozdzielczych).
Keywords: Power Quality, THD, rectifier, harmonic Słowa kluczowe: Jakość energii, THD, prostownik, harmoniczne
Introduction
Demand on electrical vehicles will definitely increase in the future in order to reduce CO2-emissions and increase the use of renewable energy as well. Fossil energy sources will peter out and gasoline will get more and more expensive before it’s getting to end. If a moderate prized battery will be introduced, the amount of electrical vehicles will explode. The huge amount of electric cars includes big energy recourse and beside of charging it may be used to feed electricity in the network as well. Impacts to network power quality will be quite similar in both cases concerning harmonic but voltages drops will turn out to be voltage surges in some cases. It is possible that EN 50160 [1] limits will not always be met because of this trend.
Load size
Rectifiers can be dimensioned in different ways, but probable basics for dimensioning will be size of feeding fuse. Probably the maximum power will be utilized when charging vehicles because then the charging time will be shortest. However in many cases maximum is one phase supply with 10 A fuse. Therefore maximum charging power is 2.3 kW. If car is driven averagely 50 km a day, it needs roughly 10 kWh, which yields to four hour charging time. There are a big amount of uncertainties but assuming that 40 % of cars may be plugged between 4 pm and 10 pm to network. If, using Finland, as example this roughly yields with it’s 2,12 million passenger cars to maximum power of P = 2.000 MW when assuming statistically all cars are not loaded simultaneously. Annual peak power is roughly Pm = 15.000 MW, so this can be considered as a remarkable increase. However, this peak power normally occurs in winter mornings, so the need of power plant capacity is not increased accordingly. If designed intelligently, these vehicles can be used to feed network as well. Both cases are problematic because of the character of load being not resistive but non-sinusoidal. Load represents roughly 15 % of maximum load. Hence load may be considerably higher in other countries.
Load character
It is not known yet which kind of charges will be assembled to future electrical vehicles. Here two different types are studied to find limits which can be reached [2]. Harmonics of voltage and current are shown in table 1 as well currents in table 2. Current includes a big amount of harmonic currents but is typical of semiconductor devices. Harmonics of voltages are of illustrative character only, while these figures will depend on supply network properties too [2].
Fig. 1. Charging current of example vehicle A and corresponding voltage of supply
Table 1. Harmonics at supply voltage
u1 [%]
u3 [%]
u5 [%]
u7 [%]
uTHD [%]
100
2,1
1,0
0,7
2,1
.
Table 2. Harmonics at supply current
i1 [%]
i3 [%]
i5 [%]
i7 [%]
iTHD [%]
100
79,5
48,0
19,0
95,0
.
Other charger properties (vehicle B) are shown on figure 2.
Fig.2. Charging current of example vehicle B and corresponding voltage of supply
Network harmonics
A small amount of cars to be charged do not disturb network as seen on table 1, where harmonic content is remarkably lower than accepted by standard EN 50160. But when a greater amount of chargers will be plugged impact will be bigger. Basic frequency voltage will of course have some sag as with resistive load, too. But harmonic currents will flow to network and they meet network impedance Xi (resistance neglected here). That is considered linear with frequency which yields that capacitor banks are not connected. In some cases they may cause resonances and simulation numerical values shown later might be remarkably higher. If introducing Un = 20 kV supply with short circuit current Ik = 5 kA, we can define network impedance on secondary Un = 400 V side to be XQ1 = 0,4 mΩ, Sn = 1000 kVA impedance typically has XT1= 8,8 mΩ. Totally impedance on frequency f1 = 50 Hz can be considered to be X1 = 9,2mΩ. A simulation of load degree of 50 % is studied with results shown in table 3.
Table 3. Harmonics at transformer secondary
i
Ii [A]
Xi [mΩ]
Ui [V]
1
721,7
9,2
6,6
3
685,6
27,6
18,9
5
346,4
46,0
15,9
7
137,1
64,0
8,8
.
This will cause total harmonic content
.
which gives UTHD = 11, 4 %, that is far too high comparing to standard EN 50160, where THD is defined to be at maximum 8,0 %. Individual values at f3 = 150 Hz and f5 = 250 Hz values are too high even the load is only 50 % of transformer’s nominal value. Percentages are shown in Table 4. High amount of third harmonic caused a big circulating current in Dy-coupled transformer’s windings and additional warming [3].
Table 4.Harmonics at transformer secondary
i
Ui [A]
Ui [mΩ]
UENi [V]
1
6,6
2,9
–
3
18,9
8,2
3,0
5
15,9
6,9
6,0
7
8,8
3,8
5,0
.
Effects on voltage distortions are presented in picture 3, where transformer secondary voltage at half load is presented.
Fig.3. MathCadvoltage presentation of simulated values for 50 % loading of transformer with nonlinear load
These values are too high to be accepted. Therefore maximum loading of transformer could roughly be 30 % of nominal and that would cause quite high harmonic content, too.
Transformer loading
Beyond harmonic content loading of network component is essential too. Using semiconductor loads nominal loading can’t be reached, but it is lower. Transformer loading can be approximated as well [3]:
.
Constant “a” stands for skin effect and “q” for corresponding increase of resistance. Constant “a” values are known to some degree, but values for “q” are unluckily not generally available. Hence use of this formula is not exact, but it gives some approximations. This normally yields that the active power of transformer nominal may be at highest roughly 75 %. This means that network component will be higher and life-cycle of them shorter.
Financial value of these effects is not easy to define, but it is not negligible. However, transformer secondary power quality begin to be at standard maximum roughly at 30 % loading supposing no other nonlinear load is coupled simultaneously. Even this may lead to problems for other users.
These problems can be solved to some degree by harmonic filtering, but it can be considered as a quite expensive act. And need of reactive power is minimal with these rectifiers, so power factor may become strongly capacitive and it may be a technical problem and in many cases tariffs may cause excessive bills for users. Active harmonic filtering is technically a better solution, but investment cost is considerably higher. Normal power factor correction is not possible even if necessary, if transformer secondary is used for electrical vehicle charging.
Rectifier properties
Simulations before have been calculated using typical rectifier that represents practically the worst case. If applying the other type that is much more close to sinusoidal character effect to power quality is much smaller. Future is unknown but using these two variations it may be concluded that using very basic type of rectifier, effects on power quality may be very serious and cause difficulties in power distribution and especially by consumers.
Conclusions
Number of electrical vehicles will increase greatly in the future. This will cause need of distribution network strengthening, but if using simple rectifiers when charging cars it may lead to serious problems in power distribution and for consumers. Solving this problem in distribution network is possible but expensive. If using more complicated rectifiers, these problems can be avoided to great degree. This is possible only if these requirements are considered in standards. Hence it is important that future standards in this area will handle these questions in the way problems will be avoided.
REFERENCES
[1] Standard EN 50160: 2009: Voltage Characteristics in Public Distribution Systems [2] Pöllänen Minna: „Power Quality in Charging Elecric car” BSc thesis, Metropolia University of Applied SciencesHelsinki, Finland, 2011. [3] Dugan, McGranaghan, Beaty: 1996:Electrical Power System Quality, McGraw-Hill
Author: msc, ee, eur.eng Sampsa Kupari, Metropolia University of Applied Sciences in Helsinki, Albertinkatu 40-42, 00180 Helsinki, Finland, E-mail: sampsa.kupari@metropolia.fi
Source & Publisher Item Identifier: PRZEGLĄD ELEKTROTECHNICZNY (Electrical Review), ISSN 0033-2097, R. 88 NR 6/2012
Published by Alexander ABRAMOVITZ1, Volodymyr YASKIV2 , Keyue SMEDLEY3, Sami Shamoon College of Engineering (1), Ternopil Ivan Puluj National Technical University (2), University of California (3)
Abstract. Generation and transfer of electrical energy can severely degrade the environment. The necessity of joint research in the field of high-frequency power converters with power factor correction to protect the environment from the electromagnetic pollution was discussed. Current state of law and research in several countries was presented. Passive and active correctors and the idea of new topology for power factor correction were described.
Streszczenie. Działalność człowieka na polu wytwarzania energii elektrycznej powoduje znaczącą degradację środowiska naturalnego. Główny przedmiot zainteresowania przedstawiony w artykule dotyczy analizy wpływu współczynnika mocy na efektywność transferu energii elektrycznej od wytwórcy do końcowego odbiorcy. Przedstawiono stan prac legislacyjnych oraz badawczych w różnych krajach ze szczególnym uwzględnieniem Ukrainy. Opisano dwa typy korektorów, pasywny i aktywny oraz główne założenia dotyczące nowej, projektowanej topologii korektorów współczynnika mocy. (Korekcja współczynnika mocy jako właściwy krok w kierunku bezpieczniejszego środowiska).
Keywords: Power Converter, Power Factor Correction , High-Frequency Magnetic Amplifier, One-Cycle Control. Słowa kluczowe: przetworniki energii, korekcha współczynnika mocy, wzmacniacz magnetyczny.
Introduction and background
Today it is widely recognized that human activities make a strong environmental impact. Safe existence and well being of mankind and other life on our planet depend on quality, reliability and efficiency of our power systems. Pollution of coal and nuclear power generation plants is a major threat to the environment. Along with improving the efficiency of power generation and distribution systems the power consumption practices should be improved as well. Consumers are an essential part of any power system and play a major role in the game. Proper use of power and energy is consumers’ liability.
Electronic systems are the fastest growing electrical energy consumer market. IT and Telecom systems are found everywhere in military installations, industrial plants, office environment and every household. Most of electronic systems relay on the utility for power. Though the power consumption of a single electronic appliance is quite low, the accumulative effect of electronic appliances makes a profound impact on the grid. It is estimated that about half of power generated in US is processed by some kind of electronic system. As a matter of fact, simple rectifier stages of the old generation electronic power supplies, industrial phase controlled rectifiers and even the fluorescent lighting are main contributors to the harmonic pollution of the utility. Harmonic currents injected into the utility cause high frequency interference problems, increased conduction losses and increase transformer core losses. Harmonics may also cause resonance and increased failure rate of capacitors due to isolation breakdown. These factors decrease the reliability and efficiency of power distribution system.
An extreme case of power quality failure is the notorious New York outage of 2003 when a major power outage struck simultaneously across dozens of cities in the eastern United States and Canada costing millions in damages. However, less damaging power quality disturbances may appear daily. Some of more common utility disturbance types of are the sags, swells, surges and interruptions. In our age, electrical and electronic equipment and especially IT and Telecom systems play an ever-growing role in governing of our society. Once a utility disturbance causes a mis-operation of the IT equipment, our society relies on in our daily lives, it can take a heavy toll on our personal as well as our business life. In extreme cases power quality failure can disrupt the civil order causing severe damages.
Power Factor (PF) is a measure of how efficiently electrical power is consumed. While the ideal PF is unity, in reality power factor of highly inductive or nonlinear loads is about 0.7 or even less. For these reasons, recent regulations in US and EU have made Power Factor Correctors (PFC) a mandatory utility interface stage of next generation power supplies. The task of an ideal PFC is to draw pure sinusoidal line current in phase with the line voltage as well as automatically regulate and protect the output. An ideal PFC system should operate with a unity power factor drawing no harmonic line current. As a result, the power generation plants and distribution systems can operate with lower rms currents, higher efficiency and, therefore, with fewer emissions and lower pollution footprint. Furthermore, a power supply with the PFC interface can tolerate and ride through sags, swells and surges and provide reliable power to operate the IT and Telecom equipment. PFC is also expected to provide protection functions as well as some hold-up time sufficient for systems’ emergency data save and shut down during line voltage interruptions.
Hence, low power quality practices have a destabilizing environmental and economical effects whereas, high quality/low harmonic power consumption is beneficial to the environment and secure wellbeing of our society. To combat the issues of power quality, the industry requires new technological solutions. Scientists and researchers around the world are engaged in research of new theoretical approaches to PFC problem. Existing high quality power supplies attain their characteristics by rather complicated schemes. These are high-tech feedback systems which are costly to build. And, due to the sheer numbers of IT or Telecom consumers, power quality comes at a considerable cost. Commercial industries are striving to be competitive and thus are eager for better products. Hence, more research effort is required to develop simple, cheaper and reliable technological solutions which can provide good performance at affordable cost.
State of the art of the topic
a) Current State of the Technology
According to the operating principles PFC’s can be classified as passive or active [1, 2].
Passive PFC relay on heavy filtering of the input current. The main advantage is that there is no pre-regulator stage. Such an approach can provide reasonably good quality current, very low EMI and also good reliability.
However, the passive elements of the filter are oversized and excessively bulky.
Active PFCs are designed around high frequency converters. Good quality of the input current is obtained by a pre-regulator stage, whereas, the second stage provides tight output voltage regulation. The two-stage schemes offer several advantages: sinusoidal line current and compliance with IEEE regulations; good performance under widely varying universal line voltage; isolation can be provided by the output stage; hold-up time can be provided by a proper choice of the first stage capacitor; easier design of the second stage. The main disadvantages of the two stage PFCs are: cascade connected scheme lowers the overall efficiency; overall increased size, weight and cost.
According to the shape of the input current Active PFC’s may be further classified in two major groups: PFC with sinusoidal current and PFC with a near-sinusoidal input current.
Actually, IEEE regulations does not require an absolute zero harmonic content and unity power factor as these objectives would be very difficult to achieve. To be practical, both IEEE 519 and IEC 1000-3-2, permit a certain amount of distortion in the line current. Accordingly, several simple schemes of one stage PFC with reduced component count and a single control loop were proposed in literature. Mainly for low power range applications.
Some other PFCs with the near-sinusoidal current operate in the discontinuous conduction mode (DCM). As in DCM some converter topologies draw input current which shape crudely follows the line voltage. The practical meaning of this is that the input current may not be actively controlled and only a single voltage control loop is required. However, the near sinusoidal line current translates as some amount of distortion. This type of PFC is also limited by regulations to low power level. Moreover, due to relatively high input current ripple the EMI filter size, cost and weight are relatively large.
PFCs with active current shaping can achieve much better quality of the input current. This means lower distortion. These PFCs are generally designed using Boost converter in the continuous conduction mode. Boost power stage is perhaps the most popular converter used in a single phase PFCs due to its simplicity, low part count and inherent ability to generate a sinusoidal input current. However, when operated from the line voltage, the Boost converter generates high output voltage with significant output ripple. The high output voltage increases the switching losses of the semiconductor devices and penalizes the efficiency especially in low power applications. Snubbers can be used to improve the efficiency but also increase the circuits’ complexity. Additional disadvantage of the Boost converter is the lack of isolation and inability to provide multiple outputs. These features make the Boost converter incompatible with the needs of IT and Telecom systems. As mentioned, the standard practice is to overcome these deficiencies is by introduction of an additional downstream converter/s. The resulting cascade connection of several power stages reduces the overall power supply efficiency whereas, the cost, weight, volume and heat dissipation are increased.
Clearly, the existent practices have to be improved and the quest for better technological solutions continues.
b) Current Status of Environmental Awareness and Research Activities in Participating Countries
US being the home for many world top universities take the leading role in research and development in the area of advanced power electronics and PFC. In general US public has a high sense of environmental awareness. Consequently, stringent power quality regulations were introduced in US and EU. US and EU industries comply with the regulations on power quality and cooperate to introduce the newest PFC systems available. One of the more advanced research centers on power factor correction systems is University of California, Irvine, Power Electronics Laboratory (UCIPEL). UCIPEL is a world leading center with years of industry oriented research experience and dozens of scientific publications in the area of AC-DC conversion.
Perhaps due to the communist legacy and social turbulence of post communism era Ukraine has low environmental awareness. Ukrainian legislators still see the environmental issues as matters of low priority and little attention is given to the power quality problems. Ukrainian industries are striving for survival and lack the will and the capital to invest in power quality. Regretfully, at present, Ukraine has no power quality regulations. However, as a future forecast, Ukraine industry will have no other choice but to renovate and join the world trend. Realizing the future trend, Power Electronic Laboratory of Ternopil State Ivan Pul’uj Technical University is joining PFC research to establish this new research field in Ukraine. TSIPTU has an extensive experience with magamp circuits [3-6] which are an interesting alternative technology for PFC applications.
Israeli high learning institutions follow the power quality trend dictated by the US and EU. Power electronics research groups in major Israeli research universities are actively engaged in PFC research [7-10]. Israeli industry also endorsed the IEEE power quality regulations and is catching up on their implementation. Power Electronic Laboratory of Sami Shamoon College of Engineering has over a decade of experience in research and development of high power factor interface circuits.
Justification of the project
It has been long recognized that power generation system is a key component of national security of any country. Power quality and proper power consumption also deserve to be recognized as factors of national security. Power quality directly affects the stability and reliability of power generation and distribution systems on which ordinary citizens, business and government of our society depends on in daily life. Power quality has an effect on amount of polluting emissions from power plants and, as a result, affects the environment, public health, and quality of life. Hence, issues of power quality have a far reaching economical and social influence. Technologies that increase power quality and reliability, contribute to safer environment, better public health, better public productivity and economical development. Secure economical wellbeing insures civil rest, political stability and help promoting world peace.
Organization of the project and implementation of the results
The joint research venture launches a study of a single stage PFC topology which can provide high quality utility interface, multiple isolated outputs and large voltage stepdown as usually required by IT and Telecom systems. With an appropriate control scheme, the proposed converter can achieve both a sinusoidal input current and a constant regulated output voltage suitable for powering modern electronic systems.
The objectives of the proposed research are to form an international research team to promote the power quality and energy efficiency issues and to extend the existing knowledge on PFC systems. The aim of the joint research is to develop a simple, reliable, and cost effective power converter for IT and Telecom systems and to implement a viable prototype to be put into practice by commercial industries. The joint venture will also set the stage for international cooperation and provide training to international researchers via joint research activities and offer a wide public report of the technological advances.
This project is aimed to provide cheaper, economically viable solution to increase the power quality and, thus, reliability of IT and Telecom systems. The project is intended to design of a state of the art power converter with high quality input and output characteristics; prototyping of the proposed converter; testing and experimental verification of the proposed approach.
The innovation offered by this project is the incorporation of a utility interface stage and the output regulator stage into a single power stage. The new technological principle allows attaining several important features, usually provided by two cascade stages, by a single stage. In comparison with traditional technologies, the proposed converter possesses several advantages: high quality input characteristics with low harmonic content; universal line voltage input; multiple regulated output voltages compatible with the power demands of the IT and Telecom systems; high overall efficiency of the proposed converter is expected; robust power stage and control circuitry; circuit simplicity and overall reduced cost of power supply; low manufacture cost can facilitate wider use of high quality utility interface systems.
The PFC control circuits are implemented by a One Cycle Controller (OCC) [11-14]. OCC objectives are to draw the sinusoidal current from the source and keep the PFC output voltage at the predetermined DC level. The control circuit is comprised of an integrator with reset, a clock, two comparators, and two flip/flops along with a few linear and logical components to form current selection circuit, region selection circuit, and drive signal distributor. No multipliers, DSP, or software is necessary, resulting in a simple and reliable solution.
Compared to other control methods, the OCC-based current compensator is a very simple circuit. OCC is capable of obtaining fast dynamic response because the inner current control loop is embedded in the PWM modulator, which has a dynamic response at the speed of switching cycles. Consequently, the operation at wide line frequency range 0–2 kHz is achievable with low total harmonic distortion in the line current.
University of California, Irvine, Power Electronics Laboratory (UCIPEL) will provide project management, technical advisory, training, research facility and testing equipment for the project. UCIPEL will also provide education and research training of researchers from Israel and Ukraine. In addition, UCIPEL will also be responsable of prototyping and testing of the converter. Ukraine, Ternopil State Ivan Pul’uj Technical University, will perform design and implementation of the magnetic amplifier regulator part, construction of the experimental prototype and conduct the prototype testing. Israel, Sami Shamoon Colege, will perform comprehensive theoretical and simulation study of the proposed topology; design of the Power Factor Corrector stage and Control circuitry and assist in the experimental testing of the prototype converter.
UCIPEL has an extensive record of products been licensed and commercialized by industries. UCIPEL will take action to make sure that the final implementation of the research result passes many rigid industrial standards such as IEC, FCC, UL tests. With the required certifications obtained the research product can be easily adopted by commercial partners.
The investigators team will present the research results and detailed report of the prototype performance to the scientific community and to the industry by joint publication in a scientific journal and presentation at international conferences.
REFERENCES
[1] O. García, J. A. Cobos, R. Prieto, P. Alou, J. Uceda, “Single phase power factor correction: a survey”, Transactions on Power Electronics, Vol. 18, no 3, May 2003, pp. 749- 755. [2] C. Qiao, K. Smedley, “A Topology Survey of Single-Stage Power Factor Corrector with a Boost Type Input Current-Shaper”, Transactions on Power Electronics, Vol. 16, no 3, May 2001, pp. 360- 368. [3] Yaskiv V.I. The New Methods of Switch Mode Power Supply Designing for Computer Facilities / In: Proc. of the International Workshop on Intelligent Data Asquisition and Advanced Computing Systems: Technology and Applications (IDAACS’2001), Resort Center FOROS, Foros, Crimea, Ukraine, Guly 1-4, 2001, p. 87-90. [4] Volodymyr Yaskiv. Using of High-Frequency Magnetic Amplifier in Switch Mode DC Power Supplies // Proceedings of the 35th Annual IEEE Power Electronic Specialists Conference (PESC’04), Aachen, Germany, 2004, p. 1658-1662. [5] Yaskiv V. Design Methods of Switch Mode Power Supplies // Tutorial 10 on 26-th Interna-tional Energy Conference (INTELEC), Hyatt Regency Chicago, Illinois, USA, 2004, 40 pp. [6] Yaskiv V. I., Yurchenko M.M. Methods of power converters designing with high level of the load current on based of high-frequency magnetic amplifiers // Journal of Institute of an Electrodynamics“Technical Electrodynamics”, Special issue “Power electronic and power efficiency”, part 2, 2006, p. 3-6. [7] A. Abramovitz, “Effect of the Ripple Current on Power Factor of CRM Boost APFC”, Journal of Circuits, Systems and Computers, Vol. 17, No. 3, 2008, pp. 389–398. [8] A. Abramovitz, “Steady State Characteristics of the Off-Duty Cycle Controlled APFC with no Input Voltage Sensing“, International Review of Electrical Engineering, Dec. 2007. [9] A. Abramovitz and S. Ben-Yaakov, “Investigation of an Alternative APFC Control with no Sensing of Line Voltage Based on a Triangular Modulation Carrier”, APEC08, Austin, Texas, Feb. (2008). [10] A. Abramovitz, S. Ben-Yaakov, “Simplified Static and Dynamic Models of the 3-loop Active Power Factor Correction System,” EPE-97, pp. 1354-1359, (1997). [11] L. Zheren, K. Smedley, M. Yunhong, “Time quantity one-cycle control for power-factor correctors. IEEE Transactions on Power Electronics, vol.12, no.2, March 1997, pp. 369-75. Publisher: IEEE, USA. [12] Z. Lai and K. Smedley, “A General PWM Modulator and Its Applications,” IEEE Transactions on Circuits and Systems I: Fundamental Theory and Applications, April 1998, vol.45, (no.4):386-96. [13] Z. Lai and K. Smedley, “A family of continuous-conduction-mode power-factor-correction controllers based on the general pulse-width modulator,” IEEE Trans. Power Electron., vol.13, no.3, pp.501–510, May 1998. [14] K. Smedley and T. Jin, “One-cycle control and its applications in power quality control and renewable power generation,” in Proc. Power Eng. Soc. General Meeting, 2005, Jun. 2005, pp. 1258–1266.
Authors: Dr. Alexander Abramovitz, Assisting Professor, Department of Electrical and Electronics Engineering, Sami Shamoon College of Engineering, Beer-Sheva, Israel. Presently he is a visiting Researcher to the Department of Electrical and Computer Engineering University of California, Irvine, USA, alabr@hotmail.com; Dr. Volodymyr Yaskiv, Head of the Departement of Radiotechnical systems, Ternopil Ivan Puluj National Technical University, Ruska Street, 56, 46001, Ternopil, Ukraine, yaskiv@yahoo.com; Prof. Keyue Ma Smedley, Ph.D., IEEE Fellow Professor, Department of Electrical and Computer Engineering University of California, Irvine, CA 92697-2625, USA, smedley@uci.edu
Source & Publisher Item Identifier: PRZEGLĄD ELEKTROTECHNICZNY, ISSN 0033-2097, R. 89 NR 3a/2013