Published by Electrotek Concepts, Inc., PQSoft Case Study: Effect of Distribution Feeder Loading on Harmonic Resonance, Document ID: PQS0703, Date: July 26, 2007.
Abstract: A utility operates 1200 kVAr and 600 kVAr capacitor banks on a 25.56kV distribution feeder. The utility uses frequency scan simulations to determine the effect of the capacitor banks and seasonal load levels on the impedance vs. frequency response characteristics for the feeder. It is assumed that the results will be more severe for the low load condition because there are lower levels of damping.
This case study evaluates the effect of seasonal load variation on the frequency response characteristic of a 25.56kV distribution feeder.
INTRODUCTION AND MODEL DEVELOPMENT
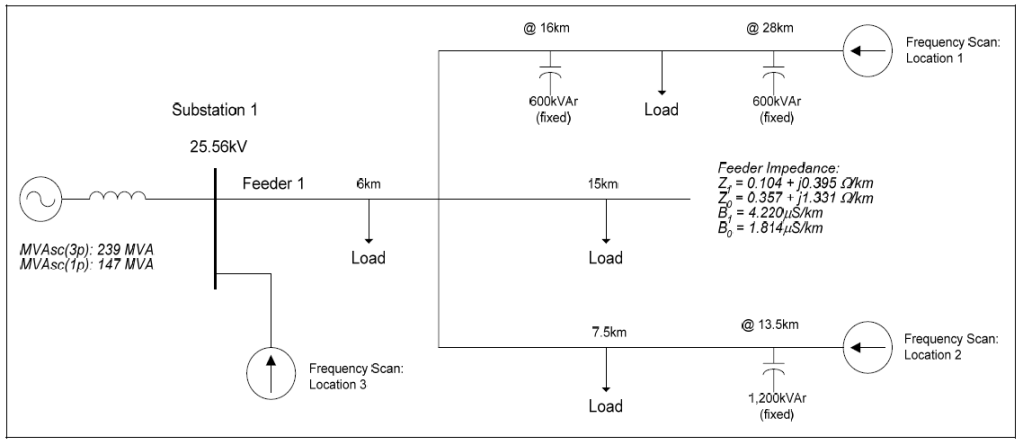
The effect of seasonal load variation on the frequency response characteristic of a 25.56kV distribution feeder was studied for the system shown in Figure 1. The accuracy of the system model was verified using three-phase and single-line-to-ground fault currents and other steady-state quantities, such as capacitor bank rated current and voltage rise. Frequency scan analysis was used to determine the impedance vs. frequency characteristic for the feeder for various operating conditions.
SIMULATION RESULTS
The following frequency scan cases were completed for the case study:
| Case Number | Scan Location | Load Condition | Capacitor Bank Status |
|---|---|---|---|
| Case 1a | 1 | Full Load | All Off |
| Case 1b | 1 | Full Load | All On |
| Case 1c | 2 | Full Load | All Off |
| Case 1d | 2 | Full Load | All On |
| Case 1e | 3 | Full Load | All Off |
| Case 1f | 3 | Full Load | All On |
| Case 1g | 1 | 30% Load | All Off |
| Case 1h | 1 | 30% Load | All On |
| Case 1i | 2 | 30% Load | All Off |
| Case 1j | 2 | 30% Load | All On |
| Case 1k | 3 | 30% Load | All Off |
| Case 1l | 3 | 30% Load | All On |
The frequency range for these cases was 60 Hz to 5,000 Hz (1 Hz increment). The load on the feeder for the “full load” condition was approximately 10.4 MVA at 98% power factor.
Figure 2 shows the impedance vs. frequency simulation results for scan location number 1 (600kVAr, full load) without and with the feeder capacitor banks in service.
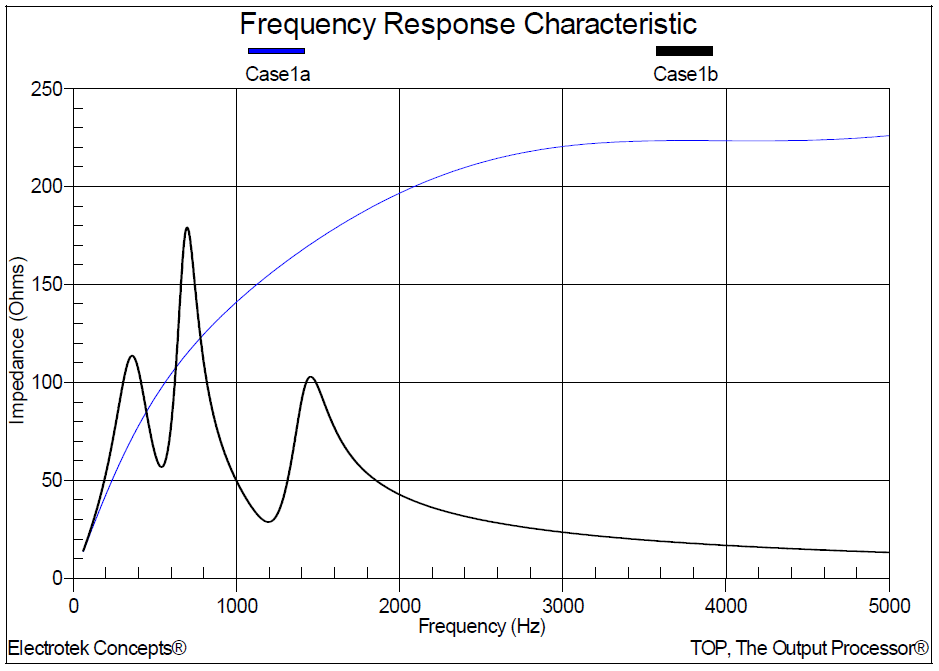
Figure 3 shows the impedance vs. frequency simulation results for scan location number 2 (1,200kVAr, full load) without and with the feeder capacitor banks in service.
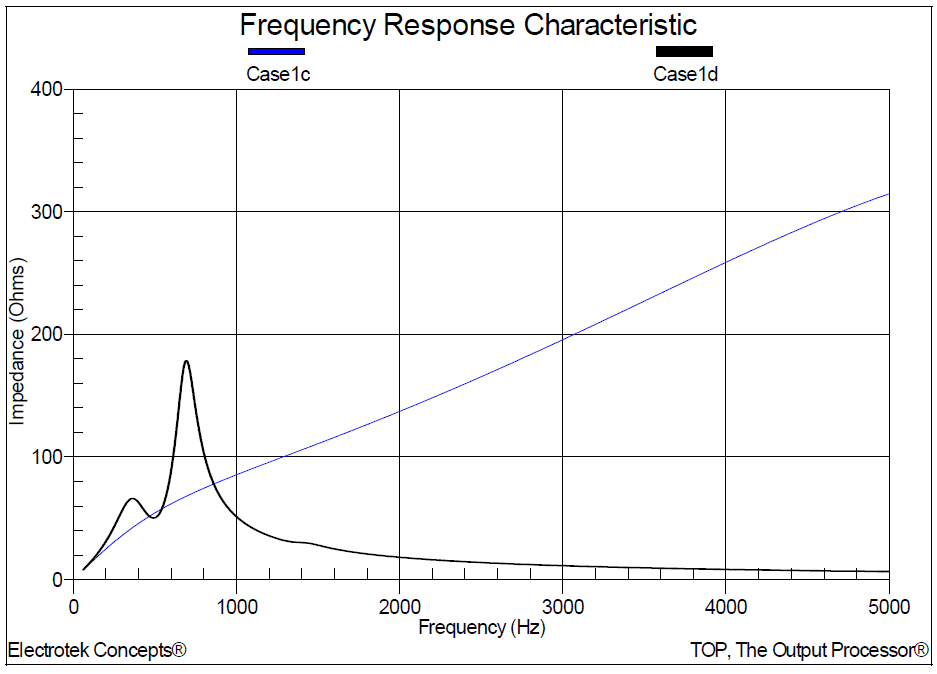
Figure 4 shows the impedance vs. frequency simulation results for scan location number 3 (substation bus, full load) without and with the feeder capacitor banks in service.
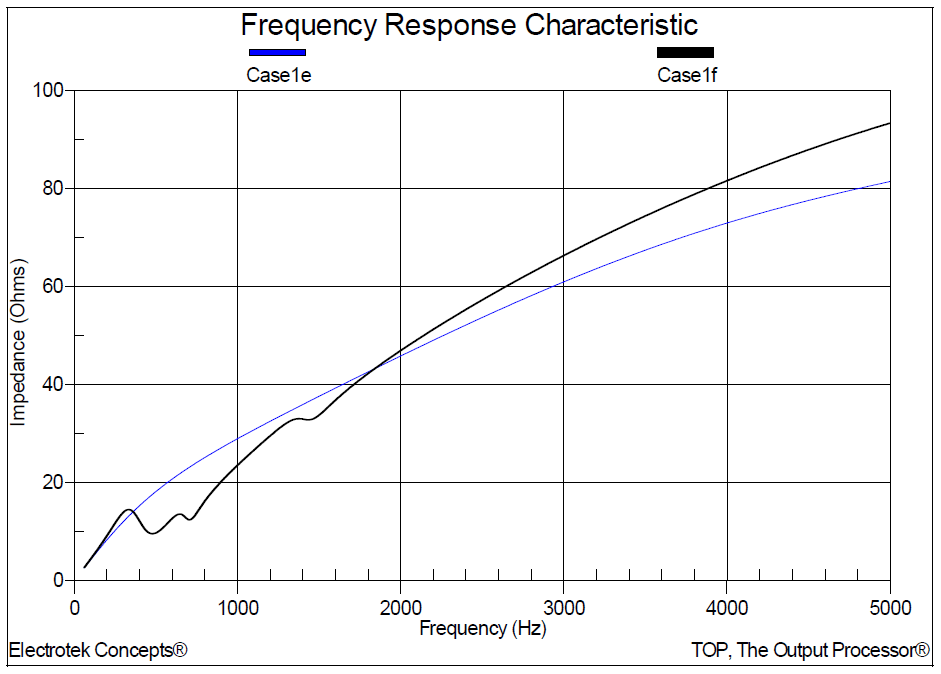
Figure 5 shows the impedance vs. frequency simulation results for scan location number 1 (600kVAr, 30% load) without and with the feeder capacitor banks in service.
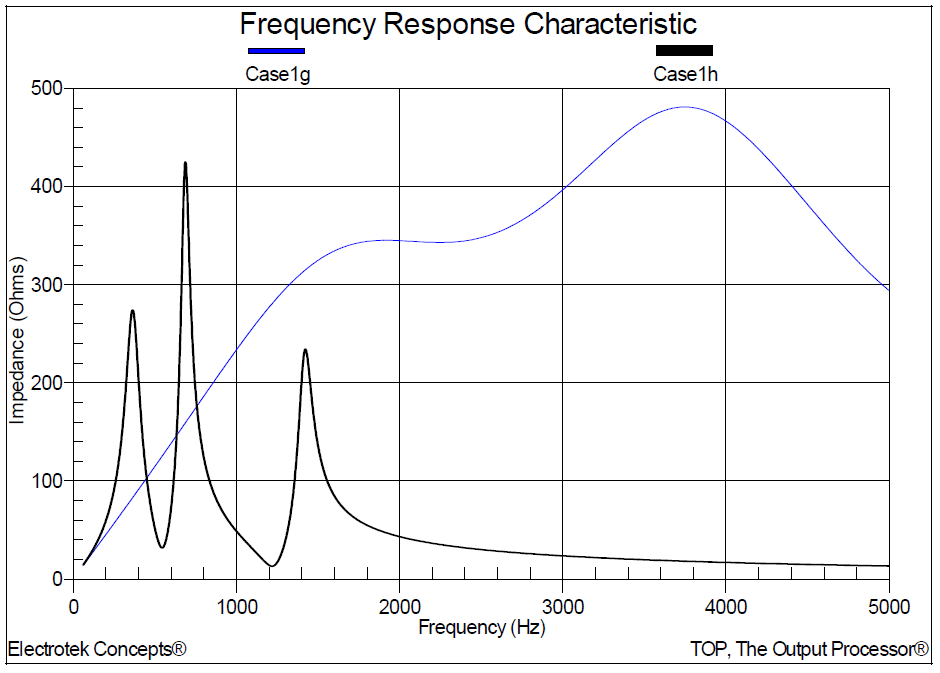
Figure 6 shows the impedance vs. frequency simulation results for scan location number 2 (1,200kVAr, 30% load) without and with the feeder capacitor banks in service.
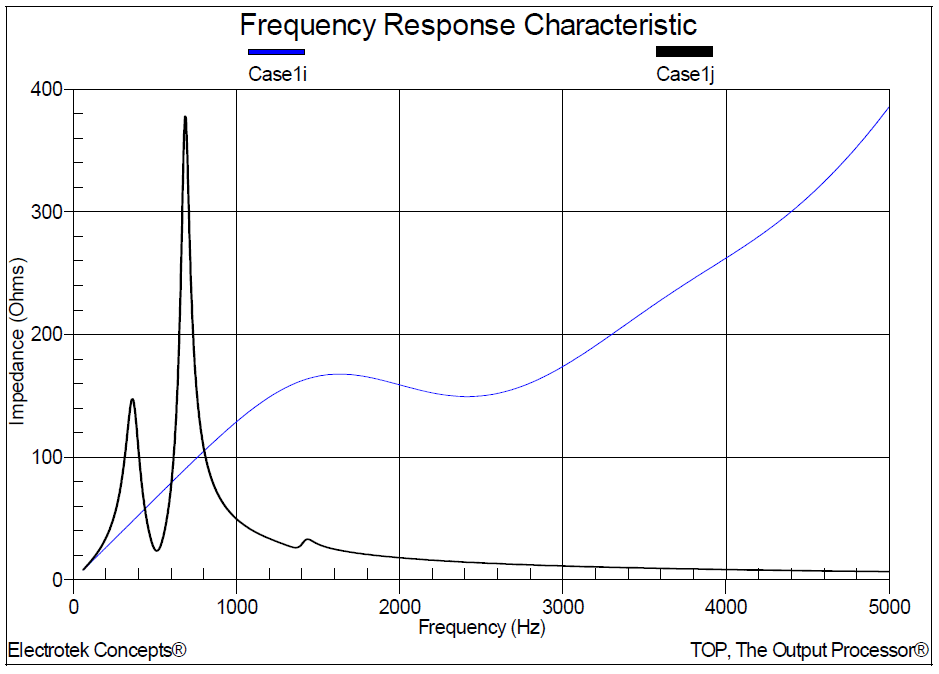
Figure 7 shows the impedance vs. frequency simulation results for scan location number 3 (substation bus, 30% load) without and with the feeder capacitor banks in service.
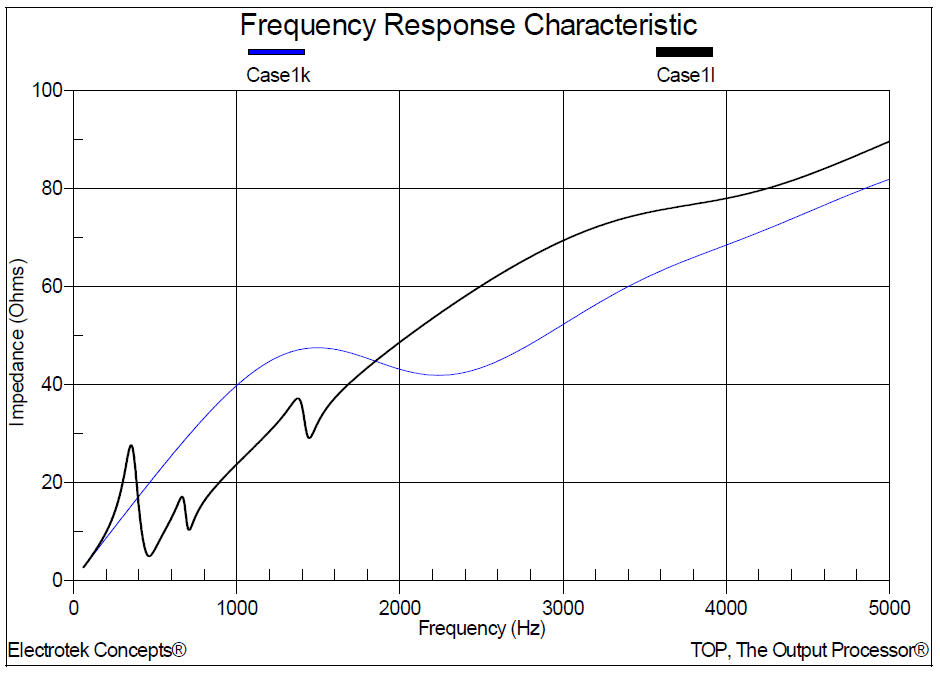
Figure 8 shows the amplification factors for scan location number 1 (600kVAr) for the full load and 30% load conditions. Amplification factor is defined as the ratio of impedance with capacitor banks to the impedance without capacitor banks (e.g., Case 1b divided by Case 1a).
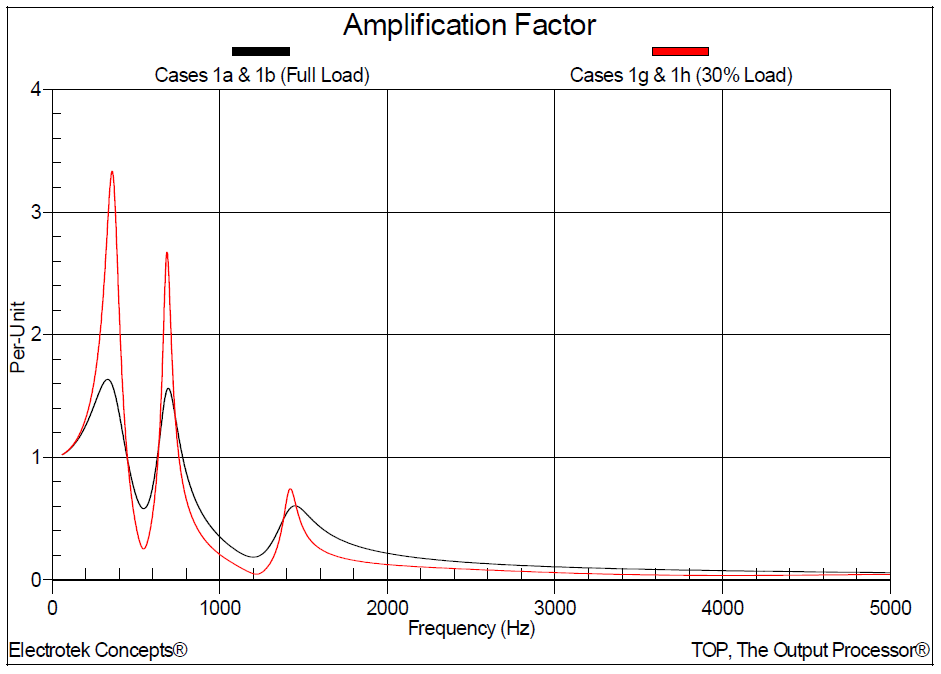
Figure 9 shows the amplification factors for scan location number 2 (1,200kVAr).
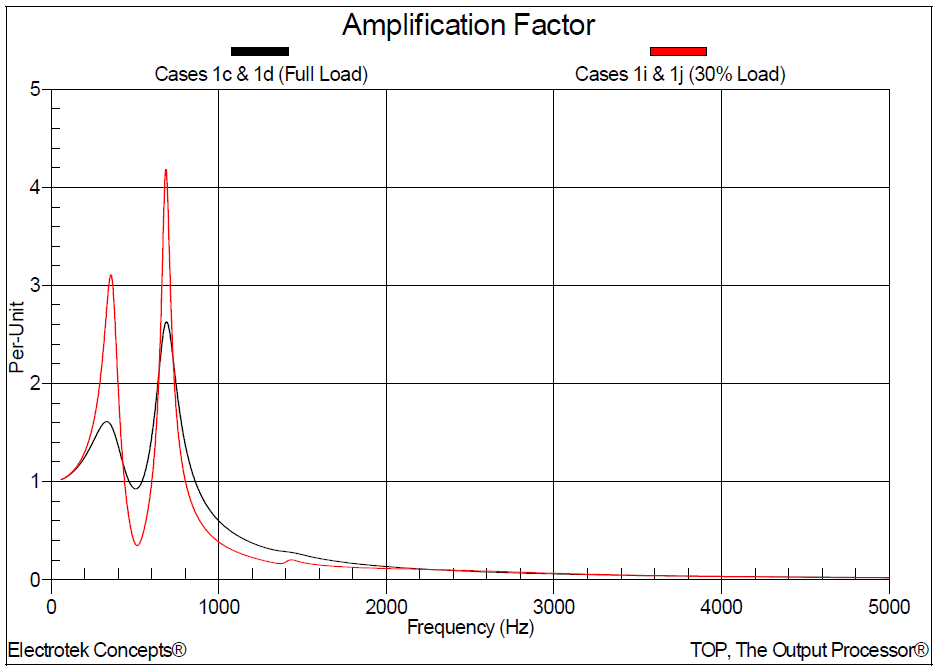
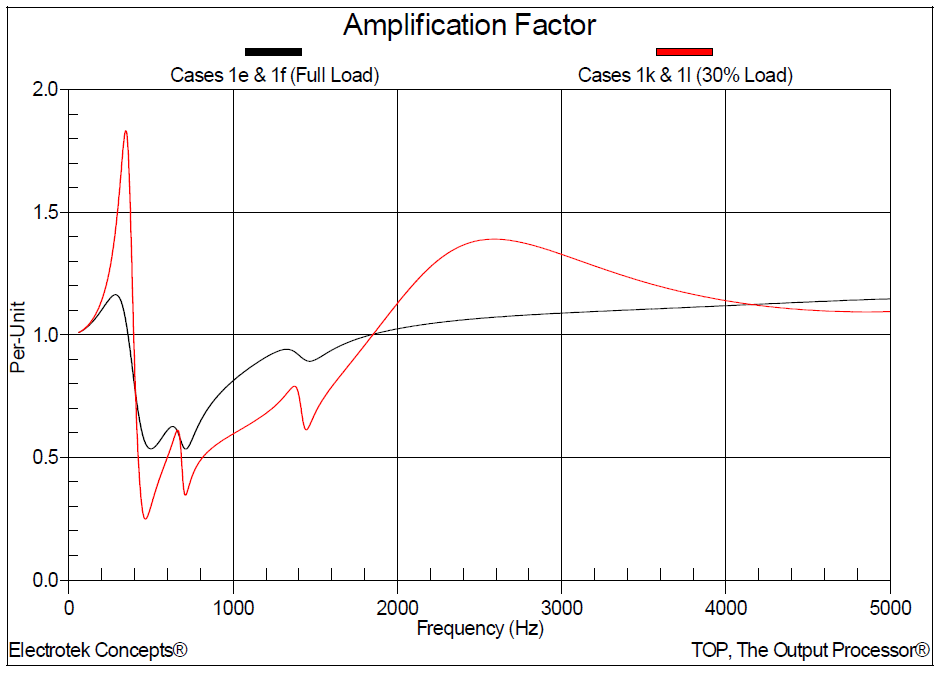
Figure 10 shows the amplification factors for scan location number 3 (substation bus).
SUMMARY
The simulation results show that the impedance vs. frequency response characteristics for the feeder are more severe for the low load condition due to the fact that there are lower levels of damping (resistive elements).
Additional observations include:
1. For scan location number 1, the simulated parallel (high impedance) resonant frequencies were approximately 360 Hz, 700 Hz, and 1420 Hz. The series (lower impedance) resonant frequencies were approximately 540 Hz, and 1,200 Hz. The amplification factor range was between 0 and 3.4.
2. For scan location number 2, the parallel resonant frequencies were approximately 360 Hz and 700 Hz. The series resonant frequency was approximately 500 Hz. The amplification factor range was between 0 and 4.2.
3. For scan location number 3, the parallel resonant frequencies were approximately 360 Hz, 660 Hz, and 1380 Hz. The series resonant frequencies were approximately 460 Hz, 700 Hz, and 1440 Hz. The amplification factor range was between 0 and 1.83.
REFERENCES
Power System Harmonics, IEEE Tutorial Course, 84 EH0221-2-PWR, 1984.
RELATED STANDARDS
IEEE Std. 519-1992, IEEE Std. 1036-1992
GLOSSARY AND ACRONYMS
ASD: Adjustable-Speed Drive
CF: Crest Factor
DPF: Displacement Power Factor
PF: Power Factor
PWM: Pulse Width Modulation
THD: Total Harmonic Distortion
TPF: True Power Factor
