Published by Si WENRONG, Jin HENG, Huang HUA, Fu CHENZHAO,
East China Electric Power Test & Research Institute Company Limited, Shanghai, China
Abstract. This paper introduces a new method for overvoltage measurements in 500kV power system using capacitor voltage transformer (CVT). It is realized with a voltage sensor installed within CVT as the low-voltage capacitor C3 connection in series with the high-voltage (HV) capacitor C1 and the median-voltage capacitor C2. Simulations studies and laboratory tests in manufactory (NISSIN ELECTRIC WUXI Co., Ltd.) have confirmed the validity and practicability of the technique.
Streszczenie. Opisano nowa metodę pomiaru przepięć w sieci 500 KV przy użyciu dzielnika kondensatorowego. Urządzenie sprawdzono w laboratorium. (Analiza nowej metody pomiaru przepięć z wykorzystaniem kondensatorów)
Keywords: capacitor voltage transformer (CVT); overvoltage measurement; low-voltage capacitor C3.
Słowa kluczowe: przepięcia, pomiar napięcia.
Introduction
The measurement of voltages in a.c. networks is a necessity which does not create undue difficulties in low- or medium-voltage systems. As the system voltage rises, however, the cost of any additional apparatus connected to it rapidly increases on account of the large amount of insulating material required. For this reason, the CVT is the main instrument transformer in the extra high voltage (EHV) systems due to their reduced size and cost compared to wound voltage transformers. Reference [1] described the design of a CVT with the analyze of the performance of a CVT with compensating reactor and intermediate voltage transformer.
But, as we all know, the conventional CVTs do not have a uniform (flat) frequency response, which makes them unsuitable for use in harmonic or overvoltage (transient disturbances) measurements. Other devices between EHV power systems and instrumentation, such as capacitor or resistance dividers are expensive options in terms of cost and space in substations, as they cannot be used for supplying relays and require regular calibration [2]. A method that has been mentioned in literature is the use of CVT transfer function to compensate for the CVT response at harmonic frequencies [3]. Reference [4] showed a test method that is used to determine CVT transfer function. And overvoltage measurement was suggested in literature [5] resorting the secondary protection terminals of CVT.
In this article, a new method is proposed that makes it possible to use the conventional CVTs in overvoltage measurements of EHV systems. The technique has the advantages of minimal cost and time involved in retrofitting to installed CVTs and implementing it in new units without changing CVT design parameters or procedure. According to the present stage of the project, this contribution deals mainly with two aspects: a) Laboratory experiments regarding the transmission of lightning and switching impulse voltages through a CVT within a low-voltage capacitor C3 (voltage sensor) installed; b) The development of a online measuring device based on CVTs in substation for the monitoring of HV transient overvoltages. As the part one, only aspect a) will be shown in this paper.
Description of overvoltage measurement using CVT
The basic diagram of a 500kV rated voltage CVT is given in Figure 1. It consists mainly in a capacitive voltage divider C1-C2 and a medium-to-low transformer T. An auxiliary terminal may be used for telecommunication between substations (shown in Figure 1(c)), with a high-frequency carrier in the range of tens of kHz, having as support one conductor of HV transmission line. In this case, the switch K is open and the earthing reactor L1 assures the 50 Hz grounding of capacitive voltage divider. Regarding to the secondary terminals 1a and 2a, the 50 Hz rated secondary voltage can be output. Besides those electrical components introduced, the P is protective gap, L is the medium voltage choke, and BL is a surge arrester.
Actually, some researchers once tried to use the secondary terminals 1a or 2a to record transient disturbances as mentioned above, the test result with lightning impulse voltage will be also shown in the section “Overvoltage tests in laboratory” in this paper.
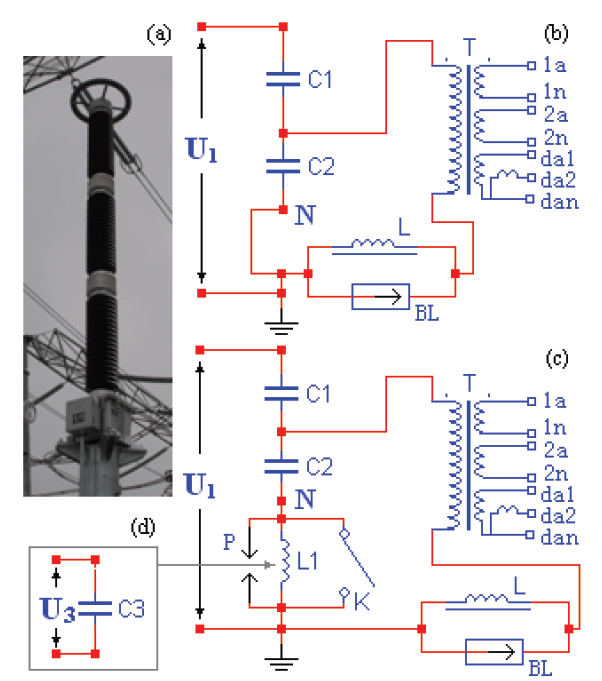
Fig.1. (a) Picture of a CVT with 500kV level widely used in East China Grid; (b) Circuit diagram for a conventional CVT; (c) Circuit diagram for a CVT with high-frequency carrier; (d) Using C3 instead of L1
To characterize, in a statistical approach, the share of HV events at the electromagnetic environment of an open-air substation, a long-term record of transient overvoltages may be useful. The main difficulty, to fulfil a suitable recording system, regarding the costs and locations, in a substation is that of HV impulse divider. The proposed solution is based on a modification of existing CVTs consisting in (shown in Figure 1(d)): a) the removal of the earthing reactor L1; b) the addition to CVT of a measuring capacitor C3 as the low-voltage arm of a capacitive voltage divider. This relatively cheap and simple solution doesn’t need an additional place in substation and doesn’t disturb the basic functions of CVT regarding the measuring and the protection. Design and installation of the capacitor C3 will be shown in following sections.
For the circuit diagram given in Figure 1(d) with C3 instead of L1, simulation tests with switching and lightning impulse voltages are shown in the Figure 2, which supports the modification in theoretically. In the simulation circuit, the rated capacitance value of CVT is 5.1 nF, while C3 is 20 µF.
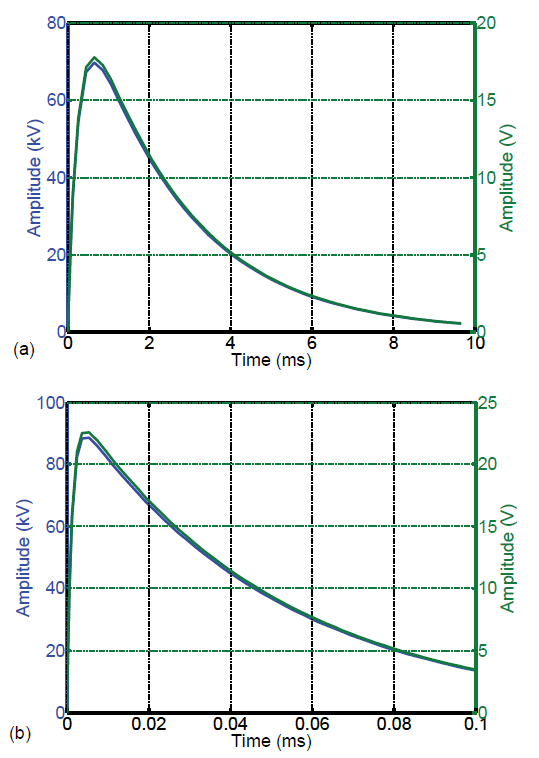
Fig.2. (a) Simulation result of a switching impulse voltage; (b) Simulation result of a lightning impulse voltage
Here, it should be pointed that the method with C3 instead of L1 was once used to harmonic voltage measurements in NISSIN ELECTRIC WUXI Co., Ltd. The C3 is shown in Figure 3 with a value of 20 µF. And it does not influence the output error of the secondary terminals.
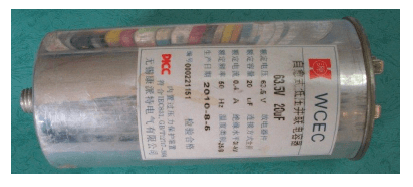
Fig.3. The C3 used to harmonic voltage measurements
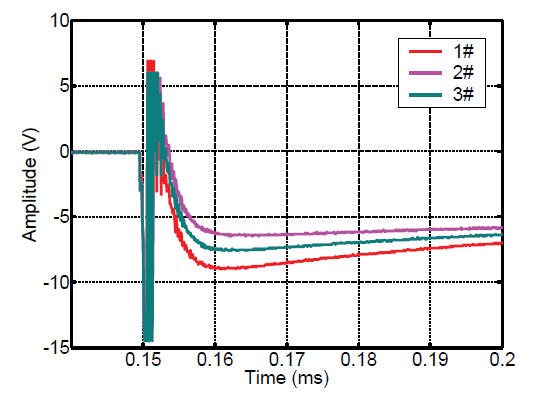
Fig.4. Lightning impulses tests on the C3 shown in Figure 3
Depending on this C3, the lightning impulse tests were done in our high voltage laboratory (harmonic voltage measurements are ignored in this paper). It shows a poor result that the peak values of overvoltages form the C3 are unstable including the waveshapes, which is shown in Figure 4. The reason to explain the results is that the C3 is a shunt power capacitor of self-healing type and its value is unstable under high frequency impulse voltage. Apparently, a non-inductive capacitor should be made as the C3 to measured impulse voltages with high frequency components.
Design and temperature coefficient of the C3
Figure 5 gives the geometry parameters of an element capacitance of the designed C3 and its inside configuration. The coaxial distribution of those capacitance elements make the C3 more non-inductive relatively.
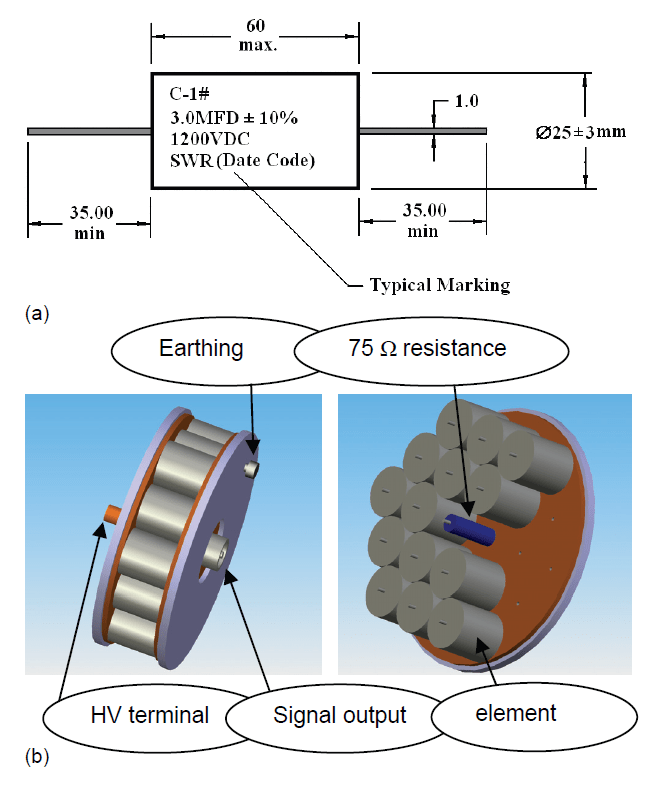
Fig.5. (a) Geometry parameters of an element capacitance of C3; (b) the C3 developed and its inside configuration
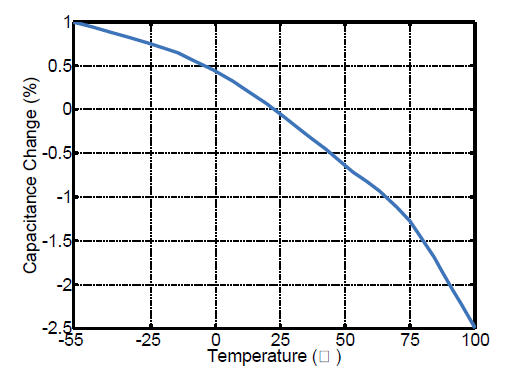
Fig.6. Temperature coefficient
The temperature coefficient shown in Figure 6 is the capacitance change of the C3 per ℃ over a specified temperature range. The performance is extremely good during the variation of -25 ℃ to 50 ℃, which fits well the environment temperature of an open-air substation.
Overvoltage tests in laboratory
Figure 7 shows the impulse voltage tests arrangement. In Figure 7(b), F is the standard HV impulse divider and S is the impulse voltage generator. Impulse waveshapes from the F, the capacitance C3 and the secondary terminal 1a are recorded synchronously by the oscilloscope of DPO7104 type (its analog bandwidth is 1 GHz, the maximum sample rate is 20 GSample/s). The impulse waveshape from F obtained at the same time as the signal source is used to verify the signals detected from the C3 and the secondary terminal 1a connected to a resistor equivalent to the rated load. In Figure 7(b), the voltage signal from F is set to be the trigger source.
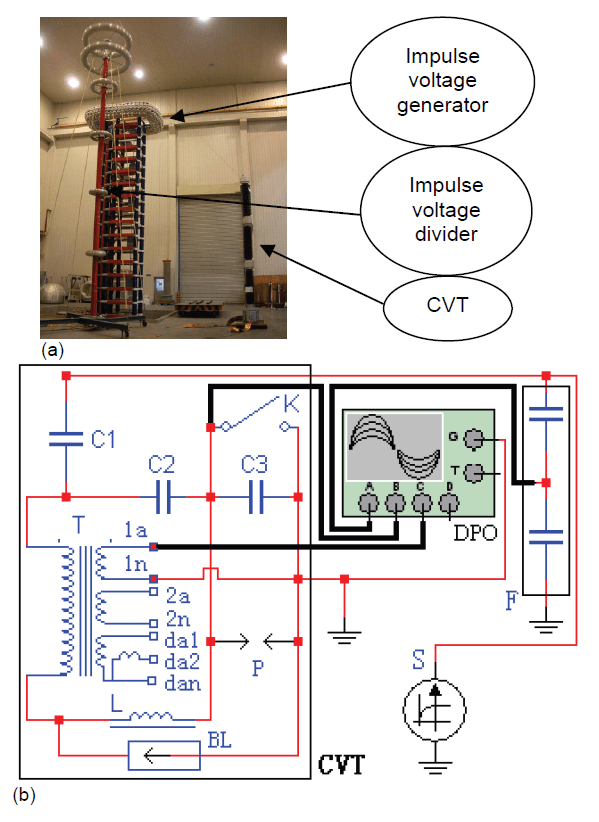
Fig.7. (a) Picture of impulse voltage test arrangement for CVT in laboratory; (b) Circuit diagram of impulse voltage test for CVT
The transmission of lightning impulse (fast front) transient overvoltages was investigated for applied impulse voltages with various rise times between 5 µs to 100 µs, peak values between 400 kV to 1600 kV, and the time to half-values between 50 µs to 250 µs. While the transmission of switching impulse (slow front) transient overvoltages was investigated for applied impulse voltages with various rise times between 250 µs to 1000 µs, peak values between 300 kV to 900 kV, and the time to half-values between 2500 µs to 5000 µs. Figure 8 and Figure 9 shows the typical test results of the applied and the measured voltage waveshapes under lightning impulse 5.5/65 µs and switching impulse 375/2800 µs, with sample rate of 100 MSample/s and 5 MSample/s respectively. The one with high amplitude is from the F and the one with low amplitude is from the C3 (see the Figure 7). In case of the lightning impulse, average deviations of the measured voltage against the applied voltage for 30 tests were:
– for the front time -6.29%
– for the half-value time -1.25%
In case of the switching impulse, average deviations of the measured voltage against the applied voltage for 30 tests were:
– for the front time -1.05%
– for the half-value time -2.38%
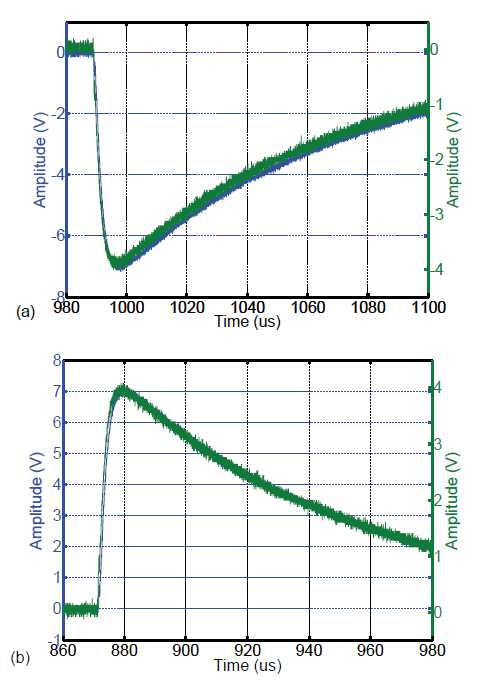
Fig.8. (a) One of test results under lightning impulse voltage of 1500 kV (negative polarity); (b) One of test results under lightning impulse voltage of 1500 kV (positive polarity)
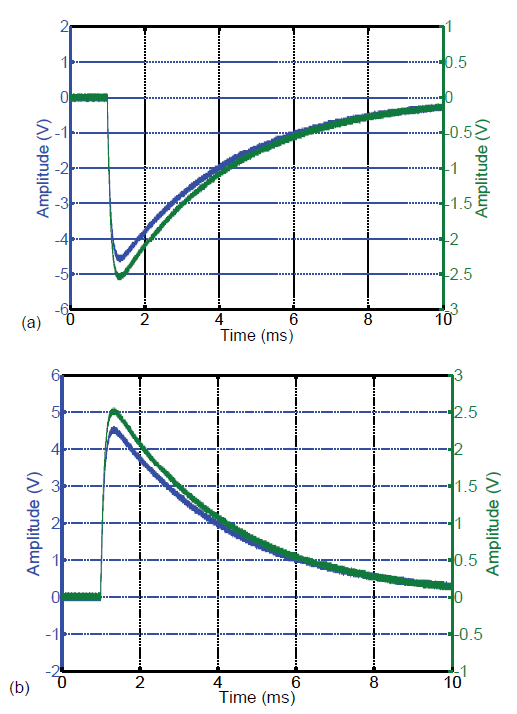
Fig.9. (a) One of test results under switching impulse voltage of 900 kV (negative polarity); (b) One of test results under switching impulse voltage of 900 kV (positive polarity)
The measuring device preserves the crest value ratio of 3600 with a small deviations under different test voltages shown in Figure 10. The result of switching impulse is better than the ones of lightning impulse for the transmission of slower front transient overvoltages.
Apparently, these registered deviations, regarding the time’s parameters are in acceptable tolerances for transient overvoltage measurements [6].
The transmission of fast front overvoltage form the secondary terminal 1a connected to a resistor equivalent to the rated load is illustrated in Figure 11 with main frequency component analyzed. The transmitted overvoltage has an entirely different waveshape from the applied voltage, characterized by a strong oscillation, with a main ground frequency about 0.8 MHz, followed by a very long tail in range of hundred of µs, but with meaningless small values.
The shape of transmitted voltage suggests a capacitive coupling of the high-frequencies during the whole applied overvoltage and the secondary terminals cannot be used to measure transient disturbances for the medium-to-low transformer T existing.
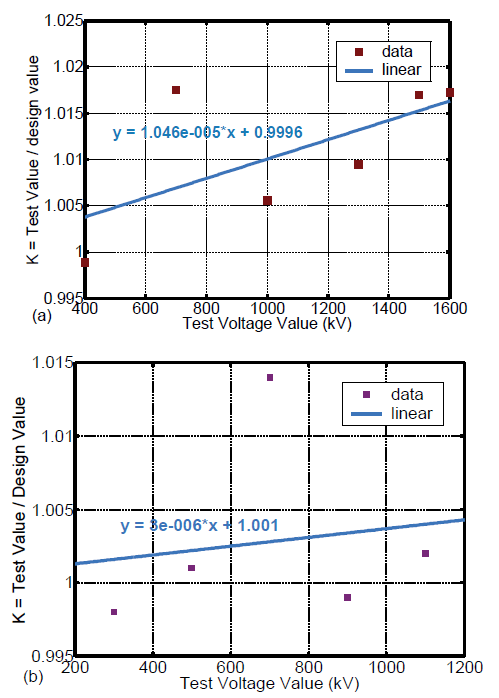
Fig.10. (a) The crest value ratio under lightning impulse tests; (b) The crest value ratio under switching impulse tests
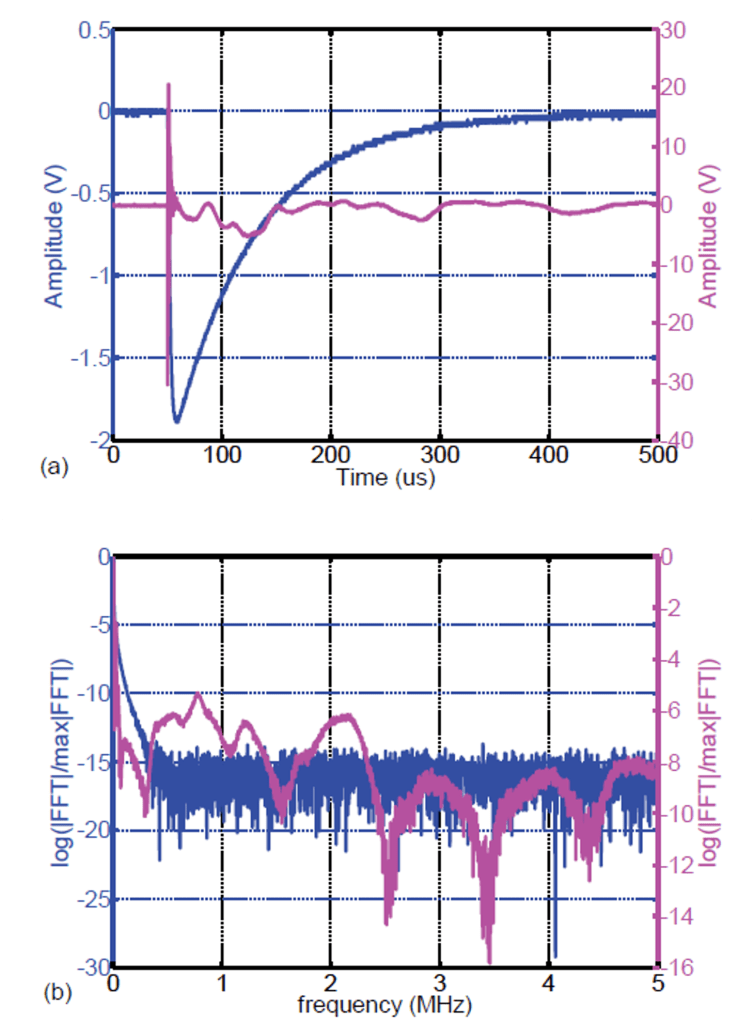
Fig.11. (a) One of test results from the secondary terminal 1a under lightning impulse tests; (b) Main frequency components analysis for two voltage waveshape in (a)
Conclusions
A new method is proposed that makes it possible to use the conventional CVTs in overvoltage measurement of EHV systems. It is realized with a voltage sensor installed within CVT as the low-voltage capacitor C3 connection in series with the high-voltage capacitor C1 and the median-voltage capacitor C2. Laboratory tests have confirmed the validity and practicability of this technique. All deviations of the impulse waveshape detected from the C3 including the time’s parameters compared with standard impulse divider are in acceptable tolerances for transient disturbances measurements.
Based on these works, the planned future works are: a) Completion of transient overvoltageas monitoring system based on existing CVTs within the designed C3 with an adequate acquisition system; b) Implementation the transient overvoltage monitoring system in a representative substation and starting a monitoring program.
REFERENCES
[1] Billig E., The design of a capacitor votlage transformer, The Proceedings of the Intuition of Electrical Engineers, 96 (1949), No. 54, 793-802
[2] Ghassemi F., Gale P., Cumming T., Coutts C., Harmonic voltage measurements using CVTs, IEEE Transactions on Power Delivery, 20 (2005), No. 1, 443-449
[3] Iravani M., Wang X., Polishchuk J., Sarshar A., A new method for the ccvt performance analysis using field measurements, signal processing and EMTP modeling, IEEE Transactions on Power Delivery, 9 (1994), No. 4, 1904-1917
[4] Ghassemi F., Gale P., Clegg B., Cumming T., Coutts C., Method to measure cvt transfer function, IEEE Transactions on Power Delivery, 17 (2002), No. 4, 915-920
[5] Guo Q., Chen P., Huang H., Study on the transfer overvoltage test of capacitor voltage transformer, Power Capacitor & Reactive Power Compensation, 30 (2009), No. 4, 25-28
[6] IEC Standard 60-2: High-voltage test techniques. Part 2: measuring sytems. 2nd edition, 1994.
Authors: Dr. Si Wenrong, East China Electric Power Test & Research Institude Company Limited, Shanghai, China, 200437, Email: siwenrong@gmail.com; Jin Heng, East China Electric Power Test & Research Institude Company Limited, Shanghai, China, 200437, E-mail: dsy_jinh@ec.sgcc.com.cn; Huang Hua, East China Electric Power Test & Research Institude Company Limited, Shanghai, China, 200437, E-mail: dsy_huangh@ec.sgcc.com.cn; Dr. Fu Chenzhao, East China Electric Power Test & Research Institude Company Limited, Shanghai, China, 200437, E-mail: dsy_fucz@ec.sgcc.com.cn.
Source & Publisher Item Identifier: PRZEGLĄD ELEKTROTECHNICZNY (Electrical Review), ISSN 0033-2097, R. 87 NR 9a/2011
